Abstract
In Vietnam, fishing is a crucial source of nutrition and employment, which not only affects the development of the domestic economy but is also closely related to exports, heavily influencing the economy and foreign exchange. However, the Vietnamese fishery sector has been facing many challenges in innovating production technology, improving product quality, and expanding markets. Hence, the fishery enterprises need to find solutions to increase labor productivity and enhance competitiveness while minimizing difficulties. This study implemented a performance evaluation from 2015 to 2018 of 17 fishery businesses, in decision making units (DMUs), in Vietnam by applying data envelopment analysis, namely the Malmquist model. The objective of the paper is to provide a general overview of the fishery sector in Vietnam through technical efficiency, technological progress, and the total factor productivity in the four-year period. The variables used in the model include total assets, equity, total liabilities, cost of sales, revenue, and profit. The results of the paper show that Investment Commerce Fisheries Corporation (DMU10) and Hoang Long Group (DMU8) exhibited the best performances. This paper offers a valuable reference to improve the business efficiency of Vietnamese fishery enterprises and could be a useful reference for related industries.
1. Introduction
The exploitation of fishery resources is one of the most critical components of the world economy. In fact, the aquaculture industry of the European Union (EU) reached a consumption of 1.4 million tons and a value of EUR 4.9 billion in 2016. This marked a significant recovery compared to 2013 (a year considered a recession from the fish economy’s perspective) in most major aquaculture countries. The EU is home to about 12,500 aquaculture businesses. The number of full-time jobs has risen significantly: from 36,000 in 2013 to almost 44,000 in 2016. This indicates that aquaculture companies are providing more secure employment. Additionally, there are significant regional differences in terms of average salaries. In 2016, the total annual wage amounted to EUR 25,000 a year, an annual increase of 3.5% since 2014. In the marine market, the United Kingdom is the largest salmon producer (91%), and Greece is the leading producer of salmon and seabass (47% of total value). France produces 86% of oysters in the shellfish industry, and Spain leads in mussels, accounting for 45% of production. Italy is the largest clam manufacturer (80%). Salmon is by far the most frequently raised species in freshwater [1].
Fisheries play an important role in providing food for humanity. Seafood has a high nutritional value which is essential for human development. In addition, fisheries are also a job-creating economic industry for many communities, especially in rural and coastal areas. However, the fishery sector has also faced major categories of hazards that threaten fish health and thus the fish economy. For instance, fresh rainbow trout fillets are a very perishable food product. Therefore, they cannot be stored at cold temperatures for long periods. High-Pressure Processing (HPP) can improve fillet quality through microbial load control. Therefore, evaluating the denaturation of protein in rainbow trout fillets treated with various high-pressure levels was performed [2]. Additionally, European regulations on veterinary sanitation and food safety are implemented in a variety of ways, depending on different factors, of which chemical and microbiological hazards are predominant. All regulations have focused on the protection of agricultural products, food safety, and consumer rights. This is also a big challenge for the fishery sector [3].
Located on the west coast of the South China Sea, Vietnam is a part of the Pacific Ocean with an area of approximately 3,448,000 km2 for and a coastline of 3260 km. The internal waters and territorial waters are 226,000 km2, the exclusive economic zone (EEZ) is over one million square kilometers, and there are more than 4000 islands, forming 12 bays and lagoons with a total area of 1160 km2. The Vietnam sea has high biodiversity which has approximately 11,000 species of discovered organisms [4]. In Vietnam, the fishing and aquaculture profession provides regular jobs for about 1.1 million people, accounting for about 2.9% of the workforce. Fisheries have also made remarkable contributions to the start-up and overall economic growth of developing countries [5]. According to a report of the directorate of fisheries: the value of fishery production in 2018 was about VND 228,139.8 billion, up 7.7% compared to 2017; the total output reached about 7.74 million tons, up 7.2%; the exploited output reached 3.59 million tons, increase of 6.0%; farming reached 4.15 million tons, up 8.3% [4]. Moreover, fisheries are a strong export sector in Vietnam, with exports valued at USD 8.6 billion in 2019 [6]. The annual export of seafood products has brought a large amount of foreign currency to the state budget, which is very important in the construction and development of the country. The products that are exported contribute to improving the status of Vietnam in general and Vietnam’s fishery industry on the international market. The seafood processing industry has developed into a spearhead economic sector, a large commodity production industry, taking the lead in international economic integration. With the rapid and effective growth, fisheries have contributed positively to the transformation of agricultural and rural economic structures, contributing effectively to hunger eradication and poverty alleviation, creating jobs for more than four million workers, and improving the living standards of people in rural, coastal, delta, midland and mountainous areas [7,8,9,10]. This highlights the immense roles and advantages of Vietnam in terms of natural and human conditions. The development of aquaculture and aquatic product processing for domestic consumption and export values is one of the main priorities of the Vietnamese economy.
In Vietnam, fishing is a crucial source of nutrition and employment, which not only affects the development of the domestic economy, but is also closely related to exports, heavily influencing the economy and foreign exchange. The scale of the fishery sector is expanding, which significantly promotes the national economy. The fishery is a strong export sector of Vietnam. The annual export of aquatic products has brought a large amount of foreign currency to the state budget, which is very important in the construction and development of the country. The products are exported to many countries in the region and the world, contributing to improving the position of Vietnam in general and Vietnam’s fishery industry in particular on the international market. For example, in 2018, the total value of fishery production was about VND 228,139 billion, and the export turnover set a record of USD 9 billion [4]. However, the Vietnamese fishery sector has been facing many challenges in innovating production technology, improving product quality, and expanding markets. Referring to sustainability development, the paper applies data envelopment analysis (DEA), i.e., the Malmquist model, to analyze the productivity and operational efficiency of the top fishery enterprises in Vietnam that are defined as decision making units (DMUs) based on data of a four-year period (2015–2018) [11,12]. The application of the DEA Malmquist model in this research is used to calculate the technical efficiency (catch-up index), as well as the technological change (frontier-shift index) of the fishery enterprises, thereby reflecting their trend of technology development. In the proposed model, input factors are total assets, equity, total liabilities, and cost of sales while revenue and net profit are selected as output factors. The objective of the paper is to assess the performances of the 17 largest Vietnamese enterprises specializing in aquaculture and fishery production in the period of 2015–2018 and provide a general overview of the fishery sector in Vietnam through technical efficiency, technological progress, and the total factor productivity in the four-year period. In addition, this paper points out the opportunities and challenges for enterprises in improving fisheries’ production value. The discussions of the paper propose strategic solutions to enhance the competitiveness of fishery enterprises in the domestic and international markets relying on this study’s results.
This paper is structured as follows. The Section 2 discusses the recent literature related to this study. The Section 3 and Section 4 describe the proposed approach for analyzing the performances of 17 fishery enterprises in Vietnam. In the Section 5, the presentation and interpretation of the DEA Malmquist model for data is expounded. The final sections contain concluding statements.
2. Literature Review
DEA is an approach to measure the relative efficiency of a set of DMUs with multiple inputs and outputs which uses mathematical programming. The first DEA model was proposed by Charnes et al. [13]. Since then, several DEA models have been developed and widely applied in many fields. For example, the study of Zhu [14] inspected 204 Icelandic companies using DEA and found that a considerable number of Icelandic companies were classified as inefficient companies during the production process. Drake and Hall [15] also employed DEA to analyze the technical and scale efficiency in Japanese banking. Findings expounded that controlling for the exogenous impact of problem loans was the most significant factor, especially for the smaller regional banks. Wang et al. [16] applied DEA to assess the renewable energy production capabilities in 42 countries. Bayyurt and Duzu [17] used weighted DEA to assess Turkish and Chinese manufacturing companies’ relative performances. Results show that Turkish manufacturing companies have a lower average efficiency than Chinese manufacturers. In the study of Liu et al. [18], the DEA method was used to evaluate the power generation efficiency of Taiwan’s major thermal power plants during 2004–2006. It was found that all the power plants studied achieved acceptable overall operating efficiencies; this research is very helpful for improving some power plants in Taiwan. Halkos and Tzeremes [19] also applied DEA to assess the financial performances of operating companies in the Greek renewable energy industry, and the results show that companies that produce wind energy perform better than companies that produce hydropower. DEA has also been applied in an environmental performance assessment in the study of Chen and Jia [20]; the results showed a low efficiency in the environment between the regions in China. From the previous studies mentioned above, it can be concluded that productivity evaluation is an important research topic using DEA approaches.
The Malmquist model is a very useful approach for productivity measurement in DEA [21]. According to the research of Färe [22], the Malmquist model has two components, one of which measures efficiency changes and the other measures technological changes. There have been many applications using DEA Malmquist models, such as Worthington [23], who employed the Malmquist model to research the nature and range of performances in deposit-receipts establishments in Australia and found that most credit unions have better technical effectiveness than scale effectiveness. Additionally, Asmild et al. [24] also used the Malmquist model to evaluate the banking industry’s performance in Canada. Chang et al. [25] assessed the sustainability of corporations in sixteen industries in China using the Malmquist model and found that seven industries improved their sustainability performances and the natural resources sector was more performative than the others. Wang [26] used the Malmquist model to measure the performances of 40 major cities around the world during 2012–2018 and found that one-quarter of the cities can achieve perfect efficiency in transforming resources into outputs factors.
Recently, a general DEA method and the Malmquist model, in particular, have become the methods of choice for assessing the efficiency of fisheries. Using the technical and technological effectiveness to measure the extent to which a business transforms inputs into outputs, fishery managers can be provided with important information about the economic status of vessels and how regulations may affect the profitability of ships. Table 1 summarizes the method approaches to assess the performance of the fishery industry over the past few decades. In terms of methodologies, DEA was used for performance assessment, the Charnes–Cooper–Rhodes (CCR) model was used to calculate the overall efficiency score, the Banker–Charnes–Cooper (BBC) model was used to identify the scale of technical efficiency, while slack-based measures (SBMs) can not only obtain the efficiency ranking, but also determine the slack problems of DMUs; these were applied in [27,28,29,30,31,32,33,34,35,36,37,38,39]. The DEA Window model is extended by the original DEA model that detects the trend of DMUs over a long period with numerous input and output factors, which is an advantage when handling small sample sizes, as discussed in [28,38]. Additionally, the DEA Malmquist model has been used to measure the change in total factor productivity, which consists of technical efficiency change and technological change effect, as can be seen in [40,41,42,43,44,45,46,47,48,49,50,51]. Efficiency valuation with noise in data under uncertain conditions was also solved using stochastic production frontier (SPF), as proposed in [27,43,46]. Some other methods are widely applied to measure the performance of the fishery sector, including the Tobit regression [27,35,36,39] and multicriteria decision models such as the analytical hierarchy process (AHP), the technique for order of preference by similarity to ideal solution (TOPSIS), the complex proportional assessment (COPRAS), and the combinative distance-based assessment (CODAS) and/or under fuzzy environment [31,34,52,53].

Table 1.
List of method approach for relevant previous studies.
The relevant previous studies above are a few of the many studies using the DEA Malmquist model to assess the performance in the field of fisheries. Using the technical and technological effectiveness to measure the extent to which a business transforms inputs into outputs, fishery managers can be provided with important information about the economic status of vessels and how regulations may affect the profitability of ships. The Malmquist model has been applied and made certain practical contributions to the of fishery sector. It is a good research ground for the author to carry out this study applying the DEA Malmquist model to evaluate the performances of Vietnamese fishery producers. This paper is conducted based on data from the fishing industry including 17 large fishery enterprises in Vietnam. The purpose of the paper is to evaluate the operating performance of the business during the 2015–2018 period. The used data in this study were collected from the financial reports of the enterprises on the official website.
3. Materials and Methods
3.1. Research Flow
In this chapter, the author utilizes the DEA Malmquist productivity index to evaluate Vietnamese fishery companies in the period of 2015–2018. The research flow is shown in Figure 1 as follows.
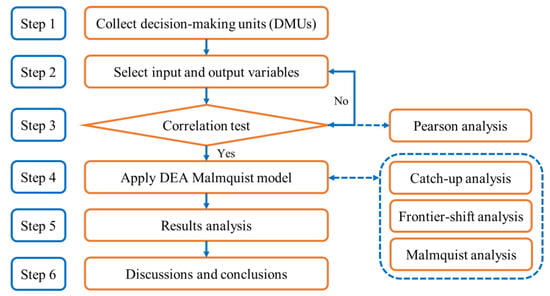
Figure 1.
Research flow.
Step 1: Collect DMUs. Vietnam has strengths in aquaculture development. Hence, how can the fishery sector develop comprehensively in both quantity and quality? This is the big challenge for the government and fishery enterprises. After searching the fishery sector in Vietnam, the 17 largest companies specializing in aquaculture and fisheries that are appropriate for this study were used.
Step 2: Select input and output variables. In applying DEA, this step is very important because the correlation between variables contributes to the accurate reflection of the results.
Step 3: Correlation test. The author uses the Pearson correlation method to assess if the correlation coefficients between input and output factors are all positive correlations; it proves that the selection of these variables is correct. It also means that collected data can be used for the analysis of the DEA calculation.
Step 4: Apply DEA Malmquist model. The DEA method has a lot of models that conduct the different functions. In this research, the author selects the Malmquist productivity index as the main model to assess changes in efficiency and performance over the time of the Vietnamese fishery enterprises (DMU).
Step 5: Results analysis. The Malmquist model will be used to evaluate the total factor productivity change of the company between periods. It is defined as the product of efficiency change (catch-up) and technological change (frontier-shift). Along with catch-up term, the shift effect must also be taken into account to assess the change in efficiency of the DMU, since the catch-up is determined by the efficiencies as measured by the distances from the respective frontiers. After applying the Malmquist productivity index, the researcher presents the results, analyzes the data over the period, and summarizes the results.
Step 6: Discussions and conclusion. The author restates and summarizes the research results, then highlights some notable contributions.
3.2. Pearson’s Correlation Coefficients
Before using this DEA model, we must ensure that the input and output variables have isotopic relationships. This means that if the input volume increases, the output volume will not decrease under the same conditions. Therefore, we first use the Pearson correlation test to ensure this prerequisite and measure the strength of the relationship between two variables. A higher correlation coefficient refers to a closer relationship between two variables, and a low correlation coefficient means a low relationship [54], as can be illustrated in Figure 2. The correlation coefficient is always between −1 and +1 which is presented in the equation below.
where n is the size of the sample; , denote the individual sample points related to .
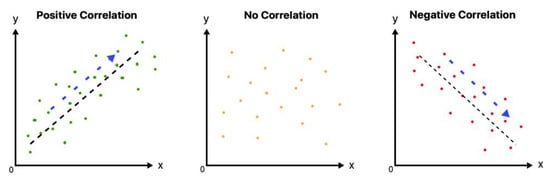
Figure 2.
Linear correlation diagrams.
3.3. DEA Malmquist Model
According to Wang et al. [55], the Malmquist index (MI), or the so-called Malmquist productivity index (MPI), evaluates the performance of a company in two fixed periods. The “catch–up” (CA) term is related to the degree of efforts that the DMU attained for improving its efficiency, while the “frontier–shift” (FR) term reflects the change in the efficient frontiers surrounding the DMU between the two time periods 1 and 2.
The authors determined that the DMUi at period 1 is and at period 2 is . The efficiency score of the DMUi was measured by the technological frontier : ( and ).
To compute for the catch-up index (CA), frontier-shift index (FR), and Malmquist index (MI), the following formulas can be applied:
The catch-up index (CA) in the Malmquist productivity index which belongs to DEA method was used to assess the changes in the technical field of Vietnamese fishery companies in the 2015–2018 period. It also reflects the DMU’s efforts to make it more efficient. When the index is found to be less than 1, the index has deteriorated or worsened, and a value of more than 1 shows the related improvement or progress. The Malmquist index is based on this following performance assumptions.
For the evaluation of the technological or efficiency frontier of 17 DMUs between the two periods, the frontier-shift index (FR) was used. The use of high technology in manufacturing improves labor productivity and directly Improves the competitiveness of companies in the same field. Many fishery companies in Vietnam have produced high-quality products thanks to the modernization of new science and technology. On the other hand, several companies still exhibited very low performances, limiting their use in technological applications.
The Malmquist index (MI) is a multiplication of the catch-up index and frontier-shift. Hence, in order to develop and dominate the domestic market, strong investment in technical and technological improvements are the prerequisite that Vietnam fishery enterprises need to focus on.
4. A Case Study
4.1. Decision-Making Units (DMUs) Selection
An index of relative technical efficiency change is a component of efficiency change. It shows how far a company, made up of “best practice” companies, approaches the frontier. It is larger than, equal to, or less than unity depending on the improvement, stagnation, or decline of the evaluated firm. The component of the technical change measures how much the frontier shifts, while indicating whether the best practice compared to the evaluated firm improves, stagnates, or worsens. In each instance, the index is higher than, equal to, or less than unity, representing positive, zero, or negative technical changes, respectively [56].
For efficiency assessments, DEA is the most common method. This is a method of mathematical programming to measure the relative efficiency of DMUs with multiple inputs and outputs [57]. The selection of homogeneous DMUs with appropriate information is therefore an essential step in the evaluation of DMUs. After finding and researching the fishery sector in Vietnam, the author chose the top 17 largest fishery companies and collected and analyzed data for the period of four years (2015–2018) [58]. The list of all companies is shown in Table 2.
Table 2.
List of fishery enterprises.
4.2. Inputs and Outputs Selection
Table 3 presented some relevant studies in recent decades about performance evaluation aspects of aquaculture and fishery production. Based on the literature, financial indicators are considered input variables that the company needs to balance or decrease, while output variables are indicators that the company needs to improve or increase. After thorough study, the authors decided to select four inputs and two outputs, which contributes to the evaluation of the potential development of the fishery enterprises, described as follows.
Table 3.
List of input and output variables used in related previous studies.
Input variables:
- Total assets (TOAs): the total number of assets owned by a fishery company.
- Equity (EQU): the remaining amount of assets available to shareholders after all liabilities have been paid, equal assets subtract liabilities.
- Total liabilities (TOLs): the aggregate debt and financial obligations owned by fishery enterprises at any specific period.
- Cost of sales (COS): the accumulated total of all the costs used to create a product or service, which has been sold.
- Output variables:
- Revenue (REV): the total amount of money that will be earned by consuming products, providing services, financial activities, and other activities of the enterprises.
- Profit (PRO): profits earned by the company after deducting costs related to fishing and selling fish.
4.3. Data Collection
In this paper, the data used in this study were collected from the financial reports of the enterprises on the official website [58] in the period of 2015–2018. The statistical data of the inputs and outputs for 17 Vietnam fishery companies in the period of 2015–2018 are presented in Table 4.
Table 4.
The statistical data of input and output variables (unit: million USD).
It is worth noting that DMU4 in 2018 has a negative value in terms of profit (−1284 million USD). As homogeneity is the basic DEA data assumption. Hence, the negative values need to be adjusted to positive values. After adjustment, the profit of DMU4 in 2018 is increased by 1285 units. Changes in values at the same time will not affect the calculation results of the DEA.
5. Results Analysis
5.1. Correlation Coefficients
The results of the Pearson coefficient correlation in the above table (Table 5) indicate that the correlation among input and output variables in this study is positive and significant at the 0.01 level. It means that the used data comply with isotropic conditions and can be used for DEA calculations. Hence, the choice of these input and output variables is suitable to analyze and evaluate the performances of Vietnamese fishery companies.
Table 5.
Correlation coefficient (2015–2018).
5.2. DEA Malmquist Results
In this study, the Malmquist productivity index (MPI) was used to evaluate the performances of 17 DMUs. The MPI assesses the total factor productivity change of the DMU between the two periods. It is defined as the product of efficiency change (catch-up index) and technology change (frontier-shift index). For any organization in the industry, productivity increases over time (i.e., more output for the same or lower level of inputs) and they may increase in technical efficiency (i.e., catch-up with their frontiers) or technological progress (i.e., the frontier is rising over time) or both. The following tables (Table 6, Table 7 and Table 8) detail the efficiency changes, technological changes, and MPI values.
Table 6.
Catch-up index (efficiency change).
Table 7.
Frontier-shift index (technological change).
Table 8.
Malmquist index (total productivity change).
5.2.1. Catch-Up Index (CA)
As is shown in Table 6, the average catch-up index = 1.07411 (average CA > 1), reflecting that the majority of DMUs (11 DMUs which include DMU1, 2, 3, 4, 5, 7, 8, 10, 11, 13, 16) achieved technical efficiency. Figure 3 also shows the technical efficiency of 17 DMUs in the 2015–2018 period. Almost all DMUs had enhanced technical efficiencies, except for DMU6, 9, 12, 14, 15, and 17. In general, in the 2015–2018 period, there was a fluctuation in the technical efficiency of all DMUs. DMU8 (Hoang Long Group) exhibited the best efficiency performance with CA = 1.49131, while DMU14 (Bac Lieu Fisheries Joint Stock Company) had the worst efficiency performance with CA = 0.77901.
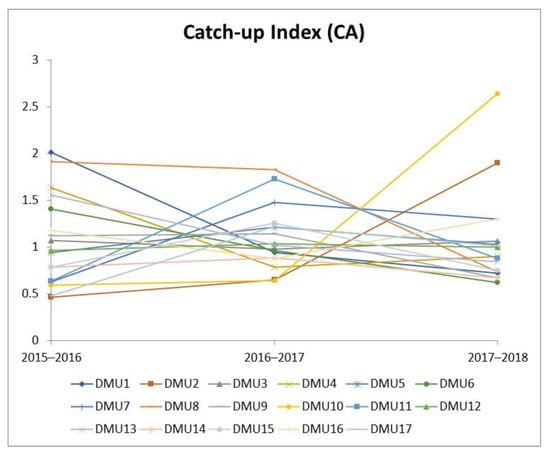
Figure 3.
Technical efficiency change (Source: calculated by the researcher).
Specifically, in the 2015–2016 period, eight of the 17 DMUs achieved technical efficiency (average CA > 1). DMU1 (Mekong Fisheries Joint Stock Company) achieved the best value (CA = 2.00923). On the other hand, DMU17 (Hung Hau Agricultural Corporation) had the lowest technical efficiency (CA = 0.47763).
The increase in technological efficiency of enterprises during 2016–2017 was important in comparison to the 2015–2016 period. Of the 17 DMUs, nine were technically efficient (average CA > 1). The most popular DMU, DMU8 (Hoang Long Group), achieve a CA of 1.82901. In addition, several other companies achieved high technological efficiencies in this period, such as DMU7, 11, 15, 17. Meanwhile, DMU10 (Investment Commerce Fisheries Corporation) had the worst efficiency performance.
In the 2017–2018 period, 7 of the 17 DMUs achieved technical efficiency (average CA > 1). In particular, the remarkable improvement of DMU10 (Investment Commerce Fisheries Corporation) must be included when the previous periods were always among the group with the lowest CA index. DMU10 reached the best performance in this period (CA = 2.64071). In contrast, some companies showed no progress in terms of improving technical efficiency, such as DMU2, 3, 4, 6, 10. DMU6 (Camimex Group JSC) exhibited the worst efficiency performance (CA = 0.61960). Consequently, companies that have experienced low performances also have to pay attention to the technological side to increase their market competitiveness.
5.2.2. Frontier-Shift Index (FR)
Table 7 shows that the technological efficiency of fishery enterprises tended to decrease in the 2016–2017 period and increased in the 2017–2018 period. It is estimated that almost DMUs enhance their technology and overall increase their technical efficiencies.
In the 2015–2016 period, most of the DMUs achieved technological efficiency (average FR > 1) except for the other seven DMUs (DMU3, 6, 9, 12, 13, 14, and 16). DMU17 exhibited the best efficiency performance (FR = 1.78698) while DMU16 exhibited the worst efficiency performance (FR = 0.90836). This demonstrates that this DMU was not applied well to the high tech in this period.
Figure 4 indicates that most fishery companies could not maintain their effectiveness in the next period (2016–2017). Comparing with the 2015–2016 period, the technological efficiency decreased considerably in the 2016–2017 period. Having 11 DMUs did not lead to a good performance in terms of technology, and DMU8 had the worst efficiency performance (FR = 0.75311). This illustrates the above statement which mentions that the technological efficiency of manufacturers seriously reduced during this period. DMU12 exhibited the best performance, with an FR of only 1.08192.
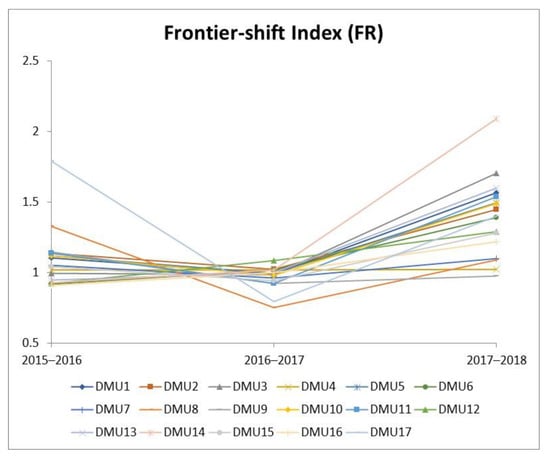
Figure 4.
Technological efficiency frontiers.
However, after a period of poor technology performance, the enterprises focused on investing technology in production to improve their effectiveness in the 2017–2018 period. As a result, the average frontier index is greater than 1 (FR = 1.15014) which reveals that the Vietnamese fishery companies successfully applied the advanced technology into their production processes. It is essential to mention DMU14 (Bac Lieu Fisheries Joint Stock Company with FR = 2.08939) which achieved tremendous growth compared to other DMUs, and that shows the strong development in the application of high tech to this enterprise. There is only DMU9 (Hung Vuong Joint Stock Corporation) that could not achieve technological efficiency (average FR < 1) during this time, and this company needs to improve its technology in future.
5.2.3. Malmquist Index (MI)
As shown in Table 8, the average Malmquist index of DMUs is greater than 1 (MI = 1.22105), which indicates an increase in total factor productivity growth of the 2015–2018 period.
During the 2015–2016 period, the overall total factor productivity gap between DMUs can be seen. Particularly, several DMUs exhibited very highly efficient performances such as DMU8 (Hoang Long Group with MI = 2.53928) and DMU1 (Mekong Fisheries Joint Stock Company with MI = 2.21195), while some others are in the opposite position such as DMU2, 7, 10, 11. DMU2 (Ben Tre Aqua-product Import and Export JSC) exhibited the worst performance with MI = 0.52538. The results show that technical and technological investments between fishing firms are unstable during this time.
According to Table 8 and Figure 5, there are two distinct trends about the Malmquist index in the period of 2016–2017, and half of the DMUs have a significant decline compared to the previous phase such as DMU1, 4, 6, 8. Especially, DMU1 (Mekong Fisheries Joint Stock Company) reached a very high Malmquist index in the previous phase (MI = 2.21195), but went down to 0.92716 in this period. This reveals that many fishery companies did not strive to maximize technical and technological efficiency, resulting in decreasing performances. Nevertheless, this period witnessed a remarkable improvement of some manufacturers such as DMU7 (MI = 1.41786) and DMU11 (MI = 1.59522).
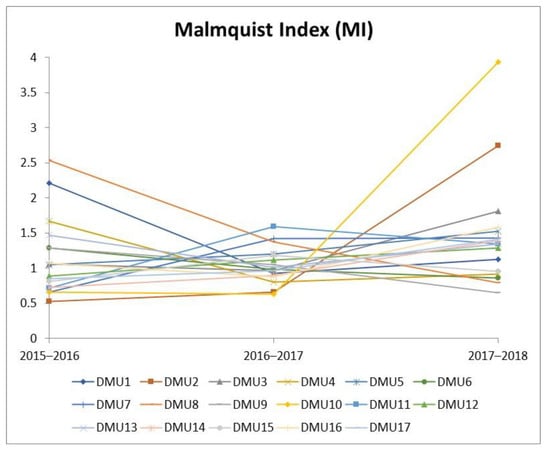
Figure 5.
Total factor productivity change.
Experiencing a fluctuant period and a decline in total productivity, for the 2017–2018 period, the majority of companies exhibited good performances in terms of total factor productivity—namely, 12 out of 17 DMUs have Malmquist index greater than 1. Especially, it is important to mention DMU10 (Investment Commerce Fisheries Corporation), which exhibit a record performance over the periods with MI = 3.93644. In contrast, only five enterprises did not exhibit good productivity performances, and the lowest one is DMU9 (Hung Vuong Joint Stock Corporation) with MI = 0.65289.
6. Discussions
This section presents the discussion on the results of this paper. By applying the DEA Malmquist model to assess the top 17 Vietnamese fishery companies, this study reflected the efficiency of technical, technological, and total factor productivity of Vietnamese fishery enterprises for the considered period. In the 2015–2018 period, the technical efficiency of DMUs was quite low in terms of performance with eight out of the 17 companies showing progress. Hoang Long Group (DMU8) is the most stable and most technically efficient firm in the 2015–2018 period. The firm that needs to improve the most in terms of technical efficiency is Bac Lieu Fisheries Joint Stock Company (DMU14). In terms of technological efficiency, all the DMUs improved, which shows that all companies have successfully applied new technology in their manufacturing. Especially, Bac Lieu Fisheries Joint Stock (DMU14) company improved the most, while An Giang Fisheries Import Export JSC (DMU4) had the worst efficiency performance. There is a fluctuation in operational efficiency, due to the balancing act between technological efficiency and technical efficiency, in the 2015–2016 and 2016–2017 periods. However, in general, most companies progressed and achieved good total productivity efficiencies. Investment Commerce Fisheries Corporation (DMU10) and Hoang Long Group (DMU8) exhibited the best performances.
Figure 6 shows the average ranking of the Malmquist index of DMUs from 2015 to 2018. In general, most of DMUs exhibited efficient performances (MI > 1). DMU10 (Investment Commerce Fisheries Corporation) exhibited the best performance with MI = 1.74095. On the other hand, there are only two (DMU9 (Hung Vuong Joint Stock Corporation) and DMU15 (Kien Hung JSC)) which did not exhibit efficient performances in four years (MI = 0.99511 and 0.98423, respectively). Hence, these businesses must take significant investment into consideration for boosting their performance, in technical aspects particularly.
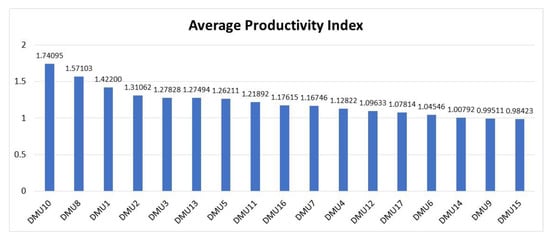
Figure 6.
Average Malmquist index of decision-making units (DMUs) in 2015–2018 period.
In recent years, the shortages of raw materials and capital, along with the increase in input costs, have been obstacles for the fishery enterprises in this tough time [60,61]. In addition, the strong outbreak of COVID-19 and complicated global developments decreased the consumption of seafood. There was a change in consumption trends and a drop in orders from 35% to 50%. Additionally, social distancing causes domestic production and international trade to stagnate. This meant that enterprises lacked raw materials for processing. Transportation and payment have many difficulties, leading to a lack of capital to maintain and restore operations. The COVID-19 pandemic is still happening complicatedly in the world and continues to affect Vietnam’s seafood exports. However, it was forecasted that seafood exports will gradually recover in the third and fourth quarters of 2020, and the export turnover of the whole year may reach USD 8.26 billion to USD 8.3 billion, down 3.8% compared to 2019 [62,63,64].
According to the financial report in Vietnam, for the nine months prior to 30 September 2020, Investment Commerce Fisheries Corporation (DMU10) revenues decreased 12%, and this company predicts a lower profit for the following years [65]. Due to the decline in export turnover of half over the same time span last year, Mekong Fisheries Joint Stock Company (DMU1) lost almost VND 600 million in the second half of 2020. Moreover, the World Development & Investment Company (DMU11) has seen profits fall by 61% to VND 26 billion during the same period. The company said that the COVID-19 pandemic affected the production and export of frozen Tra fish fillets by interrupting the demand and dragging down export prices [66]. In the fight against the COVID-19 pandemic, the Fishery Improvement Project (FIP) organization and the Government of Viet Nam implemented a traceability system and applied new regulatory and/or legal requirements for onboard monitoring of tuna fishing vessels toward the sustainable future of Viet Nam’s fisheries after COVID-19 [67].
This paper provides the managerial implications to the fishery industry from measuring operational performances with other competitors, especially in the fight against the COVID-19 pandemic, which has had a dramatic influence on the fishery industry. Following this, the empirical results of this paper give comprehensive and practical contributions to the top 17 largest Vietnamese fishery companies’ performances in recent years. We expect that the model’s results will reflect the current productivity of the fishery industry in Vietnam in terms of technical change (catch-up index) and technological effect (frontier-shift index). Within this context, the insights of this paper could help policymakers and strategy makers improve operational efficiency and find out key performance indicators to enhance their core competencies toward sustainable development. For example, Figure 7 shows the comparison of the average technical, technological, and total productivity index of 17 fishery enterprises in Vietnam. Almost DMUs progressed in technological development (red line) during the studied period. On the other side, total factor productivity (orange line) fluctuated due to the significant differences between the average technical efficiency change (blue line). From this result, change in technical efficiency is the determinant for productivity growth. Although concentrating on technological advancement is essential to success, these businesses should make an extra effort in optimizing resources such as labor, materials, equipment supplies, and capital, to mention a few.
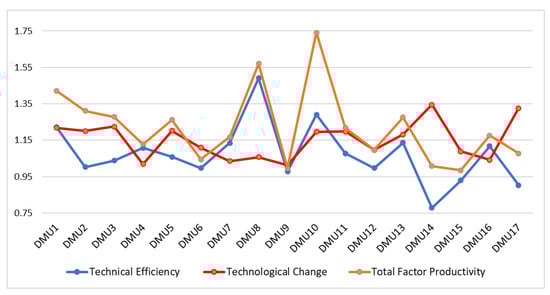
Figure 7.
Comparison of average technical, technological, and total productivity index.
7. Conclusions
Changes in food consumption and difficulties in reaching consumers are significantly impacting demand and prices of fishery industry in the pandemic crisis. This study outlines Vietnam’s fishery market by assessing the performance of 17 Vietnamese fishery companies from 2015 to 2018 using DEA Malmquist model. In the paper, input variables include total assets, equity, total liabilities, and cost of sales, while output variables are revenue and profit. The purpose of the paper is to measure the changes in total productivity with technical index and technological effect of the fishery industry. The finding of the paper shows that most fishery companies achieved progress in total performance efficiency.
Considering the findings of this study, enterprises could tailor production and business development policies whereby managers and policymakers could find out solutions to maintain a stable source of raw materials, ensure the quality for the enterprise, and be able to change the business situation. In light of this, the managers could stabilize the resource of goods, secure production stability, and reduce costs to contribute to the efficiency of the enterprises in the future. Moreover, this research is also a valuable reference for studies in the Vietnamese fishery industry and other research areas and contributes to the literature with the use of the DEA method, especially the Malmquist model, for organizational performance measurement.
Although this study attempts to show that the DEA Malmquist model is the best way to evaluate performance, there are undeniable limitations. First, this research only applied the Malmquist model which did not combine with other models—i.e., a bootstrapped Malmquist index [68,69,70]. Therefore, future studies could incorporate different methods to make inferences about DEA scores or related parameters, and to enhance the competitiveness and maintain a significant position in the fishery sector. Second, it is also necessary to select additional input and output variables for further comparison to increase the objectivity of the research. In addition, this study only assessed the performance of 17 Vietnamese fishery enterprises; future studies could analyze more fishery companies to have a more realistic picture of the performance of the Vietnamese fishery sector in different methods to enhance the competitiveness and maintain a significant position in the fishery sector.
Author Contributions
Conceptualization, T.-H.B. and C.-N.W.; Data curation, T.-L.N.; Formal analysis, T.-L.N. and T.-T.D.; Funding acquisition, C.-N.W.; Investigation, T.-H.B. and T.-T.D.; Methodology, C.-N.W. and T.-L.N.; Project administration, C.-N.W.; Software, T.-H.B. and T.-L.N.; Validation, T.-L.N. and C.-N.W.; Writing—original draft, T.-H.B. and T.-L.N.; Writing—review and editing, C.-N.W. and T.-T.D. All authors have read and agreed to the published version of the manuscript.
Funding
This research was partly supported by the National Kaohsiung University of Science and Technology, and project number MOST 109-2622-E-992-026 from the Ministry of Sciences and Technology in Taiwan.
Institutional Review Board Statement
Not applicable.
Informed Consent Statement
Not applicable.
Data Availability Statement
Not applicable.
Acknowledgments
The authors appreciate the support from the National Kaohsiung University of Science and Technology, Ministry of Sciences and Technology in Taiwan.
Conflicts of Interest
The authors declare no conflict of interest.
References
- EU. Aquaculture Has Fully Recovered from Downturn. Available online: https://ec.europa.eu/fisheries/press/%E2%82%AC5-billion-sales-and-profits-doubled-eu-aquaculture-has-fully-recovered-downturn_en?fbclid=IwAR1VjErBJcoPeU2XrOVlsuE_-9KZIS6aKvj32humUm-2I7RlAM02ixZ6URI (accessed on 22 January 2021).
- Ionel, B. European Regulation in the Veterinary Sanitary and Food Safety Area, a Component of the European Policies on the Safety of Food Products and the Protection of Consumer Interests: A 2007 Retrospective. Part Two: Regulations; Universul Juridic: Bucharest, Romania, 2018; pp. 16–19. [Google Scholar]
- Cioca, A.A.; Dan, S.D.; Lupău, V.M.; Colobatiu, L.M.; Mihaiu, M. The effect of high pressure processing on major structural proteins of rainbow trout fish fillets. Studia Univ. Babes-Bolyai Chem. 2018, 63, 129–136. [Google Scholar] [CrossRef]
- Vietnam Association of Seafood Exporters and Producers (VASEP). Available online: http://vasep.com.vn/1192/OneContent/tong-quan-nganh.htm (accessed on 29 November 2020).
- FAO Fisheries and Aquaculture. Available online: http://www.fao.org/3/w3839e/W3839e01.htm (accessed on 29 November 2020).
- Vietnam Misses 2019 Seafood Export. Available online: https://www.seafoodsource.com/news/supply-trade (accessed on 29 November 2020).
- Pomeroy, R.; Nguyen, K.A.T.; Thong, H.X. Small-scale marine fisheries policy in Vietnam. Mar. Policy 2009, 33, 419–428. [Google Scholar] [CrossRef]
- Hoang, H.D.; Momtaz, S.; Schreider, M. Assessing the vulnerability of small-scale fishery communities in the estuarine areas of Central Vietnam in the context of increasing climate risks. Ocean Coast. Manag. 2020, 196, 105302. [Google Scholar] [CrossRef]
- Quynh, C.N.T.; Schilizzi, S.; Hailu, A.; Iftekhar, S. Vietnam’s Territorial Use Rights for Fisheries: How do they perform against Ostrom’s institutional design principles? World Dev. Perspect. 2020, 17, 100171. [Google Scholar] [CrossRef]
- Dang, N.B.; Momtaz, S.; Zimmerman, K.; Nhung, P.T.H. Effectiveness of formal institutions in managing marine fisheries for sustainable fisheries development: A case study of a coastal commune in Vietnam. Ocean Coast. Manag. 2017, 137, 175–184. [Google Scholar] [CrossRef]
- CP Group. Available online: https://tatthanh.com.vn/top-30-website-cong-ty-thuy-san-hang-dau-viet-nam?fbclid=IwAR2ZM_iU8AqcK8yHonXp2YeDIn-rxGro9CVmUSsW7adPAUaCDyfPBAdipLc (accessed on 17 February 2021).
- Top Fisheries Companies in Vietnam. Available online: https://thuysanvietnam.com.vn/10-thuong-hieu-thuy-san-hang-dau-viet-nam/ (accessed on 17 February 2021).
- Charnes, A.; Cooper, W.W.; Rhodes, E. Measuring the efficiency of decision making units. Eur. J. Oper. Res. 1978, 2, 429–444. [Google Scholar] [CrossRef]
- Zhu, J. Multi-factor performance measure model with an application to Fortune 500 companies. Eur. J. Oper. Res. 2000, 123, 105–124. [Google Scholar] [CrossRef]
- Drake, L.; Hall, M.J. Efficiency in Japanese banking: An empirical analysis. J. Bank. Financ. 2003, 27, 891–917. [Google Scholar] [CrossRef]
- Wang, C.-N.; Dang, T.-T.; Tibo, H.; Duong, D.-H. Assessing Renewable Energy Production Capabilities Using DEA Window and Fuzzy TOPSIS Model. Symmetry 2021, 13, 334. [Google Scholar] [CrossRef]
- Bayyurt, N.; Gokhan, D.U.Z.U. Performance measurement of Turkish and Chinese manufacturing firms: A comparative analysis. Eurasian J. Bus. Econ. 2008, 1, 71–83. [Google Scholar]
- Liu, C.; Lin, S.; Lewis, C. Evaluation of thermal power plant operational in Taiwan by data envelopment analysis. Energy Policy 2010, 38, 1049–1058. [Google Scholar] [CrossRef]
- Halkos, G.E.; Tzeremes, N.G. Analyzing the Greek renewable energy sector: A Data Envelopment Analysis approach. Renew. Sustain. Energy Rev. 2012, 16, 2884–2893. [Google Scholar] [CrossRef]
- Chen, L.; Jia, G. Environmental efficiency analysis of China’s regional industry: A data envelopment analysis (DEA) based approach. J. Clean. Prod. 2017, 142, 846–853. [Google Scholar] [CrossRef]
- Caves, D.W.; Christensen, L.R.; Diewert, W.E. The economic theory of index numbers and the measurement of input, output, and productivity. Econ. J. Econ. Soc. 1982, 1393–1414. [Google Scholar] [CrossRef]
- Färe, R.; Grosskopf, S.; Lindgren, B.; Roos, P. Productivity changes in Swedish pharamacies 1980–1989: A non-parametric Malmquist approach. J. Prod. Anal. 1992, 3, 85–101. [Google Scholar] [CrossRef]
- Worthington, A. Malmquist Indices of Productivity Change in Australian Financial Services. J. Int. Financ. Mark. Inst. Money 1999, 9, 303–320. [Google Scholar] [CrossRef]
- Asmild, M.; Paradi, J.C.; Aggarwall, V.; Schaffnit, C. Combining DEA window analysis with the Malmquist index approach in a study of the Canadian banking industry. J. Prod. Anal. 2004, 21, 67–89. [Google Scholar] [CrossRef]
- Chang, D.; Kuo, L.; Chen, Y. Industrial changes in corporate sustainability performance—An empirical overview using data envelopment analysis. J. Clean. Prod. 2013, 56, 147–155. [Google Scholar] [CrossRef]
- Wang, D. Performance assessment of major global cities by DEA and Malmquist index analysis. Comput. Environ. Urban Syst. 2019, 77, 101–365. [Google Scholar] [CrossRef]
- Tingley, D.; Pascoe, S.; Coglan, L. Factors affecting technical efficiency in fisheries: Stochastic production frontier versus data envelopment analysis approaches. Fish. Res. 2005, 73, 363–376. [Google Scholar] [CrossRef]
- Mustapha, N.H.N.; Aziz, A.A.; Hashim, N.M.H. Technical efficiency in aquaculture industry using Data Envelopment Analysis (DEA) window: Evidences from Malaysia. J. Sustain. Sci. Manag. 2013, 8, 137–149. [Google Scholar]
- Arita, S.; Leung, P. A technical efficiency analysis of Hawaii’s aquaculture industry. J. World Aquac. Soc. 2014, 45, 312–321. [Google Scholar] [CrossRef]
- Hassanpour, M.; Pamucar, D. Evaluation of Iranian household appliance industries using MCDM models. Oper. Res. Eng. Sci. Theory Appl. 2019, 2, 1–25. [Google Scholar] [CrossRef]
- Anthony, P.; Behnoee, B.; Hassanpour, M.; Pamucar, D. Financial performance evaluation of seven Indian chemical companies. Decis. Mak. Appl. Manag. Eng. 2019, 2, 81–99. [Google Scholar] [CrossRef]
- Bayazid, Y.; Umetsu, C.; Hamasaki, H.; Miyanishi, T. Measuring the efficiency of collective floodplain aquaculture of Bangladesh using Data Envelopment Analysis. Aquaculture 2019, 503, 537–549. [Google Scholar] [CrossRef]
- Li, C.J.; Jeon, J.W.; Kim, H.H. An Efficiency Analysis of Fishery Output in Coastal Areas of China. Int. J. Adv. Smart Converg. 2020, 9, 127–136. [Google Scholar]
- Blagojević, A.; Vesković, S.; Kasalica, S.; Gojić, A.; Allamani, A. The application of the fuzzy AHP and DEA for measuring the efficiency of freight transport railway undertakings. Oper. Res. Eng. Sci. Theory Appl. 2020, 3, 1–23. [Google Scholar] [CrossRef]
- Wanke, P.F.; Barbastefano, R.G.; Hijjar, M.F. Determinants of efficiency at major Brazilian port terminals. Transp. Rev. 2011, 31, 653–677. [Google Scholar] [CrossRef]
- Alam, F. Measuring technical, allocative and cost efficiency of pangas (Pangasius hypophthalmus: Sauvage 1878) fish farmers of Bangladesh. Aquac. Res. 2011, 42, 1487–1500. [Google Scholar] [CrossRef]
- Madau, F.A.; Furesi, R.; Pulina, P. The technical efficiency in Sardinian fisheries cooperatives. Mar. Policy 2018, 95, 111–116. [Google Scholar] [CrossRef]
- Park, S.H.; Pham, T.Y.; Yeo, G.T. The impact of ferry disasters on operational efficiency of the South Korean coastal ferry industry: A DEA-window analysis. Asian J. Shipp. Logist. 2018, 34, 248–255. [Google Scholar] [CrossRef]
- Gutiérrez, E.; Lozano, S.; Guillén, J. Efficiency data analysis in EU aquaculture production. Aquaculture 2020, 520, 734962. [Google Scholar] [CrossRef]
- Vestergaard, N.; Squires, D.; Kirkley, J. Measuring capacity and capacity utilization in fisheries: The case of the Danish Gill-net fleet. Fish. Res. 2003, 60, 357–368. [Google Scholar] [CrossRef]
- Lindebo, E. Multi-national industry capacity in the North Sea flatfish fishery. Mar. Resour. Econ. 2005, 20, 385–406. [Google Scholar] [CrossRef]
- Van Hoof, L.; De Wilde, J.W. Capacity assessment of the Dutch beam-trawler fleet using data envelopment analysis (DEA). Mar. Resour. Econ. 2005, 20, 327–345. [Google Scholar] [CrossRef]
- Walden, J.B. Estimating vessel efficiency using a bootstrapped data envelopment analysis model. Mar. Resour. Econ. 2006, 21, 181–192. [Google Scholar] [CrossRef]
- Tsitsika, E.; Maravelias, C.; Wattage, P.; Haralabous, J. Fishing capacity and capacity utilization of purse seiners using data envelopment analysis. Fish. Sci. 2008, 74, 730–735. [Google Scholar] [CrossRef]
- Vassdal, T.; Holst, H.M.S. Technical Progress and Regress in Norwegian Salmon Farming: A Malmquist Index Approach. Mar. Resour. Econ. 2011, 26, 329–341. [Google Scholar] [CrossRef]
- Lim, G.; Ismail, A.L.; Hussein, M.A. Does technology and other determinants effect fishing efficiency? An application of stochastic frontier and data envelopment analyses on trawl fishery. J. Appl. Sci. 2012, 12, 48–55. [Google Scholar]
- Asche, F.; Guttormsen, A.G.; Nielsen, R. Future challenges for the maturing Norwegian salmon aquaculture industry: An analysis of total factor productivity change from 1996 to 2008. Aquaculture 2013, 396, 43–50. [Google Scholar] [CrossRef]
- Vázquez-Rowe, I.; Tyedmers, P. Identifying the importance of the “skipper effect” within sources of measured inefficiency in fisheries through data envelopment analysis (DEA). Mar. Policy 2013, 38, 387–396. [Google Scholar] [CrossRef]
- Ceyhan, V.; Gene, H. Productive efficiency of commercial fishing: Evidence from the Samsun Province of Black Sea, Turkey. Turk. J. Fish. Aquat. Sci. 2014, 14, 309–320. [Google Scholar]
- Ding, L.L.; Lei, L.; Wang, L.; Zhang, L.F.; Calin, A.C. A novel cooperative game network DEA model for marine circular economy performance evaluation of China. J. Clean. Prod. 2020, 253, 120071. [Google Scholar] [CrossRef]
- Pan, W.T.; Zhuang, M.E.; Zhou, Y.Y.; Yang, J.J. Research on sustainable development and efficiency of China’s E-Agriculture based on a data envelopment analysis-Malmquist model. Technol. Forecast. Soc. Chang. 2020, 162, 120298. [Google Scholar] [CrossRef]
- Elkadeem, M.R.; Kotb, K.M.; Ullah, Z.; Atiya, E.G.; Dán, A.; Wang, S. A two-stage multi-attribute analysis method for city-integrated hybrid mini-grid design: A case study in Egypt. Sustain. Cities Soc. 2020, 65, 102603. [Google Scholar] [CrossRef]
- Deveci, K.; Cin, R.; Kağızman, A. A modified interval valued intuitionistic fuzzy CODAS method and its application to multi-criteria selection among renewable energy alternatives in Turkey. Appl. Soft Comput. 2020, 96, 106660. [Google Scholar] [CrossRef]
- Wang, C.N.; Dang, T.T.; Nguyen, N.A.T.; Le, T.T.H. Supporting Better Decision-Making: A Combined Grey Model and Data Envelopment Analysis for Efficiency Evaluation in E-Commerce Marketplaces. Sustainability 2020, 12, 10385. [Google Scholar] [CrossRef]
- Wang, C.N.; Nguyen, T.L.; Dang, T.T. Analyzing Operational Efficiency in Real Estate Companies: An Application of GM (1,1) and DEA Malmquist Model. Mathematics 2021, 9, 202. [Google Scholar] [CrossRef]
- Emili, T.A.; Emili, G.T.; Carmen, A.; David, C. Sensitivity analysis of efficiency and Malmquist productivity indices: An application to Spanish savings banks. Eur. J. Oper. Res. 2008, 184, 1062–1084. [Google Scholar]
- Morita, H.; Avkiran, N.K. Selecting inputs and outputs in data envelopment analysis by designing statistical experiments. J. Oper. Res. Soc. Jpn. 2009, 52, 163–173. [Google Scholar]
- Vietnam Financial Report. Available online: https://vietstock.vn/ (accessed on 29 November 2020).
- Theodoridis, A.; Batzios, C.; Ragkos, A.; Angelidis, P. Technical efficiency measurement of mussel aquaculture in Greece. Aquac. Int. 2017, 25, 1025–1037. [Google Scholar] [CrossRef]
- Pham, T.D.T.; Huang, H.W.; Chuang, C.T. Finding a balance between economic performance and capacity efficiency for sustainable fisheries: Case of the Da Nang gillnet fishery, Vietnam. Mar. Policy 2014, 44, 287–294. [Google Scholar] [CrossRef]
- Anh, P.V.; Everaert, G.; Vinh, C.T.; Goethals, P. Need for integrated analysis and management instruments to attain sustainable fisheries in Vietnam. Sustain. Water Qual. Ecol. 2014, 3, 151–154. [Google Scholar] [CrossRef]
- Vietnam Seafood Exports Drop Due to Pandemic. Available online: https://fishfocus.co.uk/vietnam-seafood-exports-drop/ (accessed on 29 November 2020).
- Seafood Exports in May Continues to Be Affected by Covid-19, the Agency of Foreign Trade in Vietnam. Available online: http://vietfishmagazine.com/markets/seafood-exports-in-may-continues-to-be-affected-by-covid-19.html (accessed on 29 November 2020).
- Kaewnuratchadasorn, P.; Smithrithee, M.; Sato, A.; Wanchana, W.; Tongdee, N.; Sulit, V.T. Capturing the Impacts of COVID-19 on the Fisheries Value Chain of Southeast Asia. Fish People 2020, 18, 2–8. [Google Scholar]
- Investment Commerce Fisheries Corp Company Profile. Available online: https://www.investing.com/equities/investment-commerce-fisheries-corp-company-profile (accessed on 22 January 2021).
- Tra Fish Companies See Profits Slump in Pandemic. Available online: https://vietnamnews.vn/economy/770605/tra-fish-companies-see-profits-slump-in-pandemic.html (accessed on 22 January 2021).
- The Sustainable Future of Viet Nam’s Fisheries after COVID-19. Available online: https://wwf.panda.org/_/search_wwf_news/?363051%2FThe-sustainable-future-of-Viet-Nams-fisheries-after-COVID-19&fbclid=IwAR3UQjMI_DG5RWyJcMDwDENxlAk6aZlMWGRboVLdcNtZ1nPMg1eO0iy-hcU (accessed on 22 January 2021).
- Kapelko, M.; Lansink, A.O. An international comparison of productivity change in the textile and clothing industry: A bootstrapped Malmquist index approach. Empir. Econ. 2015, 48, 1499–1523. [Google Scholar] [CrossRef]
- Hoff, A. Bootstrapping Malmquist indices for Danish seiners in the North Sea and Skagerrak. J. Appl. Stat. 2006, 33, 891–907. [Google Scholar] [CrossRef]
- Simar, L.; Wilson, P.W. Estimating and bootstrapping Malmquist indices. Eur. J. Oper. Res. 1999, 115, 459–471. [Google Scholar] [CrossRef]
Publisher’s Note: MDPI stays neutral with regard to jurisdictional claims in published maps and institutional affiliations. |
© 2021 by the authors. Licensee MDPI, Basel, Switzerland. This article is an open access article distributed under the terms and conditions of the Creative Commons Attribution (CC BY) license (http://creativecommons.org/licenses/by/4.0/).