
Application of Hexagonal Fuzzy MCDM Methodology for Site Selection of Electric Vehicle Charging Station

 ,
,  ,
, 
 and
and
Abstract
1. Introduction
1.1. Literature Review
1.2. Objectives of the Study
- (a)
- Identification of the most preferred site for the construction of an e-vehicle charging station.
- (b)
- Application of hexagonal fuzzy numbers (HFN) in AHP-TOPSIS and AHP-COPRAS to obtain the ranking of the selected sites.
1.3. Novelties of the Study
1.4. Structure of the Paper
2. Preliminaries
2.1. Fuzzy Set
- is a continuous function [0, 1].
- is strictly increasing continuous function in [ and [.
- attains maximum value 1 in [.
- is strictly decreasing continuous function in [ and [.
2.2. Arithmetic Operations of Linear Symmetric HFN
- Addition:
- Subtraction:
- Multiplication:
- Scalar Multiplication:
- Division:
- Inverse:
2.3. Distance Measure of Two HFN
2.4. Centroid-Based Method for the Defuzzification of Hexagonal Fuzzy Numbers
- (i).
- Centroid of
- (ii).
- Centroid of
- (iii).
- Centroid of Trapezium :
- (a)
- Centroid of
- (b)
- Centroid of
- (c)
- Centroid of Rectangle
- (iv).
- Centroid of Trapezium CDEF is calculated in the similar order and we obtain:
2.5. Determination of Hexagonal Fuzzy Weights of Factors and Sub-Factors
- Step 1. The geometric mean value of the HFN is obtained using:
- Step 2. Summation of each
- Step 3. To calculate the inverse of each and arrange it in increasing order.
- Step 4. To find the hexagonal fuzzy weight of factors and sub-factors using the following equation:
- Step 5. The global hexagonal fuzzy weight of sub-factors are computed by the product of factor weight with the respective sub-factor fuzzy weight.
2.6. Fuzzy Analytic Hierarchy Process (FAHP)
- Step 1. Construction of a comparison matrix in terms of HFN by a group of decision experts.
- Step 2. Defuzzification of HFN:
- Step 3. Normalization of the defuzzified matrix:
- Step 4. Estimation of factors’ and sub-factors’ weights:
- Step 5. To test the Consistence Index of the matrix:where denotes the size of the matrix.
- Step 6. Determination of Consistence Ratio (C.R):where R.I is stand for Random Index, and its value differs with the size of the matrix “n”.
2.7. Technique for Order Preference by Similarity to Ideal Solution (TOPSIS) and (FTOPSIS)
- Step 1: Construction of the decision matrix by the help of decision experts in terms of linguistic terms. The linguistic terms are then converted to a HFN.
- Step 2: To evaluate the normalized HFN fuzzy decision matrix:where B.A and N.B.A signifies the benefit attributes and non-benefit attributes, respectively.
- Step 3: To evaluate the weighted fuzzy normalized matrix, the sub-factors’ fuzzy weights are multiplied with the normalized fuzzy value:where
- Step 4: Calculate the fuzzy positive ideal solution (FPIS) and fuzzy negative ideal solution (FNIS) , where denotes the maximum value of and denotes the minimum value of hgh:where denotes the benefit attributes and denotes the non-benefit attributes.
- Step 5: Calculation of the distance measure of all alternatives from the PIS and NIS. The two Euclidean distances for individual alternatives can be calculated as follows:where d(., .) denotes the Euclidean distance between two fuzzy numbers.
- Step 6: Determination of the relative closeness to the ideal alternatives:
- Step 7: Rank the alternatives:
2.8. Fuzzy COPRAS Methodology
- Step 1. Decision matrix is constructed in terms of HFN, the alternatives are given linguistic terms by the decision experts with respect to the criteria.
- Step 2. Normalized decision matrix is formulated using Equation (1), in the similar way, we constructed for TOPSIS normalized matrix.
- Step 3. Weighted normalized matrix is constructed by multiplying the criteria weights with fuzzy normalized matrix using Equation (19).
- Step 4. Aggregation of beneficial and non-beneficial indices for each alternative are evaluated.where represents the benefit attribute of the alternatives and represents the non-benefit attributes of the alternative.
- Step 5. Finally, the aggregated beneficial and non-beneficial indices are defuzzified using the Equation (9) and and are determined.
- Step 6. Calculation of using the following formulae:
- Step 7. Ranking of the alternatives are done using the formulae:where represents the g-thdefuzzified value and represents the maximum defuzzified value of individual alternative.
3. Hexagonal Fuzzy MCDM Methodology for Site Selection of Electric Vehicle Charging Station (Numerical Application)
3.1. The Factors and Sub Factors Taken in This Research Have Been Explained in the Following Way
3.1.1. Economic Factors (C1)
- Land cost : It is the crux of the entire planning for the optimum charging station location. Land costs are based on their use, i.e., non-agricultural urban land is more costly than agricultural land. Since the purpose is to build a charging station, we can minimize the land cost by utilizing an already existing utility station. If money is saved on the cost of procuring the land, then it can be utilized for setting up the station.
- Operating and management cost (OMC): Yao, Bai and Xu [81] stated that a significant part of the budgeted amount is cut out for dealing with operating and management costs which arise in the day to day working of the project. The minimum management cost is essential since it helps in the smooth flow of the information from one department to the other. The charging station should be executed sothat the operations can be systematically planned, which will reduce the in-between costs. Electric vehicles will reduce the air pollution, hence initial operating costs are understandable since the long-term implications outweigh the costs.
- Consumption level : Modrak and Soltysova [82] studied the operational complexity measure. The measure of consumption level denotes how affluent the people in a particular locality are. In the case that consumption level in an area is high, it can be expected that people will be more willing to go to further distances in search of more options. A charging station can be built in a high consumption area since the throng of people will have more ways of traveling and procuring their wants.
- Construction cost : Manerba, Mansini and Perboli [83] researched the capacitated supplier selection problem considering total quantity discount policy and activation costs under uncertainty. Construction cost varies with the location, and to make the charging station a success, the initial fixed cost should be minimized as much as possible. If the location is well-connected by various transportation facilities, then the cost of transferring the construction materials will decrease, which will decrease the construction cost and the overall profitability of the charging station will increase initially.
- Public facilities : Kinay et al. [84] studied multi-criteria chance-constrained capacitated single source discrete facility location problems. Public facilities refer to schools, colleges, grocery stores, shopping malls, bus stops and the other everyday amenities which are used by commoners on a mass scale. In the case of a charging station being built near a location with a large density of public facilities, it will act as a boon since money will frequently change hands and thereby develop the area.
3.1.2. Environmental Factors (C2)
- Generation of noise and air pollution (GNAP): In the current scenario, noise and air pollution are considered bigger hindrances than other forms of pollution. This is because they are experienced daily, which results in greater damage due to them. Electric vehicles will help in reducing both, since the batteries of the vehicles will not cause air pollution or make noise while being on the road.
- Petrol stations : The availability of petrol stations nearby signifies a greater number of vehicles in the area. Building a charging station near a petrol station will cause an increase in the number of vehicles and people visiting the area and thereby turn out to be more profitable since the cost will be less.
- Transportation stations : These refer to the various bus stops, bicycle charging stations, railway stations, car stops, and tram stops. The greater the frequency of the transportation vehicles, the more will be its impact on the environment since every form of transportation will bring more people, eventually harming the environment. Electric vehicles, on the other hand, help in the easy transportation of people without harming the environment.
3.1.3. Traffic Factors (C3)
- Number of roads : Yao, Bai and Xu [81] studied the impact of the number of roads on China’s thermal power industry. The number of roads stands for the various options which the vehicles can take in the case of congestion or for availing a shorter reach time. If the charging station is strategically built near an intersection of heavy-traffic roads, then it will help the drivers be more at ease while driving since they will have a backup nearby.
- Road potency : Hosseini and Sarder [85] studied the road potency for optimal site selection using a Bayesian network model. The higher the number of vehicles in the region, the greater the footfall will be, which will eventually increase the success rate of the charging station.
- Parking areas : The increase in parking areas will lead to an increase in the use of electric vehicles, since one of the major thoughts which arises in a prospective buyer’s mind is where one will park the vehicle. If the charging station is built near a parking area, then the vehicle owners can directly charge and park it.
3.1.4. Societal Factors (C4)
- Adverse impact of noise and electromagnetic fields (AI): (Due to the construction of the electric vehicle charging station). An electric vehicle charging station has a constant aura of noise and an electromagnetic field surrounding it during the construction phase which might cause a certain category of people to develop problems. If proper measures can be taken in the initial stage, then this impact may be minimized since public health is of utmost importance.
- Population density : This stands for the number of people living in each unit of area. When the population density in a locality is high, it shows that the area is overcrowded. There will be more consumption in such an area and the construction cost will also be high, but the quality of life will usually be low. The need of transportation in such an area is usually very high and an electric vehicle charging station constructed in such an area may just be what the people need.
3.2. Ranking of Alternatives Using Fuzzy AHP-TOPSIS Method
3.3. Ranking of Alternatives UsingFuzzy AHP-COPRAS
4. Comparison Analysis and Sensitivity Analysis
5. Results and Discussion
6. Conclusionsand Future Scope
Author Contributions
Funding
Institutional Review Board Statement
Informed Consent Statement
Data Availability Statement
Conflicts of Interest
References
- Bilgen, S. Structure and environmental impact of global energy consumption. Renew. Sustain. Energy Rev. 2014, 38, 890–902. [Google Scholar] [CrossRef]
- Zhao, H.R.; Guo, S.; Fu, L.W. Review on the costs and benefits of renewable energy power subsidy in China. Renew. Sustain. Energy Rev. 2014, 37, 538–549. [Google Scholar] [CrossRef]
- Hernández, J.C.; Sutil, S.F.; Vidal, P.G.; Casas, R.C. Primary frequency control and dynamic grid support for vehicle-to-grid in transmission systems. Int. J. Electr. Power Energy Syst. 2018, 100, 152–166. [Google Scholar] [CrossRef]
- Schoettle, B.; Sivak, M. The relative merits of battery-electric vehicles and fuel-cell vehicles. Transp. Res. Inst. Mich. 2016. Available online: http://www.umich.edu/~umtriswt/PDF/UMTRI-2016-5.pdf (accessed on 15 February 2021).
- Singh, M.; Kumar, P.; Kar, I. A multi charging station for electric vehicles and its utilization for load management and the grid support. IEEE Trans. Smart Grid 2013, 4, 1026–1037. [Google Scholar] [CrossRef]
- Rowe, G.E.; Gardner, B.; Abraham, C.; Skippon, S.; Dittmar, H.; Hutchins, R.; Stannard, J. Mainstream consumers driving plug-in battery-electric and plug-in hybrid electric cars: A qualitative analysis of responses and evaluations. Transp. Res. Part A Policy Pract. 2012, 46, 140–153. [Google Scholar] [CrossRef]
- Hernández, J.C.; Rodriguez, R.F.J.; Jurado, F. Modelling and assessment of the combined technical impact of electric vehicles and photovoltaic generation in radial distribution systems. Energy 2017, 141, 316–332. [Google Scholar] [CrossRef]
- Mak, H.Y.; Rong, Y.; Shen, Z.J.M. Infrastructure planning for electric vehicles with battery swapping. Manag. Sci. 2013, 59, 1557–1575. [Google Scholar] [CrossRef]
- Fang, Y.; Wei, W.; Mei, S.; Chen, L.; Zhang, X.; Huang, S. Promoting electric vehicle charging infrastructure considering policy incentives and user preferences: An evolutionary game model in a small-world network. J. Clean. Prod. 2020, 258, 753. [Google Scholar] [CrossRef]
- Dericioglu, C.; Yirik, E.; Unal, E.; Cuma, M.U.; Onur, B.; Tumay, M. A review of charging technologies for commercial electric vehicles. Int. J. Adv. Automot. Technol. 2018, 2, 61–70. [Google Scholar]
- Zivin, J.S.G.; Kotchen, M.J.; Mansur, E.T. Spatial and temporal heterogeneity of marginal emissions: Implications for electric cars and other electricity-shifting policies. J. Econ. Behav. Organ. 2014, 107, 248–268. [Google Scholar] [CrossRef]
- Millo, F.; Rolando, L.; Fuso, R.; Mallamo, F. Real CO2 emissions benefits and end user’s operating costs of a plug-in hybrid electric vehicle. Appl. Energy 2014, 114, 563–571. [Google Scholar] [CrossRef]
- Brown, S.; Pyke, D.; Steenhof, P. Electric vehicles: The role and importance of standards in an emerging market. Energy Policy 2010, 38, 3797–3806. [Google Scholar] [CrossRef]
- Zhao, H.; Li, N. Optimal siting of charging stations for electric vehicles based on fuzzy Delphi and hybrid multi-criteria decision making approaches from an extended sustainability perspective. Energies 2016, 9, 270. [Google Scholar] [CrossRef]
- Frade, I.; Ribeiro, A.; Gonçalves, G.; Antunes, A.P. Optimal location of charging stations for electric vehicles in a neighborhood in Lisbon, Portugal. Transp. Res. Rec. 2011, 2252, 91–98. [Google Scholar] [CrossRef]
- Barzani, S.P.; Ghahnavieh, R.A.; Karegar, K.H. Optimal fast charging station placing and sizing. Appl. Energy 2014, 125, 289–299. [Google Scholar] [CrossRef]
- Hwang, C.L.; Yoon, K. Methods for multiple attribute decision making. In Multiple Attribute Decision Making; Springer: Berlin/Heidelberg, Germany, 1981; pp. 58–191. [Google Scholar]
- Hwang, C.L.; Lai, Y.J.; Liu, T.Y. A new approach for multiple objective decision making. Comput. Oper. Res. 1993, 20, 889–899. [Google Scholar] [CrossRef]
- Tang, H.; Shi, Y.; Dong, P. Public blockchain evaluation using entropy and TOPSIS. Expert Syst. Appl. 2019, 117, 204–210. [Google Scholar] [CrossRef]
- Sennaroglu, B.; Celebi, G.V. A military airport location selection by AHP integrated PROMETHEE and VIKOR methods. Transp. Res. Part D Transp. Environ. 2018, 59, 160–173. [Google Scholar] [CrossRef]
- Gupta, P.; Mehlawat, M.K.; Grover, N. Intuitionistic fuzzy multi-attribute group decision-making with an application to plant location selection based on a new extended VIKOR method. Inf. Sci. 2016, 370, 184–203. [Google Scholar] [CrossRef]
- Tian, Z.P.; Wang, J.Q.; Wang, J.; Zhang, H.Y. A multi-phase QFD-based hybrid fuzzy MCDM approach for performance evaluation: A case of smart bike-sharing programs in Changsha. J. Clean. Prod. 2018, 171, 1068–1083. [Google Scholar] [CrossRef]
- Tian, Z.P.; Wang, J.Q.; Zhang, H.Y. An integrated approach for failure mode and effects analysis based on fuzzy best-worst, relative entropy, and VIKOR methods. Appl. Soft Comput. 2018, 72, 636–646. [Google Scholar] [CrossRef]
- Zhao, H.; Guo, S. Selecting green supplier of thermal power equipment by using a hybrid MCDM method for sustainability. Sustainability 2014, 6, 217–235. [Google Scholar] [CrossRef]
- Zadeh, L.A. Fuzzy sets. In Fuzzy Sets, Fuzzy Logic, and Fuzzy Systems: Selected Papers by LotfiAZadeh; World Scientific: Hackensack, NJ, USA, 1996; pp. 394–432. [Google Scholar]
- Tang, Z.; Guo, C.; Hou, P.; Fan, Y. Optimal siting of electric vehicle charging stations based on voronoi diagram and fahp method. Energy Power Eng. 2013, 5, 1404–1409. [Google Scholar] [CrossRef]
- Feizizadeh, B.; Roodposhti, M.S.; Jankowski, P.; Blaschke, T. A GIS-based extended fuzzy multi-criteria evaluation for landslide susceptibility mapping. Comput. Geosci. 2014, 73, 208–221. [Google Scholar] [CrossRef]
- Lee, W.; Xiang, L.; Schober, R.; Wong, V.W. Electric vehicle charging stations with renewable power generators: A game theoretical analysis. IEEE Trans. Smart Grid 2014, 6, 608–617. [Google Scholar] [CrossRef]
- Rivera, S.; Wu, B.; Kouro, S.; Yaramasu, V.; Wang, J. Electric vehicle charging station using a neutral point clamped converter with bipolar DC bus. IEEE Trans. Ind. Electron. 2014, 62, 1999–2009. [Google Scholar] [CrossRef]
- Wang, Q.; Zhou, N.; Wang, J.; Wei, N. Harmonic amplification investigation and calculation of electric vehicle charging stations using three-phase uncontrolled rectification chargers. Electr. Power Syst. Res. 2015, 123, 174–184. [Google Scholar] [CrossRef]
- Ding, H.; Hu, Z.; Song, Y. Value of the energy storage system in an electric bus fast charging station. Appl. Energy 2015, 157, 630–639. [Google Scholar] [CrossRef]
- Fan, P.; Sainbayar, B.; Ren, S. Operation analysis of fast charging stations with energy demand control of electric vehicles. IEEE Trans. Smart Grid 2015, 6, 1819–1826. [Google Scholar] [CrossRef]
- Capasso, C.; Veneri, O. Experimental study of a DC charging station for full electric and plug in hybrid vehicles. Appl. Energy 2015, 152, 131–142. [Google Scholar] [CrossRef]
- Li, S.; Bao, K.; Fu, X.; Zheng, H. Energy management and control of electric vehicle charging stations. Electr. Power Compon. Syst. 2014, 42, 339–347. [Google Scholar] [CrossRef]
- Nansai, K.; Tohno, S.; Kono, M.; Kasahara, M.; Moriguchi, Y. Life-cycle analysis of charging infrastructure for electric vehicles. Appl. Energy 2001, 70, 251–265. [Google Scholar] [CrossRef]
- Khalkhali, K.; Abapour, S.; Tafreshi, M.S.M.; Abapour, M. Application of data envelopment analysis theorem in plug-in hybrid electric vehicle charging station planning. IET Gener. Transm. Distrib. 2015, 9, 666–676. [Google Scholar] [CrossRef]
- Liu, J. Electric vehicle charging infrastructure assignment and power grid impacts assessment in Beijing. Energy Policy 2012, 51, 544–557. [Google Scholar] [CrossRef]
- Wirges, J.; Linder, S.; Kessler, A. Modelling the development of a regional charging infrastructure for electric vehicles in time and space. Eur. J. Transp. Infrastruct. Res. 2012, 12. [Google Scholar] [CrossRef]
- Wang, Z.; Liu, P.; Cui, J.; Xi, Y.; Zhang, L. Research on quantitative models of electric vehicle charging stations based on principle of energy equivalence. Math. Probl. Eng. 2013, 2013. [Google Scholar] [CrossRef]
- He, F.; Wu, D.; Yin, Y.; Guan, Y. Optimal deployment of public charging stations for plug-in hybrid electric vehicles. Transp. Res. Part B Methodol. 2013, 47, 87–101. [Google Scholar] [CrossRef]
- Liu, Z.; Wen, F.; Ledwich, G. Optimal planning of electric-vehicle charging stations in distribution systems. IEEE Trans. Power Deliv. 2012, 28, 102–110. [Google Scholar] [CrossRef]
- Pashajavid, E.; Golkar, M.A. Optimal placement and sizing of plug in electric vehicles charging stations within distribution networks with high penetration of photovoltaic panels. J. Renew. Sustain. Energy 2013, 5, 3126. [Google Scholar] [CrossRef]
- Chen, T.D.; Kockelman, K.M.; Khan, M. Locating electric vehicle charging stations: Parking-based assignment method for Seattle, Washington. Transp. Res. Rec. 2013, 2385, 28–36. [Google Scholar] [CrossRef]
- Sathaye, N.; Kelley, S. An approach for the optimal planning of electric vehicle infrastructure for highway corridors. Transp. Res. Part E Logist. Transp. Rev. 2013, 59, 15–33. [Google Scholar] [CrossRef]
- Wang, G.; Xu, Z.; Wen, F.; Wong, K.P. Traffic-constrained multiobjective planning of electric-vehicle charging stations. IEEE Trans. Power Deliv. 2013, 28, 2363–2372. [Google Scholar] [CrossRef]
- Dong, J.; Liu, C.; Lin, Z. Charging infrastructure planning for promoting battery electric vehicles: An activity-based approach using multiday travel data. Transp. Res. Part C Emerg. Technol. 2014, 38, 44–55. [Google Scholar] [CrossRef]
- Xu, H.; Miao, S.; Zhang, C.; Shi, D. Optimal placement of charging infrastructures for large-scale integration of pure electric vehicles into grid. Int. J. Electr. Power Energy Syst. 2013, 53, 159–165. [Google Scholar] [CrossRef]
- You, P.S.; Hsieh, Y.C. A hybrid heuristic approach to the problem of the location of vehicle charging stations. Comput. Ind. Eng. 2014, 70, 195–204. [Google Scholar] [CrossRef]
- Lee, Y.G.; Kim, H.S.; Kho, S.Y.; Lee, C. User Equilibrium–Based Location Model of Rapid Charging Stations for Electric Vehicles with Batteries That Have Different States of Charge. Transp. Res. Rec. 2014, 2454, 97–106. [Google Scholar] [CrossRef]
- Baouche, F.; Billot, R.; Trigui, R.; El Faouzi, N.E. Efficient allocation of electric vehicles charging stations: Optimization model and application to a dense urban network. IEEE Intell. Transp. Syst. Mag. 2014, 6, 33–43. [Google Scholar] [CrossRef]
- Yao, W.; Zhao, J.; Wen, F.; Dong, Z.; Xue, Y.; Xu, Y.; Meng, K. A multi-objective collaborative planning strategy for integrated power distribution and electric vehicle charging systems. IEEE Trans. Power Syst. 2014, 29, 1811–1821. [Google Scholar] [CrossRef]
- Ma, T.; Zhao, J.; Xiang, S.; Zhu, Y.; Liu, P. An agent-based training system for optimizing the layout of AFVs’ initial filling stations. J. Artif. Soc. Soc. Simul. 2014, 17, 6. [Google Scholar] [CrossRef]
- Chung, S.H.; Kwon, C. Multi-period planning for electric car charging station locations: A case of Korean Expressways. Eur. J. Oper. Res. 2015, 242, 677–687. [Google Scholar] [CrossRef]
- Lam, A.Y.; Leung, Y.W.; Chu, X. Electric vehicle charging station placement: Formulation, complexity, and solutions. IEEE Trans. Smart Grid 2014, 5, 2846–2856. [Google Scholar] [CrossRef]
- Cai, H.; Jia, X.; Chiu, A.S.; Hu, X.; Xu, M. Siting public electric vehicle charging stations in Beijing using big-data informed travel patterns of the taxi fleet. Transp. Res. Part D Transp. Environ. 2014, 33, 39–46. [Google Scholar] [CrossRef]
- Önüt, S.; Soner, S. Transshipment site selection using the AHP and TOPSIS approaches under fuzzy environment. Waste Manag. 2008, 28, 1552–1559. [Google Scholar] [CrossRef]
- Ghorui, N.; Ghosh, A.; Algehyne, E.A.; Mondal, S.P.; Saha, A.K. AHP-TOPSIS Inspired Shopping Mall Site Selection Problem with Fuzzy Data. Mathematics 2020, 8, 1380. [Google Scholar] [CrossRef]
- Mohajeri, N.; Amin, G.R. Railway station site selection using analytical hierarchy process and data envelopment analysis. Comput. Ind. Eng. 2010, 59, 107–114. [Google Scholar] [CrossRef]
- Liu, H.C.; You, J.X.; Fan, X.J.; Chen, Y.Z. Site selection in waste management by the VIKOR method using linguistic assessment. Appl. Soft Comput. 2014, 21, 453–461. [Google Scholar] [CrossRef]
- Jun, D.; Tian, T.F.; Sheng, Y.Y.; Yu, M. Macro-site selection of wind/solar hybrid power station based on ELECTRE-II. Renew. Sustain. Energy Rev. 2014, 35, 194–204. [Google Scholar] [CrossRef]
- Malczewski, J. GIS-based multicriteria decision analysis: A survey of the literature. Int. J. Geogr. Inf. Sci. 2006, 20, 703–726. [Google Scholar] [CrossRef]
- Özceylan, E.; Erbaş, M.; Tolon, M.; Kabak, M.; Durğut, T. Evaluation of freight villages: A GIS-based multi-criteria decision analysis. Comput. Ind. 2016, 76, 38–52. [Google Scholar] [CrossRef]
- Atici, K.B.; Simsek, A.B.; Ulucan, A.; Tosun, M.U. A GIS-based Multiple Criteria Decision Analysis approach for wind power plant site selection. Util. Policy 2015, 37, 86–96. [Google Scholar] [CrossRef]
- Çetinkaya, C.; Özceylan, E.; Erbaş, M.; Kabak, M. GIS-based fuzzy MCDA approach for siting refugee camp: A case study for southeastern Turkey. Int. J. Disaster Risk Reduct. 2016, 18, 218–231. [Google Scholar] [CrossRef]
- Garg, H. A new generalized improved score function of interval-valued intuitionistic fuzzy sets and applications in expert systems. Appl. Soft Comput. 2016, 38, 988–999. [Google Scholar] [CrossRef]
- Kumar, K.; Garg, H. TOPSIS method based on the connection number of set pair analysis under interval-valued intuitionistic fuzzy set environment. Comput. Appl. Math. 2018, 37, 1319–1329. [Google Scholar] [CrossRef]
- Maity, S.; Chakraborty, A.; De, S.K.; Mondal, S.P.; Alam, S. A comprehensive study of a backlogging EOQ model with nonlinear heptagonal dense fuzzy environment. RAIRO Oper. Res. 2020, 54. [Google Scholar] [CrossRef]
- Soni, H.; Sarkar, B.; Josh, M. Demand uncertainty and learning in fuzziness in a continuous review inventory model. J. Intell. FuzzySyst. 2017, 33, 2595–2608. [Google Scholar] [CrossRef]
- Sarkar, B.; Mahapatra, A.S. Periodic review fuzzy inventory models with variable lead time and fuzzy demand. Int. Trans. Oper. Res. 2017, 24, 1197–1227. [Google Scholar] [CrossRef]
- Rahaman, M.; Mondal, S.P.; Shaikh, A.A.; Ahmadian, A.; Norazak, S.; Salahshour, S. Arbitrary-order economic production quantity model with and without deterioration: Generalized point of view. Adv. Differ. Equ. 2020, 16, 1–30. [Google Scholar] [CrossRef]
- Rahaman, M.; Mondal, S.P.; Alam, S.; Khan, N.A.; Biswas, A. Interpretation of exact solution for fuzzy fractional non-homogeneous differential equation under the Riemann-Liouville sense and its application on the inventory management control problem. Granul. Comput. 2020, 1–24. [Google Scholar] [CrossRef]
- Rahaman, M.; Mondal, S.P.; Shaikh, A.; Pramanik, A.P.; Roy, S.; Maity, M.K.; Mondal, R.; De, D. Artificial bee colony optimization-inspired synergetic study of fractional-order economic production quantity model. Soft Comput. 2020, 24, 15341–15359. [Google Scholar] [CrossRef]
- Chakraborty, A.; Maity, S.; Jain, S.; Mondal, S.P.; Alam, S. Hexagonal fuzzy number and its distinctive representation, ranking, defuzzification technique and application in production inventory management problem. Granul. Comput. 2020, 1–15. [Google Scholar] [CrossRef]
- Buckley, J.J. Fuzzy Hierarchical Analysis. In Fuzzy Sets Systems; World Scientific: Hackensack, NJ, USA, 1985. [Google Scholar]
- Satty, T.L. The Analytic Hierarchy Process; McGraw-Hill: New York, NY, USA, 1980. [Google Scholar]
- Yoon, K.P.; Hwang, C.L. Multiple Attribute Decision Making: An Introduction; Sage Publications: Thousand Oaks, CA, USA, 1995. [Google Scholar]
- Sodhi, B.; Prabhakar, T.V. A simplified description of Fuzzy TOPSIS. arXiv 2012, arXiv:1205.5098. Available online: https://arxiv.org/abs/1205.5098 (accessed on 15 February 2021).
- Zavadskas, E.K.; Kaklauskas, A.; Sarka, V. The new method of multicriteria complex proportional assessment of projects. Technol. Econ. Dev. Econ. 1994, 1, 131–139. [Google Scholar]
- Ghose, D.; Pradhan, S.; Tamuli, P.; Shabbiruddin. Optimal material for solar electric vehicle application using an integrated Fuzzy-COPRAS model. Energy Sources Part A Recovery Util. Environ. Eff. 2019, 1–20. [Google Scholar] [CrossRef]
- Tolga, A.C.; Durak, G. Evaluating Innovation Projects in Air Cargo Sector with Fuzzy COPRAS. In International Conference on Intelligent and Fuzzy Systems; Springer: Cham, Switzerland, 2019; pp. 702–710. [Google Scholar]
- Yao, R.; Bai, H.; Xu, H. Where should China’s thermal power industry prioritize its B&R investment? A study based on an environmental site selection analysis. J. Clean. Prod. 2019, 215, 669–679. [Google Scholar]
- Modrak, V.; Soltysova, Z. Development of operational complexity measure for selection of optimal layout design alternative. Int. J. Prod. Res. 2018, 56, 7280–7295. [Google Scholar] [CrossRef]
- Manerba, D.; Mansini, R.; Perboli, G. The capacitated supplier selection problem with total quantity discount policy and activation costs under uncertainty. Int. J. Prod. Econ. 2018, 198, 119–132. [Google Scholar] [CrossRef]
- Kınay, Ö.B.; da Gama, S.F.; Kara, B.Y. On multi-criteria chance-constrained capacitated single-source discrete facility location problems. Omega 2019, 83, 107–122. [Google Scholar] [CrossRef]
- Hosseini, S.; Sarder, M.D. Development of a Bayesian network model for optimal site selection of electric vehicle charging station. Int. J. Electr. Power Energy Syst. 2019, 105, 110–122. [Google Scholar] [CrossRef]
- Zha, Y.; Gao, J.; Ni, S. Use of normalized difference built-up index in automatically mapping urban areas from TM imagery. Int. J. Remote Sens. 2003, 24, 583–594. [Google Scholar] [CrossRef]


| Factors | Sub-Factors |
|---|---|
| Economic Factors | Land cost Operating and management cost (OMC) Consumption level Construction cost () Public facilities |
| Environmental Factors | GNAP () Petrol stations Transportation stations () |
| Traffic Factors | Number of roads Road potency Parking areas |
| Scheme 4 | Adverse impact of noise and electromagnetic fields (AI) Population density |
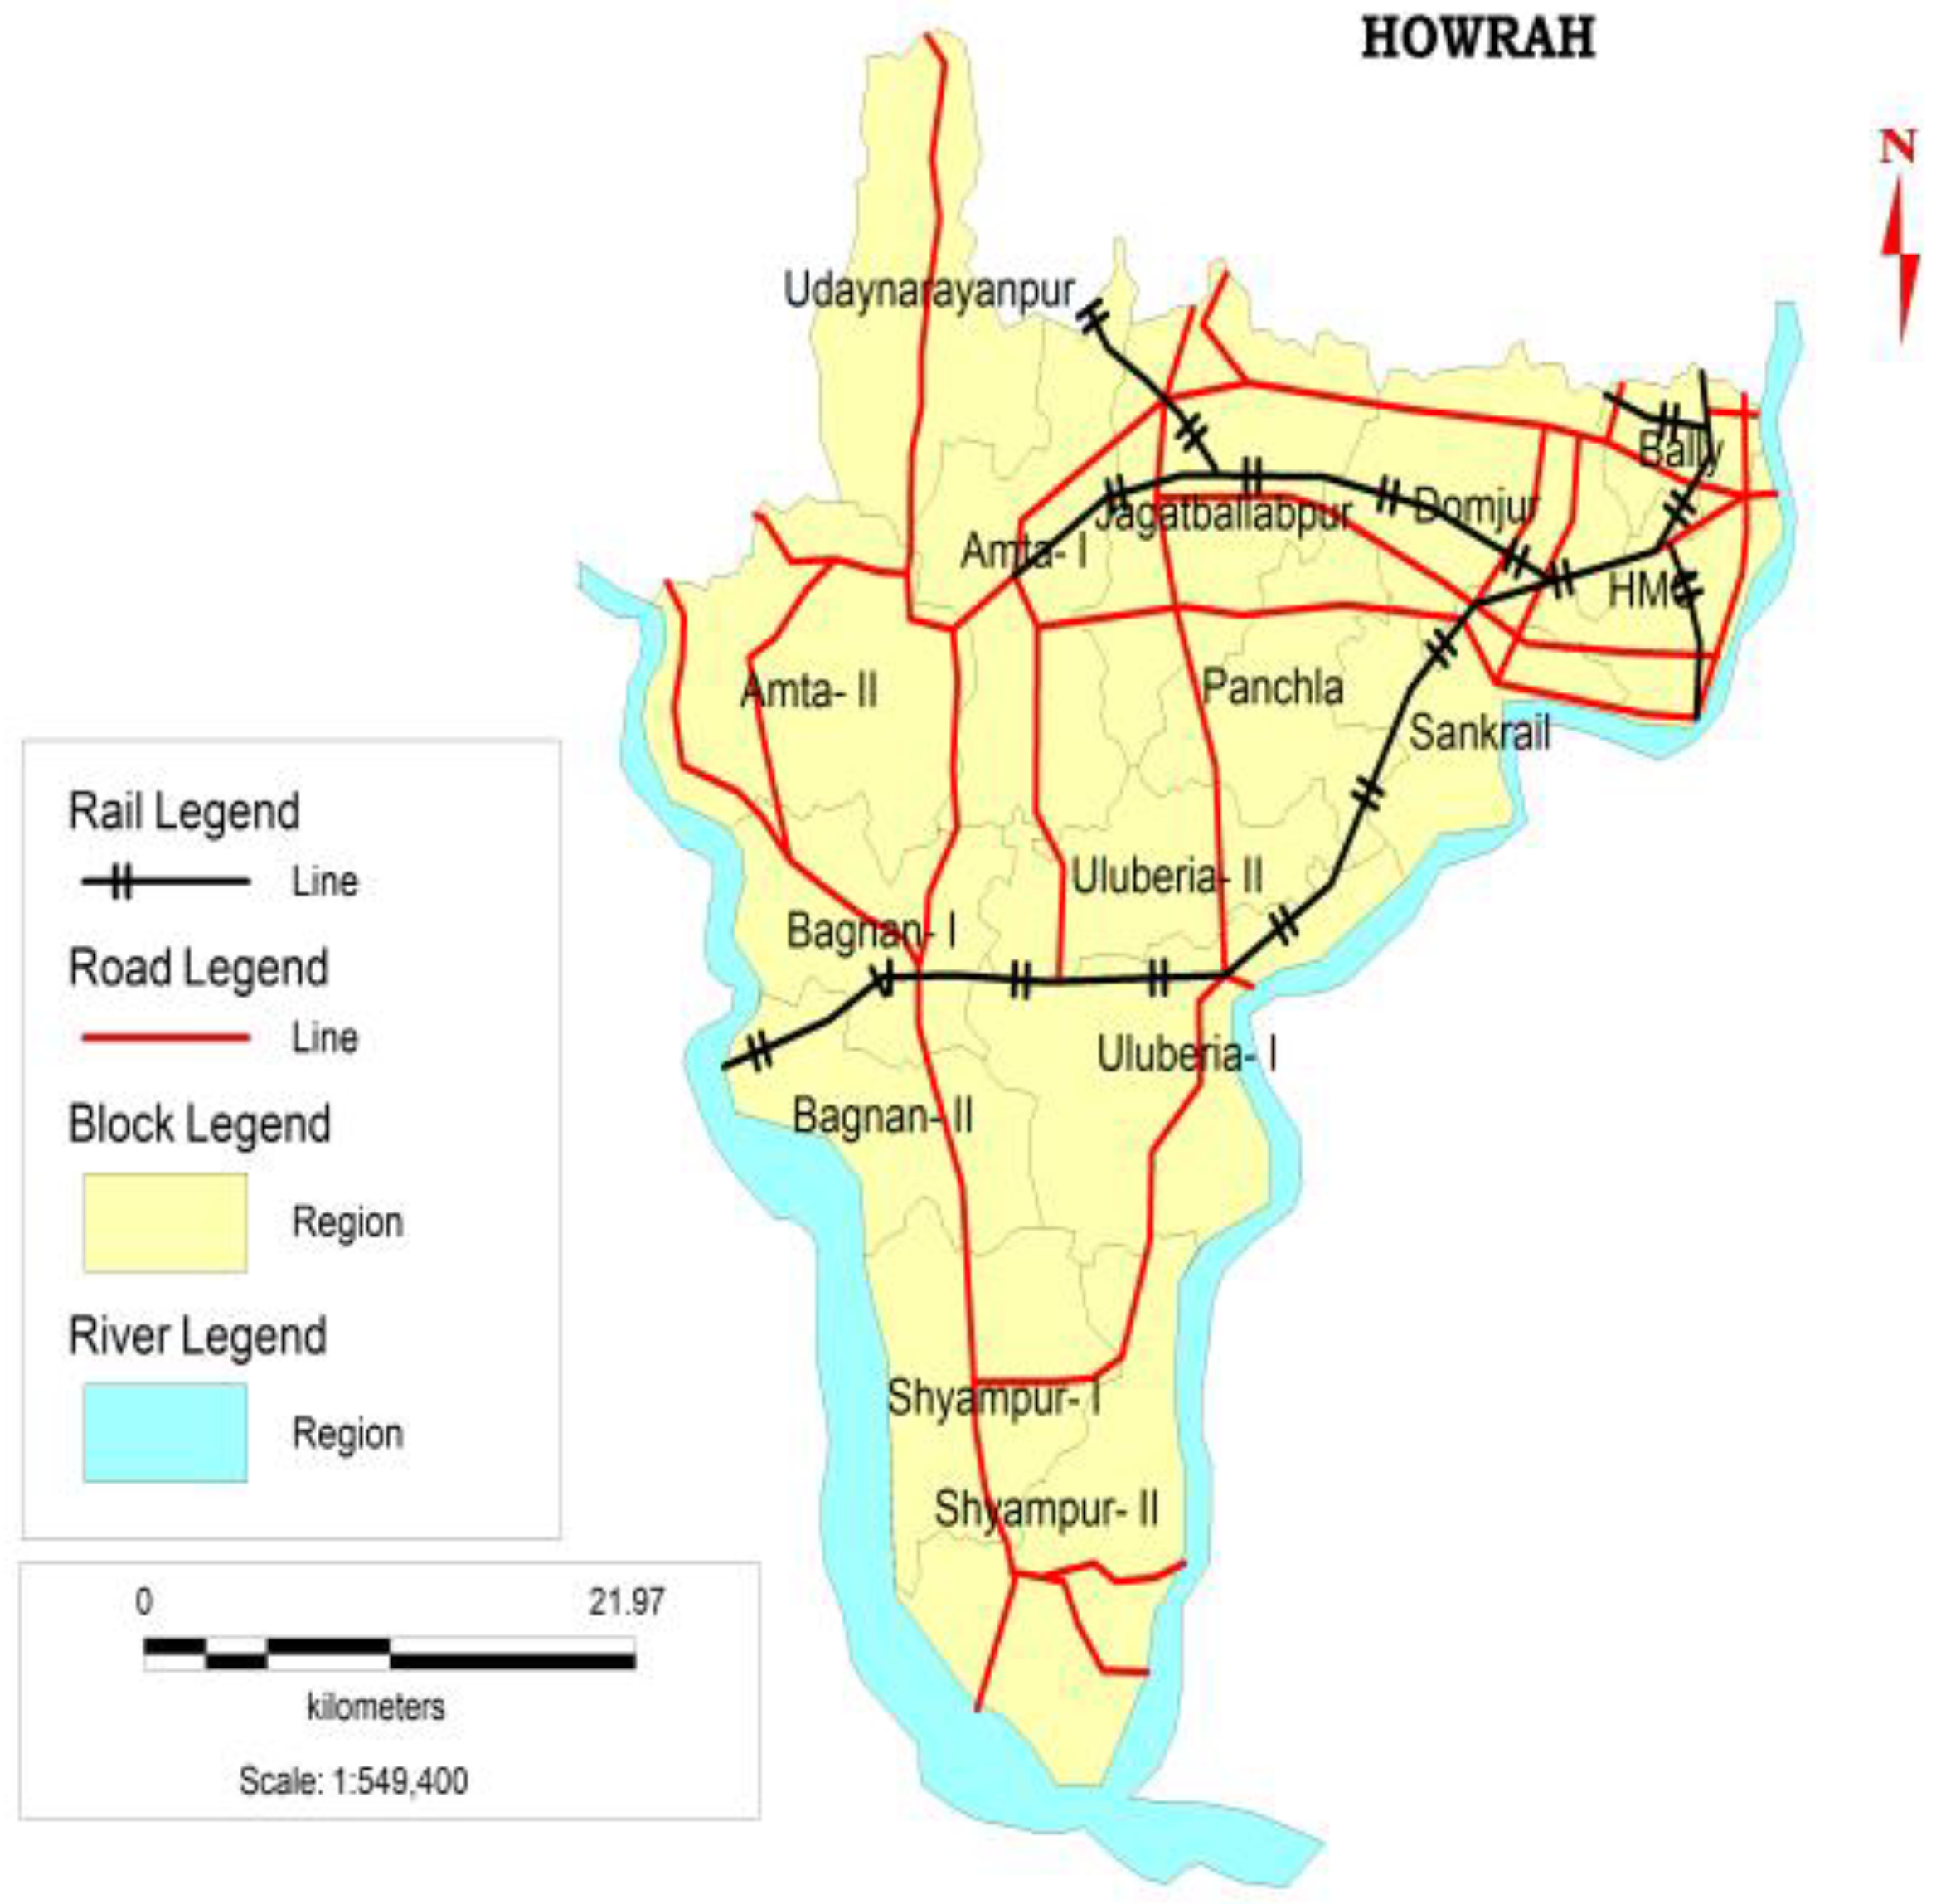
| Alternative | Nearby Location | Latitude and Longitude |
|---|---|---|
| 1. Dasnagar | HP petrol pump (Debi Service station) | 22.599152, 88.307854 |
| 2. Santragachi | HPCL petrol pump | 22.586515, 88.276026 |
| 3. Belgachia | Petrol pump | 22.603168, 88.323001 |
| 4. Howrah Maidan | Near Kabra stores | 22.581972, 88.332230 |
| 5. Liluah | Sur petrol pump | 22.625105, 88.350044 |
| 6. Kadamtala | HP petrol pump | 22.587778, 88.320151 |
| 7. Shibpur | Chowrabasti, Shibpur | 22.562826, 88.326159 |
| 8. Salkia | Malipanchghara | 22.600887, 88.349325 |
| 9. Bakultala, Shibpur | Botanical Garden west end | 22.564016, 88.288795 |
| 10. Belur | SSBPCL petrol pump | 22.639311, 88.350857 |
| Criteria | Sub-Criteria and Score | |||||
|---|---|---|---|---|---|---|
| Land cost | Cost in Million/720 ft2) | <1.50 | 1.50–2.50 | 2.50–3.50 | 3.50–4.50 | >4.50 |
| Score | 1 | 3 | 5 | 7 | 9 | |
| Operating and Management cost | In a scale of 1,3,5,7,9 | |||||
| Consumption Level | In a scale of 1,3,5,7,9 | |||||
| Construction cost | In a scale of 1,3,5,7,9 | |||||
| Public facilities | In a scale of 1,3,5,7,9 | |||||
| Emission of Greenhouse gases | In a scale of 1,3,5,7,9 | |||||
| Petrol stations | (Distance in mt.) (Using GIS) | <200 | 200–400 | 400–600 | 600–800 | >800 |
| Score | 9 | 7 | 5 | 3 | 1 | |
| Transportation stations | (Distance in mt.) (Using GIS) | <250 | 250–500 | 500–750 | 750–1000 | >1000 |
| Score | 9 | 7 | 5 | 3 | 1 | |
| Population density | (persons/km2) | <10,000 | 10,000–13,000 | 13,000–16,000 | 16,000–19,000 | >19,000 |
| Score | 1 | 3 | 5 | 7 | 9 | |
| Number of Roads | Crisp value location wise | |||||
| Road Potency | In a scale of 1,3,5,7,9 | |||||
| Parking Areas | In a scale of 1,3,5,7,9 | |||||
| Adverse impact of noise and electromagnetic field due to construction of electric vehicle charging station | In a scale of 1,3,5,7,9 | |||||
| Linguistic Terms | 1–9 Scale | Hexagonal Fuzzy Number (HFN) |
|---|---|---|
| Equally Important (EI) | 1 | 1 |
| Weakly Important (WI) | 2 | (1.1,1.2,1.3,1.4,1.5,1.6) |
| Moderately Important (MI) | 3 | (1.8,2,2.2,2.5,2.7,3) |
| Strongly Important (SI) | 5 | (2.9,3,3.2,3.3,3.5, 3.9) |
| Very Strongly Important (VSI) | 7 | (3.6,4,4.1,4.4,4.5, 4.8) |
| Absolutely Important (AI) | 9 | (4.6,4.8,5,5.2,5.4, 5.7) |
| Absolutely Unimportant (AUI) | 1/9 | (0.17, 0.18, 0.19, 0.2, 0.21, 0.22) |
| Very Strongly Unimportant | 1/7 | (0.21, 0.22, 0.23, 0.24, 0.25, 0.28) |
| Strongly Unimportant | 1/5 | (0.26, 0.28, 0.3, 0.31, 0.33, 0.34) |
| Moderately Unimportant | 1/3 | (0.33, 0.37, 0.4, 0.45, 0.5, 0.55) |
| Factors | Economic Factors (C1) | Environmental Factors (C2) | Traffic Factors (C3) | Societal Factors (C4) | ||||
|---|---|---|---|---|---|---|---|---|
| Decision Makers (DMs) | DM1 | DM2 | DM1 | DM2 | DM1 | DM2 | DM1 | DM2 |
| Economic Factors (C1) | EI | EI | AUI | VSUI | SUI | VSUI | SUI | AUI |
| Environmental Factors (C2) | AI | VSI | EI | EI | SI | VSI | EI | MUI |
| Traffic Factors(C3) | SI | VSI | SUI | VSUI | EI | EI | SUI | VSUI |
| Societal Factors (C4) | SI | AI | EI | MI | SI | VSI | EI | EI |
| FACTORS | ECONOMIC | ENVIRONMENTAL | TRAFFIC | SOCIETAL |
|---|---|---|---|---|
| ECONOMIC | 1 | 0.22 | 0.27 | 0.22 |
| ENVIRONMENTAL | 4.7 | 1 | 3.8 | 0.74 |
| TRAFFIC | 3.8 | 0.27 | 1 | 0.27 |
| SOCIETAL | 3.8 | 1.74 | 3.8 | 1 |
| FACTORS | ECONOMIC | ENVIRONMENTAL | TRAFFIC | SOCIETAL | SUM | E/Sum |
|---|---|---|---|---|---|---|
| ECONOMIC | 0.065 | 0.081 | 0.038 | 0.095 | 0.278 | 4.276795 |
| ENVIRONMENTAL | 0.305 | 0.366 | 0.529 | 0.318 | 1.518 | 4.148243 |
| TRAFFIC | 0.247 | 0.099 | 0.139 | 0.116 | 0.601 | 4.313789 |
| SOCIETAL | 0.247 | 0.637 | 0.529 | 0.430 | 1.843 | 4.287043 |
| Factors Fuzzy Weight | Sub-Factor Fuzzy Weight | Global Weight |
|---|---|---|
| C1 = (0.04, 0.05, 0.07, 0.07, 0.10, 0.11) | C11 = (0.06, 0.07, 0.1, 0.11, 0.18, 0.20) C12 = (0.09, 0.11, 0.16, 0.17, 0.29, 0.32) C13 = (0.13, 0.15, 0.24, 0.25, 0.41, 0.46) C14 = (0.03, 0.04, 0.06, 0.06, 0.09, 0.10) C15 = (0.23, 0.27, 0.41, 0.43, 0.68, 0.76) | C11 = (0.003, 0.003, 0.007, 0.008, 0.018, 0.021) C12 = (0.004, 0.005, 0.011, 0.012, 0.028, 0.035) C13 = (0.006, 0.007, 0.016, 0.018, 0.040, 0.050) C14 = (0.001, 0.002, 0.004, 0.004, 0.009, 0.011) C15 = (0.01, 0.012, 0.027, 0.030, 0.067, 0.082) |
| C2 = (0.21, 0.23, 0.35, 0.38, 0.54, 0.58) | C21 = (0.084, 0.09, 0.114, 0.125, 0.155, 0.177) C22 = (0.17, 0.19, 0.24, 0.26, 0.34, 0.39) C23 = (0.41, 0.46, 0.59, 0.65, 0.83, 0.93) | C21 = (0.02, 0.02, 0.04, 0.05, 0.08, 0.10) C22 = (0.04, 0.04, 0.08, 0.10, 0.19, 0.23) C23 = (0.08, 0.11, 0.21, 0.24, 0.45, 0.54) |
| C3 = 0.09, 0.10, 0.14, 0.15, 0.20, 0.22) | C31 = (0.07, 0.08, 0.1.0.11, 0.14, 0.16) C32 = (0.493, 0.55, 0.66, 0.71, 0.86, 0.96) C33 = (0.142, 0.16, 0.197, 0.214, 0.27, 0.31) | C31 = (0.007, 0.008, 0.014, 0.016, 0.03, 0.035) C32 = (0.045, 0.054, 0.09, 0.104, 0.18, 0.21) C33 = (0.013, 0.015, 0.027, 0.031, 0.055, 0.07) |
| C4 = (0.26, 0.27, 0.42, 0.45, 0.69, 0.76) | C41 = (0.3, 0.3, 0.49, 0.50, 0.82, 0.87) C42 = (0.3, 0.3, 0.43, 0.43, 0.61, 0.63) | C41 = (0.08, 0.082, 0.202, 0.226, 0.57, 0.66) C42 = (0.08, 0.082, 0.18, 0.195, 0.42, 0.48) |
| Locations | Sub-Factors | ||||||||||||
|---|---|---|---|---|---|---|---|---|---|---|---|---|---|
| C11 | C12 | C13 | C14 | C15 | C21 | C22 | C23 | C31 | C32 | C33 | C41 | C42 | |
| Dasnagar (S1) | M | L | L | M | M | VL | 9 | 9 | 3 | H | M | VL | L |
| Santragachi(S2) | H | L | L | M | L | VL | 9 | 7 | 1 | VH | H | VL | L |
| Belgachia (S3) | M | M | VL | M | VL | H | 9 | 3 | 2 | H | L | H | M |
| Howrah Maidan (S4) | VH | VH | VH | VH | VH | VH | 7 | 7 | 4 | VH | L | VH | VH |
| Liluah (S5) | H | H | M | VH | VH | H | 9 | 5 | 1 | M | L | H | H |
| Kadamtala (S6) | H | H | H | H | H | H | 9 | 1 | 2 | M | L | VH | M |
| Shibpur (S7) | H | H | VH | H | H | M | 9 | 1 | 1 | M | L | M | H |
| Salkia (S8) | H | VH | VH | VH | H | VH | 5 | 1 | 2 | M | L | VH | VH |
| Bakultala (S9) | M | L | H | H | L | L | 9 | 1 | 1 | L | L | L | M |
| Belur (S10) | M | M | M | M | L | H | 9 | 3 | 1 | M | L | H | H |
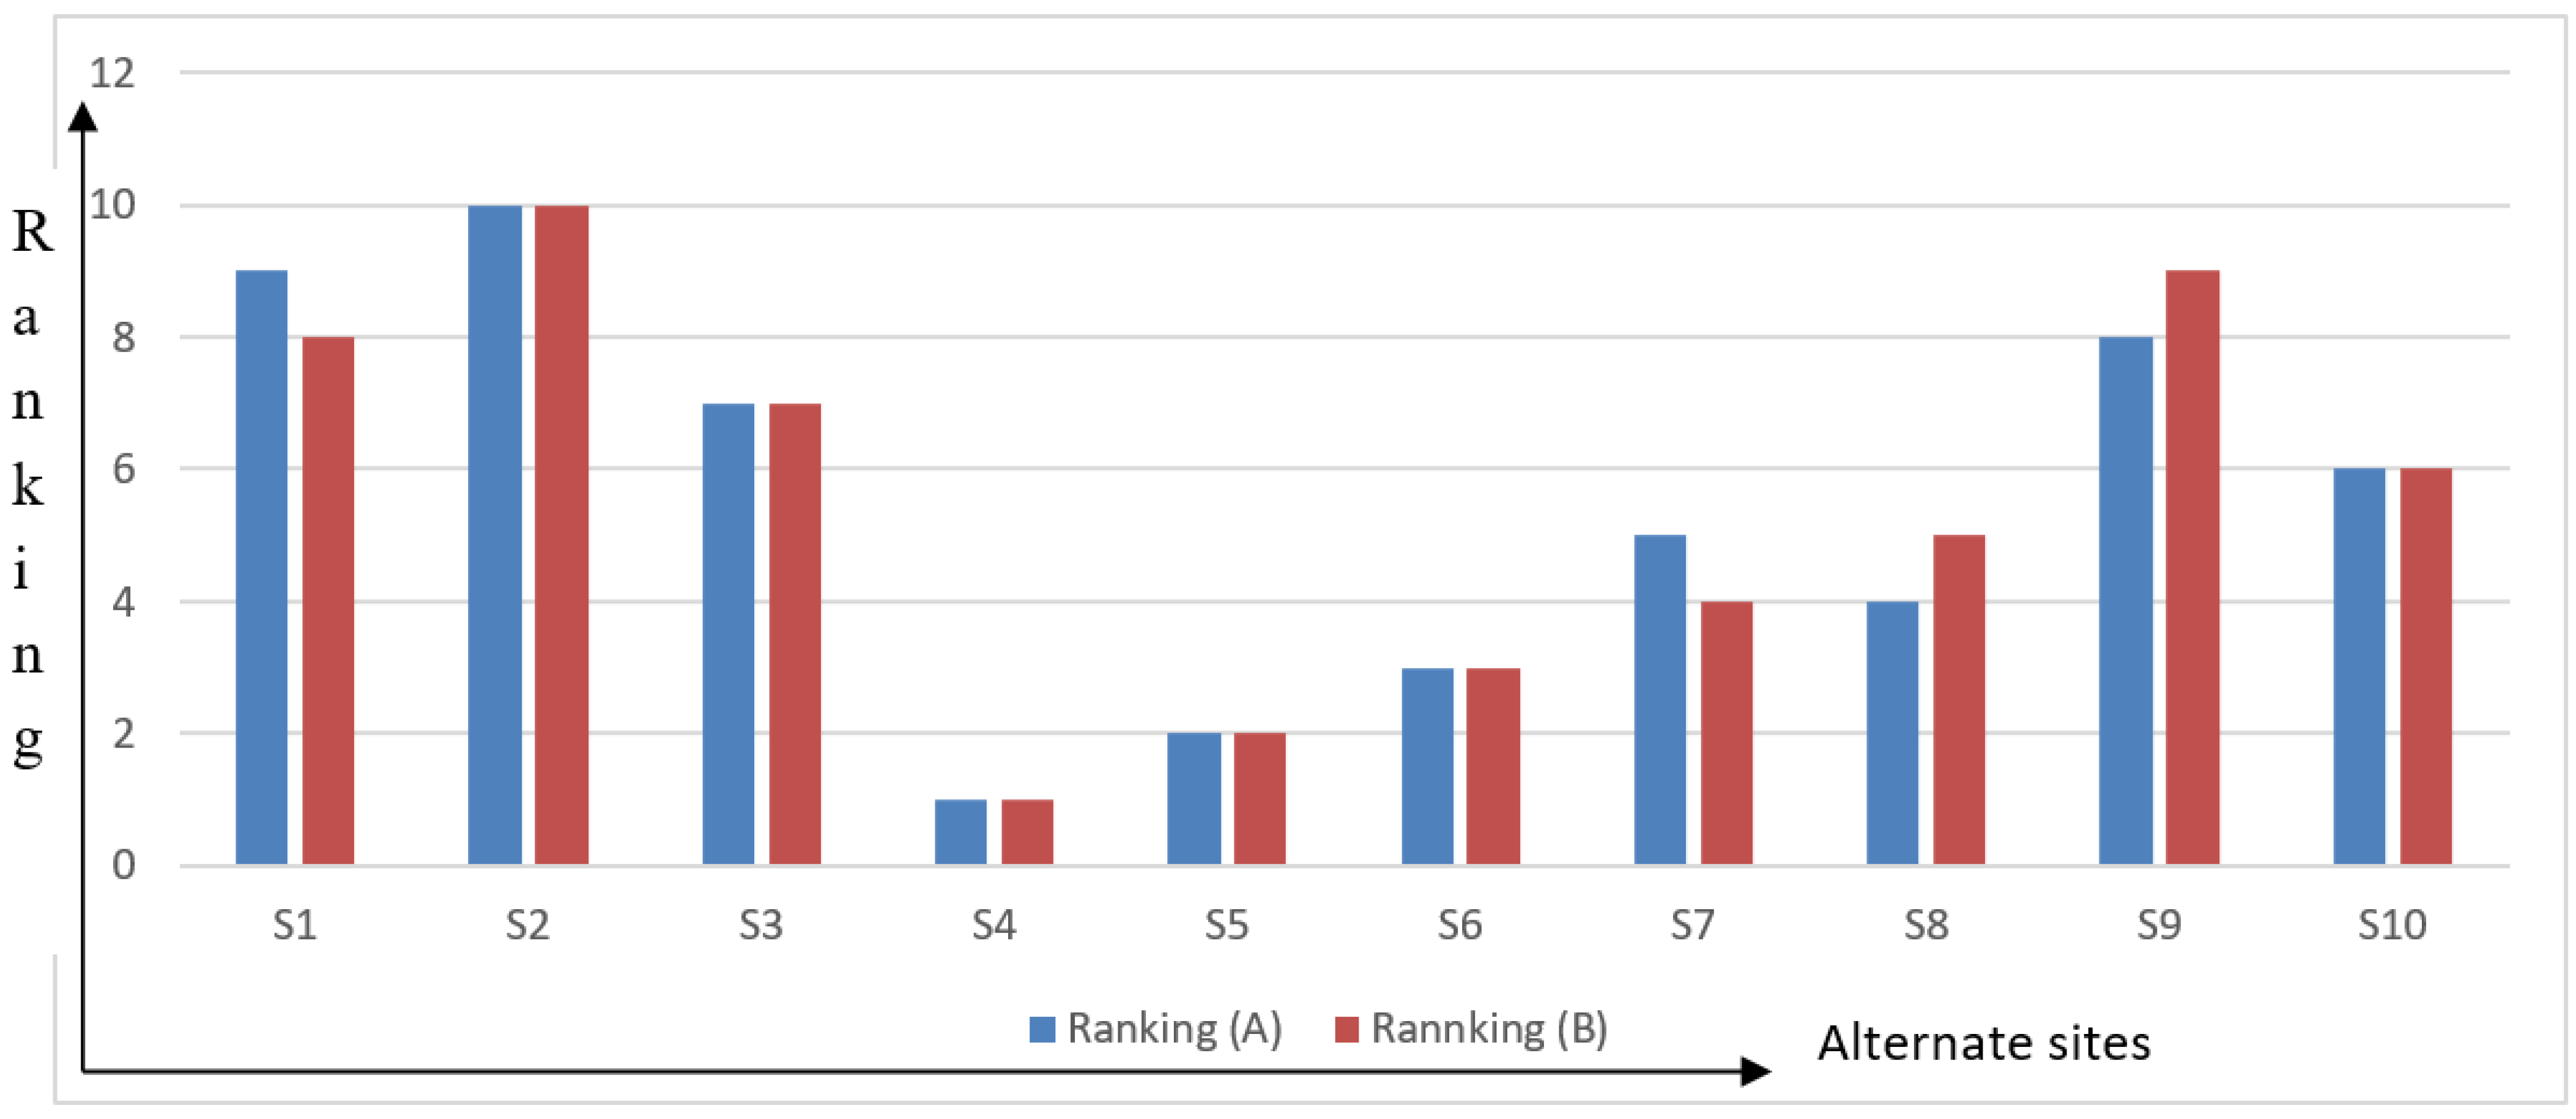
| Alternatives | Ranking | |||
|---|---|---|---|---|
| Dasnagar (S1) | 0.441 | 0.264 | 0.375 | 8 |
| Santragachi (S2) | 0.468 | 0.238 | 0.337 | 9 |
| Belgachia (S3) | 0.271 | 0.435 | 0.616 | 4 |
| Howrah Maidan (S4) | 0.058 | 0.647 | 0.918 | 1 |
| Liluah (S5) | 0.184 | 0.522 | 0.739 | 2 |
| Kadamtala (S6) | 0.302 | 0.404 | 0.572 | 6 |
| Shibpur (S7) | 0.285 | 0.422 | 0.596 | 5 |
| Salkia (S8) | 0.259 | 0.446 | 0.633 | 3 |
| Bakultala (S9) | 0.379 | 0.328 | 0.464 | 7 |
| Belur (S10) | 0.239 | 0.468 | 0.662 | 3 |
| Alternatives | R+g | R−g | Rg | R | Ranking |
|---|---|---|---|---|---|
| Dasnagar (S1) | 0.68 | 0.19 | 0.691 | 77.98 | 7 |
| Santragachi (S2) | 0.66 | 0.19 | 0.703 | 79.35 | 6 |
| Belgachia (S3) | 0.59 | 0.08 | 0.707 | 79.82 | 5 |
| Howrah Maidan (S4) | 0.75 | 0.06 | 0.886 | 100.00 | 1 |
| Liluah (S5) | 0.65 | 0.07 | 0.778 | 87.82 | 2 |
| Kadamtala (S6) | 0.55 | 0.07 | 0.680 | 76.81 | 9 |
| Shibpur (S7) | 0.58 | 0.08 | 0.685 | 77.33 | 8 |
| Salkia (S8) | 0.58 | 0.06 | 0.716 | 80.82 | 4 |
| Bakultala (S9) | 0.52 | 0.10 | 0.614 | 69.34 | 10 |
| Belur (S10) | 0.62 | 0.08 | 0.732 | 82.66 | 3 |
Publisher’s Note: MDPI stays neutral with regard to jurisdictional claims in published maps and institutional affiliations. |
© 2021 by the authors. Licensee MDPI, Basel, Switzerland. This article is an open access article distributed under the terms and conditions of the Creative Commons Attribution (CC BY) license (http://creativecommons.org/licenses/by/4.0/).
Share and Cite
Ghosh, A.; Ghorui, N.; Mondal, S.P.; Kumari, S.; Mondal, B.K.; Das, A.; Gupta, M.S. Application of Hexagonal Fuzzy MCDM Methodology for Site Selection of Electric Vehicle Charging Station. Mathematics 2021, 9, 393. https://doi.org/10.3390/math9040393
Ghosh A, Ghorui N, Mondal SP, Kumari S, Mondal BK, Das A, Gupta MS. Application of Hexagonal Fuzzy MCDM Methodology for Site Selection of Electric Vehicle Charging Station. Mathematics. 2021; 9(4):393. https://doi.org/10.3390/math9040393
Chicago/Turabian StyleGhosh, Arijit, Neha Ghorui, Sankar Prasad Mondal, Suchitra Kumari, Biraj Kanti Mondal, Aditya Das, and Mahananda Sen Gupta. 2021. "Application of Hexagonal Fuzzy MCDM Methodology for Site Selection of Electric Vehicle Charging Station" Mathematics 9, no. 4: 393. https://doi.org/10.3390/math9040393
APA StyleGhosh, A., Ghorui, N., Mondal, S. P., Kumari, S., Mondal, B. K., Das, A., & Gupta, M. S. (2021). Application of Hexagonal Fuzzy MCDM Methodology for Site Selection of Electric Vehicle Charging Station. Mathematics, 9(4), 393. https://doi.org/10.3390/math9040393