Abstract
This paper presents the application of simulation to assess and predict the influence of random factors of pedestrian flow and its continuity on the traffic capacity of a signal-controlled intersection during a right turn. The data were collected from the surveillance cameras of 25 signal-controlled intersections in the city of Chelyabinsk, Russia, and interpreted by a neural network. We considered the influence of both the intensity of the pedestrian flow and its continuity on the traffic capacity of a signal-controlled intersection in the stochastic approach, provided that the flow of vehicles is redundant. We used a reasonably minimized regression model as the basis for our intersection models. At the first stage, we obtained and tested a simulated continuous-stochastic intersection model that accounts for the dynamics of traffic flow. The second approach, due to the unpredictability of pedestrian flow, used a relevant method for analysing traffic flows based on the fuzzy logic theory. The second was also used as the foundation to build and graphically demonstrate a computer model in the fuzzy TECH suite for predictive visualization of the values of a traffic flow crossing a signal-controlled intersection. The results of this study can contribute to understanding the real conditions at a signal-controlled intersection and making grounded decisions on its focused control.
1. Introduction
The increasing number of vehicles in urban areas is leading to increased road congestions, accidents, unwanted delays, and environmental pollution. In the conditions of infrastructural urban constraints, traditional traffic management and control systems fail to cope with this problem. Traffic lights at intersections are often non-adaptive and have fixed time delays. There is a need for an optimized and intelligent control system that would improve traffic efficiency.
The management of road network objects with traffic light signalling involves determining the number and sequence of control phases, drawing up basic diagrams of the vehicles and pedestrian movement at each phase, and calculating the duration of steps and phases that form a control cycle. Justified management decisions in this area are generally grounded on computer simulations according to models based on real-time monitoring of transport network objects by road cameras [1,2,3]. Intelligent transport systems estimate traffic density and modify traffic lights according to the traffic rate.
Many previous studies have focused on quantifying the variations in the total volume of the traffic flow attributed to several random parameters such as weather factors and pedestrian flow and its continuity [4,5,6,7].
Related Works
Currently, the traffic capacity of the road transport network is optimized based on an analysis of traffic flows and its categorical content. Traffic monitoring and computer vision cameras are built into automated systems to analyse traffic flows with various parameters [8,9,10] and diagnose pedestrian crossings [3,11,12].
Echab and Ez-Zahraouy [8] studied the throughput and built phase diagrams and space–time and density profiles to identify various traffic states and the phase transition features. Jingxin and Mei [9] studied the separation of the phases of continuous traffic flow and determined that the flow density, rather than speed, has the predominant influence on the cluster groups of the flow. Their proposed method of clustering flow phases is based on continuous traffic data from the detectors.
Jeon et al. [10] proposed an automated intelligent method for controlling traffic flows at an intersection based on their sequential video images. The simulated RL model of an intersection considered by the authors is not of less quality than the actual traffic flow accounting based on fixed video signals.
Modern computer vision tools contribute to some proactive measures, such as the detection of traffic conflicts and some violations.
Zaki et al. [3] offered a fully automated approach to the detection in continuous video of conflict indicators that lead to violations in the traffic flow.
Munder and Gavrila [11] studied the classification of pedestrian flow at transportation hubs using several classifiers, determined by the performance and efficiency of recorder receivers.
Zhang et al. [12] created a model that can predict pedestrians’ red-light crossing intentions. Their model uses computer vision detection and tracking methods and some characteristics of pedestrians are generated, including information on their location. The authors developed a short-term and long-term neural network to predict the pedestrians’ intentions on traffic violations.
Primary information is generally obtained from real-time video cameras. The ultimate purpose of this form of monitoring is to create intelligent traffic controllers and regulators able to record the presence of vehicles, pedestrians, and specific situations in a wide transport network, determined by their trajectories [13,14,15,16].
Hamdani et al. [13] considered a new model of autonomous intersection control with existing effective approaches to ensure safety on it, giving priority to pedestrian flows. The results of model experiments showed the effectiveness of the autonomous crosswalk control system proposed by the authors, even at unlit intersections, which is revealed in the reduction of traffic flow delays in relation to the conventional systems of traffic light control at intersections.
Xu et al. [14] applied the mathematical programming method to optimize the signal timing of the urban traffic network with traffic light control. In the models of traffic synchronization at intersections, a multiagent approach is used, which is based on the system of signal coordination of various agents interacting with each other to control urban traffic junctions.
Lv et al. [15] developed a methodology to derive vehicle profiles given macroscopic inputs so that Motor Vehicle Emission Simulation can be applied to estimating emissions. Then an optimization methodology of signal timing was developed and solved through the use of a genetic algorithm.
Missing traffic flow data are one of the most critical issues in the application of intelligent transportation systems. Tang et al. [17] proposed a more efficient method for reading the traffic flow data with respect to the traditional approaches of fixing data with different temporal skip coefficients in the observations. They proposed a hybrid method to fill in missing traffic flow data based on fuzzy logic methods, combining both fuzzy discontinuous traffic flow and a fuzzy neural modelling network. Experimental studies have confirmed the validity and effectiveness of the proposed method.
A fuzzy logic controller was used by [18,19,20,21] to solve the problem of dynamic uncertainty at intersections. The green-light time of each phase is dynamically decided according to the real-time traffic information to achieve the smallest average vehicle delay to enhance traffic efficiency in the intersection. The excellent performance of the design was confirmed through simulation experiments under different conditions.
Castano et al. [22] developed and implemented a set of measures using both SCANeR and MATLAB/Simulink, which identify obstacles (vehicles, pedestrians, etc.) in the transport system.
New methods are recommended for the control of signal-controlled intersections, such as fuzzy logic, artificial intelligence, cuckoo search algorithms, and differential evolution [23,24,25,26,27], which determine the time of traffic light signals and their phase changes.
Zhang and Ye [23] used the fuzzy logic system methods to forecast traffic flow.
Modelling experiments in a fuzzy logic system produced more accurate and stable traffic forecasts. The effectiveness of this approach is confirmed by obtaining predictions of various traffic flows and different operating conditions of the recording sensors.
Murat and Gedizlioglu [24,25] developed a fuzzy logic multiphased signal control model for isolated signalized intersections. A comparison showed that the performance of the FLMuSiC is better than that of both the traffic-actuated simulation and the aaSIDRA models.
Wu et al. [26] also apply fuzzy logic control methods in their modelling approaches. Their proposed “cuckoo search” algorithm is optimized by fuzzy logic methods to solve actual traffic control problems.
General computer modelling based on the simulation modelling and fuzzy logic methods has also become widespread in the analysis of the traffic situation for various fragmentary flows, from the simulation of transport and logistics systems [28,29] to the public transport policy [30,31,32].
The purpose of this study is to develop simulation models of intersections that allow us to use mathematical methods and computer programmes to carry out experiments on real-time traffic regulation and predict the traffic capacity of intersections depending on various factors.
Our study will enrich the literature related to traffic modelling and, thus, be useful in many applications of planning and operating a signal-controlled transport network.
2. Materials and Methods
In our study, we focused on analysing the influence of pedestrian traffic on the capacity of an intersection, specifically for when pedestrian and traffic flows are not separated.
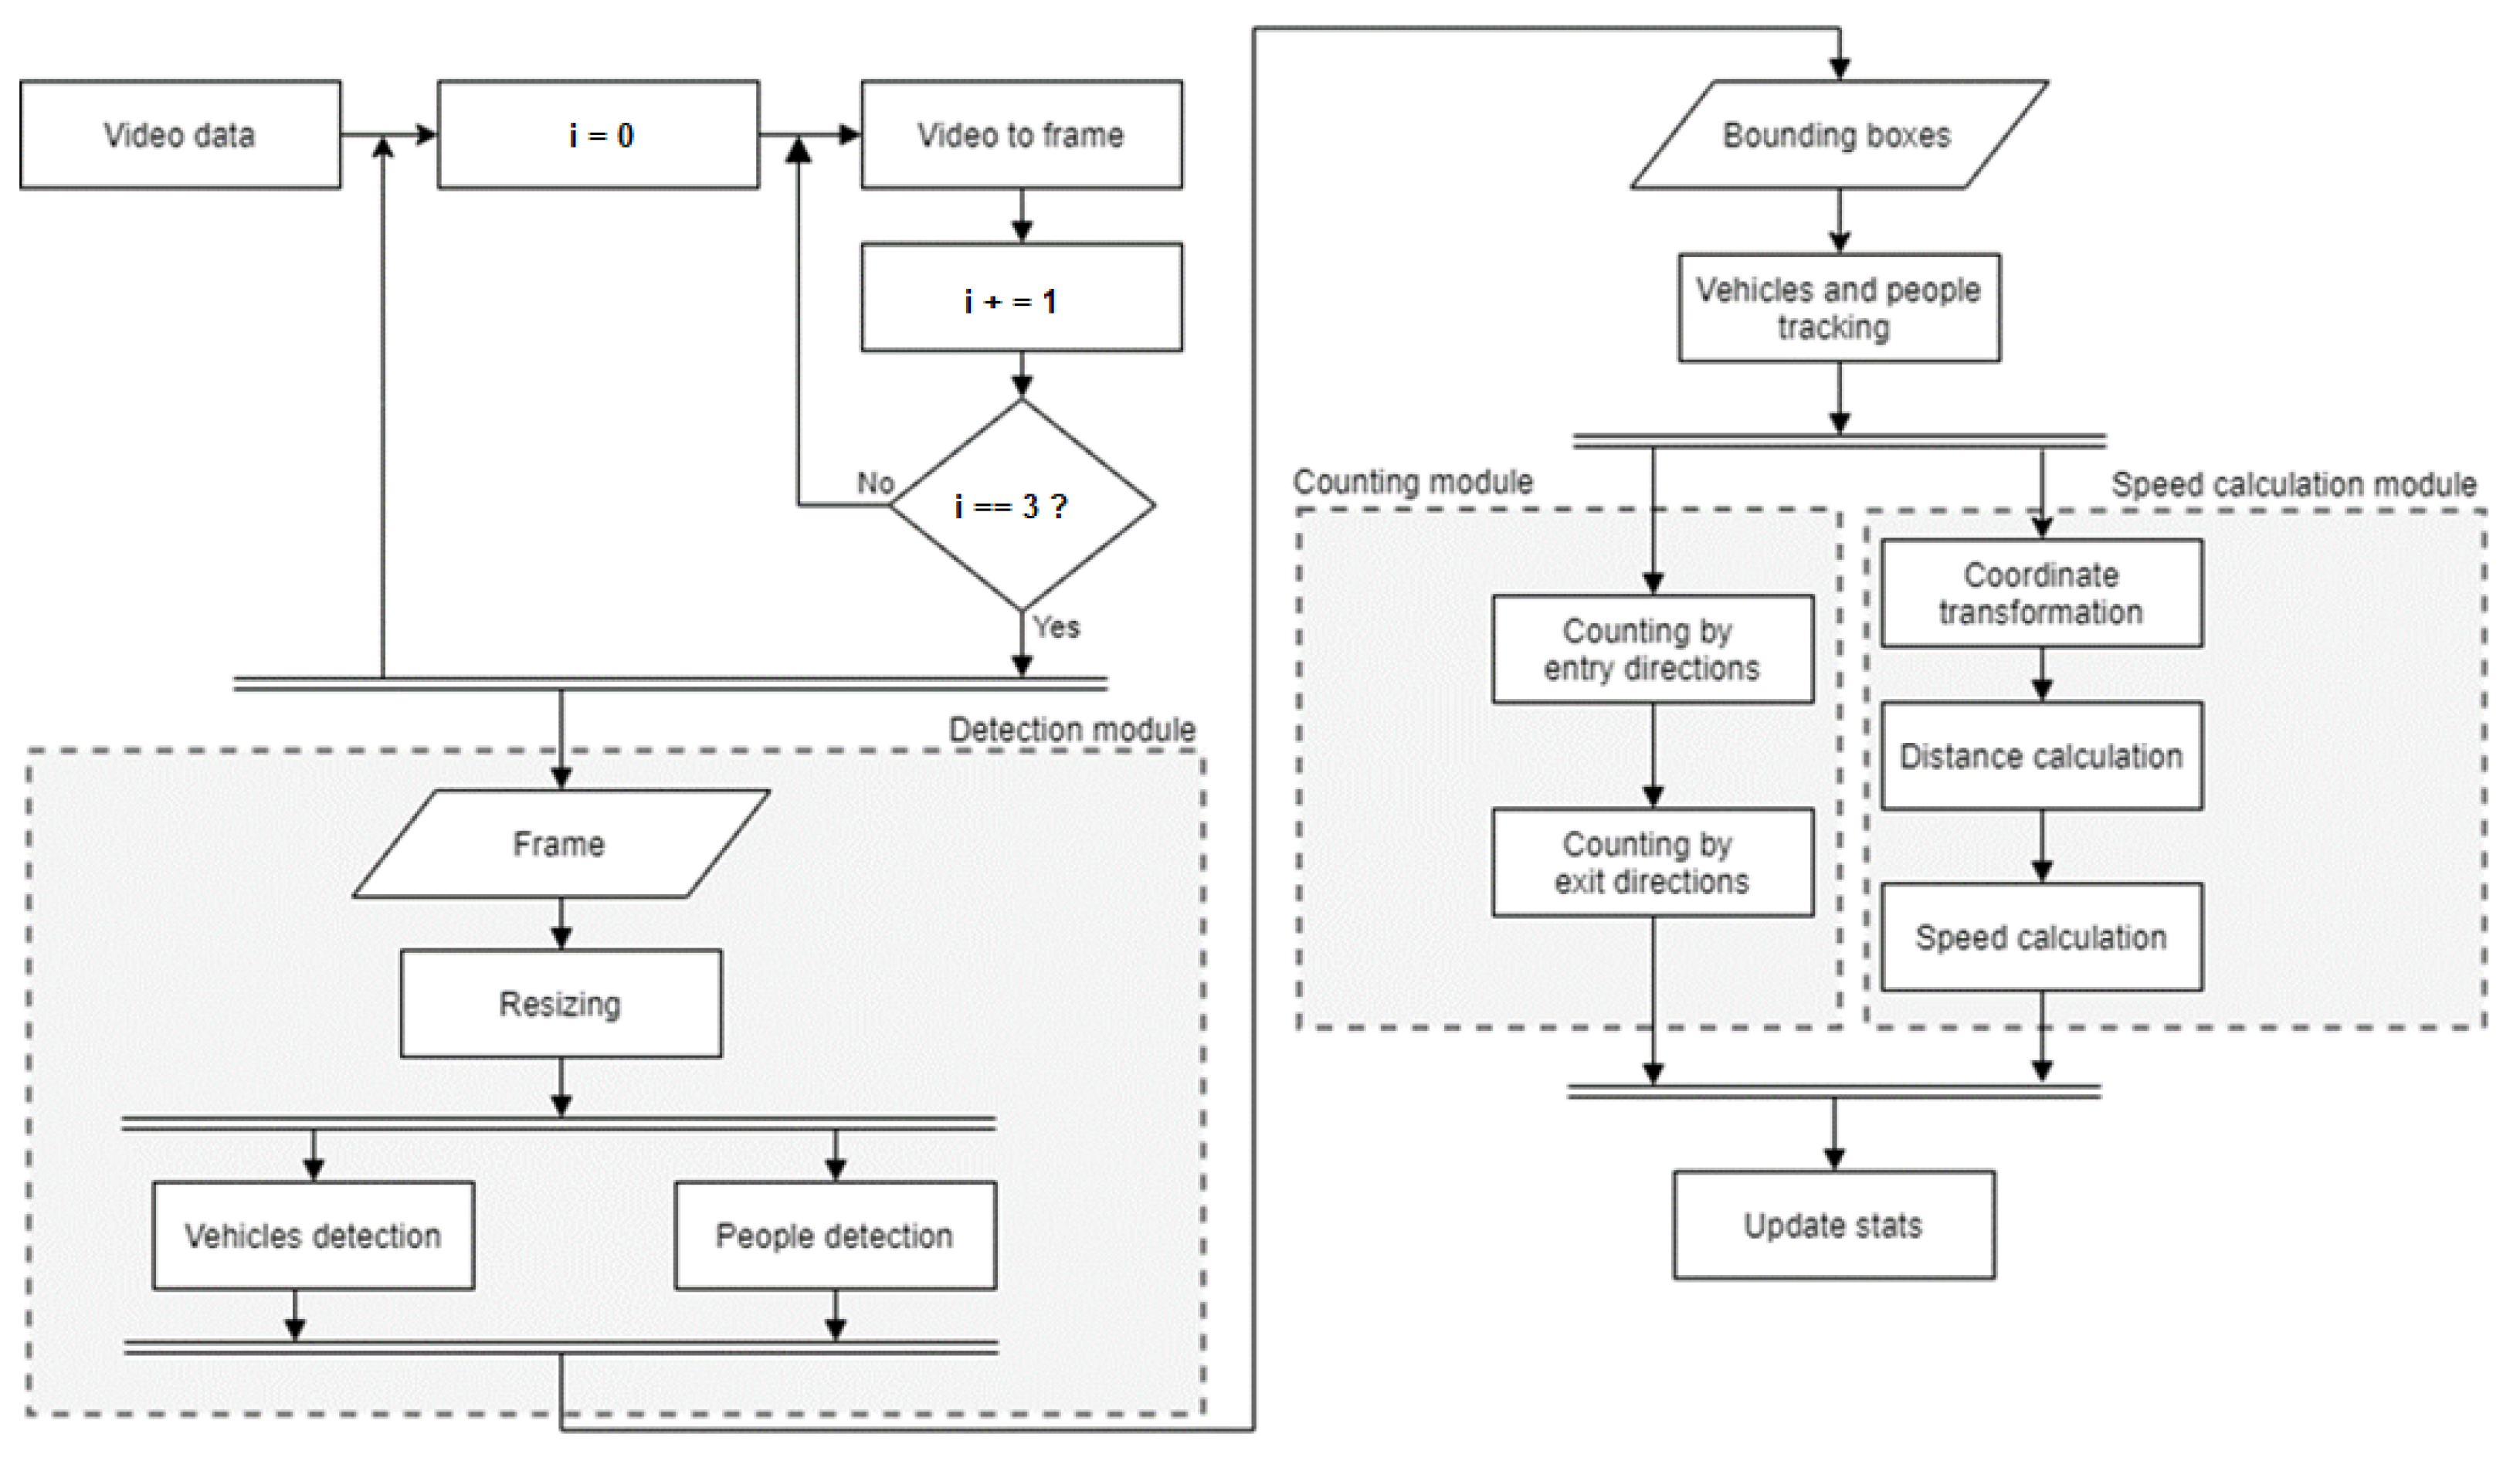
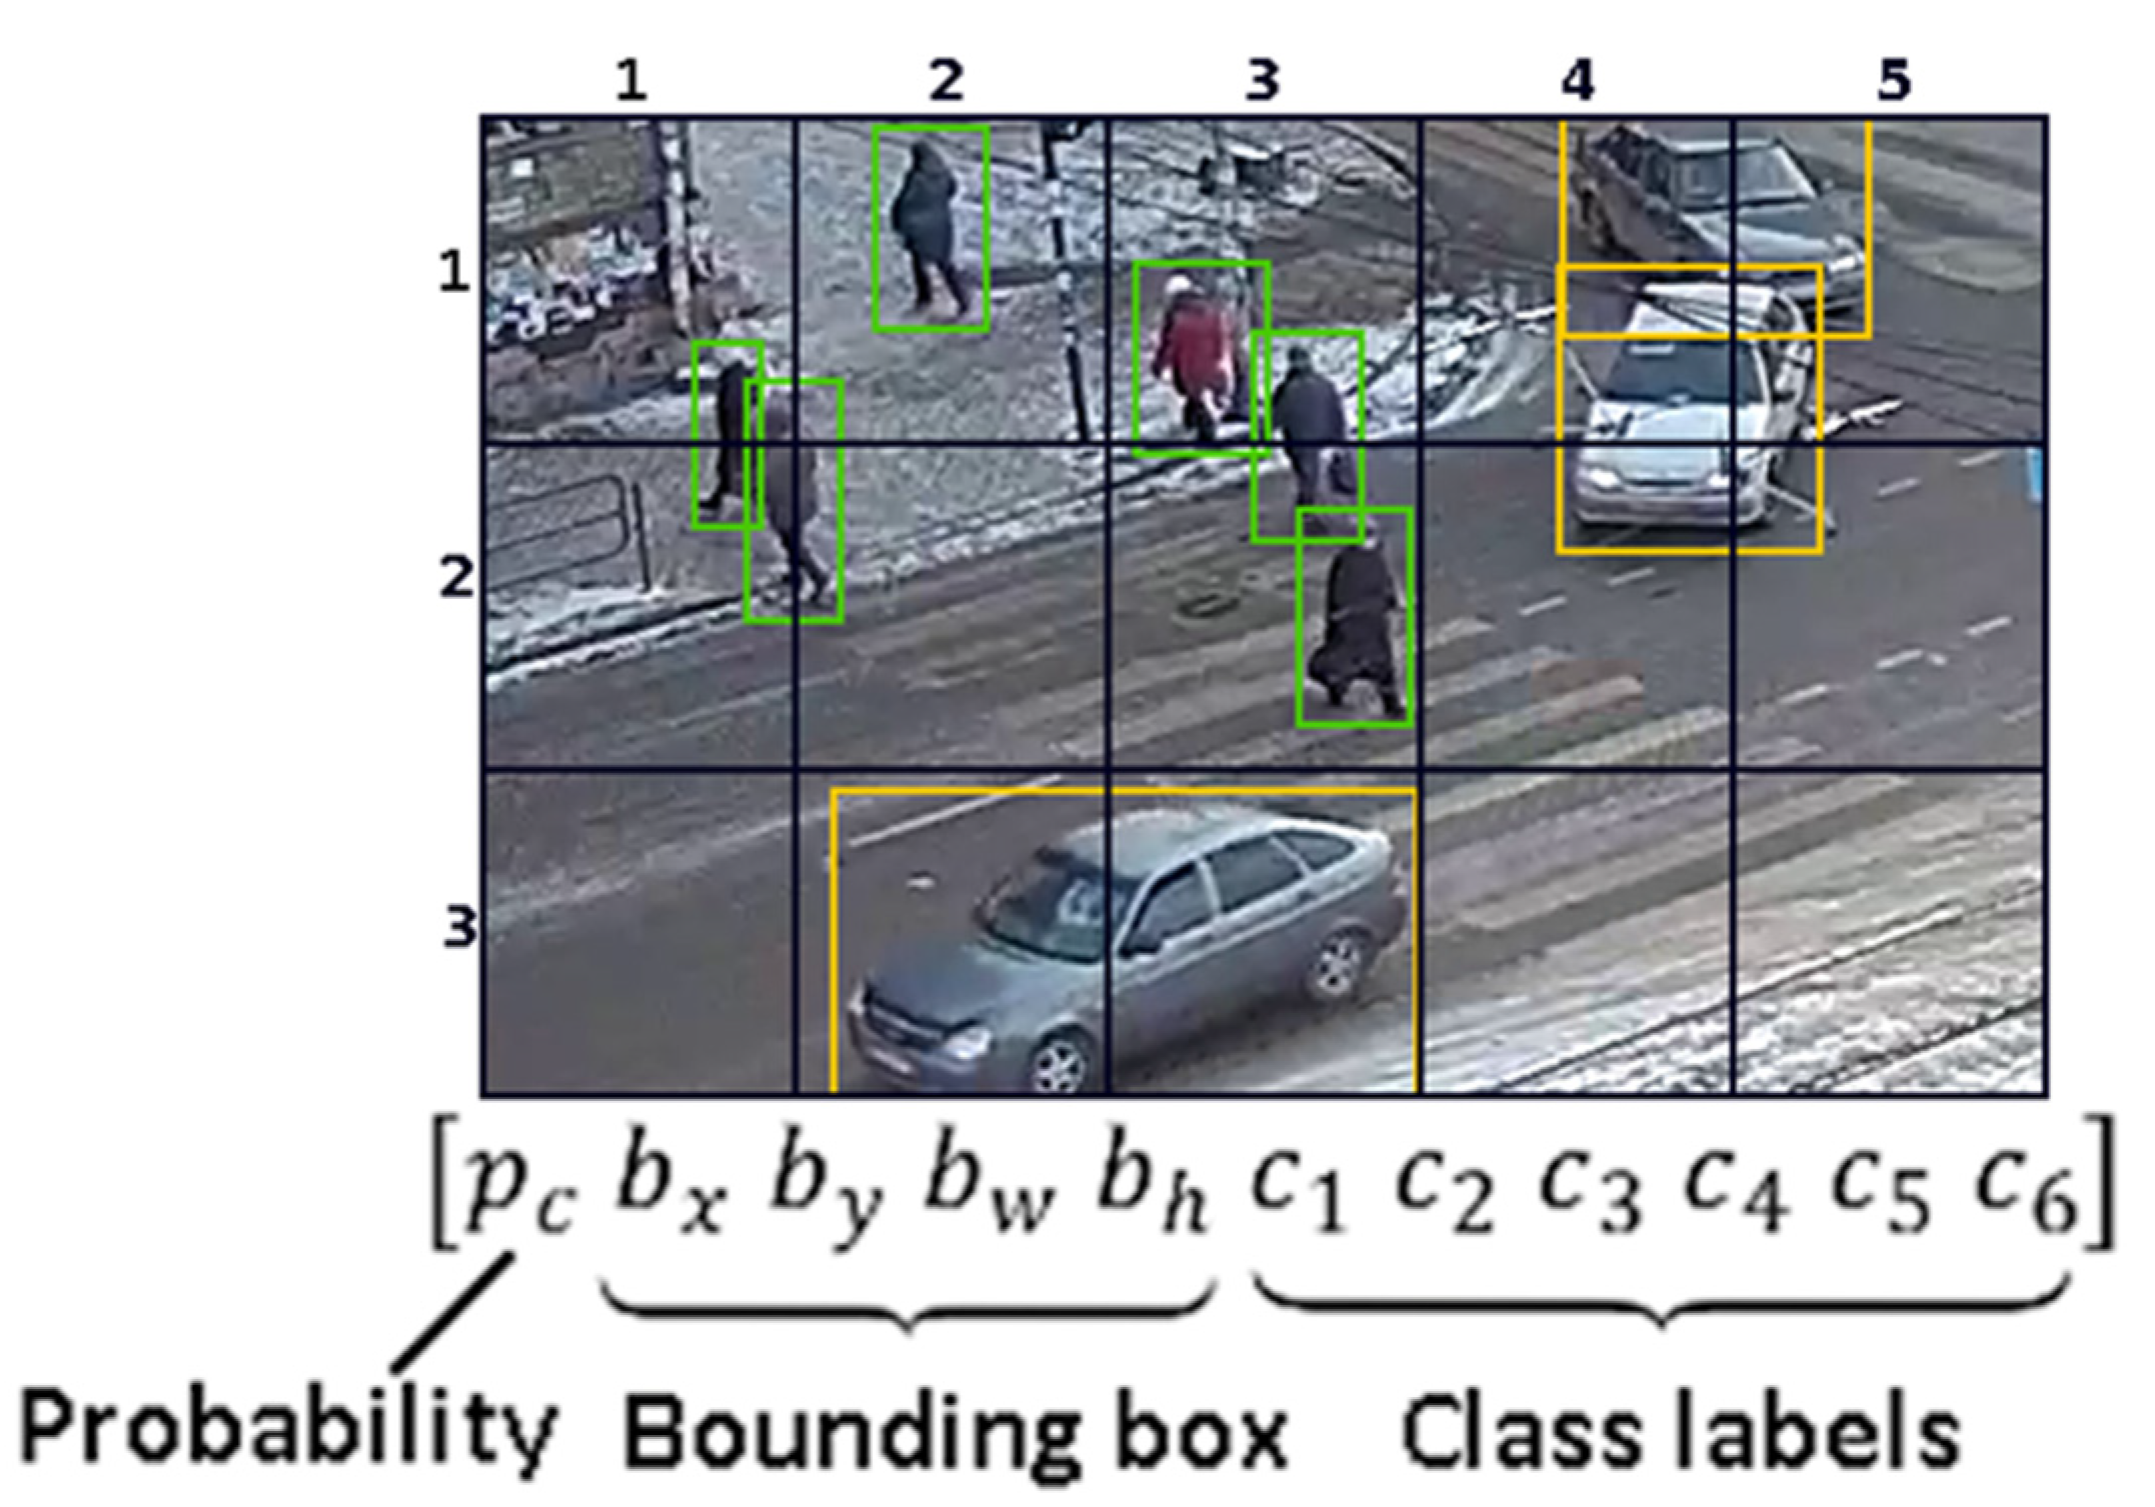
2.1. Real-Time Tracking of Vehicle and Pedestrian Movement from Street Surveillance Cameras
To collect traffic and pedestrian flow data, we developed an autonomous tracking system based on neural networks [33]. This system detects the location, trajectory, number, and movement speed of road users. The neural network architecture in our system consists of indicator detection, counting, and calculation modules. The algorithm for obtaining the data on the movement trajectory of vehicles and pedestrians is shown in Figure 1.
Figure 1.
Algorithm for determining the trajectory and speed of pedestrians and vehicles.
We collected data from street video surveillance systems mounted at varying heights and distances from the road. These systems are equipped with video cameras with a fixed frame rate, different resolutions, and resolution power. To collect the data on vehicle and pedestrian flows, we used the streets video surveillance systems with the angle of viewing of the entire functional area of the intersection.
We collected the data at signal-controlled intersections at 25 points using Intersvyaz street [34] surveillance cameras located at an altitude of 14–40 m, with an inclination angle to the horizon of 30–60°. The convolutional neural network provided processing of real-time frames (using the RTSP protocol) with a frame rate of at least 25 frames per second.
In order to detect, classify, and track the trajectory of transport vehicles and pedestrians, we tested the most adapted neural networks for these tasks: RetinaNet, YOLO v4 and SSD, and others. Based on reviews of research and hardware performance requirements for processing video streams in dynamic mode [35,36], we opted for YOLO v4. The testing, the neural network proved to be sufficiently accurate in object recognition and classification, with an image processing speed (608 × 608) of 19 frames per second.
We developed an algorithm in which the first module processes every third frame of the video stream and recognizes objects using the YOLO v4 neural network. After recognizing and classifying objects, the module of bounding boxes identifies the objects by comparing them with the data from the previous frames to determine trajectory and speed.
We solved the problem of multiple-object tracking using the open-source SORT tracker. The SORT tracker is based on two methods: the Hungarian algorithm [37] and the Kalman filter [38].
In the recognizing, tracking, and continuous matching of predicted objects, we applied the Hungarian algorithm. The Kalman filter was used to check and correct the states of the objects.
The neural network YOLO v4 and the SORT tracker provide a continuous, frame-by-frame data collection about the location of the objects, which allows us to calculate their speed and the exact distance between them.
To train the neural network, we augmented 30,000 processed images, which allowed us to increase the initial data library (DATA SET) up to 500,000 units. This approach allowed us to achieve high accuracy of recognition and to track the objects’ movement trajectory and speed within 92–96%.
Figure 2 illustrates the YOLO v4 neural network architecture and a modification of the Darknet-53 neural network, which includes 53 layers [35].
Figure 2.
The YOLO v4 network architecture.
In the task of increasing the speed of image processing by the YOLO v4 neural network, we reduced the received image in a three-dimensional tensor of size h × w × 3, where h, w are the height and length of the input image.
Apart from using ultraprecise layers, the presented YOLO v4 architecture also contains residual layers, layers with increased discretization, and skipped connections.
The neural network processes the video frame from the video flow and produces the tensor with coordinates and classification of objects within their bounding boxes (Figure 3).
Figure 3.
An output tensor.
To train the YOLO v4 neural network, we used the gradient descent backpropagation method. The following method allowed us to define the values of neuron weights in the hidden layers of the neural network. Training of the algorithm is based on the principle of epochs, and the weight changes after some set of training data to the input of the neural network, after which the error is averaged.
Our method of determining the position of pedestrians and vehicles is based on the use of the perspective transformation of mapping coordinates from cameras to a space of geographic coordinates. The developed approach allows us to detect and track the temporal relocation of vehicles and pedestrians.
2.2. A Conceptual Model of an Intersection, Right Turn
We propose completing an analysis of the traffic capacity at one signal-controlled object depending on a number of both deterministic (intersection geometry, road quality, etc.) and random influencing factors (pedestrian flow, traffic intensity, weather conditions). The conceptual block diagram of the computer simulation model for this task can be represented as follows (Figure 4).
Figure 4.
A conceptual block diagram of a signal-controlled intersection model.
This provides for the preliminary development of a mathematical model of the traffic capacity of an urban intersection depending on several influencing factors:
- constant: the geometry of the intersection, the quality of the road surface, line-of-sight interference, and other factors that are invariable over a long period of time; and
- variable or random: weather conditions, light conditions, two-way pedestrian flow, traffic intensity, and more.
This analysis requires the collection of data from many intersections of the urban signal-controlled transport network, as well as several statistical methods to reveal the general tendency of interactions—even going so far as to obtain a mathematical functional dependence.
Further, we consider a specific case of controlling a signal-controlled intersection, which is rather relevant for a densely populated city—a right turn during heavy pedestrian traffic. During a right turn, vehicle traffic is interrupted by the pedestrian flow crossing the road at a pedestrian crossing. The density, duration, and number of interruption intervals of pedestrian flow wherein vehicles can complete their turn are unpredictable. The vehicles themselves also differ in categories, which determines their response time during acceleration, their length, and the difference in the intervals between them.
To study the influence of these factors on traffic capacity, their independent influence should be shown. This can be determined only by computer simulation, since field experiments in real traffic conditions are impossible.
To construct a computer model of a right turn at a signal-controlled intersection (Figure 1), we should first simulate a specific intersection, taking into account all its parameters. Then, we should form a block of the vehicle flow and a block of the disturbing factor—an unpredictable pedestrian flow.
2.2.1. A Complete Regression Model
We will take the complete mathematical model of an intersection from a previous study [7], where it is presented in the form of a regression equation from several factors influencing the capacity:
We obtained this model based on the summary data from video surveillance cameras at 25 intersections in the city of Chelyabinsk, including both the parameters of the intersection itself and the traffic data. The 20 registered factors are reflected in columns 1 and 2 of Table 1, and the coefficients of Model (1)—in column 3.
Table 1.
Recorded intersection factors and their interconnection.
The quality of the model, as noted earlier, is estimated by the value R2 = 0.902. This means that 92% of the dispersion in the original data is explained by this model. This is a very high value, confirming the high quality of the complete model constructed for many different intersections.
Additional calculations in the professional SPSS suite also revealed standardized coefficients for the complete model (1) characterizing the relative power of influence of each factor on the dependent variable (column 4 in Table 1). These calculations will be important when selecting the essential influencing factors to further predict vehicle flow.
An additional correlation analysis (Pearson’s parametric correlation coefficients) revealed the degree of influence of the factors on the traffic capacity of an intersection. Its results are shown in column 5 of Table 1. Here, paired connections are highlighted in dark grey. They are not statistically significant at the generally accepted error level of 5%. As expected, the main influence on the traffic capacity is the duration of the green traffic light (x1) and the number of pedestrians (x5, x6). Notably, the geometry of the intersection determines its individuality (x2, x3, x4) and must be considered for the subsequent minimization of the intersection model.
2.2.2. Minimization of the Regression Model
For the practical application of the model, we advise that the model be reduced by discarding several factors that are secondary in terms of their influence on the traffic capacity and do not correspond to the problem statement. Ultimately, we advise leaving the physically necessary factors—the intersection geometry, pedestrian flow, and its instability factors.
The mathematical regression model takes the following final form:
where x1 is the duration of the green traffic light; x2, x3 is the intersection geometry; x5, x6 is the number of pedestrians to the right and to the left; x16 is the time of vehicle movement along the intersection arc; x18 is the time required for the vehicle to leave the pedestrian crossing; x20 is the maximum number of vehicles that pass without pedestrians.
The quality of such a reduced model, as expected, is somewhat lower at R2 = 0.747. The statistical significance of the model is 0.1%, which, despite the reduction of the model, confirms an acceptable level of quality and a high level of statistical confidence. This minimized model will be used further as a static basis for computer simulation.
2.3. Simulation Modelling
Simulation models are a generally accepted approach to obtaining clear results quickly in a time-based sweep. Such models are presented in the form of a diagram consisting of typical blocks of the MATLAB software suite for the Simulink application.
2.3.1. A Static Intersection Model
According to the minimized regression model, the enlarged simulation model for the static version of the problem can be represented as the following diagram (Figure 5). This model implies vehicle arrival flow, but it is not further simulated. Flow is determined by other parameters and assumed to be unlimited, which corresponds to a practical road congestion situation.
Figure 5.
A static simulation model of a signal-controlled intersection.
In the centre of the diagram, the adder block implements a static regression model according to Equation (2); pedestrians (x5) and vehicle flow simulate external factors, and the right side of the model integrally accumulates the vehicle flow under the initial conditions (x14). Numerical values characterizing one specific intersection are set as the initial data (xi).
2.3.2. A Continuous-Stochastic Pedestrian Flow Model
We apply a continuous-stochastic model (Q-scheme), setting the uncertainty in the pedestrian arrival flow, to closely approximate real-world conditions. To this end, we supplement the model with a block for generating a random pedestrian flow with a uniform distribution law, which provides for a preset probability value (constant x5 block). A complete model of a random pedestrian flow is shown in Figure 6.
Figure 6.
A stochastic pedestrian flow model.
Figure 7a shows the quality of generating a random signal by the URN block linked to real pedestrian flow. Figure 7b shows a variable simulating a pedestrian flow with a probability of 0.2 (the upper level corresponds to the presence of pedestrians).
Figure 7.
Generation of a random pedestrian flow with a probability of 0.2: (a) the quality of generating a random signal by the URN block linked to real pedestrian flow; (b) a variable simulating a pedestrian flow with a probability of 0.2.
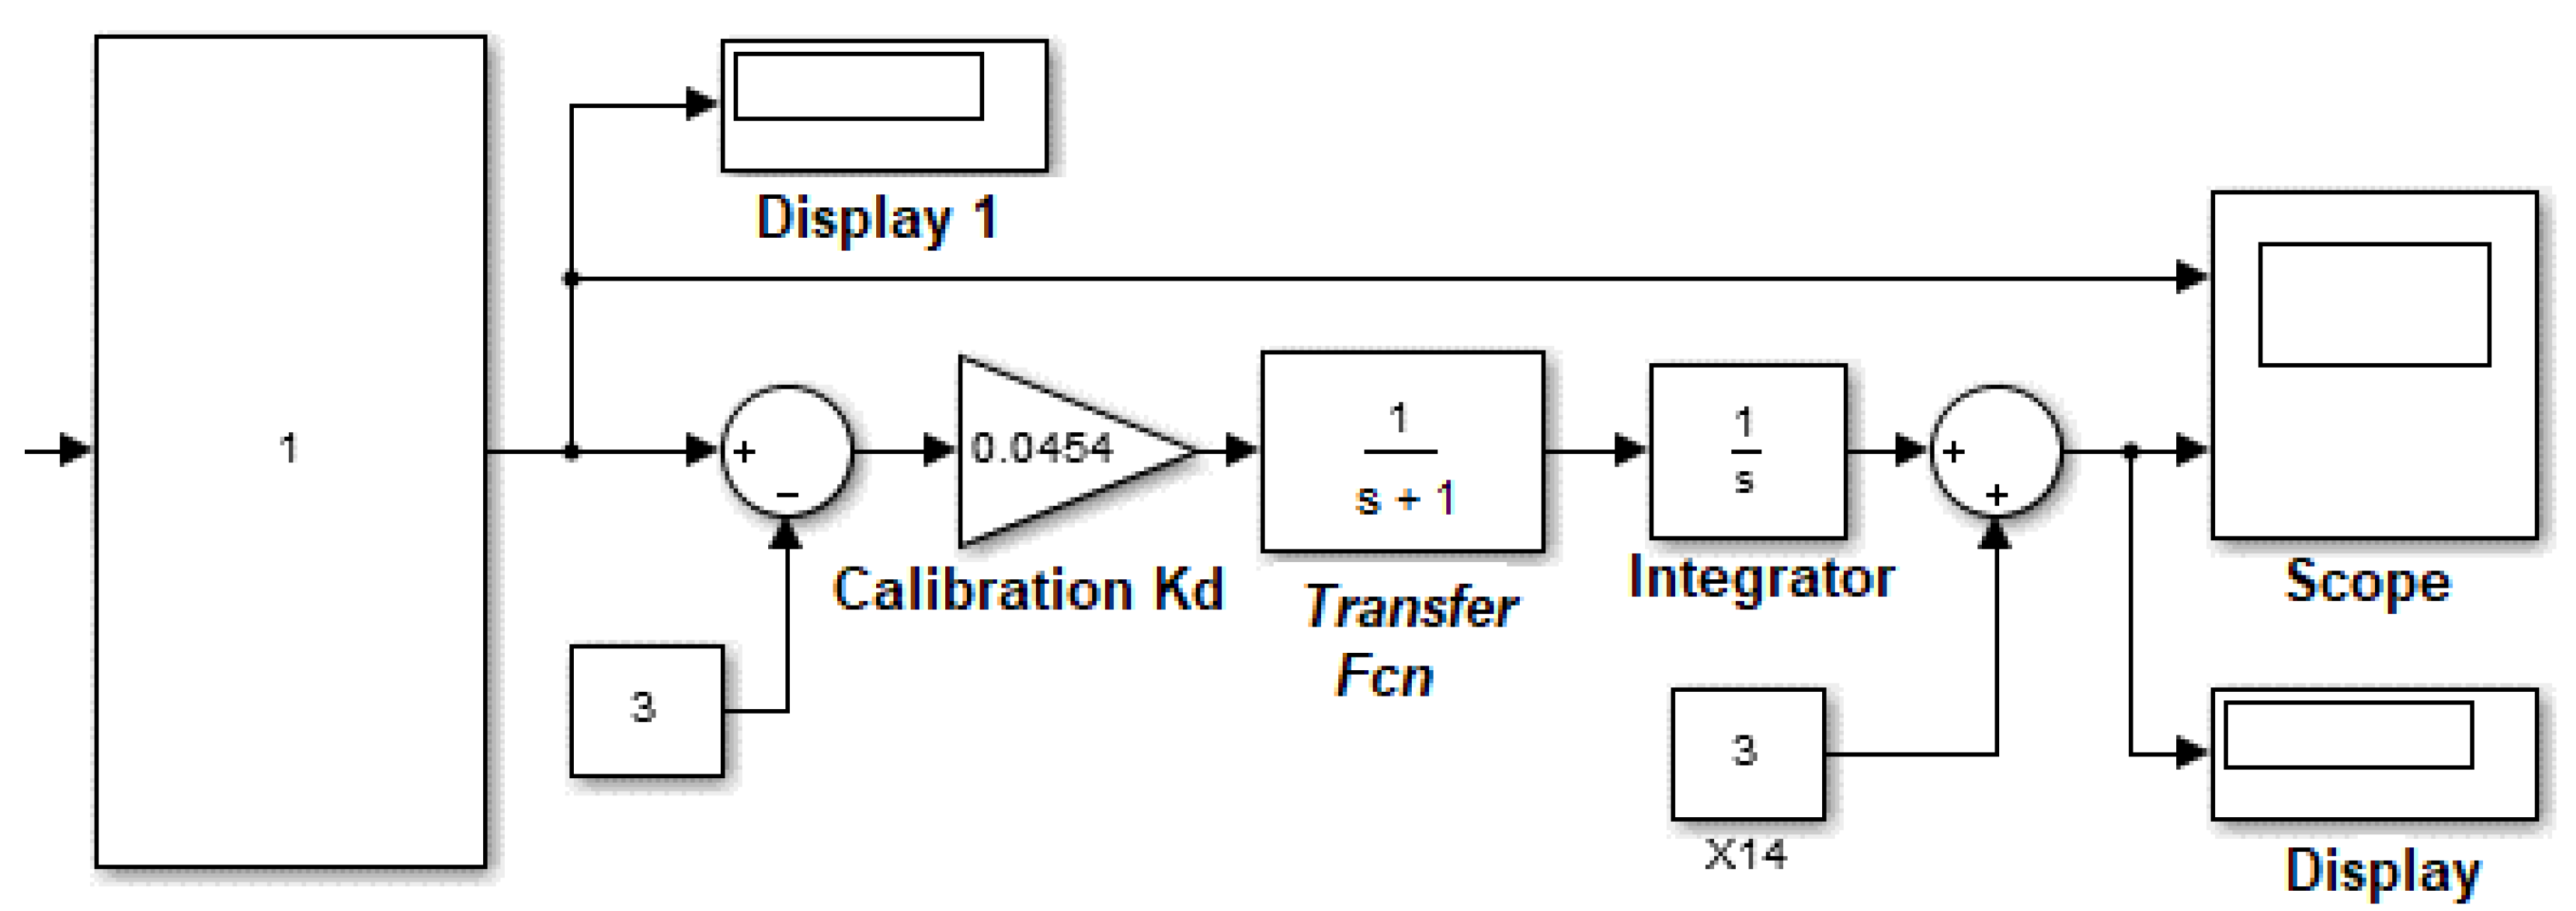
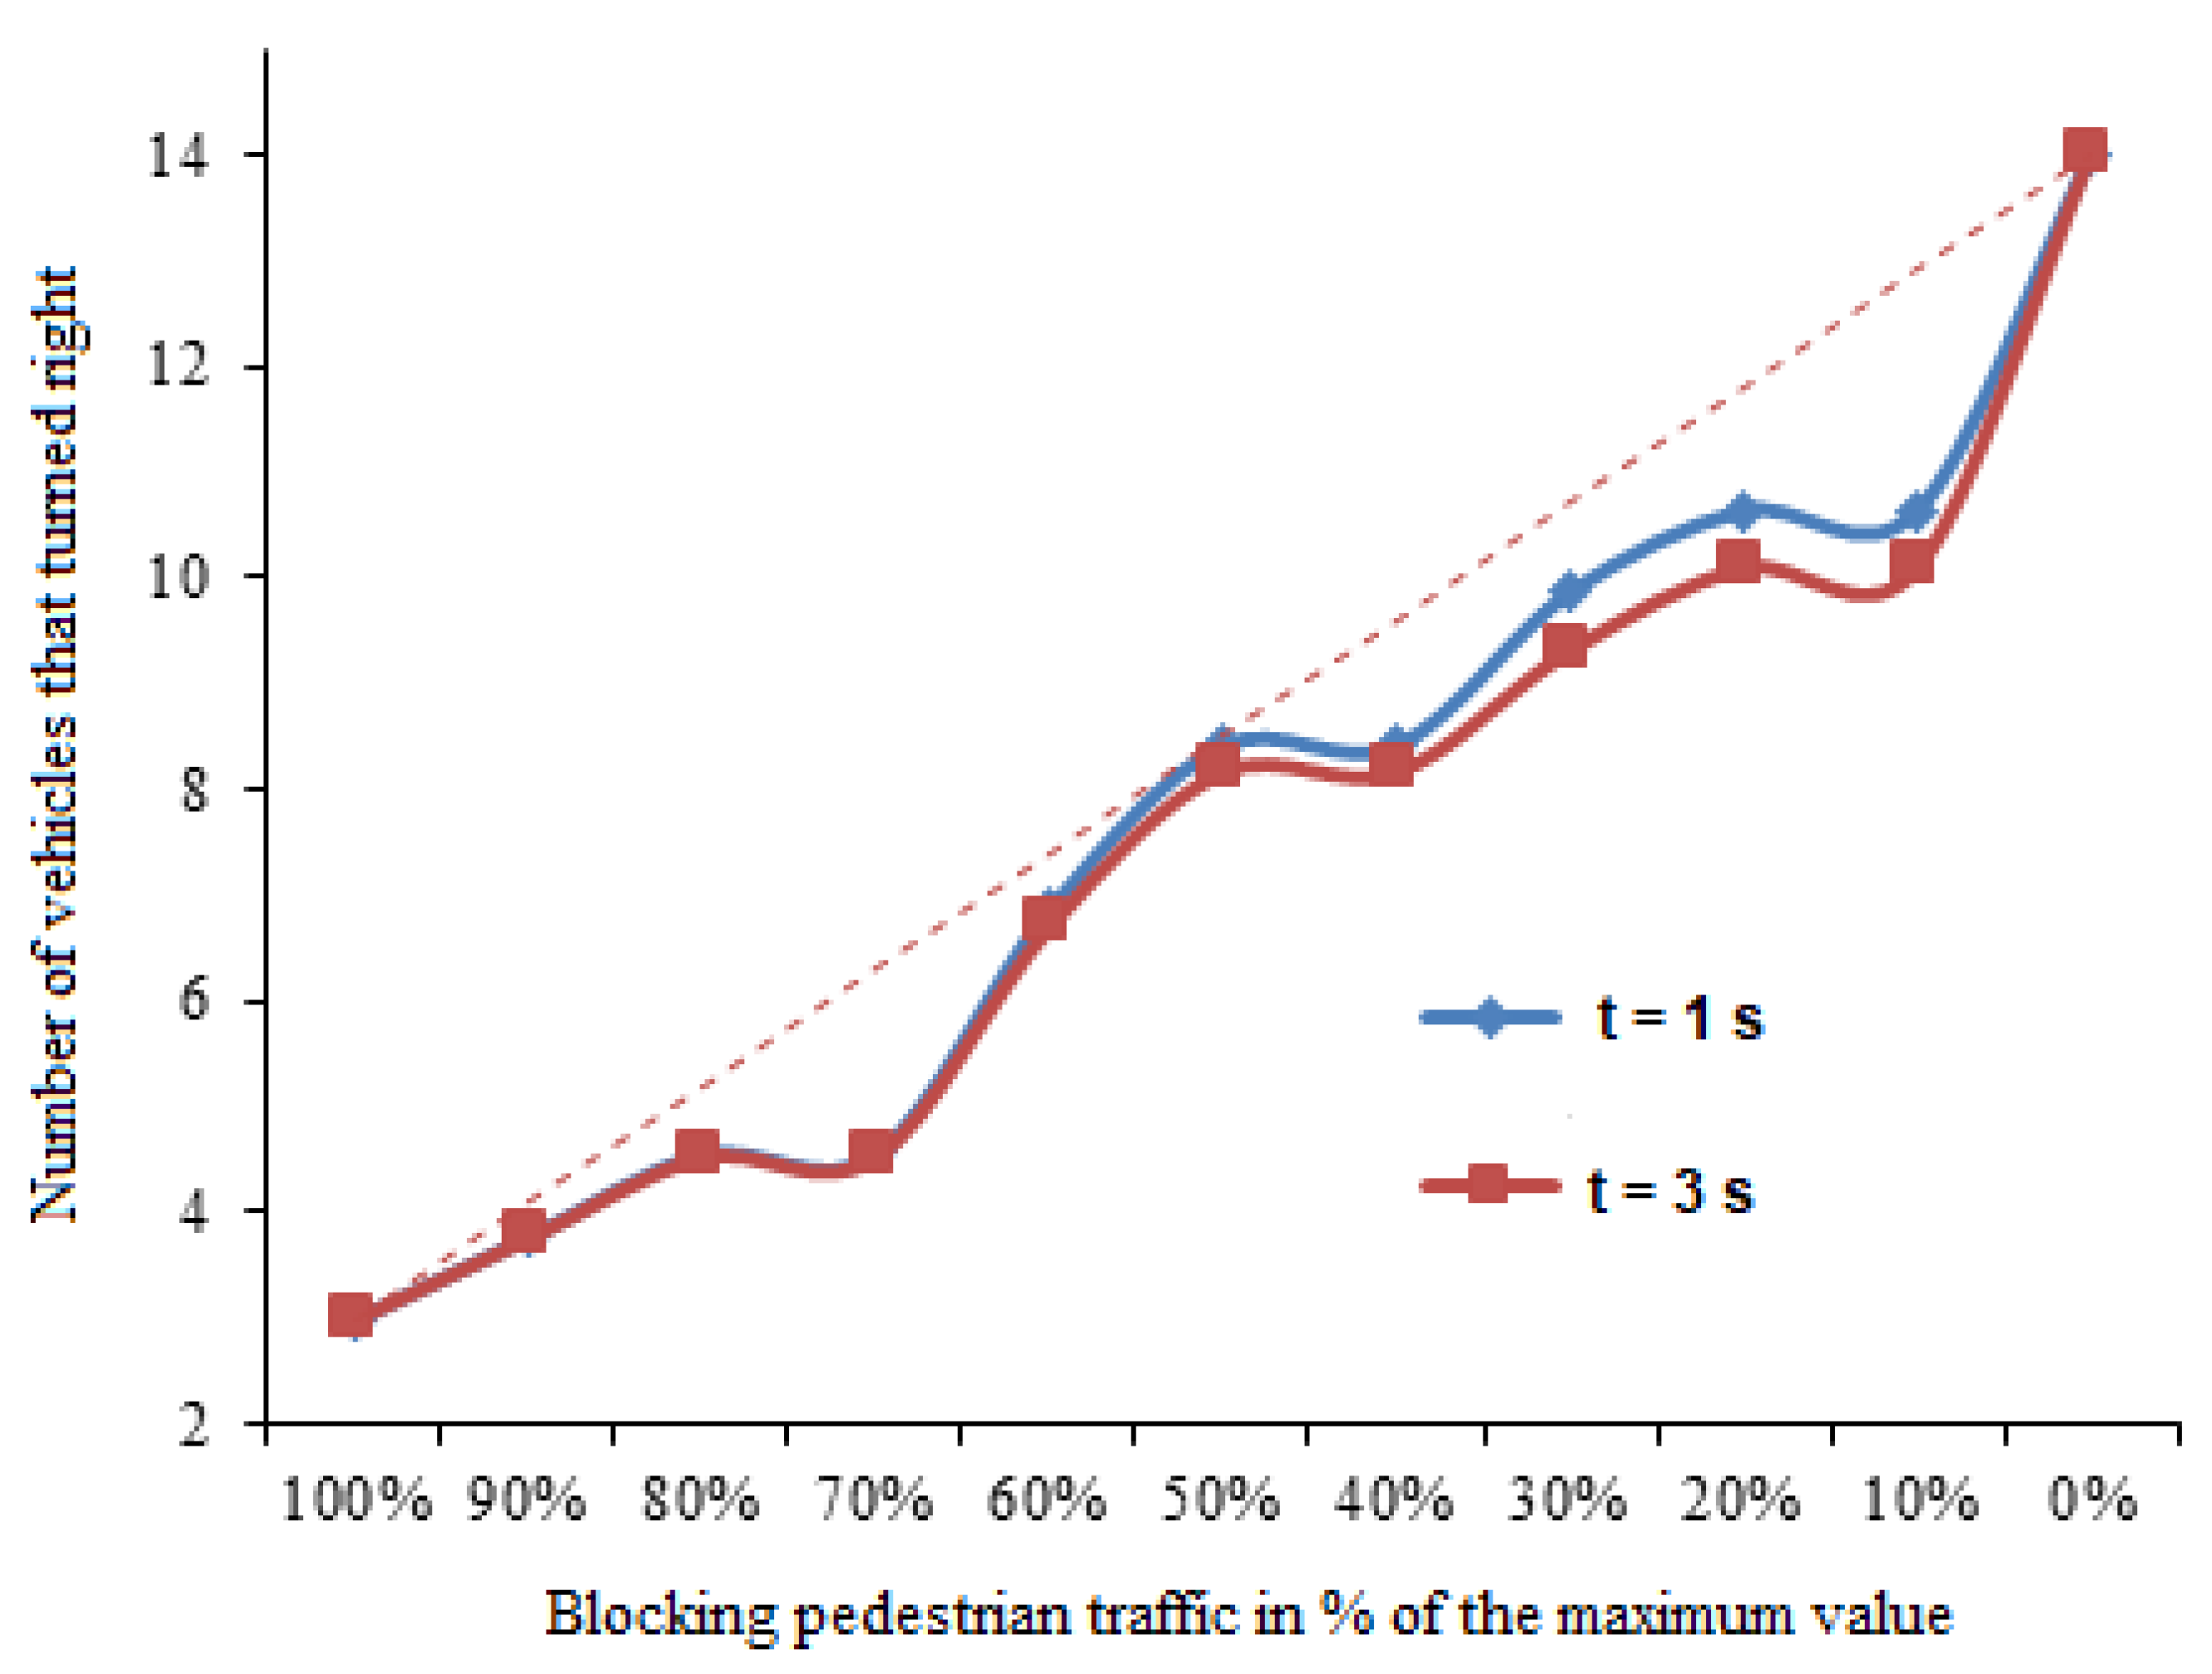
2.3.3. Simulation of the Inertial Vehicle Flow
To simulate the dynamics of the vehicles passing the selected intersection, we supplement the static model with an inertial Transfer Fcn block simulating the vehicle acceleration inertia according to the first-order differential equation (aperiodic link). The final form of the dynamic model, including calibration blocks, is shown in Figure 8.
Figure 8.
A dynamic simulation model of the selected intersection.
Figure 9a shows the relative dynamics at a pedestrian flow density of 60% of the maximum value, demonstrating the operation of a complete stochastic intersection model (right turn). The minimum level of the traffic flow of three units is determined from the initial data of the simulated intersection (Figure 9b).
Figure 9.
The dynamics of passing the intersection: (a) the vehicle arrival flow during the right turn during random breaks in the pedestrian flow with a density of 60%; (b) a graph of the increase in the flow of vehicles leaving the intersection (with inertial acceleration dynamics of 3 s).
Analysis of the simulated processes showed that when vehicle flow is interrupted by a random pedestrian flow, the traffic capacity of the intersection is significantly reduced.
Figure 10 shows the results of the experimental study of the size of the inertial vehicle flow passing an intersection, depending on the density of the random pedestrian flow.
Figure 10.
The dependence of the inertial vehicle flow on the intensity of the pedestrian flow.
Analysis of Figure 10 shows a deviation from the linearity of the relationship between the vehicle flow and the pedestrian flow in the opposite direction. It shows two model graphs with different vehicle acceleration inertia in 1 and 3 s. Notably, these results were obtained only for one of the probable pedestrian flow situations.
The main result of the study is the development and construction of a model of vehicles making a right turn at an urban signal-controlled intersection that approximates real-life conditions.
3. Results
Fuzzy logic is a branch of mathematics that comprises classical logic and theory of sets emerged in the context of fuzzy sets. This method has the greatest practical application in fuzzy modelling. The fuzzy logic inference on Mamdani method is performed on fuzzy knowledge in which the values of input and output variables are given by fuzzy sets. The Mamdani method and many other fuzzy inference methods (Tsukamoto method; Larsen method; Sugeno method) have been used in software tools such as the Fuzzy Logic Toolbox (MATLAB), fuzzyTECH, and others.
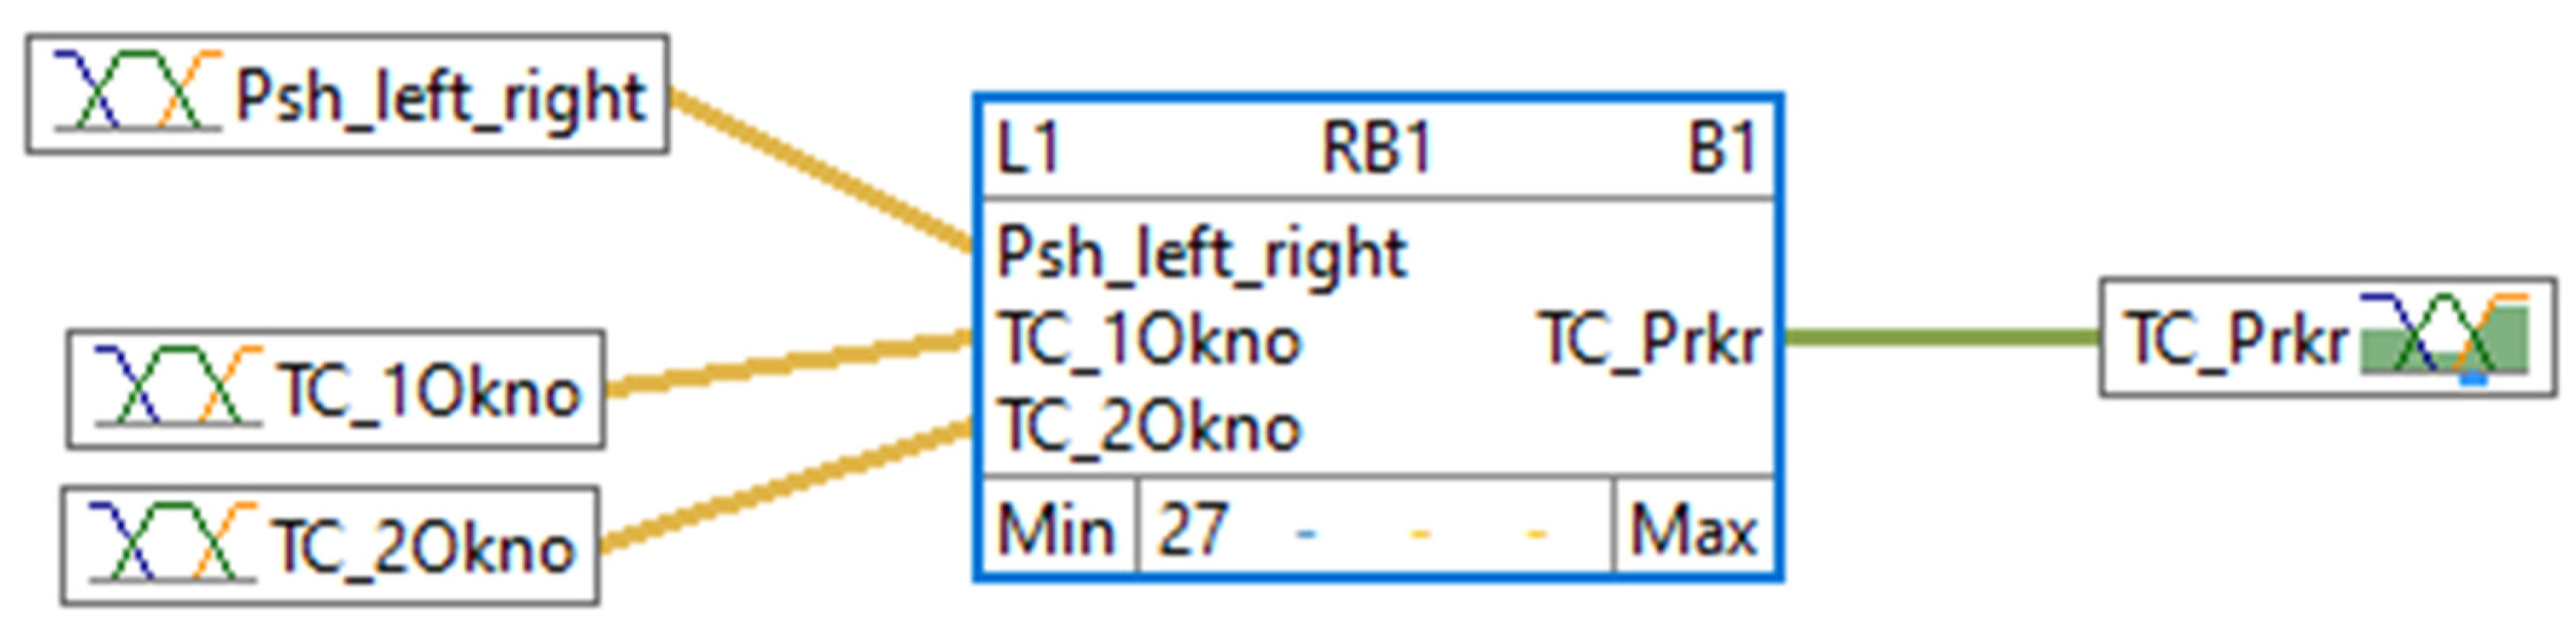
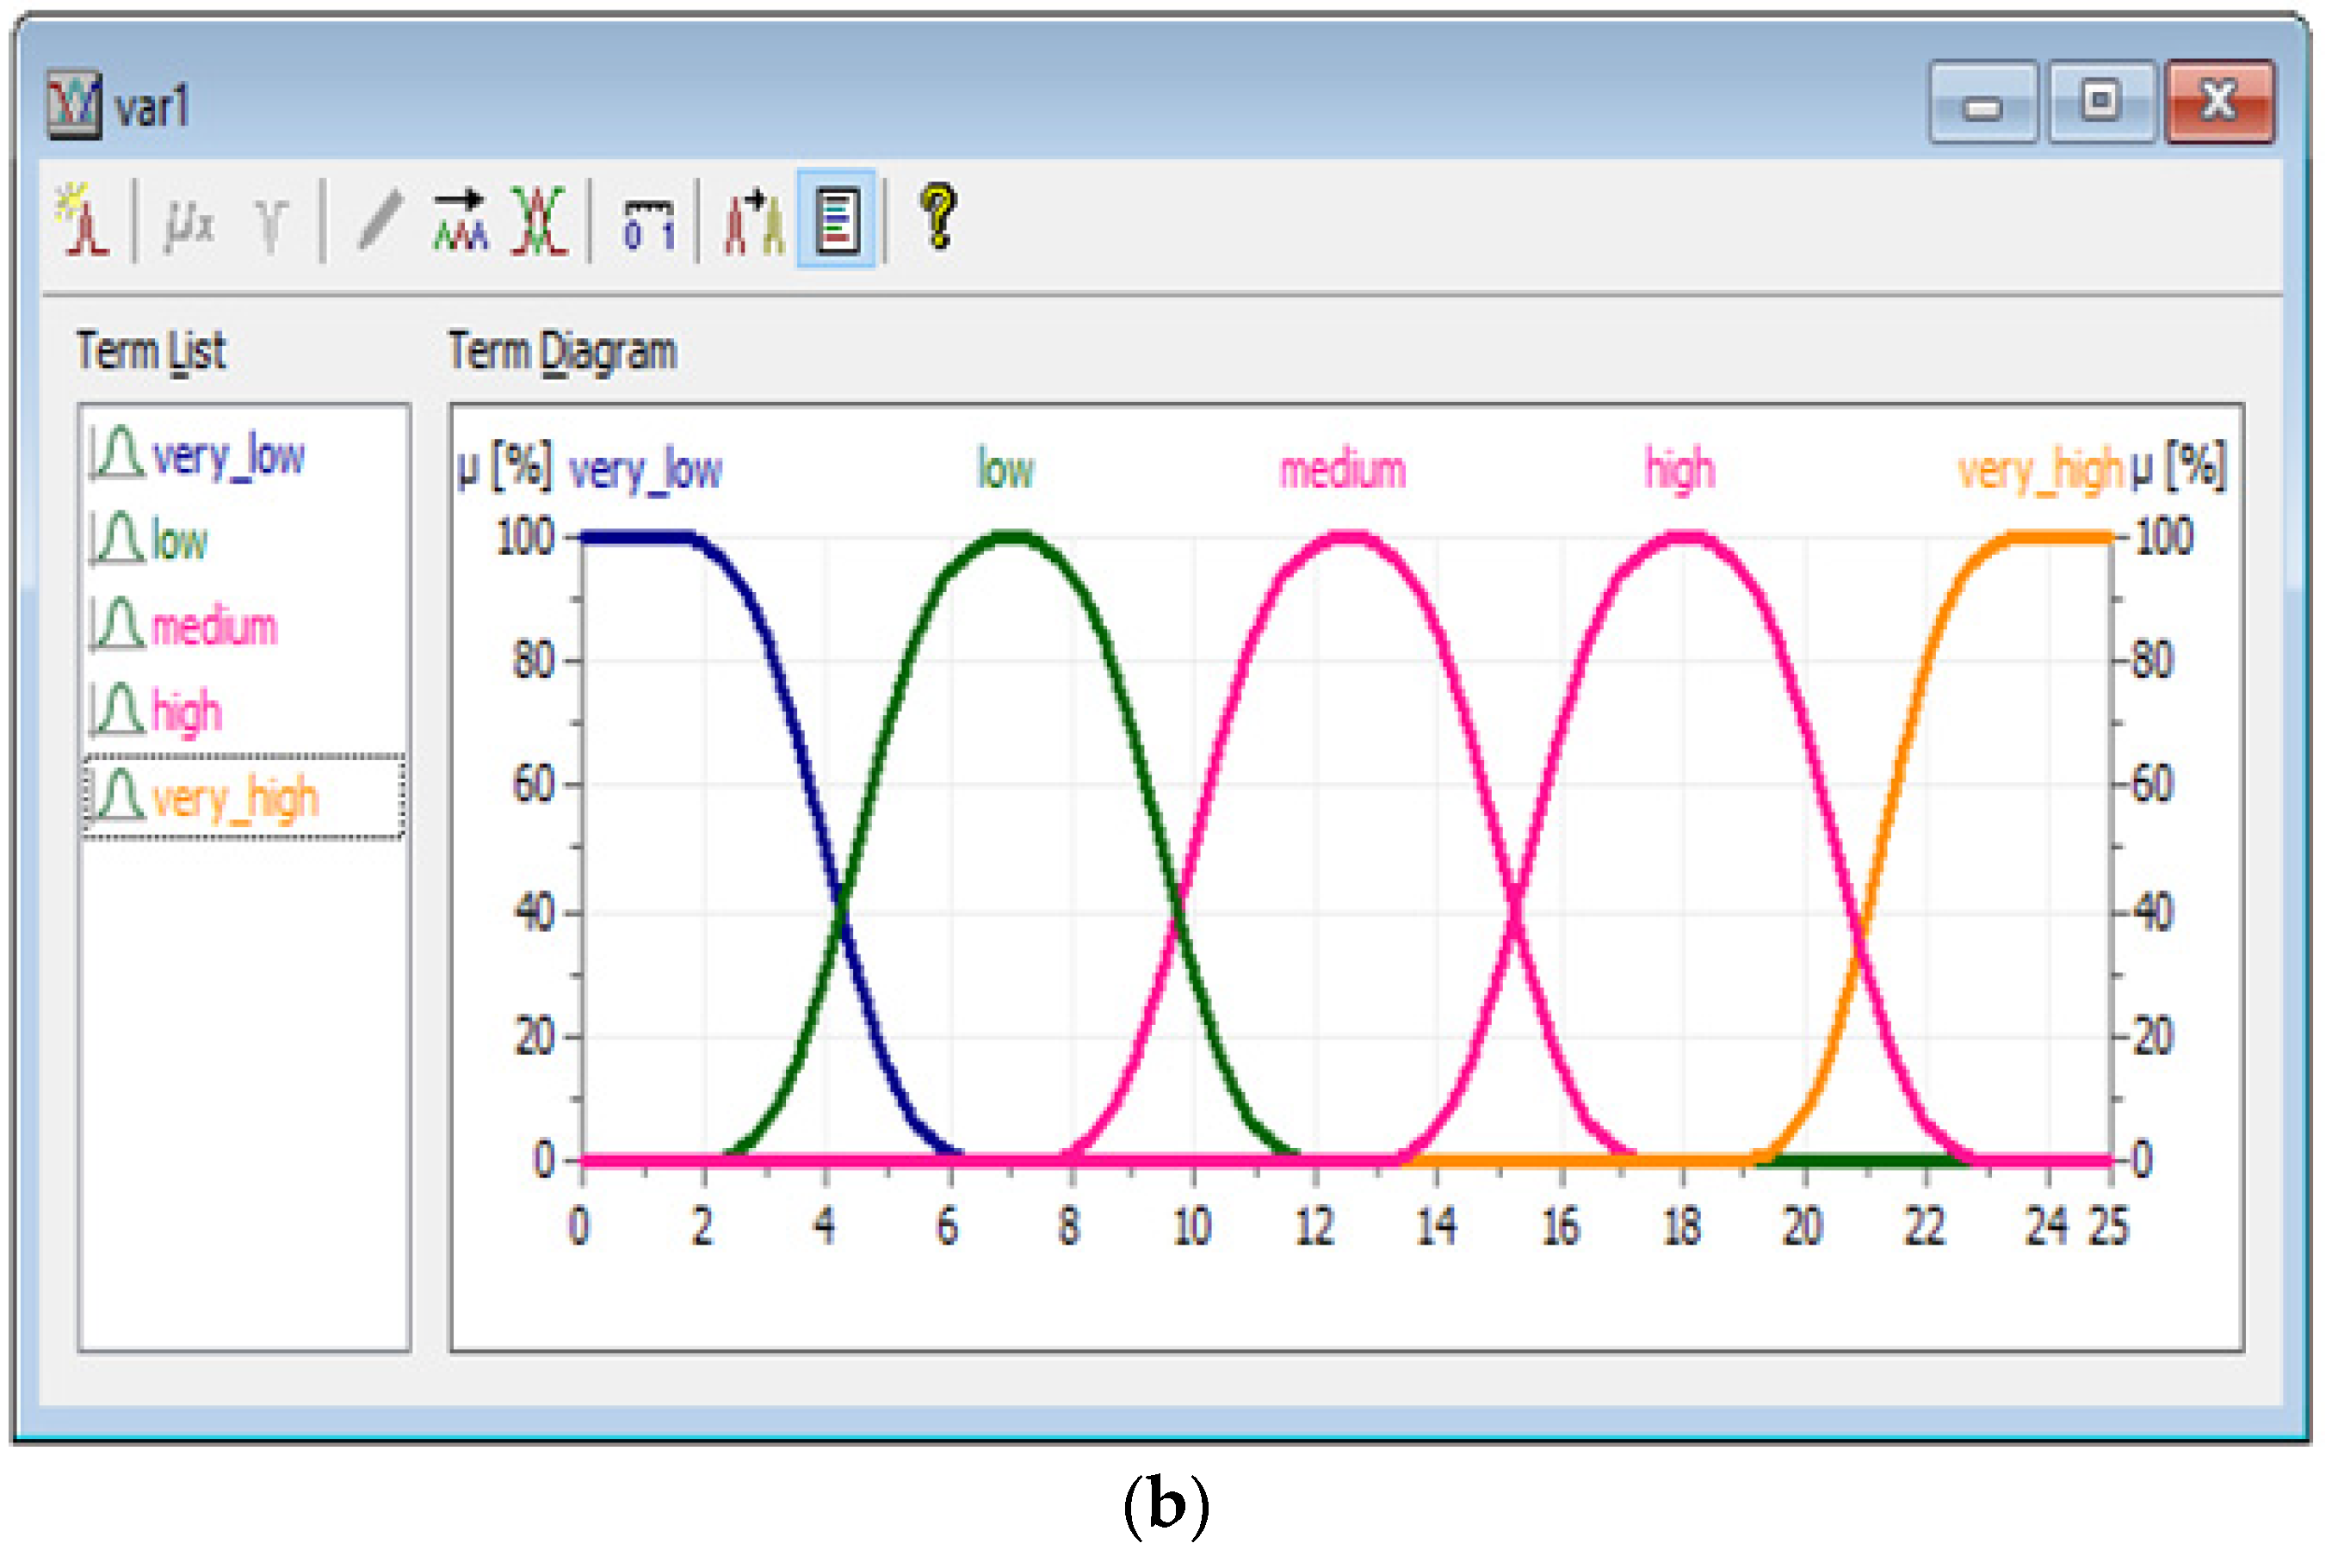
3.1. Predicting Traffic Capacity Using the Fuzzy Logic Method
Shepelev et al. [7] carries out a preliminary analysis of the traffic capacity of an intersection using the fuzzy logic methods based on three factors that are essential in terms of their influence on the dependent value. These factors are reflected in Table 1 (column 4) in dark grey. However, for our stated task, the factors of both the pedestrian flow (x5, x6) and its continuity (x8, x10) are conceptually informative. A significant drawback of the previous analysis is also the non-Gaussian nature of the membership functions. However, this is acceptable for the preliminary approach discussed in this article.
Let us consider the predictive visualization of the traffic capacity of an intersection obtained by the minimized regression model (2), taking into account the aforementioned aspects: the use of conceptually informative independent variables and Gaussian membership functions.
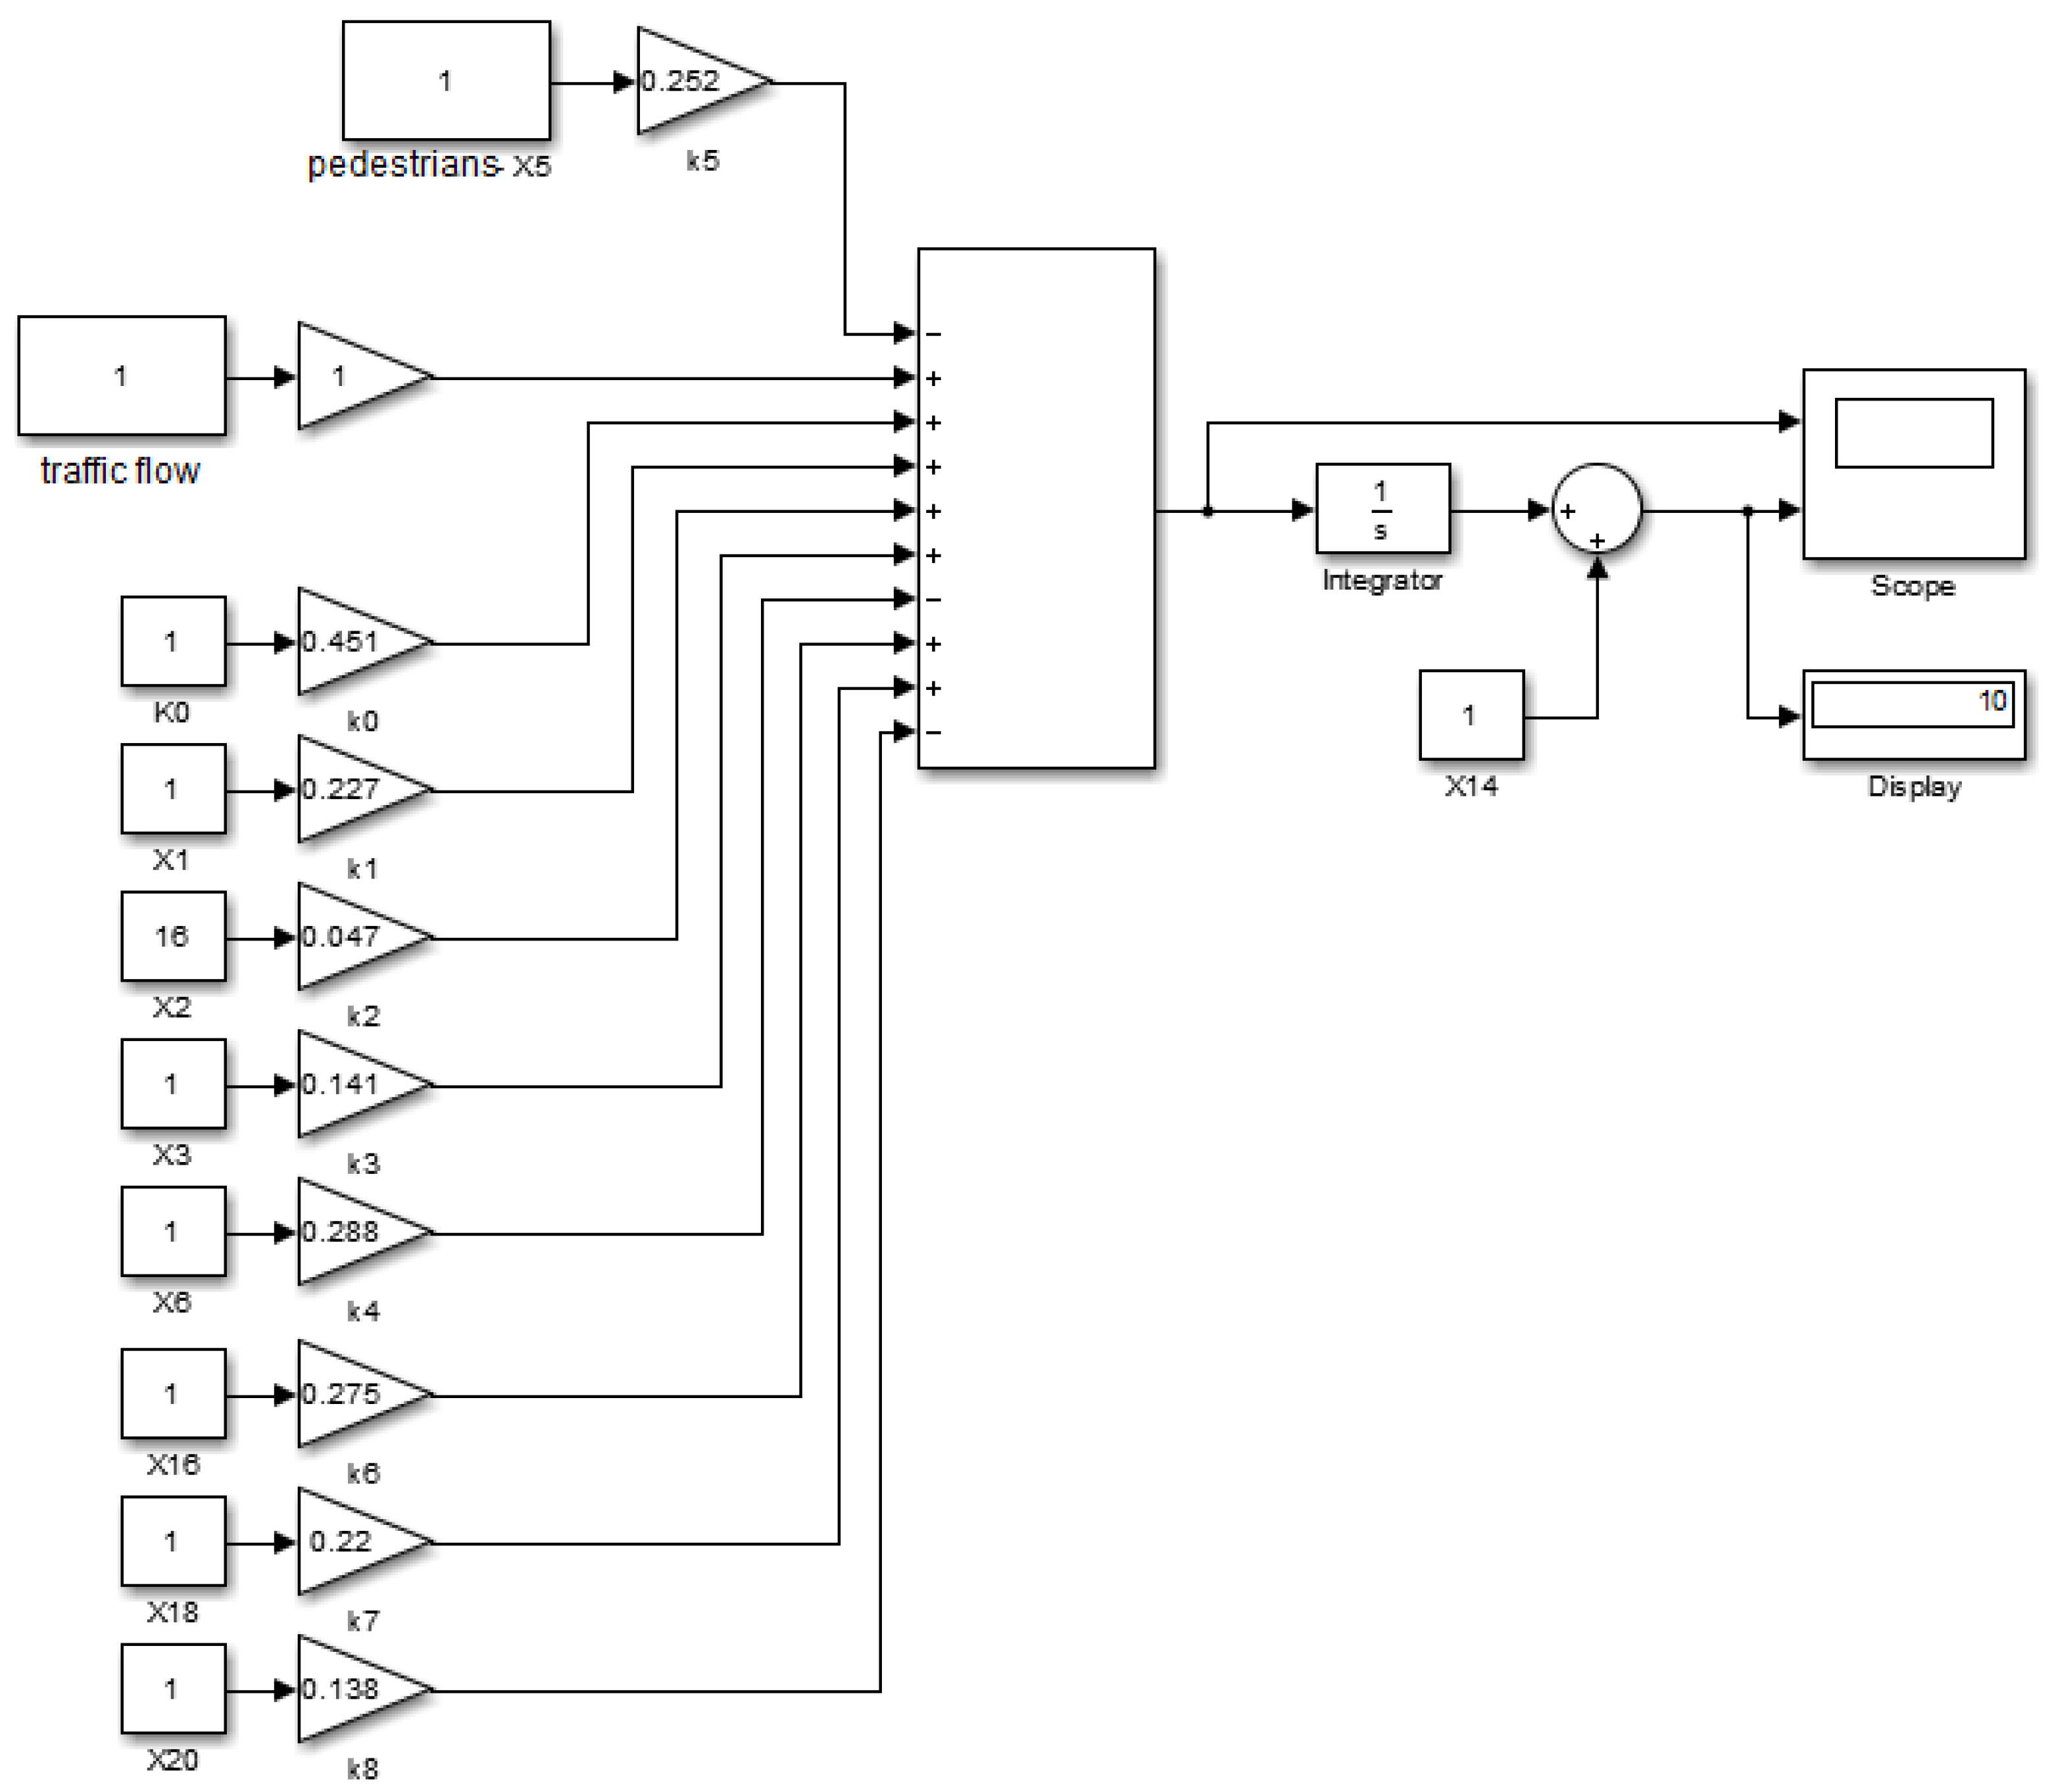
The Development of the Model
The predictive model for assessing the influence of the total pedestrian flow and its continuity on the traffic capacity of an intersection is based on the fuzzy logic method and the programme fuzzyTECH 8.77e. The basis is the static regression Model (2). The dependent variable TC_Prkr (traffic capacity of an intersection) is predicted depending on the values of the independent variables Psh_left_right (pedestrian flows x5 and x6) and its instability factors—TC_1Okno, TC_2Okno (the first and second interruptions of the pedestrian flow—x8 and x10).
The block diagram of the constructed model is shown in Figure 11.
Figure 11.
A block diagram of the model according to the fuzzy logic method.
At the stage of the fuzzification of variables, we chose Gaussian membership functions as splines rather than triangular ones. This is most consistent with the problem statement in the stochastic version. The parameters of the Gaussian terms are determined according to the authors’ expert estimates based on practical work with the observation camera data.
There are three terms for independent variables and five for the dependent variable. The distribution of the values by the terms of the independent variable TC_1Okno and the dependent variable TC_Prkr is shown in Figure 12a,b, respectively.

Figure 12.
Distribution of the term values for the variables: (a) the independent variable TC_1Okno; (b) the dependent variable TC_Prkr.
The values are distributed similarly for the independent variables Psh_left_right and TC_2Okno.
We determined a fuzzy logic model for predicting the values of the dependent variable by a table of its relationships with the independent variables using the Speadsheet rule editor block (Figure 13).
Figure 13.
Table of rules for the relationship of the model variables.
The experimental studies of the constructed model allowed us to predict the dependent variable based on the actual values of the independent variables, as well as to create a graphic of the distribution field of the mutual influence of the variables in the form of three-dimensional surfaces.
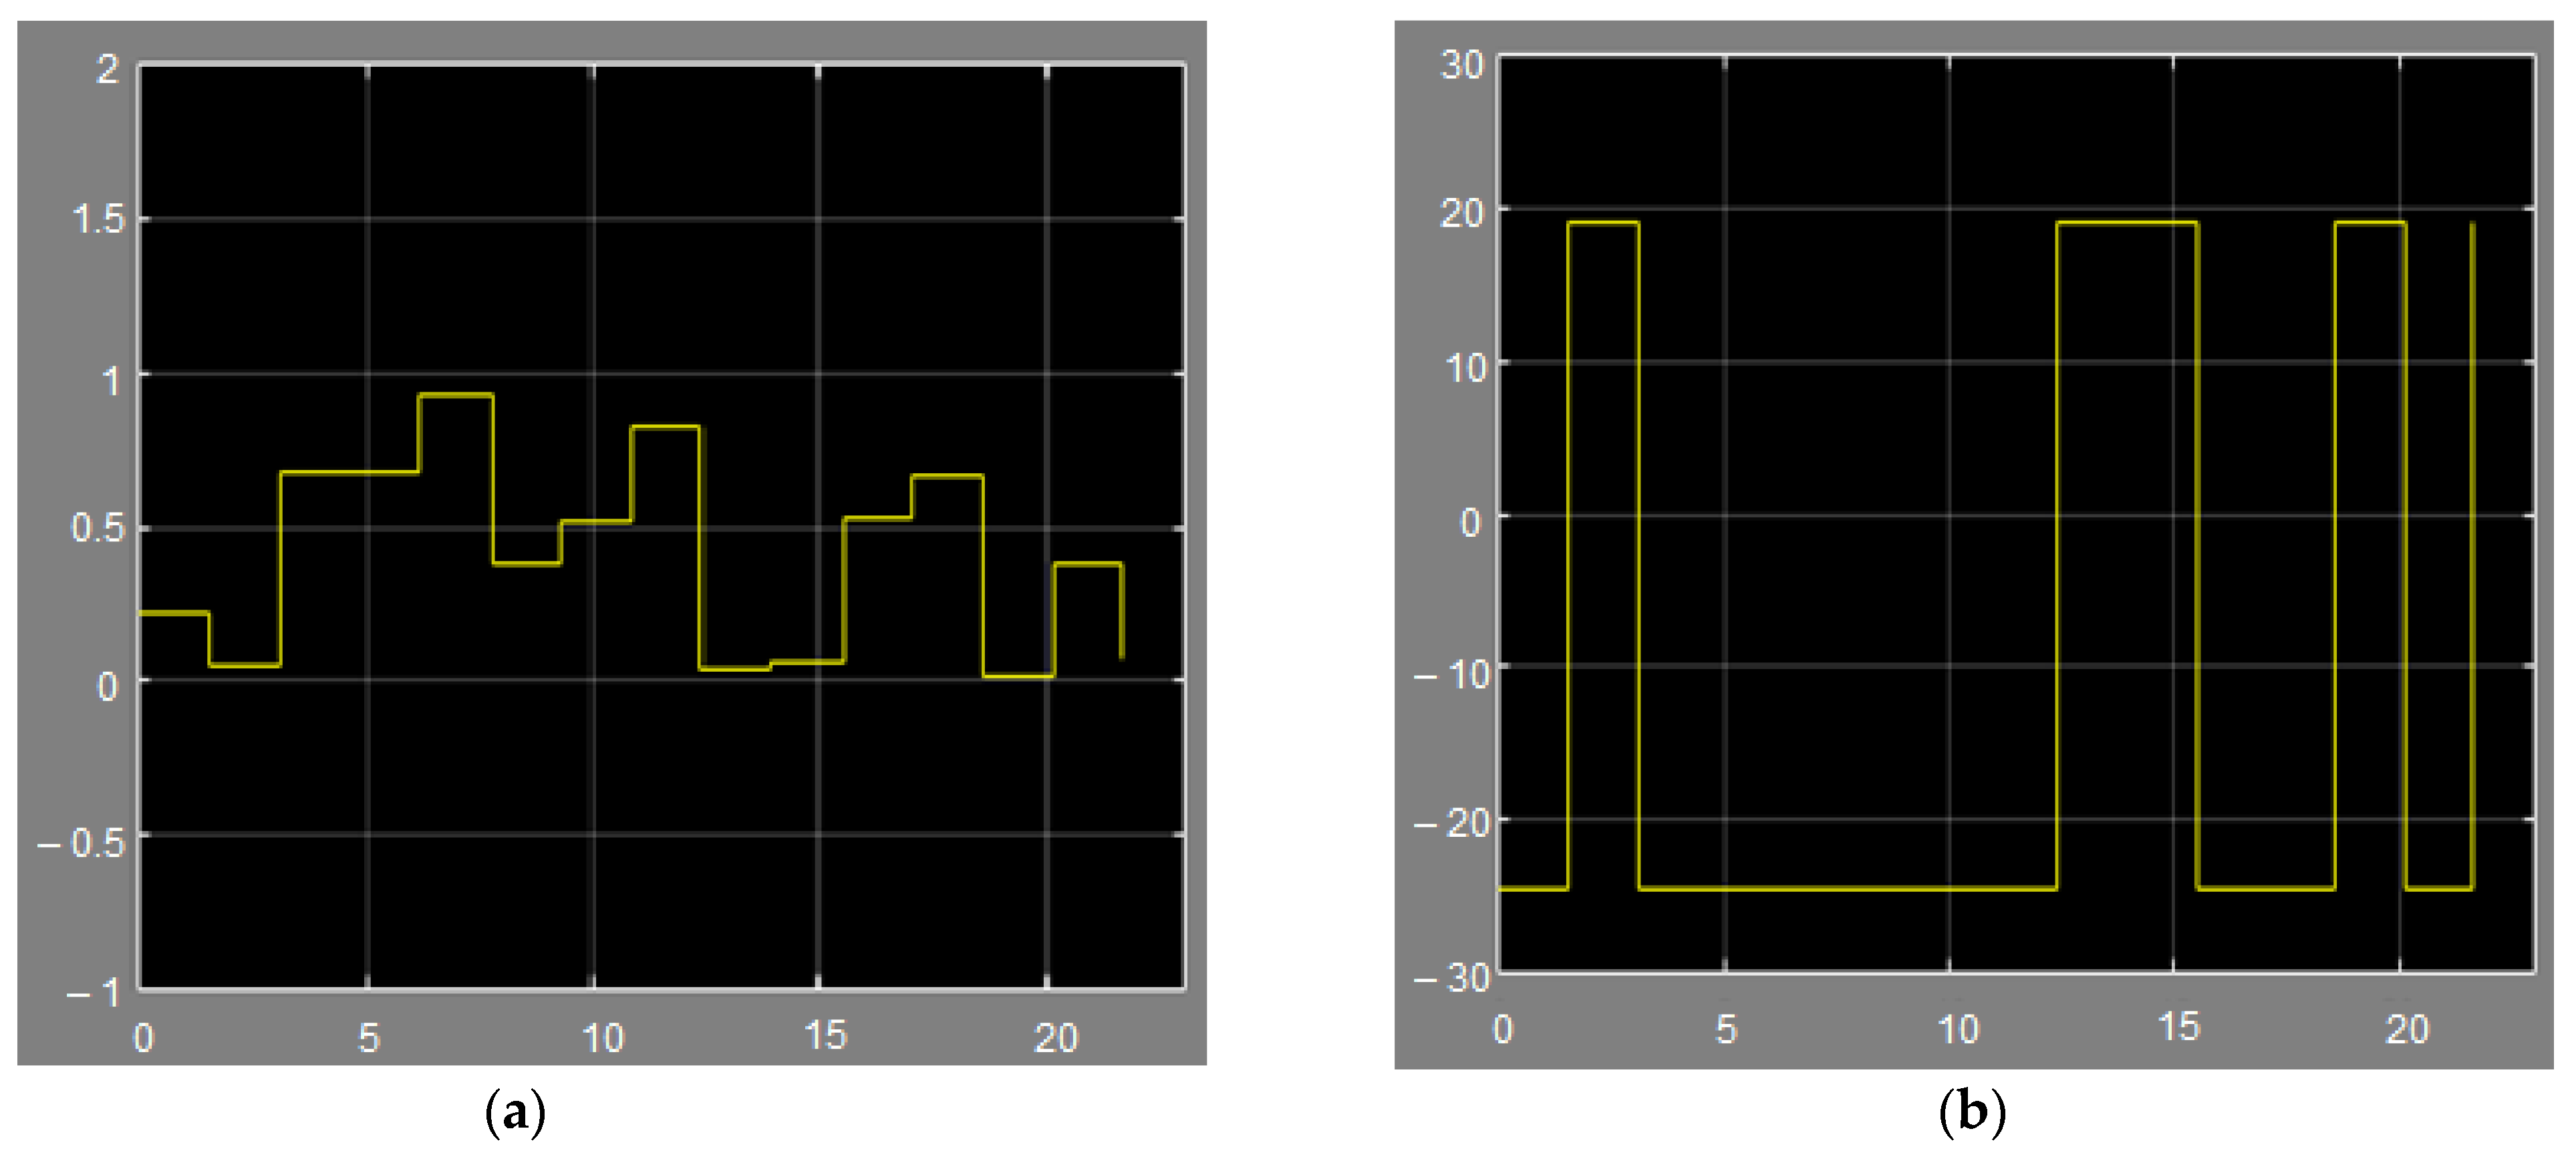
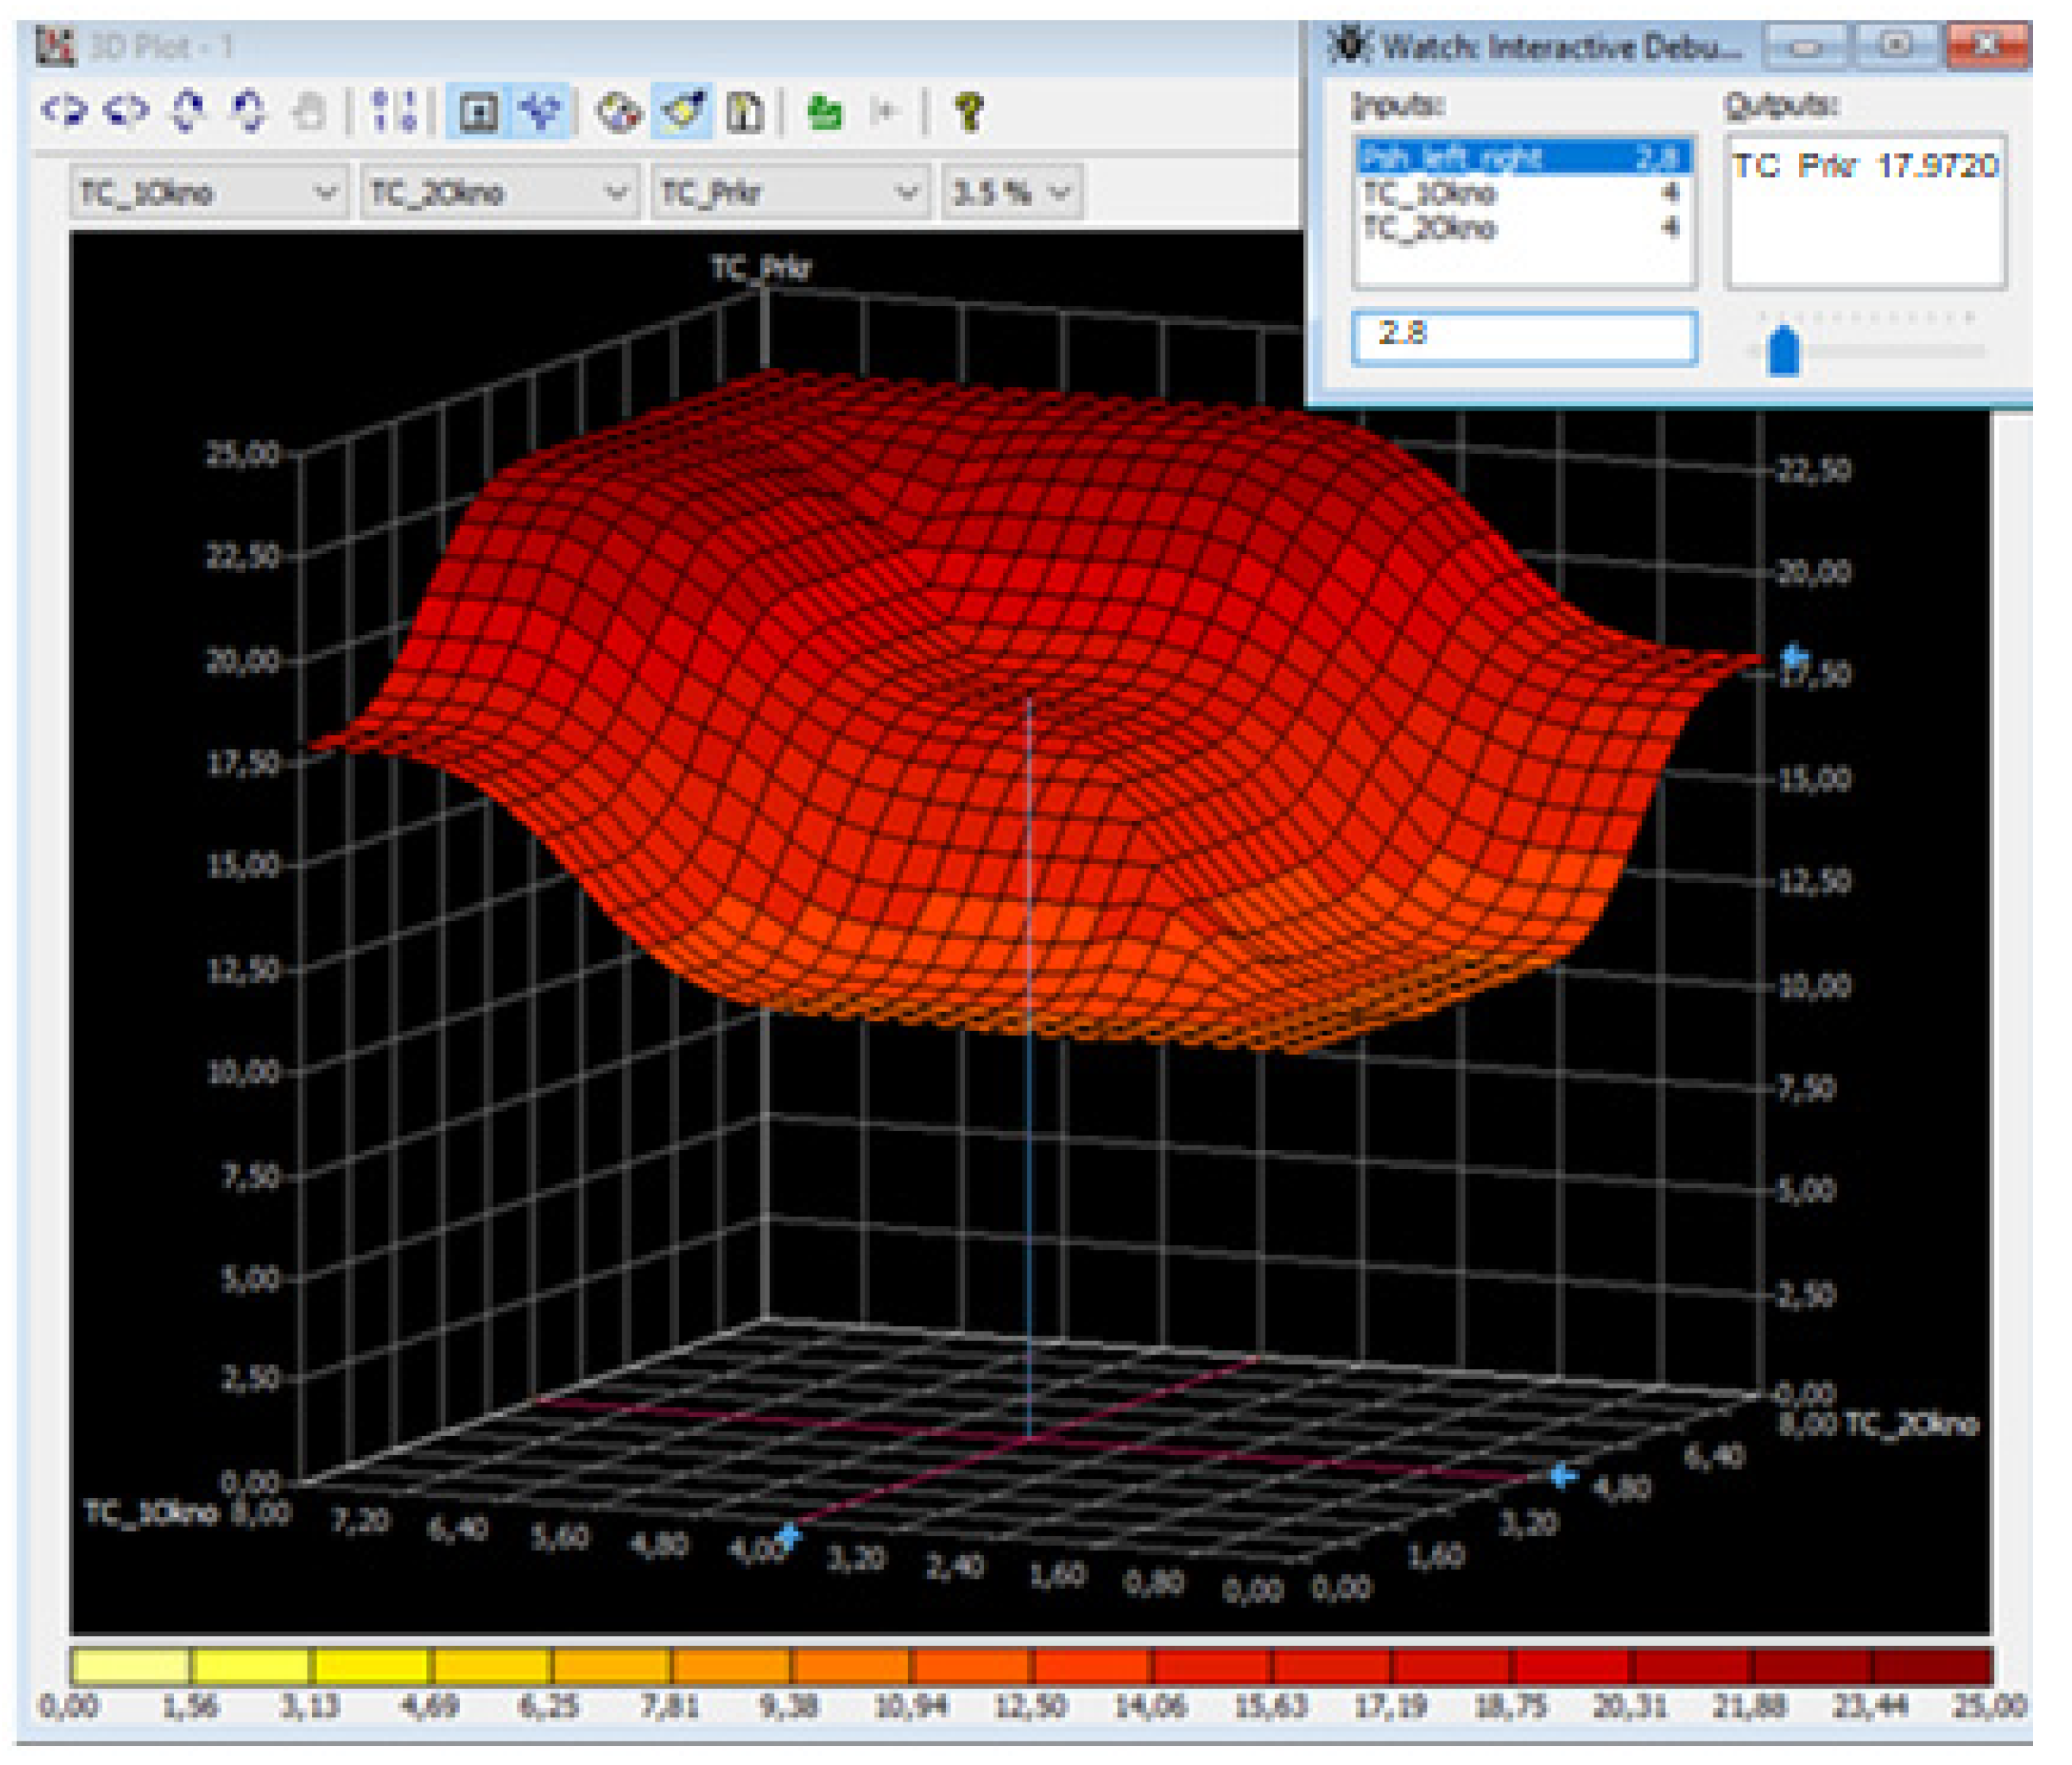
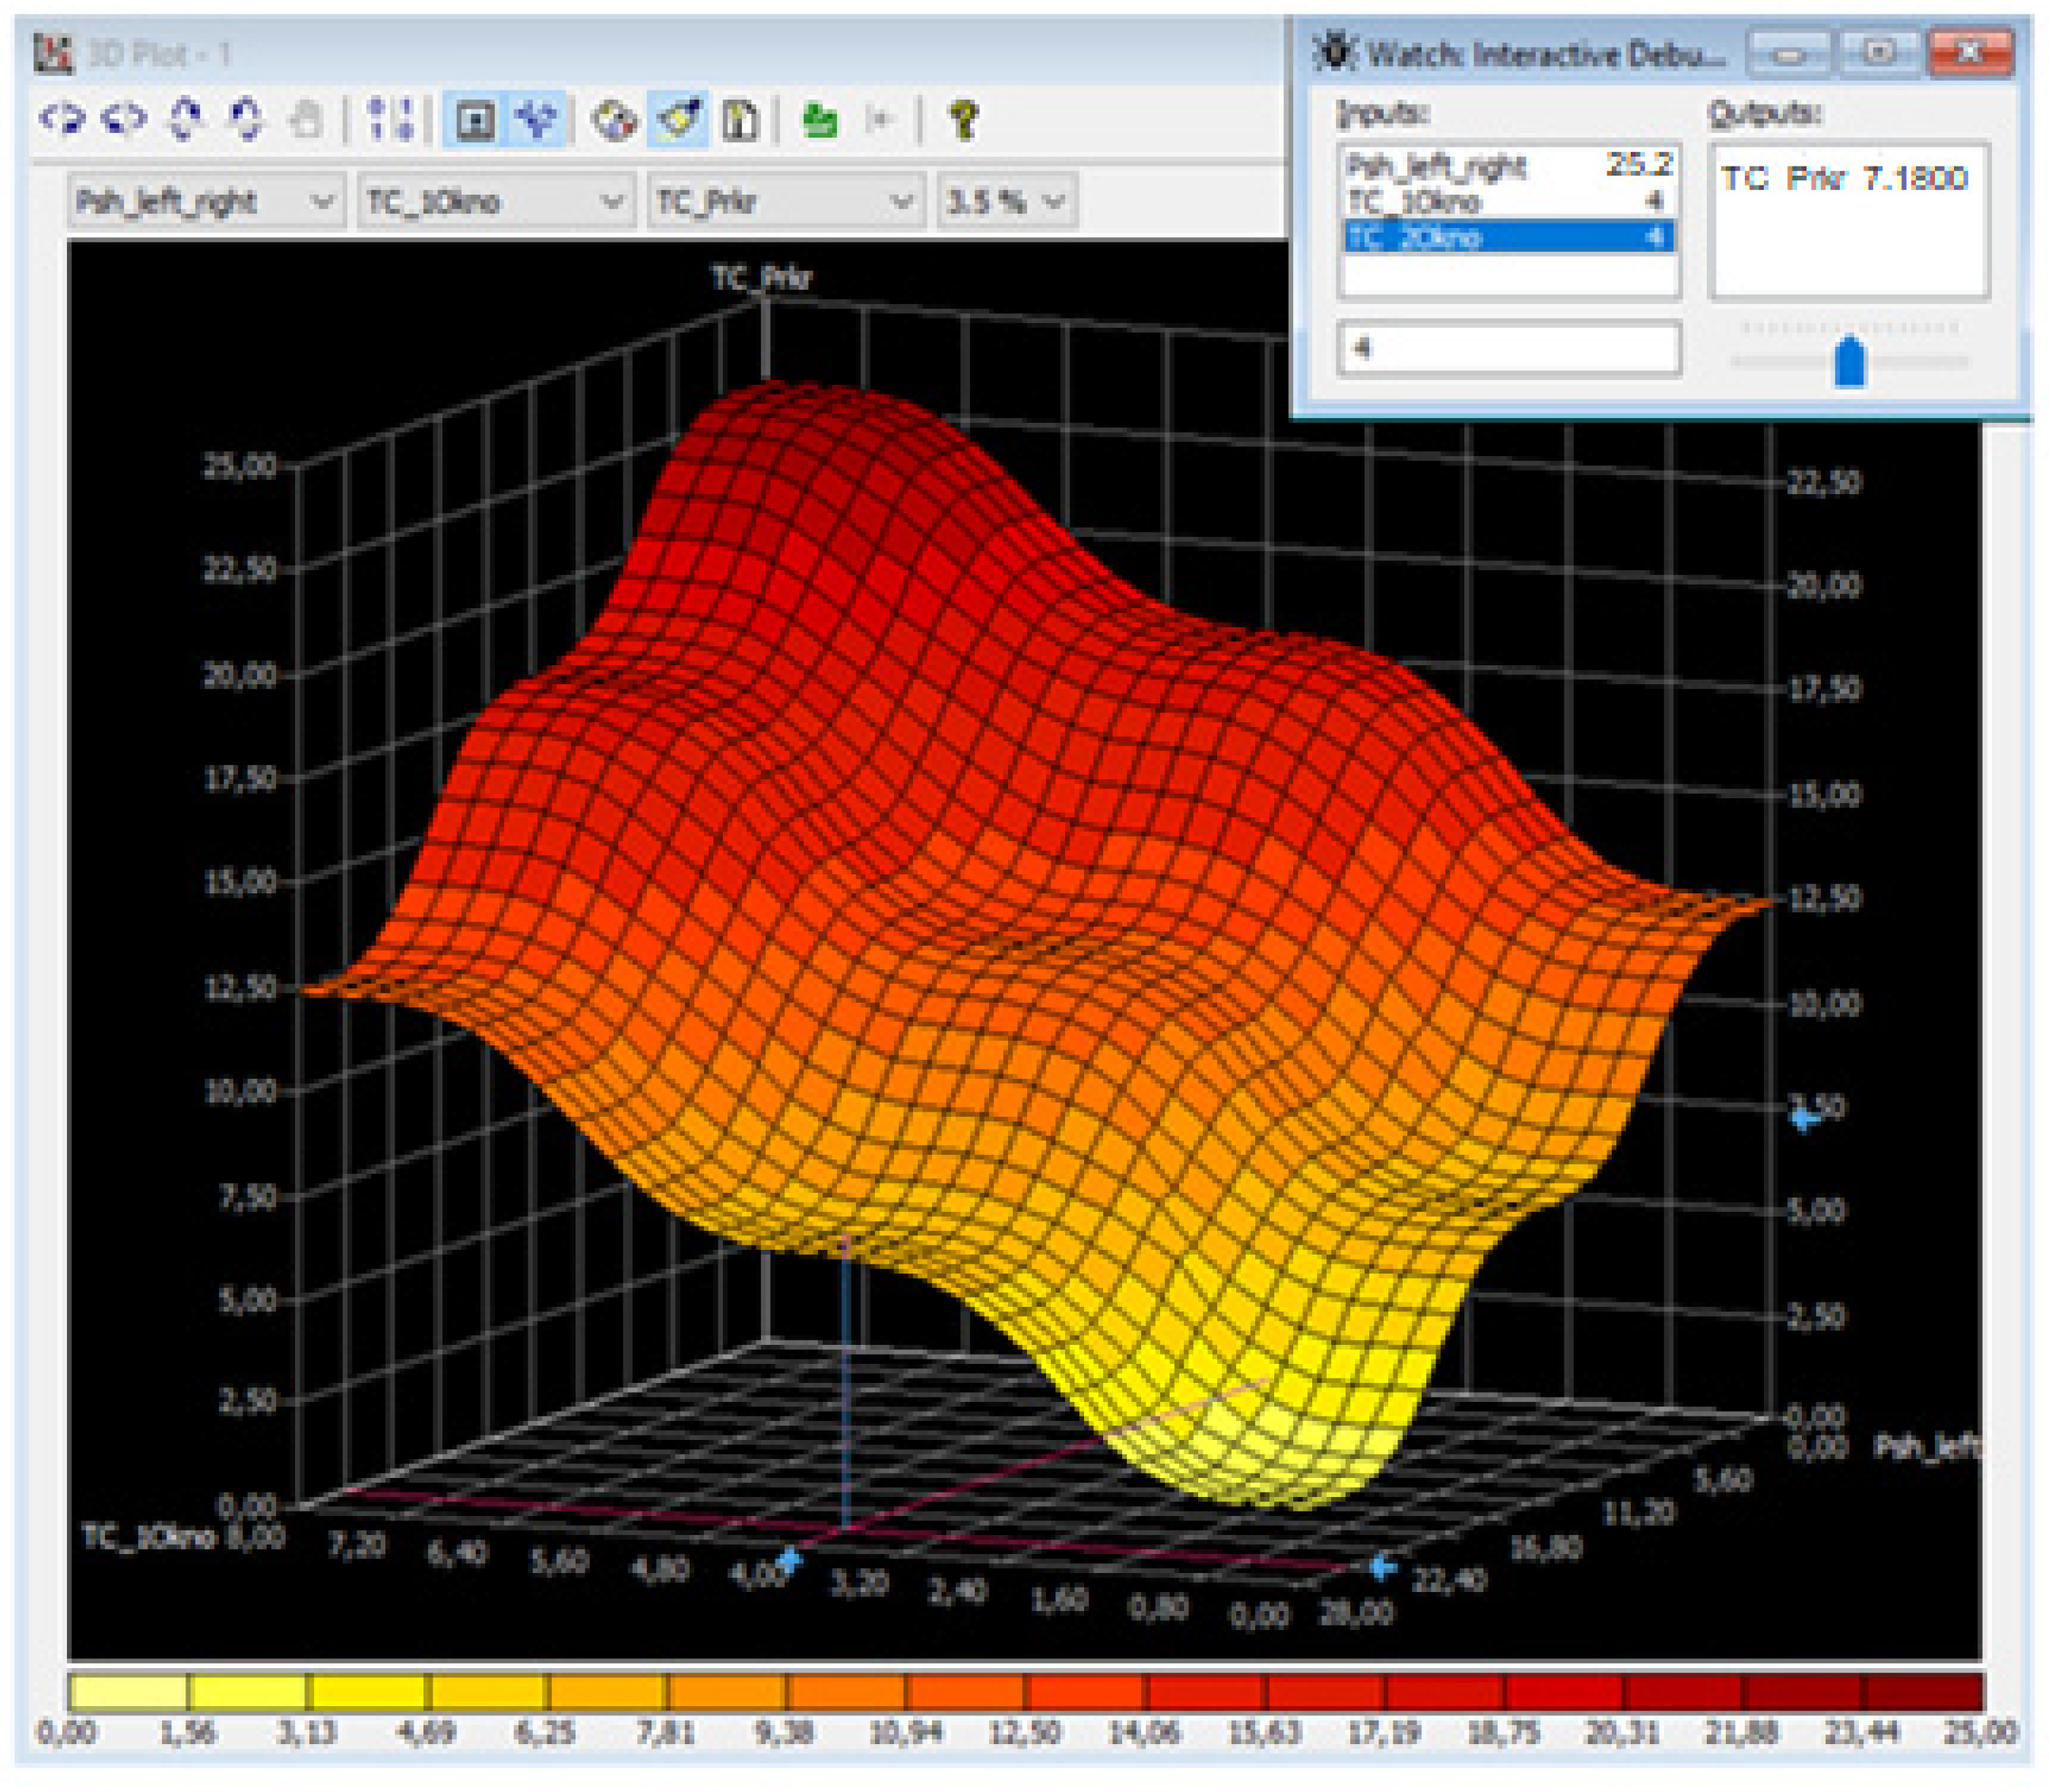
3.2. Visualization of Predictive Situations
Let us look at the traffic capacity of the simulated intersection and its relation to the instability of the pedestrian flow (the first and second windows in the flow) at different intensity values of the pedestrian flow itself. Figure 14, Figure 15 and Figure 16 show the graphs and the calculation of the predictions of the dependent variable (intersection capacity, TC_Prkr) on the influence of the pedestrian flow instability (independent variables TC_1Okno, TC_2Okno) at the intensity of the blocking pedestrian flow (variable Psh_left_right) of 10%, 50%, and 90% of the maximum values.
Figure 14.
Experiment one: graph of the mutual influence of the variables at the intensity of the blocking pedestrian flow 10%.
Figure 15.
Experiment one: graph of the mutual influence of the variables at the intensity of the blocking pedestrian flow 50%.
Figure 16.
Experiment one: graph of the mutual influence of the variables at the intensity of the blocking pedestrian flow 90%.
A slightly different angle of view is provided by the graphical representation of the influence of two independent variables: TC_1Okno and Psh_left_right at similar gradations of the pedestrian flow discontinuity TC_2Okno of 90%, 50%, and 10% of its maximum value on the traffic capacity of the intersection. These graphs and predictions are shown in Figure 17, Figure 18 and Figure 19.
Figure 17.
Experiment two: graph of the mutual influence of the variables at the intensity of the blocking pedestrian flow 10%.
Figure 18.
Experiment two: graph of the mutual influence of the variables at the intensity of the blocking pedestrian flow 50%.
Figure 19.
Experiment two: graph of the mutual influence of the variables at the intensity of the blocking pedestrian flow 90%.
Analysis of the results of the two experiments with the model based on fuzzy logic shows the sinking trend of the traffic capacity of an intersection and the influence of both the intensity of the pedestrian flow and its discontinuity.
This can serve as a solid basis for making grounded decisions on signal-controlled intersection management.
4. Discussion and Conclusions
We used both statistical analysis methods and various computer simulation approaches to assess and predict the influence of random factors of pedestrian flow and pedestrian flow continuity on traffic capacity during a right turn at a signal-controlled intersection. The results of the correlation analysis of the information on the vehicle movement at intersections obtained from video cameras allowed us to clarify the linear nature of the mutual influences of the intersection parameters on its traffic capacity. The multiple-regression model of the signal-controlled intersection obtained earlier based on these initial data is considered from a new angle. We assessed the influence of the main random factors (the intensity of the pedestrian flow and its discontinuity) on traffic capacity. Minimization of the regression model did not violate its statistical confidence, and its standardized coefficients showed the degree of influence of the main factors. On this basis, we constructed two fundamentally different models allowing us to carry out various experiments to determine the nature of the influence of the analysed factors. The basis of these constructions is a reasonably minimized regression model reflecting the influence of conceptually important factors.
A stochastic dynamic model (Q-scheme) was constructed through simulations in the MATLAB suite. The model allows us to carry out real-time experiments given varying probabilistic characteristics of pedestrian flow intensity, as well as varying average response time of vehicles, thereby contributing to the idea of real, possible situations at a signal-controlled intersection. The second model of vehicle movement at intersections is based on fuzzy mathematical logic and the corresponding fuzzyTECH software. This model allows us to predict the traffic capacity of intersections depending on uncertain factors such as the intensity of the pedestrian flow and its discontinuity. This analysis also provides a clear visualization of the obtained results.
The above models are open for further sophistication and introduction of other random factors into consideration. However, even in the proposed version, the models can support the development grounded decisions on signal-controlled intersection management. This study will generally enrich the literature on traffic modelling and will, thus, be useful in many applications of adaptive transport network planning and operation.
Author Contributions
All of the authors contributed to publishing this article. Conceptualization, A.G.; methodology, V.S. and A.G.; software, T.B. and T.G.; validation, Z.A. and V.S.; formal analysis, A.G.; visualization, A.G. and Z.A. All authors have read and agreed to the published version of the manuscript.
Funding
This research received no external funding.
Institutional Review Board Statement
Not applicable.
Informed Consent Statement
Not applicable.
Data Availability Statement
This repository contains source codes for the programme, which implements methods for calculating traffic parameters described in the research work at https://github.com/Readix/TrafficMonitoring (accessed on 5 September 2021). This programme counts vehicles in each of the four directions of movement and calculates the speed of vehicles by the method of prospective conversion.
Conflicts of Interest
The authors declare no conflict of interest.
References
- Buch, N.; Velastin, S.A.; Orwell, J. A Review of Computer Vision Techniques for the Analysis of Urban Traffic. IEEE Trans. Intell. Transp. Syst. 2011, 12, 920–939. [Google Scholar] [CrossRef]
- Kazhaev, A.; Almetova, Z.; Shepelev, V.; Shubenkova, K. Modelling Urban Route Transport Network Parameters with Traffic, Demand and Infrastructural Limitations Being Considered. In IOP Conference Series: Earth and Environmental Science, Proceedings of 3rd International Conference on Sustainable, Moscow, Russia, 18 May 2018; Institute of Physics Publishing: Bristol, UK, 2018; Volume 177, p. 012018. [Google Scholar]
- Zaki, M.; Sayed, T.; Tageldin, A.; Hussein, M. Application of Computer Vision to Diagnosis of Pedestrian Safety Issues. Transp. Res. Record. 2013, 2393, 75–84. [Google Scholar] [CrossRef]
- Qi, B.; Zhao, W.; Zhang, H.; Jin, Z.; Wang, X.; Runge, T. Automated Traffic Volume Analytics at Road Intersections Using Computer Vision Techniques. In Proceedings of the 5th International Conference on Transportation Information and Safety, Liverpool, UK, 14–17 July 2019; IEEE: Piscataway, NJ, USA, 2019; Volume 8883683, pp. 161–169. [Google Scholar]
- Serrano, Á.; Conde, C.; Rodríguez-Aragón, L.J.; Montes, R.; Cabello, E. Computer Vision Application: Real Time Smart Traffic Light. In Lecture Notes in Computer Science (Including Subseries Lecture Notes in Artificial Intelligence and Lecture Notes in Bioinformatics), Proceedings of the 10th International Conference on Computer Aided Systems Theory, las Palmas de Gran Canaria, 7–11 February 2005; Springer: Berlin/Heidelberg, Germany, 2005; Volume 3643, pp. 525–530. [Google Scholar]
- Prasad, D.; Kapadni, K.; Gadpal, A.; Visave, M.; Sultanpure, K. HOG, LBP and SVM Based Traffic Density Estimation at Intersection. In Proceedings of the 2nd IEEE Pune Section International Conference, Pune, India, 18–20 December 2019; IEEE: Piscataway, NJ, USA, 2019; p. 9105731. [Google Scholar]
- Shepelev, V.; Aliukov, S.; Glushkov, A.; Shabiev, S. Identification of Distinguishing Characteristics of Intersections Based on Statistical Analysis and Data from Video Cameras. J. Big Data 2020, 7, 46. [Google Scholar] [CrossRef]
- Echab, H.; Ez-Zahraouy, H. Dynamic Characteristics of Traffic Flow with Consideration of Crossing Pedestrians’ Behaviour at a Nonsignalized T-Shaped Intersection. Int. J. Modern Physics C 2017, 28, 1750134. [Google Scholar] [CrossRef]
- Jingxin, X.; Mei, C. Defining Traffic Flow Phases Using Intelligent Transportation Systems-Generated Data. J. Intell. Transp. Syst. Technol. Plann. Oper. 2007, 11, 15–24. [Google Scholar]
- Jeon, H.; Lee, J.; Sohn, K. Artificial Intelligence for Traffic Signal Control Based Solely on Video Images. J. Intell. Transp. Syst. Technol. Plann. Oper. 2018, 22, 433–445. [Google Scholar] [CrossRef]
- Munder, S.; Gavrila, D.M. An Experimental Study on Pedestrian Classification. IEEE Trans. Pattern Anal. Mach. Intell. 2006, 28, 1863–1868. [Google Scholar] [CrossRef]
- Zhang, S.; Abdel-Aty, M.; Yuan, J.; Li, P. Prediction of Pedestrian Crossing Intentions at Intersections Based on Long Short-Term Memory Recurrent Neural Network. Transp. Res. Rec. 2020, 2674, 57–65. [Google Scholar] [CrossRef]
- Hamdani, S.; Benamar, N.; Younis, M. A Protocol for Pedestrian Crossing and Increased Vehicular Flow in Smart Cities. J. Intell. Transp. Syst. Technol. Plann. Oper. 2020, 24, 514–533. [Google Scholar] [CrossRef]
- Xu, M.; An, K.; Vu, L.H.; Ye, Z.; Feng, J.; Chen, E. Optimizing multi-agent based urban traffic signal control system. J. Intell. Transp. Syst. Technol. Plann. Oper. 2019, 23, 357–369. [Google Scholar] [CrossRef]
- Lv, J.; Zhang, Y.; Zietsman, J. Investigating Emission Reduction Benefit from Intersection Signal Optimization. J. Intell. Transp. Syst. Technol. Plann. Oper. 2013, 17, 200–209. [Google Scholar] [CrossRef]
- Liu, W.; Anguelov, D.; Erhan, D.; Szegedy, C.; Reed, S.; Fu, C.Y.; Berg, A.C. SSD: Single Shot Multibox Detector. In Lecture Notes in Computer Science, Proceedings of the 14th European Conference on Computer Vision, Amsterdam, The Netherlands, 8–16 October 2016; Springer International Publishing AG: New York, NY, USA, 2016; Volume 9905, pp. 21–37. [Google Scholar]
- Tang, J.; Zhang, X.; Yin, W.; Zou, Y.; Wang, Y. Missing Data Imputation for Traffic Flow Based on Combination of Fuzzy Neural Network And Rough Set Theory. J. Intell. Transp. Syst. Technol. Plann. Oper. 2020, 25, 439–454. [Google Scholar] [CrossRef]
- Bi, Y.; Sun, Z.; Lu, X.; Sun, Z.; Liu, D.; Liu, K. Adaptive Type-2 Fuzzy Traffic Signal Control with On-Line Optimization. J. Intel. Fuzzy Sys. 2018, 35, 1889–1904. [Google Scholar] [CrossRef]
- Doǧan, E.; Akgüngör, A.P. Optimizing a Fuzzy Logic Traffic Signal Controller via the Differential Evolution Algorithm under Different Traffic Scenarios. Simulation 2016, 92, 1013–1023. [Google Scholar] [CrossRef]
- Hejun, W.; Changyun, M.; Ji, W.; Jianxiong, L. Research of Intelligent Traffic Light Control Scheme Based on Fuzzy Control. In Proceedings of the 2011 International Symposium on Computer Science and Society, Kota Kinabalu, Malaysia, 16–17 July 2011; IEEE: Piscataway, NJ, USA, 2011; Volume 6004279, pp. 111–113. [Google Scholar]
- Shirvani Shiri, M.J.; Maleki, H.R. Maximum Green Time Settings for Traffic-Actuated Signal Control at Isolated Intersections Using Fuzzy Logic. Int. J. Fuzzy Syst. 2017, 19, 247–256. [Google Scholar] [CrossRef]
- Castano, F.; Beruvides, G.; Haber, R.; Artunedo, A. Obstacle Recognition Based on Machine Learning for On-Chip LiDAR Sensors in a Cyber-Physical System. Sensors 2017, 17, 2109. [Google Scholar] [CrossRef] [Green Version]
- Zhang, Y.; Ye, Z. Short-term Traffic Flow Forecasting Using Fuzzy Logic System Methods. J. Intell. Transp. Syst. Technol. Plann. Oper. 2008, 12, 102–112. [Google Scholar] [CrossRef]
- Murat, Y.S.; Gedizlioglu, E. A Fuzzy Logic Multi-Phased Signal Control Model for Isolated Junctions. Transp. Res. Part C Emerg. Technol. 2005, 13, 19–36. [Google Scholar] [CrossRef]
- Li, J.; Zhang, H. Study on Optimal Control and Simulation for Urban Traffic Based on Fuzzy Logic. In Proceedings of the International Conference on Intelligent Computation Technology and Automation, Changsha, Hunan, India, 20–22 October 2008; IEEE: Piscataway, NJ, USA, 2008; Volume 1, pp. 936–940. [Google Scholar]
- Wu, S.; Bi, Y.; Wang, G.; Ma, Y.; Lu, M.; Xu, K. Adaptive Fuzzy Logic Traffic Signal Control Based on Cuckoo Search Algorithm. Smart Innov. Syst. Technol. 2019, 127, 107–117. [Google Scholar]
- Clara Fang, F.; Pham, C.V. An Intelligent Traffic Signal Control System Based on Fuzzy Theory. In Proceedings of the 19th COTA International Conference of Transportation Professionals: Transportation in China–Connecting the World, Nanjing, China, 6–8 July 2019; Zhang, L., Ma, J., Liu, P., Zhang, G., Eds.; American Society of Civil Engineers: Reston, VA, USA, 2019. [Google Scholar]
- Reis, V. A Disaggregated Freight Transport Market Model Based on Agents and Fuzzy Logic. Transp. B 2019, 7, 363–385. [Google Scholar] [CrossRef]
- Lyapin, S.; Rizaeva, Y.; Kadasev, D.; Voronin, N. Application of simulation modelling to improve the functioning of the module of intelligent transport and logistics system. In Proceedings of the 21st International Conference “Complex Systems: Control and Modeling Problems”, Samara, Russia, 3–6 September 2019; IEEE: Piscataway, NJ, USA, 2019; Volume 8976553, pp. 143–147. [Google Scholar]
- Kieu, L.-M.; Ngoduy, D.; Malleson, N.; Chung, E. A Stochastic Schedule-Following Simulation Model of Bus Routes. Transp. B 2019, 7, 1588–1610. [Google Scholar] [CrossRef]
- Horak, J.; Tesla, J.; Fojtik, D.; Vozenilek, V. Modelling Public Transport Accessibility with Monte Carlo Stochastic Simulations: A Case Study of Ostrava. Sustainability 2019, 11, 7098. [Google Scholar] [CrossRef] [Green Version]
- Pulugurta, S.; Madhu, E.; Kayitha, R. Fuzzy logic-based Travel Demand Model to Simulate Public Transport Policies. J. Urban Plann. Dev. 2015, 141, 04014044. [Google Scholar] [CrossRef]
- Khazukov, K.; Shepelev, V.; Karpeta, T.; Shabiev, S.; Slobodin, I.; Charbadze, I.; Alferova, I. Real-time Monitoring of Traffic Parameters. J. Big Data 2020, 7, 84. [Google Scholar] [CrossRef]
- Video Surveillance of Intersections and Streets in Chelyabinsk in Real Time. Available online: https://cams.is74.ru/live (accessed on 20 June 2021).
- Redmon, J.; Farhadi, A. YOLOv3: Incremental Iimprovement. 8 April 2018. Available online: https://arxiv.org/pdf/1804.02767.pdf (accessed on 25 August 2021).
- Lin, T.U.; Goyal, P.; Girshik, R.; He, K.; Dollar, P. Focal Loss for Defense Object Definition. 2017. Available online: https://arxiv.org/pdf/1708.02002.pdf (accessed on 14 August 2021).
- Kuhn, H.W. The Hungarian Method for the Assignment Problem. Nav. Res. Logist. Q. 1955, 2, 83–97. [Google Scholar] [CrossRef] [Green Version]
- Kalman, R.A. New Approach to Linear Filtering and Forecasting Problems. J. Fluids Eng. Trans. ASME 1960, 82, 35–45. [Google Scholar] [CrossRef] [Green Version]
Publisher’s Note: MDPI stays neutral with regard to jurisdictional claims in published maps and institutional affiliations. |
© 2021 by the authors. Licensee MDPI, Basel, Switzerland. This article is an open access article distributed under the terms and conditions of the Creative Commons Attribution (CC BY) license (https://creativecommons.org/licenses/by/4.0/).