Article

Ensemble Model of the Financial Distress Prediction in Visegrad Group Countries

Department of Quantitative Methods and Economic Informatics, The Faculty of Operation and Economics of Transport and Communications, University of Zilina, Univerzitna 8215/1, 010 26 Zilina, Slovakia
*
Author to whom correspondence should be addressed.
Mathematics 2021, 9(16), 1886; https://doi.org/10.3390/math9161886
Submission received: 23 June 2021 / Revised: 27 July 2021 / Accepted: 5 August 2021 / Published: 8 August 2021

Abstract

:
The issue of prediction of financial state, or especially the threat of the financial distress of companies, is very topical not only for the management of the companies to take the appropriate actions but also for all the stakeholders to know the financial health of the company and its possible future development. Therefore, the main aim of the paper is ensemble model creation for financial distress prediction. This model is created using the real data on more than 550,000 companies from Central Europe, which were collected from the Amadeus database. The model was trained and validated using 27 selected financial variables from 2016 to predict the financial distress statement in 2017. Five variables were selected as significant predictors in the model: current ratio, return on equity, return on assets, debt ratio, and net working capital. Then, the proposed model performance was evaluated using the values of the variables and the state of the companies in 2017 to predict financial status in 2018. The results demonstrate that the proposed hybrid model created by combining methods, namely RobustBoost, CART, and k-NN with optimised structure, achieves better prediction results than using one of the methods alone. Moreover, the ensemble model is a new technique in the Visegrad Group (V4) compared with other prediction models. The proposed model serves as a one-year-ahead prediction model and can be directly used in the practice of the companies as the universal tool for estimation of the threat of financial distress not only in Central Europe but also in other countries. The value-added of the prediction model is its interpretability and high-performance accuracy.

1. Introduction

Corporate failure is an essential topic in risk management. An effective warning system is crucial for the prediction of the financial situation in corporate governance. Similarly, Faris et al. [1] explain that bankruptcy is one of the most critical problems in corporate finance. In addition, Kim and Upneja [2] claim that efficient prediction models are crucial tools for identifying potential financial distress situations. The efficient prediction model should meet several criteria, such as accuracy, straightforward interpretation [3], and effectiveness [4]. Nowadays, De Bock et al. [5] describe that corporate partners assess business failure based on prediction models. The theoretical literature concentrates on optimising and evaluating models in terms of classification accuracy. Liu and Wu [6] claim that ensemble models are more and more frequently used to improve the performance accuracy of the bankruptcy model. Moreover, Ekinci and Erdal [7] explain that prediction models are essential for creditors, auditors, senior managers, and other stakeholders. The results indicate that ensemble learning models overcome other models. In other words, these hybrid models are reliable models for bankruptcy. Likewise, du Jardin [8] claims that ensemble techniques achieve better forecasts than those estimated with single models. Moreover, the results indicate that this technique reduces both Type I and II errors obtained with conventional methods. Ekinci and Erdal [7] recommend a hybrid ensemble learning model to predict bank bankruptcy.
The paper aims to propose a complex ensemble model for a one-year-ahead prediction of financial distress of companies in Central Europe. The proposed model is robust in terms of missing data or label noise and can handle imbalanced datasets without the need for initial data normalisation or standardisation. Despite its relative complexity, we provide a detailed description so it can be reproduced. We find out that researchers estimate financial distress based on various approaches, such as discriminant analysis, logistic regression, and artificial neural networks in the region. However, the ensemble model was not successfully applied in previous scientific articles. Therefore, we decide to use an ensemble model to contribute to better predictive accuracy. Moreover, we observe that ensemble models are mainly popular in Asia and North America. The added value of the paper represents a comparison of the ensemble model with several models from previous articles in Central Europe. We propose a widespread predictive model compared to models for the specific EU region. We made the calculations in MATLAB.
The paper comprises the literature review, methodology, results, discussion, and conclusion. The literature review summarises relevant research on the prediction models based on the ensemble approach. However, we concentrate on regional research in selected countries, too. The methodology focuses on identifying suitable financial variables, the optimal composition of the model elements, and the setting of their parameters. We describe the detailed methodology process in several steps. The results reveal significant financial variables used to estimate financial distress. We measure the predictive accuracy of ensemble models but also single models of the ensemble. In the discussion, we compare the performance metrics of the proposed ensemble model with models from previous research in the region. Moreover, we identify the main research limitations and describe potential research in the future.

2. Literature Review

The issue of failure distress is essential in many research papers on risk management. FitzPatrick [9], Merwin [10], Ramser and Foster [11], and Smith and Winakor [12] are pioneers in this field. They analysed financial ratios as predictors of economic problems in the first half of the 20th century. Beaver [13] expands risk management by univariate discriminant analysis of selected financial ratios. However, the best-known prediction model of financial distress is the Z-score model by Altman [14], which was published in 1968.
Similarly, Blum [15], Deakin [16], and Moyer [17] apply multivariate discriminant analysis (MDA). In this area, this approach is still one of the most widely used. In the twentieth century, authors created prediction models based on univariate or multivariate discriminant analysis and logit or probit models. The first logit model was developed by Ohlson in 1980 [18], and the first probit was published by Zmijewski in 1984 [19].
Table 1 reveals the overview of the literature review of prediction models in the Visegrad Group (V4). We realise that most authors prefer traditional methods, such as discriminant analysis and logistic regression, and artificial neural network (ANN) and support vector machine (SVM).
Prusak [39] summarises theoretical and empirical knowledge on prediction based on Google Scholar and ResearchGate databases from Q4 2016 to Q3 2017 in Central and Eastern Europe (Belarus, Bulgaria, the Czech Republic, Estonia, Hungary, Latvia, Lithuania, Poland, Romania, Russia, and Ukraine). The results demonstrate that research is mainly the most advanced in Estonia, Hungary, the Czech Republic, Poland, Russia, and Slovakia. We focus on results from the Czech Republic, Hungary, Poland, and Slovakia. The financial distress prediction is an attractive issue for researchers from the Slovak Republic at the end of the 20th century. Chrastinova [25] and Gurcik [26] proposed prediction models in the agricultural sector. The Altman model inspired these prediction models. Moreover, Durica et al. [40] designed CART and CHAID decision trees that predict the failure distress of companies. Then, prediction models were made using logistic regression [27,41,42]. In [39], Prusak demonstrates that the research deals with various statistical techniques, such as discriminant analysis, factor analysis, logit analysis, fuzzy set theory, linear probability techniques, the DEA method, and classification trees based mainly on financial ratios. On the other hand, the Czech research has been applied in many industries, such as non-financial, agricultural, manufacturing, cultural, transport, and shipping. In Hungary, research concentrated on a wide spectrum of financial ratios, macroeconomic indicators, and qualitative variables. Hajdu and Virag [24] proposed the first prediction model to estimate failure for Hungarian companies using MDA and logit approach. Then, Virag and Kristof [43] use the ANN model based on a similar database. The result shows that ANN achieves higher accuracy than previous models. Nyitrai and Virag [44] constructed a model using support vector machines and rough sets based on the same dataset for relevant comparison of the predictive ability. Stefko, Horvathova, and Mokrisova [45] apply data envelopment analysis (DEA) and the logit model in the heating sector in Slovakia. Musa [46] proposed a complex prediction model based on discriminatory analysis, logistic regression, and decision trees. On the other hand, Tumpach et al. [47] use oversampling with the synthetic minority oversampling technique (SMOTE). In the Czech Republic, Neumaier and Neumaierova [48] generated the prediction model on the principle of MDA. Then, Jakubik and Teply [20], Kalouda and Vanicek [49], and Karas and Reznakova [22] developed the research area by creating other prediction models. Karas and Reznakova [50] propose two CART-based models to solve the stability problem of the individual CART using 10-fold cross-validation. Kubickova et al. [51] compare the predictive ability of several models, such as the Altman model, Ohlson model, and IN05 model. The results indicate that the IN05 model is the best compared to the Altman model.
In Poland, Holda [52] is the pioneer of failure prediction using MDA. The model comprises five variables: current ratio, debt ratio, total assets turnover, return on assets, and days payable outstanding. Prusak [39] investigates the prediction model of failure distress based on advanced statistical methods, such as ANN, survival analysis, k-NN, and Bayesian networks. Kutylowska [53] estimates the failure rate of water distribution pipes and house connections using regression trees in Poland. The classification tree is applied to estimate quantitative or qualitative variables. Finally, Brozyna, Mentel, and Pisula [37] estimate bankruptcy using discriminant analysis and logistic regression in three sectors (transport, freight forwarding, logistics) in Poland and the Slovak Republic.
Similarly, Pawelek [54] compares the predictive accuracy of prediction models based on financial data on industrial companies in Poland. The methods used belong to classification tree, k-NN algorithm, support vector machine, neural network, random forests, bagging, boosting, naive Bayes, logistic regression, and discriminant analysis in the R program. Moreover, in [55,56,57], the authors examine failure prediction in Poland.
Most research papers deal with discriminant analysis, logistic analysis, and neural networks. However, we find out that the ensemble model is a new phenomenon in the field. The ensemble model is a learning approach to combine multiple models. The basic ensemble techniques include max voting, averaging, and weighted average. It is known that advanced ensemble techniques belong to bagging (bootstrapping, random forest, and extra-trees ensemble), boosting (adaptive boosting and gradient boosting), stacking, and blending. The primary purpose is to improve the overall predictive accuracy. Jabeur et al. [58] explain that the ensemble method is a suitable tool to predict financial distress in the effective warming system. The results show that classification performance is better than other advanced approaches. Wang and Wu [59] demonstrate that many prediction models are not appropriate for distributing financial data. However, they suppose that an ensemble model with a manifold learning algorithm and KFSOM is good at estimating failure for Chinese listed companies. Alfaro Cortes et al. [60] claim that risk management aims to identify key indicators for corporate success. They think that the prediction model generated by boosting techniques improves the accuracy of the classification tree. The dataset includes financial variables but also size, activity, and legal structure. The most significant ratios are profitability and indebtedness.
Ravi et al. [61] proposed two ensemble systems, straightforward majority voting based and weightage-threshold based, to predict bank performance. The ensembles include many models based on neural networks. The results demonstrate lower Type I error and Type II error compared to individual models. On the other hand, Geng et al. [62] find out that neural network is more accurate than decision trees, support vector machines, and ensemble models. The predictive performance is better in a 5-year time window than a 3-year time window. The results show that the net profit margin of total assets, return on total assets, earnings per share, and cash flow per share represents a significant variable in failure prediction.
Faris et al. [1] proposed a hybrid approach that combines a synthetic minority oversampling technique with ensemble methods based on Spanish companies. The basic classification applied in bankruptcy prediction is k-NN, decision tree, naive Bayes classifier, and ANN. Moreover, ensemble classification includes boosting, bagging, random forest, rotation forest, and decorate. The ensemble technique combines multiple classifiers into one learning system. The result is based on the majority vote or the computation of the average of all individual classifiers. Boosting is one of the most used ensemble methods. The prediction models were evaluated using AUC and G-mean. Ekinci and Erdal [7] predict bank failures in Turkey based on 35 financial ratios using conventional machine learning models, ensemble learning models, and hybrid ensemble learning models. The sample consists of 37 commercial banks, 17 of which failed. The ratios are divided into six variable groups: capital ratios, assets quality, liquidity, profitability, income–expenditure structure, and activity ratios (CAMELS). The classify methods are grouped by learners, ensembles, and hybrid ensembles. Firstly, base learners consist of logistic, J48, and voted perceptron. Secondly, ensembles include multiboost J-48, multiboost-voted perceptron, multiboost logistic, bagging-J48, bagging logistic, and bagging-voted perceptron. The hybrid ensemble learning model is better than conventional machine learning models in classification accuracy, sensitivity, specificity, and ROC curves.
Chandra et al. [63] proposed a hybrid system that predicts bankruptcy in dot-com companies based on 24 financial variables. The sample includes 240 dot-com companies, 120 of which failed. The system consists of MLP, RF, LR, SVM, and CART. They identify ten significant financial variables, such as retained earnings/total assets, inventory/sales, quick assets/total assets, price per share/earnings per share, long-term debt/total assets, cash flow/sales, total debt/total assets, current assets/total assets, sales/total assets, and operating income/market capitalisation based on t-statistics. Moreover, the results show that the ensemble model achieves very high accuracy for all the techniques. Huang et al. [64] suggested an SVM classifier ensemble framework using earnings manipulation and fuzzy integral for FDP (SEMFI). The results demonstrate that the approach significantly enhances the overall accuracy of the prediction model. Finally, Xu et al. [65] supposed a novel soft ensemble model (ANSEM) to predict financial distress based on various sample sizes. The sample includes 200 companies from 2011 to 2017. These companies are divided into training and testing samples. The data were obtained from the Baidu website. The authors apply stepwise logistic regression to identify six optimal traditional variables: working capital/total asset, current debt/sales, retained earnings/total asset, cash flow/sales, market value equity/total debt, and net income/total asset from 18 popular financial variables. The results show that ANSEM has superior performance in comparison to ES (expert system method), CNN (convolutional neural network), EMEW (ensemble model based on equal weight), EMNN (ensemble model based on the convolutional neural network), and EMRD (ensemble model based on the rough set theory and evidence theory) based on accuracy and stability in risk management.
Liang et al. [66] apply the stacking ensemble model to predict bankruptcy in US companies based on 40 financial ratios and 21 corporate governance indicators from the UCLA-LoPucki Bankruptcy Research Dataset between 1996 and 2014. The results show that the model is better than the baseline models. Kim and Upneja [2] generated three models: models for the entire period, models for the economic downturn, and models for economic expansion based on data from the Compustat database by Standard and Poor’s Institutional Market Services in WEKA 3.9. The period is divided into economic recession and economic growth according to the NBER recession indicator. The sample includes 2747 observations, 1432 of which failed. The primary purpose is to develop a more accurate and stable business failure prediction model based on American restaurants between 1980 and 1970 using the majority voting ensemble method with a decision tree. The selected models achieve different accuracy: the model for the entire period (88.02%), the model for an economic downturn (80.81%), and the model for economic expansion (87.02%). Firstly, the model for the entire period indicates significant variables, such as market capitalisation, operating cash-flow after interest and dividends, cash conversion cycle, return on capital employed, accumulated retained earnings, stock price, and Tobin’s Q. Secondly, the model for the economic downturn reveals different variables, such as OCFAID, KZ index, stock price, and CCC. Thirdly, the economic expansion model includes most of the previous models except for Tobin’s Q, stock price, and debt to equity ratio. The essential contribution is comprehensively to assess financial and market-driven variables in the restaurant industry. Furthermore, Ravi et al. [61] apply various neural network types, SVM, CART, and principal component analysis (PCA).
Moreover, Kim and Upneja [2] demonstrate that companies with low operating cash flow after interest and dividends (OCFAID), high KZ index (cost of external funds), and low price index should especially be careful during economic downturns. Moreover, companies with high stock prices and a long cash conversation cycle (CCC) indicate a strong relationship between the company and suppliers. In other words, companies have a higher likelihood to survive during economic recessions. Finally, the result shows that an ensemble model with a decision tree improves prediction accuracy.

3. Methodology

The methodology process consists of several parts, such as determining the primary object, analysing the literature review, identifying the sample, dividing the sample, identifying the financial variables, proposing the prediction model, verifying the model, assessing predictive accuracy, and comparing and discussing the proposed model with another model in the region. At first, we describe the total sample, financial variables, and methods.
Total sample. We collect data from the Amadeus database by Bureau van Dijk/Moody’s Analytics [67] composed in 2020. Moreover, we use the same sample from previous research by Durica et al. [40], Adamko et al. [68], and Kliestik et al. [69]. Table 2 shows that the sample includes 16.4% of companies that failed in 2017. We identify a failed company as an entity that goes bankrupt based on the year-on-year comparison of 2017/2016. The proposed model was trained on the financial variables from 2016 and the financial distress statement of 2017. All model elements were primarily trained on a 90% sub-sample and validated and adjusted on the remaining 10% sub-sample. Moreover, we used 5- or 10-fold cross-validation. After the final adjustment, the model was used to predict the business failure in 2018 based on the financial variables from 2017.
Financial variables. We summarise theoretical knowledge on ensemble models focusing on dependent variables according to [2,5,7,8,59,61,62,63,65,66,70]. This research applies a wide spectrum of financial variables to estimate financial distress. We find that all researchers use overall 553 variables and an average of more than 32 predictors. Table 3 reveals an overview of the most often used financial variables in this field.
The dataset includes 27 financial variables based on theoretical and professional knowledge. Table 4 shows all financial variables divided into four groups: activity, liquidity, leverage ratios, and profitability. We maintained the same indexing of variables as in the research mentioned above [40,69] for ease of reference and comparison.
Methods. While the dataset is imbalanced and skewed towards profitable companies or vice versa, selecting an appropriate prediction performance metric is very important. The quality of the developed models was measured by AUC—area under the ROC (Receiver Operating Characteristic) curve. The ROC curve reveals a trade-off between the indication of sensitivity and specificity of a model. However, the AUC is suitable for the evaluation and comparison of the models. The value of AUC above 0.9 is usually considered an excellent result [71,72]. Furthermore, AUC was the prime metric for parameter adjustments of the model and its elements due to its independence from the threshold settings.
Expect for AUC, some metrics derived from the confusion matrix were also used to measure the models’ quality. This matrix stores numbers of true positives (TP), true negatives (TN), false positives (FP), and false negatives (FN). These values are usually used for the calculation of many measures. From these, we use an accuracy (ratio of all positives to all cases), sensitivity (also True Positive Rate—TPR), specificity (also True Negative Rate—TNR), and F1 Score defined by Equation (1).
F 1   Score = 2 TP 2 TP + FN + FP .
As Chicco and Jurman [73] state, the accuracy, AUC, and F1 Score are biased by highly imbalanced class distribution while the Matthews correlation coefficient (MCC) is not. Therefore, MCC is the secondary metric for model tuning. It can be calculated by Equation (2).
MCC = TP TN FP FN ( TP + FP ) ( TP + FN ) ( TN + FP ) ( TN + FN )
The study provides all the mentioned performance metrics. However, the AUC and MCC are the primary ones for comparison, validation, and parameter adjustment. The calculations and methods were conducted in the MATLAB 2019a environment and MATLAB Online (cloud).

3.1. Model Composition and Settings

As stated in the literature review, more sophisticated methods are used in the present research, including ANN, ensemble models, SVM type models, etc. While the results of SVM and ANN are excellent, the reproducibility is disputable, and the computational complexity and time consumption is enormous. Thus, as the “cornerstone” of the proposed model, we elected an ensemble model with a boosting algorithm. However, boosting algorithms are more predisposed to overfitting, as the authors state in [74]. So, we decided to supplement the primary element with two other auxiliary elements that should fight the possible overfitting of the boosting method by adding appropriate bias while not harming the variance. The CART and k-NN methods were selected for this purpose because both are easy to reproduce, not very demanding in terms of computational time, and are successfully used in this sphere of research.
Although this study involves the model’s results designed by plurality voting or score averaging, the final model is created by weighted averaging, i.e., stacking of the strong learners. The former two serve mainly to justify the reason for the final one.
The RobustBoost method was selected as the main component of the model. It belongs to the family of boosting algorithms such as popular AdaBoost and LogitBoost [75]. As with other boosting algorithms, it combines an ensemble of weak learners (e.g., decision trees with only a few levels) through weighted score averages into a final model. In contrast to the bagging, subsequent iterations aim to eliminate a weak spot of the previous iteration. Dietterich [76] pointed out the sensitiveness of AdaBoost to random noise in the dataset. In other words, the chance of overfitting rises with noisy data due to the dataset size [77]. To overcome this problem, Freund [78] designed the RobustBoost algorithm that is significantly more robust against label noise than either AdaBoost or LogitBoost. Since we are aware of label noise in the dataset, we choose RobustBoost as the main element of the model instead of more popular boosting algorithms in this sphere—such as the AdaBoost or LogitBoost mentioned above.
The RobustBoost is a boosting algorithm that its author introduced in 2009 [78], where the author presents it as a new, more robust algorithm against label noise than the already existing algorithms (AdaBoost and LogitBoost). The reason for creating this algorithm was the fact that the earlier algorithms were all based on convex potential functions, the minimum of which can be calculated efficiently using gradient descent methods. However, the problem is that these convex functions can be defeated by the random label noise. LogitBoost can be shown to be much more robust against label noise than AdaBoost, but Long and Servedio [79] have shown that random label noise is a problem for every convex potential function. Therefore, the new algorithm, Robustboost, is based on a non-convex potential function that changes during the boosting process. Thus, it is even more robust than the Logitboost against label noise.
The basis of the new algorithm is Freund’s Boost-by-Majority algorithm (BBM) [80]. The author of the algorithm states in [78] that finding a solution (minimising the number of errors in training examples) is possible for most but not for all training examples in the practical use of boosting algorithms. Therefore, he redefined the goal of the boosting algorithm to minimise the so-called margin-based cost function. The potential function for Robustboost is defined as a function of time and other parameters that are either selected as input parameters, searched by cross-validation, or calculated so that the algorithm terminates with a reasonable number of iterations. All technical details of this algorithm are given in [78].
The secondary element is the CART model. As mentioned above, rigid data distribution conditions and other strong model assumptions are not required. The most significant advantages of the decision trees lie in their easy understandability, interpretation, and implementation. Another positive factor is that the variables do not need to meet any specific requirements and can be even collinear. Moreover, the outliers and missing values do not present obstacles [81]. Based on these characteristics, the decision tree is a suitable auxiliary candidate for the ensemble model.
The method of k-nearest neighbours (k-NN) was elected to be the tertiary element. As Brozyna et al. [37] briefly characterise, this method is based on a classification of the observation according to the affiliation and distance of k nearest objects in multidimensional space. According to the selected distance metric, the classification of the observation is managed via the plurality vote of its k nearest neighbours. The algorithm creates a binary tree structure repetitively dividing classified entities by a hyperplane defined by the median. Although trees do not learn any parameters, the neighbour number setting is crucial in balancing the bias versus variance.
The initial weights distribution was estimated according to the recent research done in this field of interest. Brozyna et al. [37] or Sivasankar et al. [82] show that the CART performs better than k-NN. Research by Adamko and Siekelova [83] and Pisula [84] show that ensemble models, whether boosting or bagging, are achieving even higher accuracy and more valuable results. Hence, the weight of the main element was present to the highest proportion. The initial scores proportion was set as follows—a ratio of RobustBoost-to-CART-to-k-NN is 50-to-35-to-15. Nevertheless, the final voting proportion is one of the issues in this study.
The study’s primary goal lies in creating a robust model with easy usability on a real-life dataset without initial standardising or normalising the data. However, in reality, the proportion of profitable companies to failing ones is imbalanced, and acquired datasets contain missing data or label noise. Therefore, training models on such data could lead to specificity instead of sensitivity or may be corrupted by unstandardised data input. Hence, the initial set of parameters, which differs from the default, is summarised in Table 5.
The last column in Table 5 shows whether the parameters were examined in the adjustment phase of elected parameters. However, there is a need to declare that the adjustment phase logically follows minimal appropriate index composition.
We used the iterative method to find out the most suitable parameter values. We monitored AUC and MCC metrics throughout the iteration process with the validation and resubstitution classification loss. In general, the classification error or loss is the weighted fraction of misclassified observations. Such an error measured in the validation sub-sample is called the validation loss. When measured in the training sub-sample, this error is referred to as the resubstitution loss. We looked for the appropriate interval where the AUC and MCC metrics showed good results in the first step. Afterwards, we examined the interval with a focus on a proper balance between these classification losses.
The iterations were made on ten random training and validating samples (folds) with a ratio of 90% to 10% (size of training to validation sub-sample). However, in the RobustBoost algorithm, it was only five folds due to a high computational time.

3.2. Methods for Minimal Appropriate Index Composition

Methods such as RobustBoost or CART do not have any problems with a higher number of indices that can be multicollinear or even duplicated. On the other hand, the method of nearest neighbour can suffer the so-called “curse of dimensionality” [85,86]. However, the goal was to find the minimal appropriate indicator set because we believe the lower the number of indices, the higher the model’s usability. Therefore, we used two opposing strategies to fulfil this goal and chose better results according to the achieved AUC value.
The first strategy lies in the stepwise elimination of predictors from the initial set. At first, we calculated the primary metrics for each variable as it would be a model with just one predictor. We selected such variables that achieved sufficient level to fill up the initial set of predictors (MCC > 33%, AUC > 75%). Then, we followed with stepwise elimination. The motivation for this strategy lies in the assumption that the elimination of one predictor from the correlated pair would not significantly impact the performance of the model. We created a descending ordered list of correlated pairs according to the correlation values. Then, we eliminated one index from the pair according to the performance value. So, we proceeded until the correlation was lower than 0.25 or until the elimination would not harm the final AUC value.
On the contrary, the second strategy was based on stepwise predictor set growth. The motivation was similar as in the previous case, i.e., to find the minimal predictor set. Moreover, we wanted to find out if the indicator set would differ from the previous strategy or not. In this case, we started with a model that uses just one predictor with the best performance value. In the second step, we added another uncorrelated predictor from the whole set of variables and calculated the metrics. This procedure was repeated until all uncorrelated variables were used. So, we found the two best combinations of the two predictors. Then, this procedure was repeated, and we found the two best combinations of three predictors, etc. We repeated this step until no correlated indices or the AUC value did not grow in the two following iterations. While this procedure may not find the optimal solution, the solution may be better than straightforward adding and examining only the one best combination after another. It is slightly more resistant to getting stuck in a local optimum. Nevertheless, examining all possible combinations, also known as the branch and bound algorithm, would be too exhausting.

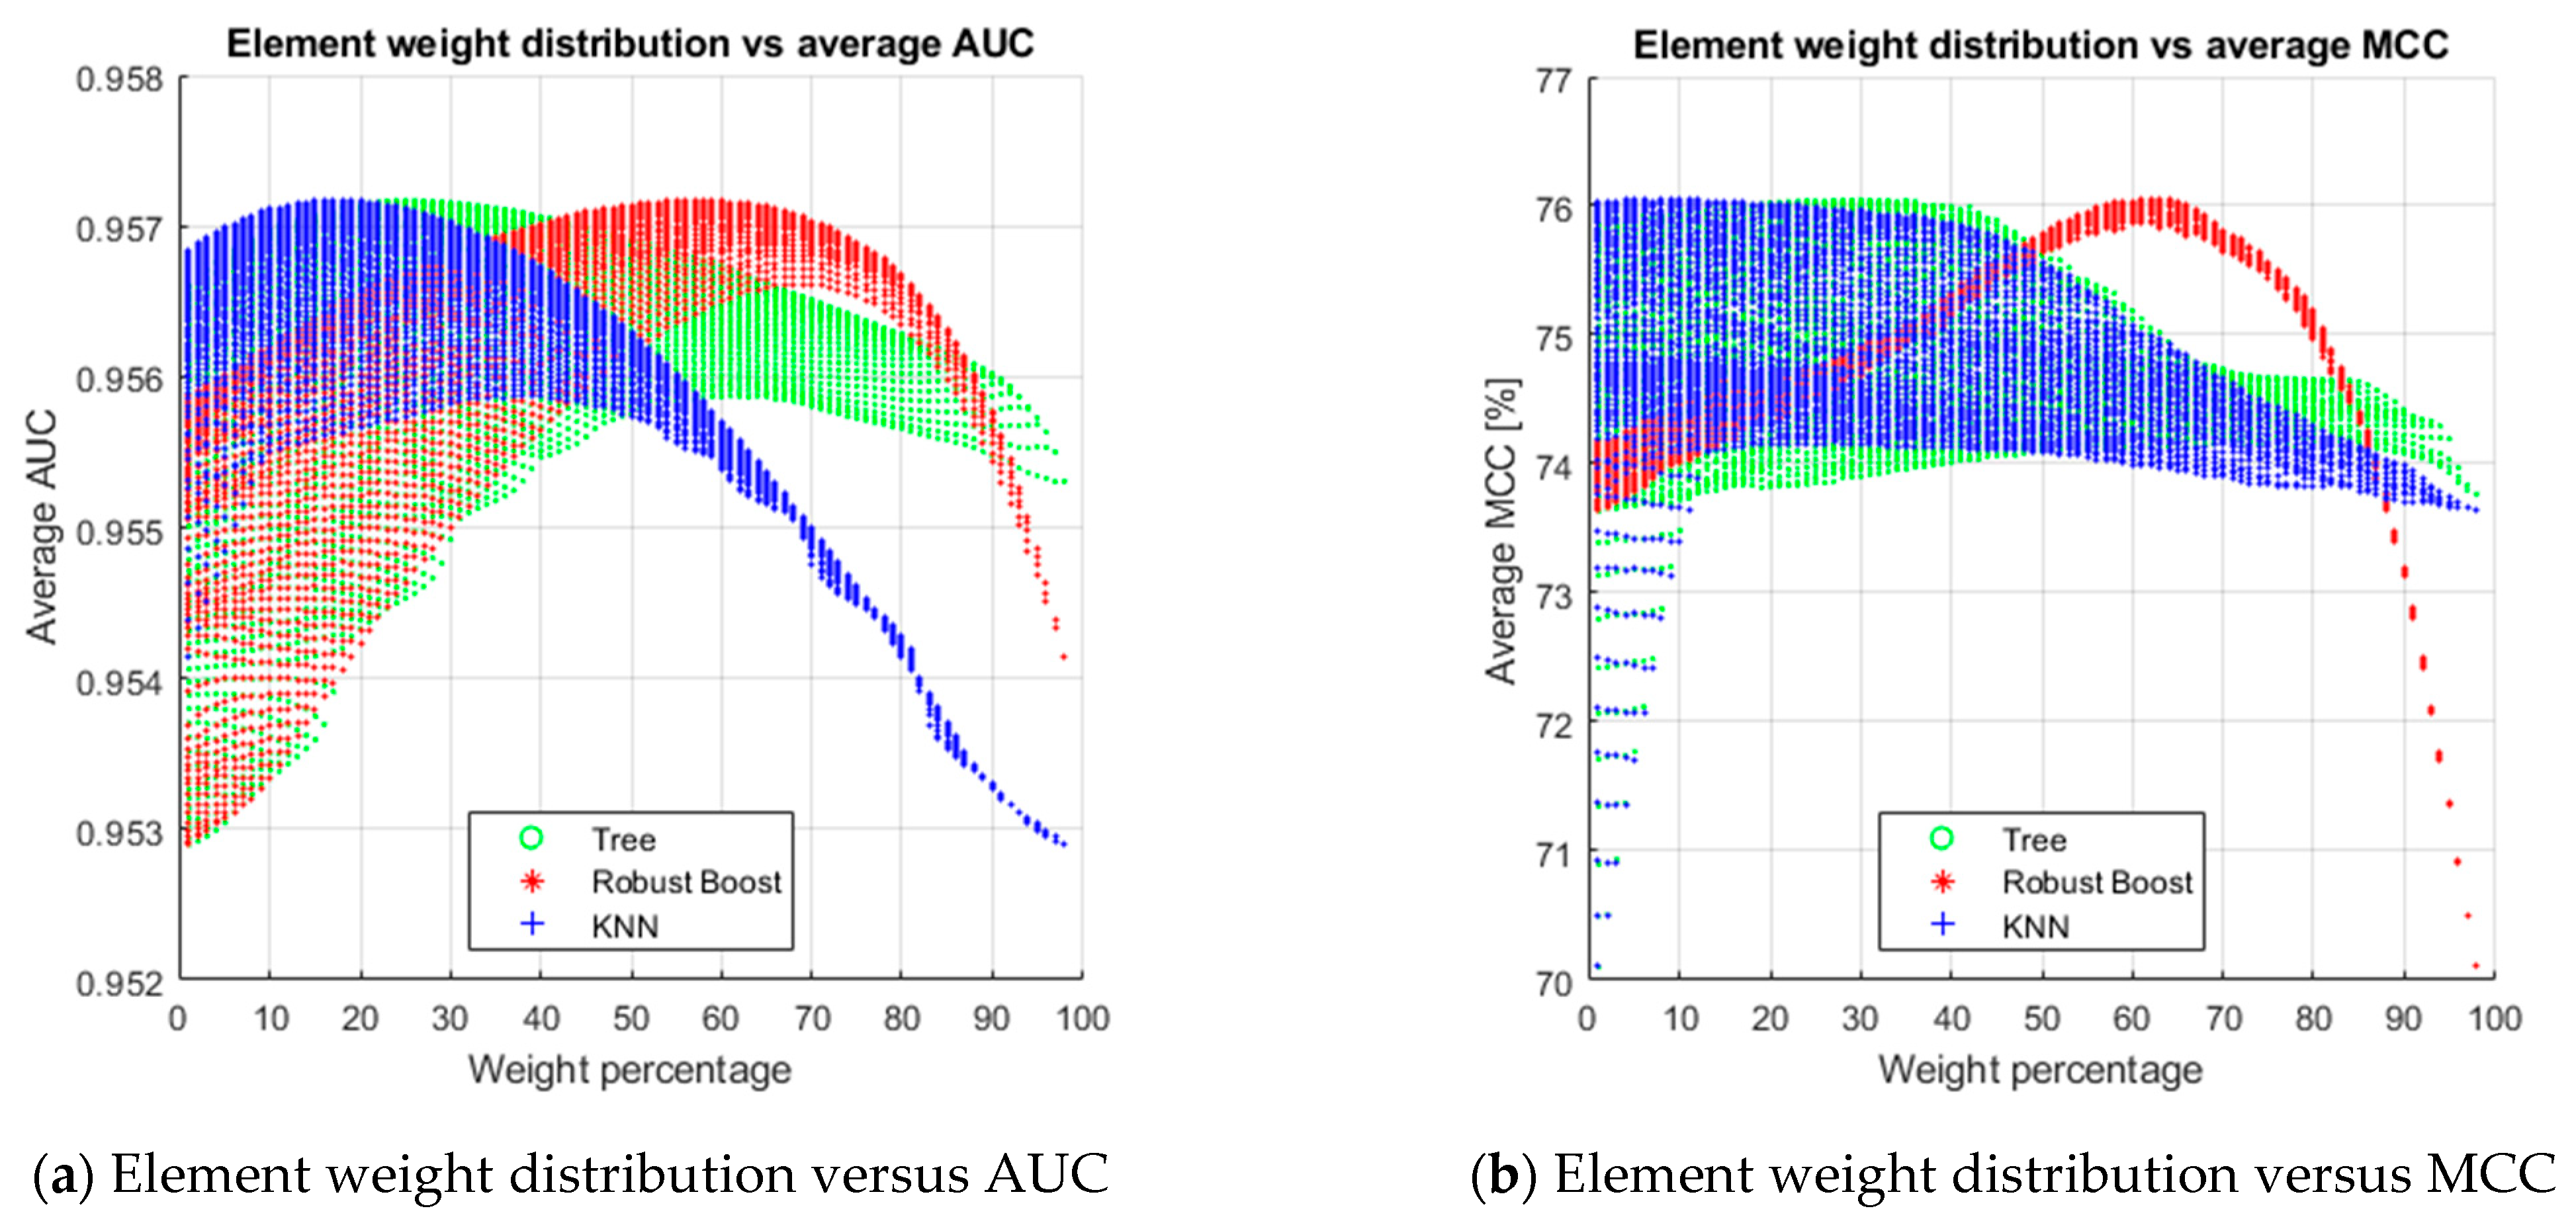
3.3. Optimal Weights and Threshold Setting

While the study also contains results for the simple plurality voting model and the model based on simple mean, the final model is based on weighted averaging of the element scores. To fulfil this goal, each possible non-zero integer combination of the score weight percentage of the model elements were calculated for each of 5 folds. The 5-fold average of AUC and MCC metrics were calculated for each combination. The best weight distribution was selected accordingly.
The model threshold was found by moving the straight line with slope S from the upper left corner ( x = 0 ,   y = 1 ) of the ROC plot to the lower right corner ( x = 1 ,   y = 0 ) until it intersects the ROC curve, where the slope S is given by:
S = Cos t ( FN ) Cos t ( TN ) Cos t ( FP ) Cos t ( TP ) TN + FP TP + FN .
Cos t ( TN   and   TP ) represent the costs for correctly classifying and are usually set to zero, as in our research. Cos t ( FN ) is the cost of misclassifying a positive class, and Cos t ( FP ) is the cost of misclassifying a negative class. Depending on the preferences between Type I error and Type II error, they may differ, but we did not distinguish their cost in our research, and both are set to one. Therefore, the slope S is given by the ratio of the total number of positive to negative entries in the sample.

4. Results

The model creation process is divided into four steps: identifying significant variables, adjusting selected parameters of the prediction model, determining weight composition and threshold values, and calculating the business failure prediction in V4 with performance metrics.
Identification of significant variables. In this step, we have used two opposing strategies as described in the methodology. At first, we needed to calculate performance metrics for all financial variables. We found out that seven of 27 variables are sufficient to predict financial distress in the model consisting of only one predictor, such as current assets/current liabilities (X02), net income/total assets (X07), EBIT/total assets (X09), total liabilities/total assets (X10), current liabilities/total assets (X15), (current assets—stock)/current liabilities (X26), and current assets—current liabilities (X36). These predictors formed the initial set for stepwise elimination. As it can be seen in Table 6, the elimination process stopped after three steps with the highest AUC value, and the set contains four predictors (X02, X07, X10, and X36). Then, we applied the second strategy, i.e., the growth procedure, to determine if the predictor set would be different. We started with the X10 predictor (debt ratio) as the strongest one-predictor model and finished the growth with six predictors, as shown in Table 6.
The table summarises the outcome of both strategies. The elimination method determines four significant variables: current ratio (X02), return on assets (X07), debt ratio (X10), and working capital (X36). However, the growth strategy found the same predictors, but two other predictors got into the selection as well, namely the return on equity (X04) and the net profit margin (X20). The difference in the AUC score was subtle but higher. These two predictors, which were omitted and did not get to the initial set for the elimination, showed potential as the suitable complementary predictors even though they are as weak as a stand-alone one.
Although the elements should be resistant to requirements about distribution and collinearity, the k-NN element shows higher sensitivity to the number of predictors in the model as we observed in the data from the process. Table 7 identifies the worse performance of this element compared to the only two-combination of variables X07 and X10. It can be related to the curse of dimensionality, in other words, points that are close together based on probability distribution in higher-dimensional space.
This behaviour was absent in the two remaining model elements. The whole procedure was repeated with one significant change. The composition of a k-NN element was fixed to these two predictors. The elimination and the growth procedure were concerned with two remaining elements in the model. As can be seen in Table 8, the AUC slightly rose. On the other hand, the variable X20 did not get into the final set of predictors in this second iteration of the growth strategy; i.e., its insertion would not positively contribute to the AUC score. Moreover, this fulfils the goal of finding the best minimal predictor set even better.
Both iterations achieved very similar results. However, the final set of financial variables does not include X20 based on the second iteration. AUC and sensitivity slightly increased in this iteration. On the other hand, other metrics slightly decreased, but the AUC metric was chosen as the main optimisation criterion at the beginning. The weight of the k-NN element score is initially set to 15% in the model, so the impact on the overall performance is low. Thus, based on our primary metric, we decided that the final financial variables include X02, X04, X07, X10, and X36. However, the k-NN element is firmly associated with the predictors X07 and X10 in the final model.
Adjustment of the parameters. The RobustBoost method, as the first model element with the highest weight in the model, has three specific parameters. We did not examine two of them, namely, Robust Maximal Margin and Robust Maximal Sigma, and they stayed at the default setting. Instead, we focus on determining the optimal value for the third parameter, namely, Robust Error Goal (REG). Setting this parameter too low can lead to a long computational time or even an error message because the algorithm is self-terminating, unlike the AdaBoost algorithm. On the other hand, setting REG to a high value can lead to a rapid but poor result.
We determined that the optimal value of this parameter is 3.6% because the AUC and MCC metric achieve relatively stable and high values in this area, while the resubstitution and validation classification loss were the lowest, as can be seen in Figure 1c,d. If the REG is more than 5%, the AUC decreases continuously. However, the MCC was relatively stable around 75.5%, until REG rose to 9%; then, it dropped sharply to 69% (note: not shown in the figure).
The number of weak learners is not any specific feature of the RobustBoost algorithm. However, it is a standard parameter in all ensemble models. For example, Leong [77] examined that too low a number may lead to a high loss. Still, too high a number may lead to an increased probability for wrong predictions due to overfitting, albeit with a lower loss at the training sample. Thus, it is essential to find an appropriate setting. Figure 2 shows the relationship between the AUC or MCC and the number of weak learners and the confrontation of the validation or resubstitution classification loss with this number.
The increase is steep at the very beginning of the monitored range, as shown in Figure 2a,b. At the point of 100 learners, the AUC increase in the trend is subtle, while the MCC is relatively settled. Therefore, the number of weak learners remained at the default setting, 100 learners. Apart from rising time consumption, both the metrics and the classification loss did not show any significant improvement.
The second model element is the CART. The decision trees can have a wide spectrum of terminating conditions, namely, the purity of the leaf, the maximal number of decision splits, and the minimal number of leaf node observations. All the conditions are not completely independent of each other. In other words, if the maximal number of splits is too low and then the minimal number of leaf observations is changed to a small value, then this change does not affect the results at all.
During the process, it showed up that a higher number of splits made the decision tree homogenously wider, and a smaller leaf membership leads to the deeper tree with different levels of branch depth.
We apply the percentage of total observation in the training sample instead of the raw number for the minimal number of leaf node observations. Still, this branch did not lead to a satisfying result. A subtle improvement was achieved when too small percentages were set but at the cost of a greater probability of overfitting and a huge tree. Therefore, the maximal number of decision splits was the only parameter that was adjusted to 40. The level was set based on the classification loss situation described in Figure 3. We emphasise that resubstitution classification loss stabilised at the 40-node point and stayed stable until the 70-node point. From this point, it began to fall again slowly. However, Figure 3 also reveals a rising variance of the validation classification loss among validation samples at this point. It means that more than 70 of the maximal number of decision splits may lead to overfitting.
The last element to set was a k-NN element. Two parameters were inspected in the k-NN element. The most significant parameter is the number of neighbours, while the distance metrics show almost zero difference among the results.
The bias-variance balancing point according to the resubstitution and validation loss was found near 300 neighbours. This point suits ACC as well as MCC. However, Figure 4 identifies that loose variability of validation loss with narrow variability of resubstitution loss repeats as in CART.
We emphasise that k-NN is a demanding algorithm in terms of computer memory, especially with a rising number of entries and a rising number of neighbours. For example, a hundred neighbours would be sufficient without a significant algorithm performance impact in the case of a more comprehensive dataset or a smaller memory system.
Determining weight composition and the threshold value. First, we examined all possible non-zero integer combinations on five folds. Then, the average of AUC and MCC was calculated for each combination. While a specific combination cannot be seen in Figure 5, the lower area border of the specific element shows the worst case of combining the remaining two other elements. The upper edge shows the best combination scenario for the selected weight of the element.
The results show that the RobustBoost algorithm is the most significant element of the prediction model. Therefore, the weight composition of the final model is set to 65% for the RobustBoost, 20% for the CART, and 15% for the k-NN scores.
The threshold value of the model is set to 0.58. In general, this setting is a kind of trade-off between accuracy and sensitivity. If the threshold value was higher, the accuracy would be higher, and the sensitivity would be lower due to an imbalanced dataset. On the other hand, if the threshold value was lower, sensitivity would be lower, too.
Calculating performance metrics. We create three prediction models, the first model based on simple plurality voting, the second model based on average scores, and the final proposed model based on weighted averaging of the element scores. Table 9 summarises the performance results of all prediction models.
Figure 6 shows nominal numbers of distress prediction in V4. Again, we emphasise that our preference determines the threshold value. For example, if the threshold value is set to 0.37, the accuracy, sensitivity, and specificity would be equal to 91%. On the other hand, precision would fall from 83% to 66%. Moreover, F1Score and MCC metrics would be reduced by six percentage points.
Table 10 identifies that RobustBoost as the main element of the final model outperforms CART, k-NN, the voting model, and the average model. Nevertheless, these models achieve excellent performance based on the ROC curve and other metrics. In other words, all these models can be used as standalone tools to predict financial distress with the proposed settings.
Figure 7 shows the ROC curve of all proposed models. As can be seen, these models achieve relatively similar results. We find out that the ROC of all models reaches more than 95%.
However, the detail of the upper left corner of the ROC curve identifies that the final model is better than the other models. The same fact is supported by the performance metrics provided in Table 10.
To demonstrate the robustness of the model, we compared our proposed model with the existing models dealing with the financial distress prediction in the Visegrad region. Moreover, we provide the model results for each Visegrad member country. Table 11, altogether with Figure 8, shows similar results that demonstrate the solid robustness of our model.
All metrics and even the ROC curves are very similar; therefore, we also provide the detail of the upper left corner to better distinguish among the results, but with lower zoom as in the previous figure. Thus, although these partial results are very similar with small differences, which approves the robustness, the model seems to suit the Czech Republic more than other countries.

5. Discussion

In this paper, we concentrate on improving the performance metrics of the prediction model to estimate financial distress in V4 using the specific tool—ensemble method. Liang et al. [66] explain that ensemble techniques improve prediction accuracy. Adamko and Siekelova [83] proposed a prediction model using an ensemble model. They use 14 financial variables, such as total asset turnover, current asset turnover, cash ratio, quick ratio, current ratio, net working capital/total assets, EAT/total assets, EBIT/total assets, net profit margin, retained earnings/total assets, debt ratio, current liability/total assets, credit indebtedness, and equity/total liabilities based on previous theoretical scope. This research was developed by different financial ratios. The authors identify essential financial variables using different approaches, such as the elimination and growth method. The results indicate that significant variables are current assets/current liabilities (X02), ROA/total assets (X07), total liabilities/total assets (X10), current assets/current liabilities (X36), but also net income/shareholder’s equity (X04). In other words, bankruptcy is determined by liquidity, debt ratio, and profitability. We emphasise that none of the variables belong to activity ratios. Kovacova et al. [87] summarise specific indicators in V4. According to the study, activity ratios have the smallest representation in the prediction models. The other ratios reflect the financial stability of a company. In general, a high debt ratio can indicate a higher risk for a potential investor. Moreover, Adamko and Siekelova [83] explain that the failed company defined by equity/liabilities is less than 0.4, the quick ratio is less than 1, and there is a negative EAT. If these criteria are met, the company has failed.
To justify using our comprehensive model and to support its robustness, we compared the presented model with other models from various previous papers dealing with the financial distress prediction, especially in the Visegrad group region. While it is difficult to reproduce more complex models due to insufficient specification in the published papers, we decided to prove the validity of our research and model robustness compared to mainly probit or logit models used in the specific region or worldwide. However, comparison contains also one more complex model, namely CART of Durica et al. [40], that can be reproduced. Furthermore, all models were compared on the same whole sample of the year 2017.
Durica et al. [40] created a prediction model using decision trees. They collect data on Polish companies from the Amadeus database. The results indicate that the decision tree reaches a prediction ability of more than 98%. Moreover, the model is good at predicting default companies. In 1984, Zmijewski [19] created a probit model based on listed companies. The model includes intercept and three financial variables, such as EAT/total assets, total debt/total assets, and current assets/current liabilities. The results identify non-default and default companies. If the default probability is more than 50%, the company is a non-prosperous entity. The probit and logit models have easily interpreted the likelihood of failure distress. We find out that the presented ensemble model reaches better accuracy than others based on the ROC curve and other metrics. Table 12 reveals that the models by Kliestik, Vrbka, and Rowland [69] achieve low predictive accuracy of more than 70%. On the other hand, the Zmijewski model reaches better accuracy despite being designed in different conditions and using a significantly smaller set of predictors. Moreover, we compare the proposed model to another model published by Adamko et al. [68] and designed for financial distress prediction in Slovakia.
Kliestik, Vrbka, and Rowland [69] identify many variables; especially, two of thirteen variables are dummy variables. Its weaker performance may be due to a high correlation between some pairs of predictors of more than 0.7 among several variables. This fact does not automatically mean there is some multicollinearity. However, altogether with the good results of models with a lower number of predictors, this fact confirms the assumption that more predictors do not mean better results and supports the methodology used in this study. Many variables can also lead to the curse of dimensionality [70,86]. We see its impact on logit and probit models, which may lead to potential research to find an optimal minimal variable set or use stepwise elimination in the existing models to improve their performance.
Table 12 summarises the results of the final model and other models. Moreover, all models reach better accuracy, F1 Score, and MCC than each examined compared model except for the k-NN element, which is slightly weaker than Durica’s CART model. Table 13 demonstrates the presented model with other models based on several aspects.
Figure 9 shows that the final model achieves higher values than the compared models except for the simple voting model based on the ROC curve. Although even the not zoomed chart of the ROC curve demonstrates the dominance of the proposed model to compared ones, we provide a detail of the upper left corner for more straightforward resolution among the models. Please note that the zoom power is lower than in the detail of Figure 7.
The final model is excellent to predict financial distress in the region. The Robust-Boost algorithm achieves better results than compared models. Therefore, it can be used as a stand-alone method to predict financial distress. Moreover, two other elements, namely CART and the k-NN method, achieve comparable results to the best models. Nevertheless, the k-NN method is the least useful to apply as a stand-alone method because its performance metrics were the lowest among the elements. The findings are based on research by Brozyna, Mentel and Pisula [37], Pisula [84], and Sivasankar et al. [82].

6. Conclusions

In the paper, we propose a prediction model for many sectors to estimate company failure in the Visegrad group countries using the ensemble model based on relevant financial variables from the Amadeus database by Bureau van Dijk/Moody’s Analytics [67]. The prediction model identifies in advance strengths and weaknesses in risk management. These results contribute to improving the stability, prosperity, and competitiveness in the region. Therefore, we are convinced that research on the prediction model is significant for most stakeholders.
The primary motivation is to decrease the direct and indirect cost of business bankruptcy using an ensemble model consisting of RobustBoost, CART, and k-NN. The method offers various kinds of benefits to business partners, bank institutions, investors, and politicians. We think that the ensemble model is an attractive technique to improve predictive accuracy. The results demonstrate that models achieve better predictive accuracy than single models by Zmijewski [19], Kliestik, Vrbka, and Rowland [69], Adamko, Kliestik, and Kovacova [68], and Durica, Frnda, and Svabova [40] based on all provided performance metrics. The findings offer new knowledge to improve the performance of financial distress prediction in Central Europe.
We identify several limitations of our study. Firstly, the model is relatively fast, especially in comparison to ANN and SVM. However, the iteration process was demanding on computational time due to computer equipment. In addition, many calculations were conducted in the MATLAB cloud that also has its limitations. Secondly, the ensemble model is different from traditional methods, for example, discriminant analysis and logistic regression, because we cannot explain the relationship among variables in the prediction model. This feature is a considerable disadvantage for many financial analysts, but we provided all the necessary settings to reconstruct the model. Finally, the limitation of our model is that it was trained based on financial ratios from one year. Thus, the dynamics of the ratios and the use of macroeconomic indicators could not be included in the model.
We think that future research can be focused on the performance of classified ensembles consisting of MDA, LR, SVM, and ANN models. First, these methods can improve performance metrics. Secondly, we can create various possible ensembles based on an individual prediction model to identify the most effective ensemble model. Thirdly, regional models can be used to compare with the proposed model. Finally, however, we can verify the model on companies from other European regions. The potential results can be beneficial for developing theoretical and empirical knowledge on financial risk management.

Author Contributions

Conceptualisation, M.P. and M.D.; methodology, M.P.; software, M.P.; validation, M.P., M.D. and J.M.; formal analysis, M.P. and J.M.; investigation, M.P., M.D. and J.M.; resources, M.P., M.D. and J.M.; data curation, M.D.; writing—original draft preparation, M.P.; writing—review and editing, M.P., M.D. and J.M.; visualisation, M.P.; supervision, M.P. and M.D.; project administration, M.D.; funding acquisition, M.D. All authors have read and agreed to the published version of the manuscript.

Funding

This research has been funded by Slovak Grant Agency for Science (VEGA), Grant No. 1/0157/21.

Institutional Review Board Statement

Not applicable.

Informed Consent Statement

Not applicable.

Data Availability Statement

The data presented in this study are available on request from the corresponding author.

Acknowledgments

This article has benefited from constructive feedback on earlier drafts by the editors, the chief editor, and the anonymous reviewers.

Conflicts of Interest

The authors declare no conflict of interest.

References

  1. Faris, H.; Abukhurma, R.; Almanaseer, W.; Saadeh, M.; Mora, A.M.; Castillo, P.A.; Aljarah, I. Improving Financial Bankruptcy Prediction in a Highly Imbalanced Class Distribution Using Oversampling and Ensemble Learning: A Case from the Spanish Market. Prog. Artif. Intell. 2020, 9, 31–53. [Google Scholar] [CrossRef]
  2. Kim, S.Y.; Upneja, A. Majority Voting Ensemble with a Decision Trees for Business Failure Prediction during Economic Downturns. J. Innov. Knowl. 2021, 6, 112–123. [Google Scholar] [CrossRef]
  3. Hsieh, N.-C.; Hung, L.-P. A Data Driven Ensemble Classifier for Credit Scoring Analysis. Expert Syst. Appl. 2010, 37, 534–545. [Google Scholar] [CrossRef]
  4. Valentini, G.; Masulli, F. Ensembles of Learning Machines. In Italian Workshop on Neural Nets 2002 May 30; Marinaro, M., Tagliaferri, R., Eds.; Springer: Berlin/Heidelberg, Germany, 2002; pp. 3–20. [Google Scholar]
  5. De Bock, K.W.; Coussement, K.; Lessmann, S. Cost-Sensitive Business Failure Prediction When Misclassification Costs Are Uncertain: A Heterogeneous Ensemble Selection Approach. Eur. J. Oper. Res. 2020, 285, 612–630. [Google Scholar] [CrossRef]
  6. Liu, J.; Wu, C. Hybridizing Kernel-Based Fuzzy c-Means with Hierarchical Selective Neural Network Ensemble Model for Business Failure Prediction. J. Forecast. 2019, 38, 92–105. [Google Scholar] [CrossRef]
  7. Ekinci, A.; Erdal, H.İ. Forecasting Bank Failure: Base Learners, Ensembles and Hybrid Ensembles. Comput. Econ. 2017, 49, 677–686. [Google Scholar] [CrossRef]
  8. du Jardin, P. Failure Pattern-Based Ensembles Applied to Bankruptcy Forecasting. Decis. Support Syst. 2018, 107, 64–77. [Google Scholar] [CrossRef]
  9. FitzPatrick, P.J. A Comparison of the Ratios of Successful Industrial Enterprises with Those of Failed Companies. Certif. Public Account. 1932, 6, 727–731. [Google Scholar]
  10. Merwin, C.L. Financing Small Corporations in Five Manufacturing Industries, 1926–1936; NBER Books; National Bureau of Economic Research, Inc.: New York, NY, USA, 1942. [Google Scholar]
  11. Ramser, J.R.; Foster, L.O. A Demonstration of Ratio Analysis; Bulletin; Bureau of Business Research, University of Illinois: Urbana, IL, USA, 1931. [Google Scholar]
  12. Smith, R.F.; Winakor, A.H. Changes in the Financial Structure of Unsuccessful Industrial Corporations; Bureau of Business Research. Bulletin; University of Illinois (Urbana-Champaign campus): Champaign, IL, USA, 1935. [Google Scholar]
  13. Beaver, W.H. Financial Ratios As Predictors of Failure. J. Account. Res. 1966, 4, 71–111. [Google Scholar] [CrossRef]
  14. Altman, E.I. Financial Ratios, Discriminant Analysis and the Prediction of Corporate Bankruptcy. J. Financ. 1968, 23, 589–609. [Google Scholar] [CrossRef]
  15. Blum, M. Failing Company Discriminant Analysis. J. Account. Res. 1974, 12, 1–25. [Google Scholar] [CrossRef]
  16. Deakin, E.B. A Discriminant Analysis of Predictors of Business Failure. J. Account. Res. 1972, 10, 167–179. [Google Scholar] [CrossRef]
  17. Moyer, R.C. Forecasting Financial Failure: A Re-Examination. Financ. Manag. 1977, 6, 11–17. [Google Scholar] [CrossRef]
  18. Ohlson, J.A. Financial Ratios and the Probabilistic Prediction of Bankruptcy. J. Account. Res. 1980, 18, 109–131. [Google Scholar] [CrossRef] [Green Version]
  19. Zmijewski, M.E. Methodological Issues Related to the Estimation of Financial Distress Prediction Models. J. Account. Res. 1984, 22, 59–82. [Google Scholar] [CrossRef]
  20. Jakubík, P.; Teplý, P. The JT Index as an Indicator of Financial Stability of Corporate Sector. Prague Econ. Pap. 2011, 20, 157–176. [Google Scholar] [CrossRef]
  21. Valecký, J.; Slivková, E. Microeconomic scoring model of Czech firms’ bankruptcy. Ekon. Rev. Cent. Eur. Rev. Econ. Issues 2012, 15, 15–26. [Google Scholar] [CrossRef] [Green Version]
  22. Karas, M.; Režňáková, M. A Parametric or Nonparametric Approach for Creating a New Bankruptcy Prediction Model: The Evidence from the Czech Republic. Int. J. Math. Models Methods Appl. Sci. 2014, 8, 214–223. [Google Scholar]
  23. Vochozka, M.; Straková, J.; Váchal, J. Model to Predict Survival of Transportation and Shipping Companies. Naše More 2015, 62, 109–113. [Google Scholar] [CrossRef]
  24. Hajdu, O.; Virág, M. A Hungarian Model for Predicting Financial Bankruptcy. Soc. Econ. Cent. East. Eur. 2001, 23, 28–46. [Google Scholar]
  25. Chrastinová, Z. Methods of Assessing Economic Creditworthiness and Predicting the Financial Situation of Agricultural Enterprises [Metódy Hodnotenia Ekonomickej Bonity a Predikcie Finančnej Situácie Poľnohospodárskych Podnikov]; VUEPP: Bratislava, Slovakia, 1998; ISBN 978-80-8058-022-3. [Google Scholar]
  26. Gurčík, Ľ. G-index—The financial situation prognosis method of agricultural enterprises. Agric. Econ. (Zemědělská Ekon.) 2012, 48, 373–378. [Google Scholar] [CrossRef] [Green Version]
  27. Hurtošová, J. Construction of a Rating Model, a Tool for Assessing the Creditworthiness of a Company [Konštrukcia Ratingového Modelu, Nástroja Hodnotenia Úverovej Spôsobilosti Podniku]. Bachelor’s Thesis, Economic University in Bratislava, Bratislava, Slovakia, 2009. [Google Scholar]
  28. Delina, R.; Packová, M. Validation of Predictive Bankruptcy Models in the Conditions of the Slovak Republic [Validácia Predikčných Bankrotových Modelov v Podmienkach SR]. Ekon. A Manag. 2013, 16, 101–112. [Google Scholar]
  29. Harumova, A.; Janisova, M. Rating Slovak Enterprises by Scoring Functions [Hodnotenie slovenských podnikov pomocou skóringovej funkcie]. Ekon. Časopis (J. Econ.) 2014, 62, 522–539. [Google Scholar]
  30. Gulka, M. Bankruptcy prediction model of commercial companies operating in the conditions of the Slovak Republic [Model predikcie úpadku obchodných spoločností podnikajúcich v podmienkach SR]. Forum Stat. Slovacum 2016, 12, 16–22. [Google Scholar]
  31. Jenčová, S.; Štefko, R.; Vašaničová, P. Scoring Model of the Financial Health of the Electrical Engineering Industry’s Non-Financial Corporations. Energies 2020, 13, 4364. [Google Scholar] [CrossRef]
  32. Svabova, L.; Michalkova, L.; Durica, M.; Nica, E. Business Failure Prediction for Slovak Small and Medium-Sized Companies. Sustainability 2020, 12, 4572. [Google Scholar] [CrossRef]
  33. Valaskova, K.; Durana, P.; Adamko, P.; Jaros, J. Financial Compass for Slovak Enterprises: Modeling Economic Stability of Agricultural Entities. J. Risk Financ. Manag. 2020, 13, 92. [Google Scholar] [CrossRef]
  34. Pisula, T. The Usage of Scoring Models to Evaluate the Risk of Bankruptcy on the Example of Companies from the Transport Sector. Sci. J. Rzesz. Univ. Technol. Ser. Manag. Mark. 2012, 19, 133–151. [Google Scholar] [CrossRef] [Green Version]
  35. Balina, R.; Juszczyk, S. Forecasting Bankruptcy Risk of International Commercial Road Transport Companies. Int. J. Manag. Enterp. Dev. 2014, 13, 1–20. [Google Scholar] [CrossRef]
  36. Pisula, T.; Mentel, G.; Brożyna, J. Non-Statistical Methods of Analysing of Bankruptcy Risk. Folia Oeconomica Stetin. 2015, 15, 7–21. [Google Scholar] [CrossRef] [Green Version]
  37. Brozyna, J.; Mentel, G.; Pisula, T. Statistical Methods of the Banrkuptcy Prediction in the Logistic Sector in Poland and Slovakia. Transform. Bus. Econ. 2016, 15, 93–114. [Google Scholar]
  38. Noga, T.; Adamowicz, K. Forecasting Bankruptcy in the Wood Industry. Eur. J. Wood Wood Prod. 2021, 79, 735–743. [Google Scholar] [CrossRef]
  39. Prusak, B. Review of Research into Enterprise Bankruptcy Prediction in Selected Central and Eastern European Countries. Int. J. Financ. Stud. 2018, 6, 60. [Google Scholar] [CrossRef] [Green Version]
  40. Durica, M.; Frnda, J.; Svabova, L. Decision Tree Based Model of Business Failure Prediction for Polish Companies. Oeconomia Copernicana 2019, 10, 453–469. [Google Scholar] [CrossRef]
  41. Mihalovič, M. Performance Comparison of Multiple Discriminant Analysis and Logit Models in Bankruptcy Prediction. Econ. Sociol. 2016, 9, 101–118. [Google Scholar] [CrossRef]
  42. Kovacova, M.; Kliestik, T. Logit and Probit Application for the Prediction of Bankruptcy in Slovak Companies. Equilibrium. Q. J. Econ. Econ. Policy 2017, 12, 775–791. [Google Scholar] [CrossRef]
  43. Virág, M.; Kristóf, T. Neural Networks in Bankruptcy Prediction—A Comparative Study on the Basis of the First Hungarian Bankruptcy Model. Acta Oeconomica 2005, 55, 403–426. [Google Scholar] [CrossRef] [Green Version]
  44. Nyitrai, T.; Virag, M. The Effects of Handling Outliers on the Performance of Bankruptcy Prediction Models. Socio-Econ. Plan. Sci. 2019, 67, 34–42. [Google Scholar] [CrossRef]
  45. Štefko, R.; Horváthová, J.; Mokrišová, M. Bankruptcy Prediction with the Use of Data Envelopment Analysis: An Empirical Study of Slovak Businesses. J. Risk Financ. Manag. 2020, 13, 212. [Google Scholar] [CrossRef]
  46. Musa, H. Default Prediction Modelling for Small Enterprises: Case Slovakia. In Proceedings of the 34th International-Business-Information-Management-Association (IBIMA) Conference, Madrid, Spain, 13 November 2019; pp. 6342–6355. [Google Scholar]
  47. Tumpach, M.; Surovicova, A.; Juhaszova, Z.; Marci, A.; Kubascikova, Z. Prediction of the Bankruptcy of Slovak Companies Using Neural Networks with SMOTE. Ekon. Časopis (J. Econ.) 2020, 68, 1021–1039. [Google Scholar] [CrossRef]
  48. Neumaier, I.; Neumaierová, I. Try to calculate your index IN95. Terno 1995, 5, 7–10. [Google Scholar]
  49. Kalouda, F.; Vaníček, T. Alternative Bankruptcy Models—First Results. In European Financial Systems 2013: Proceedings of the 10th International Scientific Conference, Telč, Czech Republic, 10–11 June 2013; Masaryk University: Brno, Czech Republic, 2013; pp. 164–168. [Google Scholar]
  50. Karas, M.; Reznakova, M. Predicting the Bankruptcy of Construction Companies: A CART-Based Model. Eng. Econ. 2017, 28, 145–154. [Google Scholar] [CrossRef] [Green Version]
  51. Kubickova, D.; Skrivackova, E.; Hoffreiterova, K. Comparison of Prediction Ability of Bankruptcy Models in Conditions of the Czech Republic. In Double-Blind Peer-Reviewed, Proceedings of the International Scientific Conference Hradec Economic Days 2016; Hradec Králové, Czech Republic, 2-3 February 2016; Jedlicka, P., Ed.; University of Hradec Králové: Hradec Králové, Czech Republic, 2016; Volume 6, pp. 464–474. [Google Scholar]
  52. Hołda, A. Prognozowanie Bankructwa Jednostki w Warunkach Gospodarki Polskiej z Wykorzystaniem Funkcji Dyskryminacyjnej ZH. Rachunkowość 2001, 5, 306–310. [Google Scholar]
  53. Kutyłowska, M. Application of Regression Tress for Prediction of Water Conduits Failure Rate. E3S Web Conf. 2017, 22, 00097. [Google Scholar] [CrossRef] [Green Version]
  54. Pawełek, B. Prediction of Company Bankruptcy in the Context of Changes. In Proceedings of the 11th Professor Aleksander Zelias International Conference on Modelling and Forecasting of Socio-Economic Phenomena: Conference Proceedings, Zakopane, Poland, 9–12 May 2017; pp. 290–299. [Google Scholar]
  55. Vrbka, J. Altman Model for Prediction of Financial Health within Polish Enterprises. In Proceedings of the Abstracts & Proceedings of INTCESS 2020—7th International Conference on Education and Social Sciences, Dubai, UAE, 20–22 January 2020; pp. 1198–1205. [Google Scholar]
  56. Pociecha, J.; Pawełek, B.; Baryła, M.; Augustyn, S. Classification Models as Tools of Bankruptcy Prediction—Polish Experience. In Classification, (Big) Data Analysis and Statistical Learning; Mola, F., Conversano, C., Vichi, M., Eds.; Springer International Publishing: Cham, Switzerland, 2018; pp. 163–172. [Google Scholar]
  57. Herman, S. Industry Specifics of Joint-Stock Companies in Poland and Their Bankruptcy Prediction. In Proceedings of the 11th Professor Aleksander Zelias International Conference on Modelling and Forecasting of Socio-Economic Phenomena: Conference Proceedings, Zakopane, Poland, 9–12 May 2017; pp. 93–102. [Google Scholar]
  58. Jabeur, S.B.; Gharib, C.; Mefteh-Wali, S.; Arfi, W.B. CatBoost Model and Artificial Intelligence Techniques for Corporate Failure Prediction. Technol. Forecast. Soc. Chang. 2021, 166, 120658. [Google Scholar] [CrossRef]
  59. Wang, L.; Wu, C. Business Failure Prediction Based on Two-Stage Selective Ensemble with Manifold Learning Algorithm and Kernel-Based Fuzzy Self-Organizing Map. Knowl. Based Syst. 2017, 121, 99–110. [Google Scholar] [CrossRef]
  60. Alfaro Cortés, E.; Gámez Martínez, M.; García Rubio, N. Multiclass Corporate Failure Prediction by Adaboost.M1. Int. Adv. Econ. Res. 2007, 13, 301–312. [Google Scholar] [CrossRef]
  61. Ravi, V.; Kurniawan, H.; Thai, P.N.K.; Kumar, P.R. Soft Computing System for Bank Performance Prediction. Appl. Soft Comput. 2008, 8, 305–315. [Google Scholar] [CrossRef]
  62. Geng, R.; Bose, I.; Chen, X. Prediction of Financial Distress: An Empirical Study of Listed Chinese Companies Using Data Mining. Eur. J. Oper. Res. 2015, 241, 236–247. [Google Scholar] [CrossRef]
  63. Chandra, D.K.; Ravi, V.; Bose, I. Failure Prediction of Dotcom Companies Using Hybrid Intelligent Techniques. Expert Syst. Appl. 2009, 36, 4830–4837. [Google Scholar] [CrossRef]
  64. Huang, C.; Yang, Q.; Du, M.; Yang, D. Financial Distress Prediction Using SVM Ensemble Based on Earnings Manipulation and Fuzzy Integral. Intell. Data Anal. 2017, 21, 617–636. [Google Scholar] [CrossRef]
  65. Xu, W.; Fu, H.; Pan, Y. A Novel Soft Ensemble Model for Financial Distress Prediction with Different Sample Sizes. Math. Probl. Eng. 2019, 2019, e3085247. [Google Scholar] [CrossRef] [Green Version]
  66. Liang, D.; Tsai, C.-F.; Lu, H.-Y. (Richard); Chang, L.-S. Combining Corporate Governance Indicators with Stacking Ensembles for Financial Distress Prediction. J. Bus. Res. 2020, 120, 137–146. [Google Scholar] [CrossRef]
  67. Bureau van Dijk/Moody’s Analytics Amadeus Database. Available online: https://amadeus.bvdinfo.com/version-2021517/home.serv?product=AmadeusNeo (accessed on 14 June 2021).
  68. Adamko, P.; Klieštik, T.; Kováčová, M. An GLM Model for Prediction of Crisis in Slovak Companies. In Proceedings of the Conference Proceedings of the 2nd International Scientific Conference—EMAN 2018—Economics and Management: How to Cope with Disrupted Times, Ljubljana, Slovenia, 22 March 2018; pp. 223–228. [Google Scholar]
  69. Kliestik, T.; Vrbka, J.; Rowland, Z. Bankruptcy Prediction in Visegrad Group Countries Using Multiple Discriminant Analysis. Equilibrium. Q. J. Econ. Econ. Policy 2018, 13, 569–593. [Google Scholar] [CrossRef]
  70. Du, X.; Li, W.; Ruan, S.; Li, L. CUS-Heterogeneous Ensemble-Based Financial Distress Prediction for Imbalanced Dataset with Ensemble Feature Selection. Appl. Soft Comput. 2020, 97, 106758. [Google Scholar] [CrossRef]
  71. Adamko, P.; Kliestik, T. Proposal for a Bankruptcy Prediction Model with Modified Definition of Bankruptcy for Slovak Companies. In Proceedings of the 2nd Multidisciplinary Conference: Conference Book, Madrid, Spain, 2–4 November 2016; Yargı Yayınevi, Ankara, Turkey: Madrid, Spain, 2016; p. 7. [Google Scholar]
  72. Bradley, A.P. The Use of the Area under the ROC Curve in the Evaluation of Machine Learning Algorithms. Pattern Recognit. 1997, 30, 1145–1159. [Google Scholar] [CrossRef] [Green Version]
  73. Chicco, D.; Jurman, G. The Advantages of the Matthews Correlation Coefficient (MCC) over F1 Score and Accuracy in Binary Classification Evaluation. BMC Genom. 2020, 21, 6. [Google Scholar] [CrossRef] [Green Version]
  74. Kotsiantis, S.B.; Pintelas, P.E. Combining Bagging and Boosting. World Acad. Sci. Eng. Technol. Int. J. Math. Comput. Sci. 2007, 1, 372–381. [Google Scholar]
  75. Lahmiri, S.; Bekiros, S.; Giakoumelou, A.; Bezzina, F. Performance Assessment of Ensemble Learning Systems in Financial Data Classification. Intell. Syst. Account. Financ. Manag. 2020, 27, 3–9. [Google Scholar] [CrossRef]
  76. Dietterich, T.G. An Experimental Comparison of Three Methods for Constructing Ensembles of Decision Trees: Bagging, Boosting, and Randomization. Mach. Learn. 2000, 40, 139–157. [Google Scholar] [CrossRef]
  77. Leong, L. Analyzing Big Data with Decision Trees. Available online: https://scholarworks.sjsu.edu/etd_projects/366/ (accessed on 23 May 2021).
  78. Freund, Y. A More Robust Boosting Algorithm. arXiv 2009, arXiv:0905.2138. [Google Scholar]
  79. Long, P.M.; Servedio, R.A. Random Classification Noise Defeats All Convex Potential Boosters. Mach. Learn. 2010, 78, 287–304. [Google Scholar] [CrossRef] [Green Version]
  80. Freund, Y. Boosting a Weak Learning Algorithm by Majority. Inf. Comput. 1995, 121, 256–285. [Google Scholar] [CrossRef]
  81. Klieštik, T.; Klieštiková, J.; Kováčová, M.; Švábová, L.; Valášková, K.; Vochozka, M.; Oláh, J. Prediction of Financial Health of Business Entities in Transition Economies; Addleton Academic Publishers: New York, NY, USA, 2018; ISBN 978-1-942585-39-8. [Google Scholar]
  82. Sivasankar, E.; Selvi, C.; Mahalakshmi, S. Rough Set-Based Feature Selection for Credit Risk Prediction Using Weight-Adjusted Boosting Ensemble Method. Soft Comput. 2020, 24, 3975–3988. [Google Scholar] [CrossRef]
  83. Adamko, P.; Siekelova, A. An Ensemble Model for Prediction of Crisis in Slovak Companies. In Proceedings of the 17th International Scientific Conference Globalization and Its Socio-Economic Consequences: Proceedings, Rajecke Teplice, Slovakia, 4–5 October 2017; pp. 1–7. [Google Scholar]
  84. Pisula, T. An Ensemble Classifier-Based Scoring Model for Predicting Bankruptcy of Polish Companies in the Podkarpackie Voivodeship. J. Risk Financ. Manag. 2020, 13, 37. [Google Scholar] [CrossRef] [Green Version]
  85. Chow, J.C.K. Analysis of Financial Credit Risk Using Machine. Learning. Dissertation, Thesis, Aston University, Birmingham, UK, 2017. [Google Scholar]
  86. Hinton, G.E.; Salakhutdinov, R.R. Reducing the Dimensionality of Data with Neural Networks. Science 2006, 313, 504–507. [Google Scholar] [CrossRef] [Green Version]
  87. Kovacova, M.; Kliestik, T.; Valaskova, K.; Durana, P.; Juhaszova, Z. Systematic Review of Variables Applied in Bankruptcy Prediction Models of Visegrad Group Countries. Oeconomia Copernic. 2019, 10, 743–772. [Google Scholar] [CrossRef] [Green Version]
Figure 1. Summary of iteration of the Robust Error Goal parameter versus the performance metrics and classification loss in the RobustBoost element.
Mathematics 09 01886 g001aMathematics 09 01886 g001b
Figure 2. Summary of iteration of the number of weak learners’ parameter versus the performance metrics and classification losses in the RobustBoost element.
Mathematics 09 01886 g002aMathematics 09 01886 g002b
Figure 3. Summary of iteration of the maximal number of decision splits versus the classification losses in the CART element.
Mathematics 09 01886 g003
Figure 4. Summary of iteration of the number of neighbours versus the classification losses in the CART element.
Mathematics 09 01886 g004
Figure 5. Summary of iteration of the element weights components versus a five-fold average of selected performance metrics.
Mathematics 09 01886 g005
Figure 6. Confusion chart of the Visegrad group.
Mathematics 09 01886 g006
Figure 7. The ROC curve of prediction models in the Visegrad group.
Mathematics 09 01886 g007
Figure 8. The ROC curve of the final model in the Visegrad group.
Mathematics 09 01886 g008
Figure 9. The comparison of ROC curves of the final model and other models.
Mathematics 09 01886 g009
Table 1. Review of prediction models in the Visegrad group.
ModelDate of PublishingDataV4 CountrySectorNon-Failed CompaniesFailed CompaniesSampleMethodAUC (%)
Jakubik and Teply [20]20111993–2005CRnon-financial 606151757LRn/a
Valecky and Slivkova [21]20122008CRall200200400LR86.25
Karas and Reznakova [22]20142010–2013CRmanufacturing2.3466102.956DA93.91
Vochodzka, Strakova and Vachal [23]20152003–2012CRtransportn/an/a12.930LR91.75
Hajdu and Virag [24]20011991HUall7777154NN, LR, DAn/a
Chrastinova [25]1998n/aSKagriculturaln/an/a1.123MDAn/a
Gurcik [26]2002n/aSKagriculturaln/an/a60MDAn/a
Hurtosova [27]20092004–2006SKall33394427LRn/a
Delina and Packova [28]20131993–2007SKall1.4571031.560LRn/a
Harumova and Janisova [29]20142008–2011SKalln/an/a11.253LRn/a
Gulka [30]20162012–2014SKall120.252602120.854LR80.81
Jencova, Stefko and Vasanicova [31]20202017SKelectrical engineeringn/an/a1.000LR95.35
Svabova, Michalkova, Durica and Nica [32]20202016–2018SKall66.1559.49775.652DA, LR93.40
Valaskova, Durana, Adamko and Jaros [33]20202016–2018SKagriculturaln/an/a3.329MDA86.30
Pisula [34]20122004–2012PLtransport15055205LR94.80
Balina and Juszczyk [35]20142007–2010PLtransport402060DA, LR, NNn/a
Pisula, Mentel and Brozyna [36]2015n/aPLtransport242347MLP, SVM94.70
Brozyna, Mentel and Pisula [37]20161997–2003Pl
SK
transport232447CART, LR, MLP, k-NN95.00
Noga and Adamowicz [38]2021n/aPLwood363672DA89.00
Note: Classification and regression analysis (CART), discriminant analysis (DA), logistic regression (LR), k-NN (k-nearest neighbours), MLP (multilayer perceptron), neural network (NN), support vector machine (SVM), Slovak Republic (SK), Czech Republic (CZ), Poland (PL), Hungary (HU). Finally, AUC (%) shows the results of the best model.
Table 2. Total sample.
CountryThe Year 2017The Year 2018
Number%Number%
Non-FailedFailedNon-FailedFailedNon-FailedFailedNon-FailedFailed
SK 122,94632,17879.2620.74122,84632,27879.1920.81
CZ 76,63420,84578.6221.3876,63320,84678.6121.39
PL 59,7808,48787.5712.4359,5798,68887.2712.73
HU 298,71347,99986.1613.84299,18947,52386.2913.71
Total 558,073109,50983.6016.40558,247109,33583.6216.38%
Note: Slovak Republic (SK), Czech Republic (CZ), Poland (PL), Hungary (HU).
Table 3. The most often used financial variables in research.
Financial VariablesNumber
current assets/current liabilities11
current liabilities/total assets (or total liabilities)10
working capital/total assets, cash/total assets, total debt/total assets9
current assets/total assets8
current assets/total sales7
cash/current liabilities, sales/total assets, value added/total sales5
accounts payable/total sales, current liabilities/total sales, EBITDA/total assets, inventory/total sales, EBIT/shareholder funds, quick assets/current liabilities, retained earnings/total assets, shareholder funds/total assets4
cash flow/shareholder funds, cash/current assets, EBIT/total assets, EBIT/value added, EBITDA/permanent equity, EBITDA/total sales, financial expenses/EBITDA, financial expenses/net income, financial expenses/total assets, financial expenses/value added, fixed assets/total assets, EBT/total assets, long-term debt/total assets, net cash flows from financing activities per share, net income/shareholder funds, net income/total sales, net profit/average fixed assets, cash/current liabilities, receivables/total sales, EAT/total assets, shareholder funds/permanent equity, total debt/equity3
Note: earnings after tax (EAT), earnings before tax (EBT), earnings before interest and tax (EBIT), earnings before interest, depreciation, and amortisation (EBITDA).
Table 4. Financial variables.
IDTypeFinancial VariableFormula
1X01Activityasset turnover ratiosales/total assets
2X16Activitycurrent assets to sales ratiocurrent assets/sales
3X18Activityinventory to sales ratioinventories/sales
4X32Activitynet assets turnover rationet sales/total assets
5X38Activitytotal liabilities to sales ratiototal liabilities/sales
6X06Leveragedebt to EBITDA ratiototal liabilities/EBITDA
7X10Leveragedebt ratiototal liabilities/total assets
8X11Leveragecurrent assets to total assets ratiocurrent assets/total assets
9X14Leveragesolvency ratiocash flow/total liabilities
10X15Leverageshort-term debt ratio current liabilities/total assets
11X21Leveragelong-term debt ratio non-current liabilities/total assets
12X02Liquiditycurrent ratiocurrent assets/current liabilities
13X12Liquiditycash to total assets ratiocash and cash equivalents/total assets
14X22Liquiditycash ratiocash and cash equivalents/current liabilities
15X23Liquidityoperating cash flow ratiocash flow/current liabilities
16X26Liquidityquick ratio(current assets—stock)/current liabilities
17X36Liquiditynet working capitalcurrent assets—current liabilities
18X04profitabilityROE (of EAT)net income/shareholder’s equity
19X05profitabilityEBITDA marginEBITDA/sales
20X07profitabilityROA (of EAT)net income/total assets
21X09profitabilityROA (of EBIT)EBIT/total assets
22X13profitabilityROA (of cash-flow)cash flow/total assets
23X19profitabilityfree cash flow to sales ratiocash flow/sales
24X20profitabilitynet profit marginnet income/sales
25X28profitabilityROE (of EBIT)EBIT/shareholder’s equity
26X31profitabilitycash flow to operating revenue ratiocash flow/EBIT
27X35profitabilityEBIT marginEBIT/sales
Note: return on equity (ROE), return on assets (ROA), earnings after taxes (EAT), earnings before interest and taxes (EBIT), earnings before interest, taxes, depreciation, and amortisation (EBITDA).
Table 5. Element’s settings.
ElementParameterInitial SettingNotesExamined
Global
(all elements)
prior probabilitiesUniformTo set equal class probabilities.No
RobustBoostrobust error goal0.05The main difference in comparison with other boosting algorithms.Yes
number of weak learners100Default settings.Yes
score’s transformationlogit functionOriginal scores oscillate around zero, which is the default threshold.No
CARTsplit criteriondevianceAlso known as cross-entropy.No
surrogateOnDatasets with missing data.No
prune criterionimpurityIt is calculated via a setting in the split criterion, in this case, deviance.No
maximum number of splits20A smaller number could eliminate some of the weaker predictors.Yes
k-NNsearch methodkd-treeThe number of dimensions is relatively small, and the number of entities is relevantly high.No
number of neighbours30The low number can decrease the bias at the cost of variance, and many numbers can reduce a random noise effect at the cost of a less distinct boundary.Yes
distanceCityblockManhattan distance was also used by Brozyna et al. [37].Yes
Table 6. The results based on elimination and growth procedure.
ProcedureVariablesAccuracySensitivitySpecificityF1ScoreMCCAUC
EliminationX02, X07, X10, X3692.5385.3293.9478.9274.720.9543
GrowthX02, X04, X07, X10, X20, X3692.4285.6993.7478.7674.540.9552
Table 7. Impact of curse of dimensionality on k-NN element.
ProcedureVariables of k-NN ElementAccuracySensitivitySpecificityF1ScoreMCCAUC
EliminationX02, X07, X10, X3687.2480.3988.5967.4060.950.9260
GrowthX02, X04, X07, X10, X20, X3686.1760.1491.2858.8050.520.9257
The best variantX07, X1089.9085.6490.7373.5568.500.9420
Table 8. The results-based second elimination and growth procedure.
ProcessFinancial VariablesAccuracySensitivitySpecificityF1ScoreMCCAUC
EliminationX02, X07, X10, X3692.4485.6493.7878.8274.610.9555
GrowthX02, X04, X07, X10, X3692.3886.0293.5978.7074.480.9560
Table 9. The performance results of the individual models.
ModelAccuracySensitivitySpecificityF1ScoreMCCAUC
Simple Voting92.6988.0793.5979.7875.86-
Average Model92.8087.9193.7680.0176.120.9632
Final Model94.2581.2596.8082.2478.820.9640
Table 10. The performance metrics of models.
ModelAccuracySensitivitySpecificityF1ScoreMCCAUC
RobustBoost94.2578.6697.3181.7678.440.9634
CART92.1189.0592.7078.7074.690.9598
k-NN91.6586.3492.6977.2172.780.9588
Simple Voting92.6988.0793.5979.7875.86-
Average Model92.8087.9193.7680.0176.120.9632
Final Model94.2581.2596.8082.2478.820.9640
Table 11. The performance metrics of models for each Visegrad member country.
CountryAccuracySensitivitySpecificityF1ScoreMCCAUC
Slovakia92.2779.5795.6081.0776.240.9562
Czechia93.9984.8196.4985.7982.000.9682
Poland95.0078.8997.3580.0677.210.9626
Hungary95.0481.7697.1581.8979.020.9650
Visegrad group94.2581.2596.8082.2478.820.9640
Table 12. Performance summary.
ModelAccuracySensitivitySpecificityF1ScoreMCCAUC
Zmijewski [19]84.5693.0982.8966.3861.620.9447
Kliestik, Vrbka, and Rowland [69]71.3492.7267.1551.4544.800.9022
Adamko, Kliestik, and Kovacova [68]86.5290.9485.6668.8563.940.9350
Durica, Frnda, and Svabova [40]91.9188.9192.5078.2674.180.9531
Final model94.2581.2596.8082.2478.820.9640
Table 13. The comparison of prediction models applied in V4 countries.
AuthorsYearCountryModelFormula/MethodologyVariables
Zmijewski [19]1984USAprobit Z m = 4.336 4.513 X 07 + 5.679 X 10 0.004 X 02 net income/total assets (X07), total liabilities/total assets (X10), current assets/current liabilities (X02)
Kliestik, Vrbka, and Rowland [69]2018CZ
HU
PL
SK
MDA y V 4 = 1.470 + 0.024 X 02 0.589 X 04 1.158 X 07 + 1.870 X 10 0.452 X 11 + 0.613 X 12 + 1.030 X 15 0.012 X 22 + 0.731 X 27 + 0.173 X 28 0.475 X 35 + 0.244 C Z + 0.522 S K current assets/current liabilities (X02), net income/shareholder’s equity (X04), net income/total assets (X07), total liabilities/total assets (X10), current assets/total assets (X11), cash and cash equivalents/total assets (X12), current liabilities/total assets (X15), cash and cash equivalents/current liabilities (X22), return on assets (X27), return on equity (X28), profit margin (X35), dummy variabs: Czech Republic (CZ), Slovak Republic (SK)
Adamko, Kliestik, and Kovacova * [68]2018SKlogit t = 1.1766 + 0.4838 ( X 11 X 15 ) 0.1828 X 09 + 1.4733 X 10 1.3745 X 14 current assets/total assets (X11), current liabilities/total assets (X15), EBIT/total assets (X09), total liabilities/total assets (X10), cash flow/total liabilities (X14)
Durica, Frnda, and Svabova [40]2019PLCARTImpurity function: Gini index
Stop criterion for splitting: (Maximal depth: 5, Pure node, Minimal parent size: 100, Minimal leaf size: 50, Minimal purity improvement: 0.0001)
total liabilities/total assets (X10), EBIT/shareholder’s equity (X28), cash flow/total liabilities (X14)
Final model2021CZ
HU
PL
SK
ensemble modelRatios of elements: RobustBoost-to-CART-to-k-NN is 65-to-20-to-15,
Threshold is 0.58
current assets/current liabilities (X02), net income/shareholder´s equity (X04), net income/total assets (X07), total liabilities/total assets (X10), current assets—current liabilities (X36).
* The first predictor in the formula of Adamko, Kliestik, and Kovacova model is working capital to total assets ratio, but this predictor was not present in our dataset, so it was calculated as subtraction of X11 (current assets/total assets) and X15 (current liabilities/total assets). Slovak Republic (SK), Czech Republic (CZ), Poland (PL), Hungary (HU).
Publisher’s Note: MDPI stays neutral with regard to jurisdictional claims in published maps and institutional affiliations.

