1. Introduction
As the number of organizations conducting their businesses electronically increases, so have information security incidents, particularly data breaches. These increases in the frequency of security breaches combined with the substantial damage in terms of cost have raised organizational concerns regarding information technology (IT) investments, particularly on how much security-related IT investment is necessary to secure organizational information systems (IS) from these incidents. Generally, this amount is inferred by the potential costs of information security incidents, for example spending
$10 million to avoid a breach that can cost an organization
$100 million is reasonable, however to spend
$10 million to avoid a breach that would cost
$5 million (if it ever happens) is not. Therefore, knowing how much a breach incident could potentially cost the firm is important in determining how much security spending is justified. However, although many studies have been conducted to quantify the cost of security breaches, objective estimation of true costs remains difficult. First, the cost structure involving security breaches is very complicated. Although some tangible short-term costs (e.g., costs of sales, material and labor, and insurance) are possible to estimate, it is difficult to quantify the long-term costs related to the loss of customer trust and the decline of organization’s reputation [
1]. Additionally, legal and regulatory liabilities are almost impossible to estimate ex ante [
2]. Secondly, estimation of financial losses due to security breaches still relies heavily on self-reported company data. However, these data are liable to biases as impacted companies tend not to report or to under-report the actual financial losses related to an information security breach incident.
To address this issue, this study employs one common simplifying tool of measuring the impact on firm’s market value as a proxy for the consequences of an intrusion event. Market value as a proxy for investors’ confidence on the firm has been used before as an alternative measure in security breaches impact research. For example, security research applied event study methodology in examining the stock market’s reaction to security breach announcements as an assessment of how the announcement affects stockholders’ valuation of the firm [
3,
4,
5]. Building on these research works, this study uses event study methodology to examine the impact of security intrusion on the stock prices of the affected firms as an assessment of how much information security breaches cost the firms. The focus is on one particular type of breach incidents: a data breach involving unauthorized access to private personal data.
This study addresses three distinct gaps in extant studies. First, this study examines the short-term effect of data breach on the affected firms using a larger and more recent data. Although several studies have been conducted to assess the short-term impact of public announcement of customer or employee data breaches on an affected firm’s stock market returns using event study methodology, their findings are mixed with small sample sizes and a relatively short time period [
6,
7,
8,
9]. Second, apart from anecdotal reference, studies on the long-term impact of breach incidents are scant [
10]. As far as we know, no other empirical study has examined the potential of enduring effects of data breaches incidents on affected firms’ market value, particularly three years following the news of the event. Lastly, this study also delves into the correlation between the scale of the incident and the reaction of the capital market. This issue is particularly important as data breaches have been increasing in frequency and size over the last couple of years [
11]. So far, few empirical studies have been conducted with a large enough sample to verify the relationship between data breach scale and market valuation of the affected firms, leading to inconclusive results [
10].
The remainder of this paper unfolds as follows. In the next section, we review the extant literature on the impact of data breaches incidents on the market values of breached firms. In the following section, we then elaborate hypotheses development for this study. The subsequent section describes the research design and the data analysis. The next section presents the results of the study. This paper ends with the conclusion of the study, contributions of the study to academics and practitioners, its limitations, and suggestions for future research.
3. Hypothesis Development
Data breaches subject an organization to additional labor costs for troubleshooting and repairing of the damaged data and systems. They may also lead to loss of productivity and loss of revenue due to the unanticipated downtime. Other additional costs include setting up hotlines for customers, offering credit monitoring for victims as well as litigation charges. These costs may have an interim impact on business operations or result in immediate charges to a company’s expected profitability. Thus, a firm suffering a data breach is expected to encounter a decrease in its net future cash flows. As a result, investors would revise their valuations of the firm. Since the breach is expected to have a negative impact on net cash flow, valuations are also expected to decrease. As such, we hypothesize:
Hypothesize 1 (H1). The announcement of a data breach has a negative effect on the short-term market value of the breached company.
In addition to transitory consequences on financial performance, the effects of data breaches are far-reaching and can be detrimental to companies of any size. The repercussions of breach incidents may continue for years to come. Aside from the upfront costs of notifying data subjects and investigating and controlling the breach, corporations also face potential litigation and fines, as well as other intangible costs associated with damage to corporate brand and reputation. This loss of reputation can mean lost customers as well as a decrease in new customers’ acquisition as the relationship between data security and market valuations of firm can be attributed to the trust of customer. Studies have shown that data security is essential for customer trust because of concerns associated with information privacy [
38,
39,
40]. Existing customers may be unwilling to do business with the breached company because of privacy concerns. Consequently, the breached company experiences loss of customer loyalty as well as a diminishing new customer acquisition rate. Furthermore, security breaches may also lead to higher future cost of doing business due to partners or suppliers’ reluctance to continue partnership with the breached firms. Thus, negatively impacting a company’s long term profitability. Furthermore, ensuing legal actions due to the breach would also inflict significant on-going financial liability, especially if the lawsuits are successful or continue to drag on. Thus, we hypothesize:
Hypothesize 2 (H2). The announcement of data breach has a negative effect on the long-term market value of the breached company.
The potential severity of the breach is likely to be correlated with the number of records exposed. Reference [
7] found a positive relationship between the number of credit cards exposed and the magnitude of negative abnormal returns in a very small sample of four instances. Findings from a survey conducted by [
41] also show that there is a positive correlation between numbers of records exposed and the cost of data breach. Therefore, we hypothesize:
Hypothesize 3.1 (H3.1). The size of the data breach is positively associated with a higher negative return on the short-term market value of the breached company.
When a data breach event occurs, we cannot immediately know the exact scale of the incident’s impact merely from the size of the leak. For example, in SONY’s data breach incident, after the first announcement of the data breach, the scale of breaches continued to expand over time even after the discovery, due to the evolution of the attacker’s type of intrusion and intruders’ opportunistic stealing behavior of hiding in programs or other parts of the organization’s information system. Therefore, only investigating the relationship between the size of the data breach suffered by a company and its short-term effects cannot be a complete measure of the impact of the incident. Moreover, larger data breaches will lead to more customers being lost and relatively heavier subsequent legal liability, and thus the impact of the incident will also be sustained in the long-term. So, not only can the scale of the incidents not be sufficiently measured in the short-term, the follow-up legal damages also cannot be sufficiently measured in the short term period following the incident. For example, in the 2013 Target data breach, in which 70 million pounds worth of data were stolen, an amount of
$39 million was paid in 2015 for collective litigation [
42]. As we saw here, though the breach incident happened in 2013, the amount of legal compensation was not decided until 2015. It took at least two years for the impact of the Target’s breach incident to fully materialize. Therefore, we hypothesize:
Hypothesize 3.2 (H3.2). The size of the data breach is positively associated with a higher negative return on the long-term market value of the breached company.
4. Research Design
We conduct an event study to test the hypotheses listed above. The aim of an event study is to investigate the effect of an event (in this study: a data breach) on the respective company’s market value. Event-based studies are preferred over accounting data-based studies when the reliability of accounting data are questionable due to the flexibility of the managers in choosing accounting procedures (McWilliams and Siegel 1997) or when accounting data are difficult to collect as in the case of assessing the cost of security breaches [
43]. Moreover, the data used in an event study are the daily stock prices of the sample firms. They are more accurate since stock prices are relatively free of insider manipulation and reflect all of the relevant information known about the firm under an efficient market hypothesis [
44]. As reviewed before, a stream of IS research has adopted this methodology to analyze the effect of information breaches on the market valuation of affected firms. This effect can be used as a substitute in estimation of the actual financial loss to the firms due to the breaches or level of security investment that a firm is willing to bear to prevent such breaches.
In this section, we first introduce criteria for sample selection, followed by outlining the event study methodology. Subsequent segments present the statistical method used in measuring short-term and long-term abnormal market return. The former employs the CARs (cumulative abnormal returns) model with an event window of [−1, 1], while in the latter the BHARs model is applied to reflect market reaction to the difference between the return on a buy-and-hold investment in a similar asset/portfolio.
4.1. Sample Selection
For the purpose of analyzing how announcements of security breaches affect capital markets, breach event is defined in this study as the first public disclosure to the media of a security breach to a firm. We collected data on security breach events using a search of all English news articles in the Lexis-Nexis database. Lexis-Nexis was chosen because the databases covers major U.S. newspapers. The search consisted of all public announcements of data breach events between 1 January 2003 and 31 December 2014. We used keywords such as “security attack”, “vulnerabilities”, “system intrusion”, “security incident”, “security breach”, “cyber events”, “hacker attack”, “cyber criminals”, “stolen”, “unauthorized intrusion”, “Confidential Information”, “social engineering”, “phishing”, “system availability”, “identity theft”, “system down”, and other terms related to information breach. To ensure the capture of the maximum available data, we selected January 2002 as our start date. In order to avoid the omission of important event, we also collect news articles on information breaches incidents through external websites such as Privacy Rights Clearinghouse (PRC), Silk, Information is beautiful, to cross-references with Lexis-Nexis database, and built on the information gained from Lexis-Nexis.
The initial list was refined and evaluated based on the following criteria:
The breach event is identified by the confidentiality, integrity, and availability (CIA) model: all events where confidentiality was destroyed were included while all breach event caused by the loss of equipment (such as discarded or stolen laptop, personal digital assistant (PDA), smartphone, portable memory device, CD, hard drive, data tape, etc.) were excluded.
Only announcements by publicly traded firms listed on either the New York Stock Exchange (NYSE) or the National Association of Securities Dealers Automated Quotations (NASDAQ) stock exchange were included.
The sample firms must have return records on the Center for Research on Stock Prices (CRSP) database, at least 10 days after the public announcement day for a short-term sample and one year for a long-term sample. The book value of the sample company must also be greater than zero.
When there were more than one announcements on a particular security breach incident, the earliest announcement was retained and those with uncertain event date were removed.
Consistent with past research [
45], an announcement that contained news about security breaches at multiple firms was counted as announcing multiple events with each one relating to each of the firms involved.
If the breach event happened on a subsidiary firm that was unlisted, we tracked the parent company. For example, Sony Online Entertainment leaked 24 million data elements on 2 May 2011. As Sony Online Entertainment was unlisted, we tracked the parent company: SONY company.
The remaining announcements were checked against confounding factors such as mergers and acquisitions, earning announcements, issues of new debt and equity, announcements of macroeconomic variables, IPOs, dividend announcements, etc. For example, we excluded companies that within 10 days before and after the occurrence of the data breach event suffered from dividends payouts or stock split, and companies with acquisitions or merger announcements within one, two and three years, or announcements of other significant events that might have affected their market value. We included both confounding factors that may be within the firm’s control such as announcement of a stock split as well as events that may be outside the firm’s control such as macroeconomic announcements that will affect the firm’s future operations in some way.
Because of the differences in exclusion criteria for short-term and long-term events, there may be dissimilarity between the events data for short-term and long-term market valuation. For example, in order to ensure the long-term sample size is statistically valid, screening of long-term events does not exclude events impacted by dividend payments, as they will be too frequent.
4.2. Statistical Methodology
In this section, we examine the statistical methods used to measure the impact of data breach events’ announcements on common stock prices. The event of interest in this study is the public announcement of data breach events by either the breached firm or some other media outlet. If an announced data breach event contains new information, it should compel the markets to revalue the firm. Our tests are conducted in two parts. In the following two sections, we present the methods employed to examine the short-term and long-term market impacts due to data breach. The CARs model is used to examine the short-term market value impact. Meanwhile, the BHARs model is used for the long-term impact.
4.2.1. Event Study
Reference [
44] introduced a methodology to detect the impact of a particular event on the rate of return of a firm’s bonds. Finance theory has long suggested that stock prices reflect all available information and expectations towards the future prospects of firms. Based on this basic premise, one can, therefore, examine the relevance of a particular event on the future prospects of a firm by scrutinizing its effects on the firm’s stock price. Event study analysis is the statistical method used for making such analysis. In theory, event study compares the differences between the returns that would have been expected if the analyzed event did not occur (normal returns) with the returns that in fact occurred due to the particular event (abnormal returns).
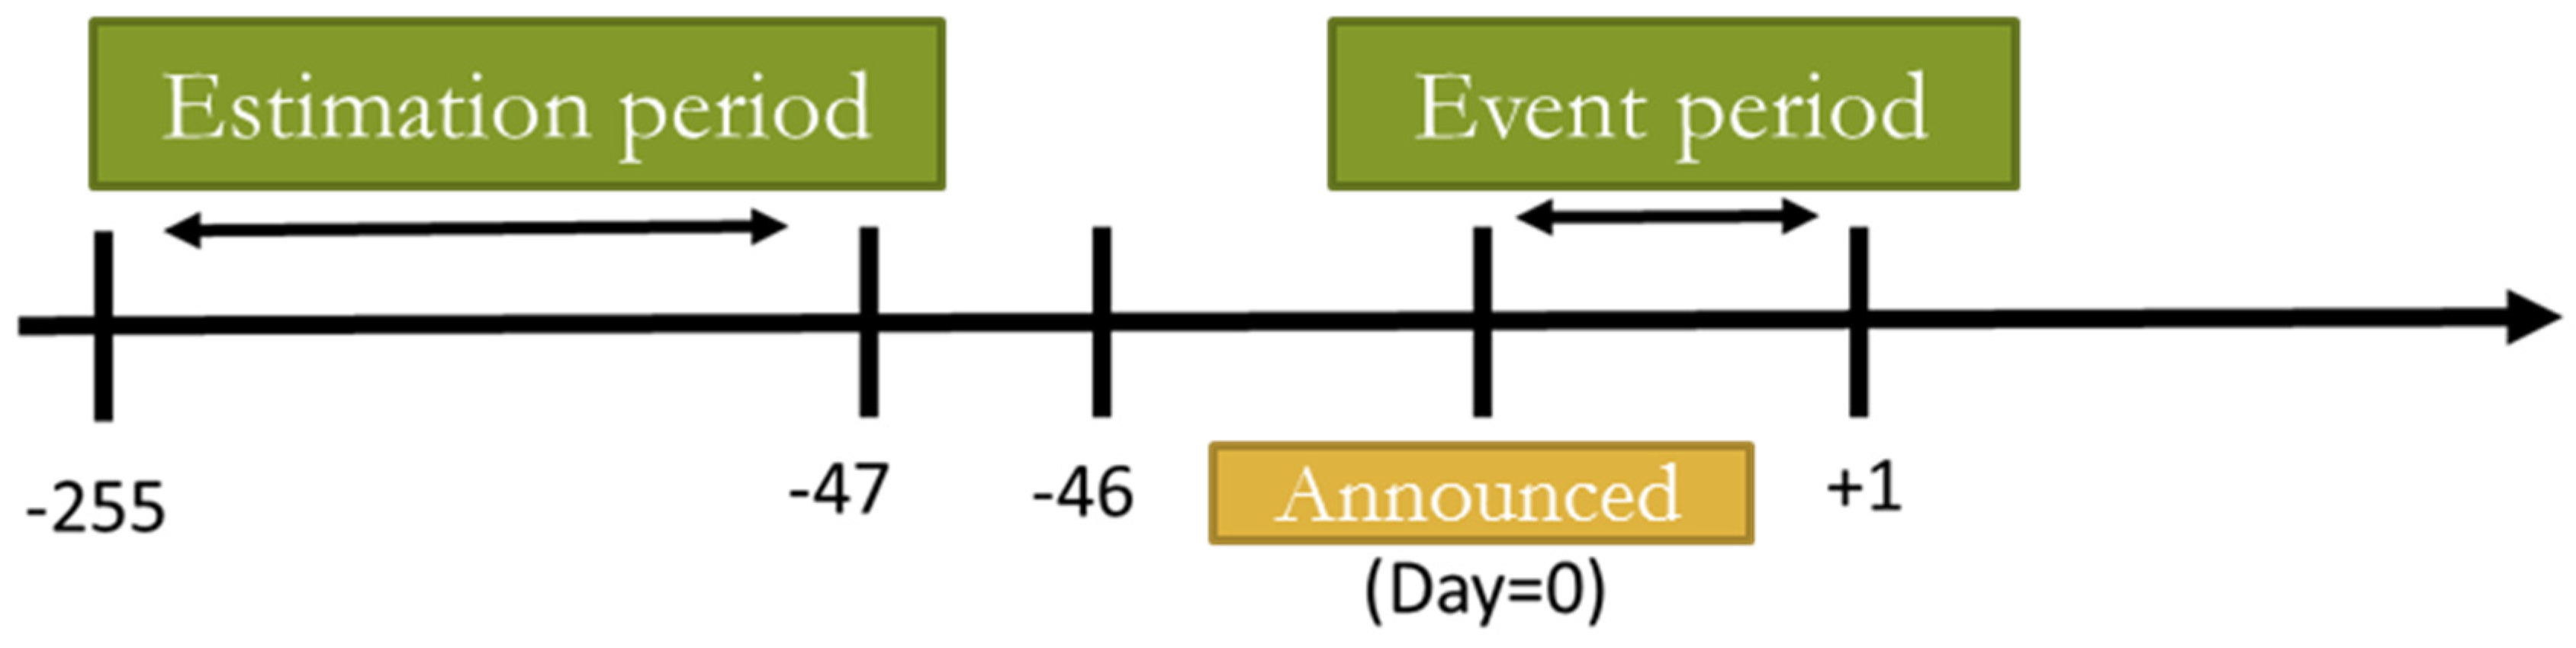
One of the most common models used to analyze the future prospects of a firm is market model. A market model is developed based on the actual returns of a reference market and the correlation of the firm’s stock with the reference market. It assumes a stable linear relation between the market return and a firm’s stock return. As a normal performance model needs to be developed, the estimation window needs to be clearly defined. The most common choice, whenever feasible, is to use the period prior to the event window for the estimation window. For example, if an event study uses daily data and a market model, the market model parameters could be estimated over N days prior to the event. Generally, the event period itself is not included in the estimation period to prevent the event from influencing the parameter estimates of the normal performance model. Using the parameter estimates for the normal performance model, the abnormal returns can then be calculated.
The date of the announcing article shall be the date of the first public disclosure of the data breach event (Day = 0). If the date is a holiday, it shall be postponed to the first trading day. When estimating the existence of short-term abnormal returns, the estimated period for the daily return data is: [−255, −47]; 210 days prior to the event date; and [0, 0], [0, +1]. The timeline is shown in
Figure 1.
4.2.2. Impact on Short-Term Market Value: Cumulative Abnormal Returns (CARs) Model
Reference [
46] develops a market model with the assumptions that returns of individual stock prices and market portfolio are linearly related to each other [
47]. The most commonly used tool to make the adjustment is through the market model in which the rates of return on a stock over a particular holding period (counted either daily or monthly) is estimated as follows:
where:
Rit = rate of return on firm
i, period
t;
Rmt = rate of return on market index, period
t;
αi,
βi = regression coefficients; and
εit = stochastic error term which meets the assumptions of the linear regression model. This model is assessed on a set of data observed relative to the event date with observations surrounding the event date deleted.
The abnormal return to security
i for period
t is:
where
and
are estimated market model coefficients.
For event period [
t1,
t2], the cumulative abnormal return computed over day
t1 and
t2, is computed as:
Thus, for a sample of
N firms, the estimated average of the event-window announcement effect is:
To test average cumulative abnormal returns, the [
48] test statistic is used. This test has been used extensively in event-based approach study. For (
), the test statistic Z is given by formula:
where
is cumulative abnormal returns estimated using formula:
and
SARi,t is standardized abnormal returns estimated with the formula:
4.2.3. Impact on Long-Term Market Value: Buy-And-Hold Abnormal Returns (BHARs) Model
Reference [
49], building on the work of Ritter (1991), found that BHARs can be used to address various issues concerning portfolio performance. A BHAR refers to the variance between the returns on a buy-and-hold investments of a similar asset or portfolio. It measures the cumulative abnormal returns by comparing companies’ strategic buy-in stocks over a period of time to the benchmark portfolio (market index) at the end of the holding period. Following the BHARs concept, to identify whether there is a significant impact on the long-term stock market performance of the event company after the announcement of the event, we observe the long-term investment performance of the company’s stock against the market index. Specifically, BHARs are calculated using the formula:
where
,
are calculated in a similar to the CARs model using Equations (1) and (3). The buy-and-hold abnormal returns periods are:
T = 12 months,
T = 24 months, and
T = 36 months, respectively. The average buy-and-hold abnormal returns are calculated by summing the abnormal returns of all event samples, divided by the number of event samples using the following equation:
4.2.4. Fama–French Three-Factor Model
In addition to using the BHARs model to estimate long-term abnormal returns, to improve the validity of the results, the Fama–French three-factor model is also used in this study to explain the long-term abnormal returns performance. Using the capital asset pricing model (CAPM), [
46] proposed that there are many factors influencing the return on stock price. The model argues that systematic risk (Beta) is the only factor affecting the return of risky assets. Hence, academia has often used it to measure the risk and reward. However as CAPM has still failed to deliver satisfactory explanations for many issues, for example using the CAPM to predict stock returns still often result on numerous anomalies, scholars have explored the inclusion of additional factors besides systematic risk (Beta) to more accurately explain abnormal stock returns. Reference [
50] proposed a three-factor model, arguing the addition of market factor (RM), scale risk factor (SMB) and the ratio of company’s book value to its market value risk factor (HML) to explain stock returns. They employed the inclusion of scale risk factor based on the discovery that the scale of stock returns is negatively related to stock compensation (i.e., small size portfolio returns are higher than the large portfolio returns). Meanwhile, the ratio of company’s book value to market value (B/M) has a positive relationship with stock reward (i.e., stocks with higher B/M ratios outperform those with lower B/M ratios). The three-factor model are depicted using the formula:
where
is the rate of return on firm
i, period
t;
is the rate of return on market index, period
t;
is the average return on small market-capitalization portfolios minus the average return on three large market-capitalization portfolios;
is the average return on two high book-to-market equity portfolios minus the average return on to low book-to-market equity portfolios; and
is error term.
First, we used the three-factor model to estimate the expected return using the estimated
,
parameters, market returns rate factor, the scale risk factor, and the ratio of book-to-market value factor, with the following formula:
Then, the expected return estimated by the three-factor model is applied to the BHARs model to calculate the long-term abnormal returns.
4.2.5. Test Statistic for BHARs Model
To test the null hypothesis that the mean cumulative of buy-and-hold abnormal returns are equal to zero for a sample of n firms, we employ
t-test (skewness-adjusted transformed normal test) [
51] statistics, and correct the cross-sectional
t-test for skewed abnormal return distribution. This test is relevant to the averaged abnormal return (AR), the cumulative averaged abnormal return (CAAR), and the averaged buy-and-hold abnormal return (BHAR). Furthermore, we are limited by the case of averaged buy-and-hold abnormal return (BHAR). Let us revisit the cross-sectional standard deviation (unbiased by sample size):
where
is the skewness to adjust, the skewness estimation (unbiased by sample size) is calculated using the formula:
and:
The formula for the test statistic
t is shown in the equation:
which is an asymptotically standard normal distribution. For a further discussion on skewness transformation we refer to [
51].
4.2.6. Multiple Regression Analysis
In order to test the Hypotheses 3, we construct a regression analysis model. The independent variable of the model is the event size, and the dependent variable is the abnormal return of the breached firm. The model includes several control variables such as company market value, number of employees, return on assets, market-to-book ratio, company lifespan, and the event year. The regression model is constructed as follows:
where the event size is defined as the number of data disclosed due to the breach incident occurring to the company. If there are multiple media reports on the incident and the number of breaches is different, we adopt maximum number of disclosures. Because some of the samples did not disclose the amount of data breach caused by the incident, we follow how previous literature dealt with it [
10]. For the market value of the company, the stock market value calculation on the day of the event are used as the natural logarithm to make the data variation narrow. This is done because there may be a relatively high volatility of returns on large firms due to the potential significance of the company’s market capitalization to abnormal stock returns [
52]. The number of employees is measured in units of thousands. Return on assets (ROA) refers to the net profit (loss) of the company in the previous year divided by the total assets. Market-to-book ratio (M/B) is calculated by dividing the market value with the book value. We use the M/B ratio to proxy the growth opportunities of firms, as when the company experiences high-growth rate, the investors are expected to receive higher return. It has been argued in the past that companies are more likely to suffer losses if their growth is high as a result of data breach [
10]. Company lifespan refers to the length of years the company has been created. It is controlled as there may be differences in impact of data breach between a long-established company and a newly founded one. Lastly, event year refers to the year in which the event occurred [
2].
We use the multiple regression model to test Hypotheses 3.1 and 3.2. For Hypotheses 3.1, the dependent variables are the short-term event window of [0, 0] (the day the event occurred) and [0, +1] (the next day following the event). Meanwhile, Hypothesis 3.2 takes the long-term event window of: 11 months after the event occurred (namely one year; follow-up abbreviation is [0, +11]); 23 months after the event occurred, (i.e., two years; the subsequent abbreviation is [0, +23]); and 35 months after the event occurred (i.e., three years; the subsequent abbreviation is [0, +35]), as dependent variables in the constructed models.
5. Results
This study focuses on the data breaches happening in North American companies listed on the stock market from 1 January 2003 to 31 December 2014. The main purpose of this study is to find out whether the market value of the breached company is affected by the occurrence of the event. The event study method is used as the main analysis tool, with the event window constructed on the day of the incident [0, 0] and the following day [0, +1] to examine cumulative abnormal returns of the firms.
In this study, 147 original samples were collected. These samples were then screened for short- and long-term impact valuation according to the selection criteria mentioned above. For the short-term, there were 20 samples whose data were leaked but were not available in the CRSP database. Second, we found that 25 of the remaining samples suffered from other confounding events such as dividend and earnings announcements within 10 days before and after the data breach event. Lastly, there were 3 companies in the sample that had book value of less than zero. As a total of 48 events were excluded from the sample, the final sample number was thus 99 (see
Table 2). For the top three attacked companies, Citigroup Inc. was attacked 6 times, the event days were 6 June 2005, 21 September 2007, 24 February 2010, 27 July 2010, 8 August 2011 and 17 July 2013. Apple Inc. was attacked 5 times, the event days were 9 June 2010, 4 September 2012, 22 July 2013, 25 February 2014 and 1 September 2014. American Express Company was attacked 4 times, the event day were 18 February 2003, 13 July 2012, 25 March 2014 and 1 April 2014. Automatic Data Processing Inc. was attacked 4 times, the event days were 16 June 2006, 7 July 2006, 15 June 2011 and 4 December 2013. Sony Corporation was attacked 4 times, the event day were 26 April 2011, 2 June 2011, 24 August 2014; and 24 November 2014. Twitter, Inc. was attacked 4 times, the event days were 13 December 2010, 1 February 2013, 4 December 2013 and 5 December 2014.
Meanwhile, for the long-term samples, 46 samples were found to suffer from other confounding events such as mergers and acquisitions, announcements of macroeconomic variables, etc. within 3 years before and after the data breach event. From the remaining samples, 31 samples had events occurring within a term of less than one year, thus making the calculation of their long-term return performance not feasible. Due to differences of some exclusion factors for short-term and long-term samples, the numbers of short-term and long-term samples were different. For example, in order to ensure size validity of long-term samples, in the screening of long-term samples, more frequent event announcements such as dividend payments were not used as criteria for exclusion. A total of 52 event samples were excluded from the long-term sample. The final number of long-term samples was 47, 33, and 26, for one year, two years, and three years respectively (see
Table 3).
Table 4 shows the statistical results. The mean (median) of the total sample assets was 302,165 million (41,488 million), the mean of book value was 37,318.9 million (9357.9 million), the mean of sales was 46,595 million (18,273.6 million), the mean of net income (loss) was 4035.9 million (1231 million), the mean of market value was 72,867.8 million (28,109.2 million), and the mean of market-to-book ratio was 5.7 (2.2).
Table 5 presents the results of our test of Hypothesis 1 using the event study methodology. The empirical results show that there are significant negative abnormal returns within the event window of [0, 0] and [0, 1]. When the event company declared that it suffered a confidential information breach, the event led to an average stock price fell of −0.23% (Z = −2.397,
p = 0.0083). The cumulative abnormal return for trading day after the event was −0.41% (Z = −2.73,
p = 0.0032). In other words, the company experienced short-term losses as a result of the incident, as investors re-evaluated the company’s market value through the stock market.
This result supports Hypothesis 1 that the announcement of a data breach has a significant negative effect on the short-term market value of the breached company. This result is consistent with [
9,
18,
19]. Reference [
18] used 11 event samples while [
9] used only 6 event samples, both studies reported that a data breach event led to a significant negative impact on the event firm’s market value. Meanwhile, [
5] collected 22 samples of confidential documents breach event from 1997 to 2003, with a [−1, +2] event window. His study reported non-significant findings, which is inconsistent with the findings of this study. However, compared to the past literature, the number of event samples used in this study was 99, which is obviously larger and more explanatory, indicating that a data breach will have a significant negative impact on company’s market value.
Table 6 shows the results of the BHARs model.
Table 7 shows the results of adding the three-factor model to the cumulative abnormal returns in the BHARs model. The purpose of adding the three-factor model is to increase the reliability of the results by testing whether the results are consistent. In
Table 6 and
Table 7, the number of samples for one, two and three years is 47, 33 and 26 respectively. In
Table 6, the average cumulative abnormal returns for the 12 months to buy-and-hold after event is −10.21% (
t = −2.097,
p = 0.018). Meanwhile, the BHAR is −32.68% (
t = −3.076,
p = 0.0011) and −34.36% (
t = −2.425,
p = 0.0077) for 24 months and 36 months after event, respectively. The results support Hypothesis 2 that the announcement of a data breach has a significant negative effect on the long-term market value of the breached company. If investors buy and hold the company’s stock after the incident: in a year they will suffered −10.21% loss; holding two years and three years will expand the loss to −32.68% and −34.36%, respectively.
The results of the three-factor model also show that the data breach events have significant negative abnormal returns on the company’s long-term market value. The average cumulative abnormal returns for the 12 months to buy-and-hold after an event is –8.88% (t = −1.694, p = 0.0451). Meanwhile, the BHAR is −32.69% (t = −2.767, p = 0.0028) and −32.16% (t = −1.734, p = 0.0415) for 24 months and 36 months after the event, respectively. Therefore, we can see from this result that information breach events have significant negative impact on the long-term market value of the event firm, thus supporting Hypothesis 2.
Table 8 reports the multiple regression model to analyze the relationship between the size of the breach event and the negative anomaly of the stock price. According to anecdotal evidence [
53], there is a positive correlation between the amount of information breached and the loss cost. The report stated that the average cost per data loss was
$188 in 2013,
$201 in 2014 and
$217 in 2015, indicating that the cost of a data breach was increasing over time.
Table 8 presents the abnormal return on event period [0, 0] in column (1), the cumulative abnormal returns on event period [0, +1] in column (2), and the buy-and-hold abnormal return 12 months after an event in column (3), 24 months after the event in column (4) and 36 months after the event in column (5).
Table 8 also shows the control variables in the model, covering: market value, number of employees, market-to-book ratio, return on assets, company lifespan, and year of the events. As shown in
Table 8, there is a significant negative relationship between the abnormal return performance and event size in [0, 0] and [0, +1], and the coefficients are −0.0021 (
t = −2.14,
p = 0.035) and −0.0044 (
t = −2.39,
p = 0.019). The explanatory power of the model on the short-term market value is more than 7%, which means that the greater the amount of information leakage caused by the event, the greater the negative impact on the stock market value of the event company. This result supports Hypothesis 3.1 that the size of the data breach is positively associated with a higher negative return on the short-term market value of the breached company. This result is consistent with the finding by [
7] that there is a positive correlation between the number of credit card information leaked and the magnitude of the negative abnormal returns.
Table 8 also shows that a significant negative relationship between the buy-and-hold abnormal return performance and event size in event period [0, +11] (
β = −0.072,
p = 0.039), event period [0, +23] (
β = −0.185,
p = 0.059) and event period [0, +35] (
β = −0.19,
p = 0.059) exist. The explanatory power of the model to the long-term market value is more than 17%. These results support Hypothesis 3.2 that the size of the data breach is positively associated with a higher negative return on the long-term market value of the breached company.
6. Conclusions
6.1. Academic Contribution
This study investigates whether the influence of data breaches on short-term share prices persist in contemporary financial markets. Previous studies generally collected data in a period of 1–6 years. This study uses a dataset that cover the year of 2003 through 2015. Using event study methodology, we found evidence that the stock market responds negatively to announcements of breaches of confidential data at publicly traded firms. On the day of the event’s announcement, the abnormal return to the event company was −0.23%, indicating that the company’s market value would lose 0.23%. Meanwhile, the accumulated abnormal return was −0.41% in the event window [0, +1]. This result supports Hypothesis 1 that the announcement of a data breach has a significant negative effect on the short-term market value of the breached company. This result is consistent with [
9,
18,
19] where they reported a significant negative market reaction to information security breaches.
In the field of information security, many studies have analyzed the impact of events on the company’s short-term market value, but few have explored the long-term effects of the events. As far as we know, this study is the first to empirically analyze the relationships between data breaches and long-term market value of the breached firm. In this study, we used the BHARs model to analyze the long-term impact of the incident on the company. The results of the BHARs model indicated that the average abnormal return of the company in the 12 months after the event is −10.21%, while in the event window of 24 months and 36 months after the event, there are significant abnormal returns of −32.68% and −34.36%, respectively. In order to make the long-term results more robust, this study uses the three-factor model to adjust the BHARs model test (
Table 7). The results also showed that the event company experienced significant negative abnormal returns, with BHARs of −8.88% (
t = −1.694,
p = 0.0451), −32.69% (
t = −2.767,
p = 0.0028) and −32.16% (
t = −1.734,
p = 0.0415) for 12 months, 24 months and 36 months after event, respectively. The result may indicate that the impact of the incident is not one-off but continuous. With the innovation of attack techniques, the breaches attack may remain and expand further. Event companies also face class action, investigation costs, repair and other expenses. All of these affect the company’s long-term market value. For example, in recent events such as Target’s data breach in 2013 have a record size of 70 million data exposed, with litigation settlement of around 39 million [
42]. Home Depot’s data breach event in 2014 has the event size of 56 million data elements breached, with a litigation settlement of up to 13 million [
54]. We can infer from these two large-scale data breaches that the impact lasted for at least two more years after the data breaches announcement before adjudication of the follow-up legal compensation. To our knowledge, this is the first study with such attempt on the long-term impact. We expect this result may help organizations to accurately assess the right level of investment in information security for safeguarding confidential data as well as their customers’ personal information.
Other contribution of this study is the consideration of event size effects in the impact of data breach incidents on firm’s market valuation through the use of multiple regression models to explore the relationship between the potential seriousness of a data breach and market valuation size. The results show that there is a significant negative correlation between abnormal performance and the event size under the event window of [0, 0] and [0, +1], with coefficients of −0.0021 (
p = 0.035) and −0.0044 (
p = 0.019). This indicates that the greater the amount of information leakage caused by the event, the greater the negative impact on the stock market value of the event company. This result is consistent with the finding of [
7] that there is a positive correlation between the number of credit card information leaked and the extent of negative abnormal returns. When the main variables are changed into long-term event windows of 12 months, 24 months and 36 months to identify the cumulative abnormal returns of the market value, the results show there is a positive correlation between the number of information leaks caused by the data breaches event and the (negative) abnormal return of the long-term market value of the event company. This result can be explained by the fact that the larger the scale of events, the greater the impact on company’s long-term market value. With the breaches affecting a broader customer base, the subsequent legal responsibility is relatively heavier, leading to sustained long-term impact of the event. The scale of the event can also grow over time. In conclusion, we cannot only examine the impact of the scale of events in the short term. The subsequent legal damages also cannot be measured only in the short term following the incident. Moreover, from the time the event occurs until the time the legal damages are concluded, the company must continue to pay human and material resources to investigate the extent of its consumers affected, and if the event size continues to expand, the investigation time and expenditure costs would also increase proportionately.
6.2. Practical Contribution
The empirical results show that the data breach event will significantly affect the company’s short-term and long-term market value and that significant positive correlation between the event size and negative abnormal returns of market performance exist. These results highlight the importance of information security and establish that it cannot be ignored. The incident did not happen accidentally and consumers do not easily forget data breach events over time. Furthermore, the public or media reporting reveals the existence of information security vulnerabilities in the corporation, making the firm more likely to be the target of other attacks.
According to the empirical results of this study, an announcement of a data breach event will lead to −0.23% abnormal returns on the day of the announcement. Take SONY as an example, this projects that SONY’s market value will decrease by about 6.6 million dollars on the day of the incident announcement, and expand to approximately 12 million market value loss on the next day. If we take the company’s actual data into the regression results for estimation, SONY company experienced −0.62% abnormal return in the event day (estimated market value loss of about 18 million), and −2.5% cumulative abnormal return in the next day (estimated market value loss of about 71 million). Meanwhile, long-term market valuation using the BHARs model estimates that the abnormal returns of the breached company for one year after the event is −10.21%. The accumulated abnormal returns for two years after the event is −32.68% and the abnormal returns for three years after the event is −34.36%. If we take SONY as an example, this indicates that the data breach event will result in SONY company’s market value loss of 293 million dollars one year after the event, and cumulative loss of 937 million two years after the event. If we take the company’s actual data into the regression results for estimation, the accumulated abnormal returns is −60.7% (estimated market value loss of about 1.7 billion). In other words, if the company spends 10 million a year in IT-related investment to avoid possible market value loss of 930 million to 1.73 billion due to data breach, it will be a worthwhile investment.
According to anecdotal evidence report [
53], the average cost of each data breach from 2013 to 2015 is
$188 for 2013,
$201 for 2014 and
$217 for 2015. However, the cost calculated by this report only encompasses cost of investigation and evidence collection after the incident, legally-related compensation, equity-related costs, system testing cost, loss of customers, loss of customer loyalty, and reduce profitability of the company. The report’s estimated cost did not take into account the company’s market value loss. Using the sample of this study, we estimate that the average cost of each element of the data breach is around
$1786.45 per breach, which is larger than the reported cost on the anecdotal evidence. The above results indicated that when a data breach event happened, in addition to the actual cost of company’s administrative processing of the breach incident, the amount of legal compensation, and loss of customers and profitability, the loss in the company’s market value should not be easily overlooked.
The results of this study show that data breach events have a significant negative impact on a company’s long-term and short-term market value. When the company is faced with tangible and intangible losses due to data breach event, investors will re-evaluate the value of the company through the stock market. Moreover, through the regression analysis, it is pointed out that the event size and the abnormal market returns are positively correlated. In other words, if a company did not invest in an IT-related protection system, once an attack was leaked and the number of confidential information elements leaked became greater, the market value loss that the company suffered is more serious. The empirical results also show that the impact of breach events can be as long as three years. Therefore, this study can be utilized as a reference basis, with the expectations that managers can more carefully consider the importance of IT-related security investment on the market value of the company.
6.3. Limitations and Future Research
There are four major limitations on the design of this study that have to be taken into consideration in interpreting the findings described above. First, the sample of the study only covers North American-based companies. Therefore, the findings may not be applicable to other countries outside of this continent. Second, due to the complexity of security incidents, the characteristics of the sample cannot be clearly defined during the sample collection process. For example, some of the news reports did not clearly mention the cause of the incidents, the companies being affected, and the size of the breaches. However, to maintain the number of event samples, for samples in which the size of the event is unknown, we used an estimated method of filling. Thus, in the results, an estimation error of the event size may exist. Third, in regard to the distribution of samples collected in this study, most occurred in 2014 period. This limited the number of samples that can be used to estimate the various periods for long-term valuation, thereby resulting in a small long-term sample.
For future study, as this study has not explored in detail the impact of other types of security events such as phishing, Advanced Persistent Threat (APT), computer viruses and DoS attacks on the long-term market value of the event company, scholars interested in following up on this topic are encouraged to pursue this direction.


