Abstract
To sin, or not to sin: that has been the question for many people for a long time, and nowadays that question has moved to the financial markets. The existence of studies that show that investing in vice sectors such as the alcohol, tobacco, and gambling industries, collectively known as the “triumvirate of Sin”, is profitable has created some uncertainty for investors who wonder whether or not to be socially responsible. We show that by implementing an investment strategy based on the Fama–French five-factor model, “saint” investors obtain better portfolio performance, even when transaction costs are taken into consideration, and therefore they are the ones chosen to knock on the door of portfolio performance heaven.
1. Introduction
In the early 1960s, Socially Responsible Investment (hereafter SRI) was based on negative criteria that excluded “sin” assets from portfolios, i.e., those related to alcohol, tobacco and the gambling industry, among others, see [1,2]. However, since the 1990s, this type of investment has evolved towards the use of positive selection criteria. Thus, investors began to consider the good practices of listed companies and invest in companies commonly referred to as “best in class”, see [3,4,5,6].
It was not until the beginning of the 21st century that the term became popular with the launch of the United Nations Principles for Responsible Investment. Today, SRI consists of incorporating financial aspects such as return, risk and liquidity, as well as other aspects related to the company’s good environmental, social or corporate governance (ESG) practices, into the asset selection process. In this way, other more specific concepts are covered such as the so-called green investment that only considers the environmental objectives of sustainable investors, see [7,8,9], or impact investment that considers social aspects, see [10].
Notwithstanding all this, we agree with Betti et al. [11], Cunha et al. [12] and Talan and Sharma [13] in considering that currently this type of investment must progress in the direction of a sustainable investing aligned with the efforts defined by the UN to achieve global sustainable development and concretised in the Sustainable Development Goals (SDGs) and the 2030 Agenda.
On the other hand, the existence of studies that show that investing in the alcohol, tobacco, and gambling economic sectors, collectively known as the “triumvirate of sin”, is profitable has created some uncertainty among investors. Salaber [14] found that sin stocks earned excess returns relative to the market as did Fabozzi et al. [15], who examined a sample of sin stocks across 21 countries, finding that they outperformed the market in terms of both magnitude and frequency, and Hong and Kacperczyk [16] showed that sin stock companies significantly outperformed similar comparable stocks.
However, more recently Richey [17] found that investors should not construct a portfolio of sin stocks with the hope of achieving abnormal returns, and Blitz and Fabozzi [18], who employed a similar procedure, found no premium investment opportunities after controlling for the five factors proposed by Fama and French [19].
Therefore, there is a question blowing in the wind: is it more profitable to be a socially responsible (saint) investor or a vice (sinner) investor? In this paper, we will assume the role of advocatus diaboli to look for an answer.
Previous empirical evidence has focused on analyzing the performance of different socially responsible and sin stocks or portfolios on the basis of different ratios, or the Fama–French [20] model and its extensions, in which the research is concentrated on the significance of alpha and beta. However, there is no empirical evidence on developing different strategies based on the value of alphas obtained from the estimation of a Fama–French model for these economic sectors. More precisely, we estimated several portfolios using a spanning procedure based on considering a set of initial assets and analyzing whether the inclusion of additional assets shifted its performance.
Additionally, we will improve on previous empirical evidence by employing exchange traded funds, hereinafter ETFs. These are a portfolio of assets, similar to mutual funds, but are also easily traded like stocks.
Our results showed that investing in responsible ETFs following a positive alpha clearly outperformed the option of investing in vice ETFs following the same strategy, but also other strategies, procedures, and even considering transaction costs. Consequently, following our results, investors should be saints instead of sinners.
The rest of the paper is organized as follows. In Section 2, we present a literature review of the topic, we describe the methodology employed to construct alternative strategies, and the database is defined. Section 3 details the empirical results of the proposed investment strategies. Section 4 provides the results of the robustness test. Finally, Section 5 provides the main conclusions.
2. Materials and Methods
2.1. Literature
Several performance studies have been developed on empirical literature using different asset pricing models such as the Fama–French [20] three-factor model, the Carhart [21] four-factor model, and the Fama–French [19] five-factor model with mixed results. Derwall et al. [22], Statman and Glushkov [23], and Chow et al. [24], among others, found that investing in SRI stocks generated positive abnormal returns. On the other hand, Brammer et al. [25], Derwall and Verwijmeren [26], and Becchetti and Ciciretti [27] provided evidence that SRI stocks generate negative abnormal returns.
There are also numerous studies in which portfolio performance is compared with conventional or similar portfolios. Bauer et al. [28] performed rolling regressions to test for the stability of some asset pricing models. They deduced that ethical funds do not outperform conventional funds. Mateus et al. [29] followed the methodology proposed by Angelidis et al. [30] and reveal that both the Fama-French three-factor and the Carhart four-factor models amplify the underperformance of UK equity mutual funds. More recently, Nofsinger and Varma [31] find evidence that US SRI mutual funds outperform conventional funds during periods of market crises, and underperform them during non-crisis periods. Leite and Cortez [32] investigate the performance of French SRI funds, and show, in accordance with Nofsinger and Varma [31], that they significantly underperform compared to conventional funds during non-crisis periods. However, these French SRI funds only match them during market downturns. Auer and Schuhmacher [33] analyse the performance of socially (ir) responsible investment in the Asian-Pacific region, the United States and Europe. They find that active selection of high- or low-rated stocks does not provide superior risk-adjusted performance in comparison to passive investments. Finally, Silva and Cortez [7] focus on green funds that are certified with an SRI label (SRI funds that use environmental criteria in their investment decisions), finding that they tend to underperform the benchmark investments.
In relation to investments that SRI investors avoid, Salaber [14] found that a European sin stock portfolio outperformed a sin-free portfolio over the period 1975–2006 by more than 4%. Hong and Kacperczyk [16] found that sin stocks earned positive abnormal returns of about 4.5%. These results were corroborated by [34] and [35]. Durand et al. [36] found evidence that there was a positive risk-adjusted performance for sinner stocks, but they did not find a negative risk-adjusted performance for saint stocks. More recently, Richey [37] showed that vice portfolios outperformed the market portfolio on a risk adjusted basis and provided investors with an alternative to simple passive strategies.
However, as mentioned previously, most of the aforementioned empirical evidence was focused mainly on analyzing the performance of asset pricing models or simple portfolios of assets, but there have been other lines of study. Kempf and Osthoff [38], Ziegler et al. [39], Brzeszczyński and McIntosh [40], and Berkman and Yang [41], among others, create portfolios of assets that go long or short following different criteria. In all cases, they tested the significance of the portfolio returns over different asset pricing models but they obtain dissimilar returns. Following this approach to developing an investment strategy, we adhere to the line of Sarwar et al. [42]. They proposed the use of the Fama-French five-factor model for developing an investment strategy. They also propose the use of various rebalancing periods for the portfolios, which lead to finding profitable strategies.
2.2. Methodological Approach
The seminal works of Sharpe [43] and Lintner [44] propose the CAPM model where investors are only compensated for undiversifiable risk. In this model, alpha and beta coefficients are obtained from regressions of stock returns on market returns.
where Rit is the asset return for period t; Rf is the risk-free rate; Rmt is the return of the value weighted market index for period t; αi is Jensen’s alpha (see [45]); βi is the systematic risk of the asset; and εit is the error term.
Fama and French [20] expand the CAPM model and add two additional factors which are the SMB size factor (Small Minus Big returns) and the HML value factor (High Minus Low returns).
This model was extended by Carhart [21], who included a momentum factor, MOM, which is estimated as the difference between portfolio returns comprising the stocks of winners and losers in the past.
Finally, Fama and French [19] took into account empirical evidence that suggested that their three-factor model may be incomplete as it fails to capture diverse variations of returns related to profitability and investment (see [46,47]), and proposed a five-factor model in which the differences between stocks with robust and weak profitability (RMW) and the stocks of low and high investment firms (Conservative Minus Aggressive, CMA) were included.
Our methodology is not based on expected returns but on the alphas of these models. More precisely, we focus on the alphas of the Fama-French five-factor model. This alpha is known as Jensen’s alpha and indicates a superior (inferior) performance of the asset in relation to the benchmark when it is statistically significant positive (negative).
We estimated five-year rolling alphas following the procedure of different authors (see [48,49,50,51,52,53]), but also that of Morningstar, a leading provider of investment analysis to the mutual fund industry, which uses a default period of 60 months (five years) to estimate most of its performance measures. Afterward, we use those alphas to compose a long-only strategy and a long-only with risk-free asset strategy on daily data but rebalanced monthly. That means that once the alphas of the ETFs, which compound one portfolio, are considered, they remain unchanged until the end of the month where new alphas are estimated. The following portfolio has the same values as the previous one to the moment in which the first alpha of the new ETF is estimated (which is five years after its inception date). Once again, that alpha remains the same until the end of that month where new alphas for all the ETFs that make up the portfolio are estimated and then considered. Therefore, a total of 25 portfolios are formed for each strategy following a spanning procedure that is based on considering a set of initial assets (six ETFs in our case) for the first portfolio and analyzing whether the inclusion of additional assets, to a maximum of 30 assets compounding our last portfolio, shifts its performance.
A buy signal appears for an asset in month t + 1 in the long-only strategy when the alpha for the rolling window ending in month t is positive, but takes no position when the alpha is negative. On the other hand, the long-only with risk-free strategy considers the investment on risk-free assets (one-month U.S. T-Bill) when the alpha is negative.
There were two main reasons that led us to opt for this procedure. First, the different inception dates for each ETF did not allow us to compose a portfolio of several assets that covered a long-run performance and varying market conditions. For that reason, we decided to analyze an initial portfolio of six assets, which formed the basis of those formed by seven, eight, and so on until thirty ETFs were added to each previous portfolio in their respective inception dates. This procedure allowed us to analyze the benefits of diversification over a long sample with bull and bear phases and also to consider different assets with their different returns and risks. Second, this is a common procedure that was first documented by Huberman and Kandel [54], but has also been employed using different assets by [55,56,57,58], among others.
The performances of the proposed portfolios and strategies were evaluated following three methods. The first is called “style-comparison” and was proposed by Sharpe [59], Christopherson [60], and Reilly and Norton [61]. This compares the returns of portfolios that have a similar investment style. Following this method, we considered that portfolios that provided higher cumulated returns were those with better performance.
The second method involves performance measures being “risk-adjusted” to take account of different risk levels. In this case, the Sharpe and Sortino ratios are the most notable, and, once again, higher values are better.
The Sharpe ratio can be defined as the sample mean of excess returns on the risk-free asset, divided by their sample standard deviation. For the risk-free rate, we used the yield of a one-month U.S. T-Bill.
The Sortino ratio (see [62,63]) is very similar to the former, but instead of dividing the excess return by the standard sample deviation, it is divided by the downside deviation, which only considers excess returns below zero.
These are the common ratios for analyzing the performance of different portfolios in the empirical evidence, however, it must be pointed out that financial series commonly have asymmetry and kurtosis levels that differ from those found in normal distributions. Given that the Sharpe and Sortino ratios neglect the skewness and kurtosis, they conceal a considerable amount of risk. For that reason, Shadwick and Keating [64] proposed the use of the Omega ratio as a performance measure. The Omega ratio, which is also known as a gain–loss ratio, is the ratio of the cumulative probabilities above and below a specified threshold (zero and risk-free rate in our case), and is defined as follows:
The main advantage of the Omega ratio is that it makes no assumptions about the underlying distribution of returns.
We evaluate the performance of the proposed strategies by comparing their results with those obtained from an equally weighted (naïve) portfolio. We use it as a benchmark because, as pointed out by DeMiguel et al. [65], this strategy is easy to implement and that is why investors continue to use it in the allocation of their assets.
2.3. Data
In our study, we employed daily returns from 12 February 2001 to 31 July 2019 (amounting to 4644 usable observations) of sixty ETFs: thirty of them representative of socially responsible investments, while the other thirty are representative of vice investments. There is no common procedure in the empirical literature about the number of assets that make up a portfolio. We considered a total of thirty assets because by combining them in different groups, we were able to obtain well-diversified portfolios, so we reduced the risk inherent to a few investments and we increased the possibility of making profits.
Three criteria were followed for selecting the ETFs: the score in the sustainable impact solutions ratio (SIS) as reported by the ETF database (see http://etfdb.com accessed in September 2019), which is considered by the experts as the best website for screening, researching, and analyzing ETFs; the involvement of alcohol, tobacco, and gambling activities that determine the inclusion or not of an ETF on the SRI or vice sectors; and the inception dates.
Table 1 and Table 2 show the responsible ETFs and the vice ones, respectively. The first two columns show the code of each ETF and the complete name, respectively, while the third one exposes the inception date. The values of the sustainable impact solution ratios are displayed in the fourth column and, finally, the last three columns exhibit the involvement of the alcohol, tobacco, and gambling sectors of each ETF.

Table 1.
Profile of socially responsible exchange traded funds (ETFs).
Table 2.
Profile of vice ETFs.
The first criterion is defined by the ETF Database as the exposure of an ETF to Sustainable Impact Solutions which is the portfolio weighted average of each company’s percentage of revenue generated by Sustainable Impact Solution goods and services. Accordingly with this definition, responsible ETFs are those with high Sustainable Impact Solution values while vice ETFs are those with the lower ones.
The second criterion is the involvement of each ETF in the alcohol, tobacco, and gambling sectors, which are referred to as the “triumvirate of sin”. Those ETFs with high involvement in these sectors as reported by ETF database are associated with non-responsible or vice ETFs, while those without involvement or minimum are considered the responsible ones.
Finally, ETFs were picked with different inception dates due to the impossibility of finding a significant number of ETFs that jointly complied with the previous criteria, but also with the long samples. No ETFs with an inception date beyond the end of July 2013 were chosen because we considered that a minimum of one year of rolling alphas must be used after applying a five-year rolling window for estimating those alphas.
All the ETFs in Table 1 and Table 2 are mentioned in descending order of their inception dates because those dates determine the composition of the portfolios. As an example, the first portfolio that will be later referred to as P6, was formed by the first six ETFs of each group, that is, XLV, BBH, PPH, IYH, ICF, and IBB in the case of the socially responsible ETFs. The following portfolio, P7, which added VHT ETF, was the same as the previous one to five years after (the rolling window) the inception date of VHT where that ETF was added to the portfolio due to the appearance of the new rolling alpha.
As was pointed out previously, this procedure was repeated by adding one ETF in each inception date plus five years until the last portfolio was formed, P30. It must be pointed out that although there were inception dates previous to 12 February 2001, it was the chosen date for beginning our sample because it is the inception date of the sixth ETF considered in the socially responsible group and we wanted to use the same sample for both groups.
Interesting data is evident in Table 1 and Table 2 regarding the profiles of the selected ETFs, reflecting their differences. First, there were significant dissimilarities in the sustainable impact solution values, where higher values are better. As expected, the values of this ratio were better for socially responsible ETFs, as the sustainable impact percentage was higher (a maximum of 71.69% for the ICLN ETF, whilst the highest value for the vice ETFs was 7.54%, for EWH ETF).
Involvement in the “triumvirate of sin”, investing in the alcohol, tobacco, and gambling sectors, was also quite different because there were some socially responsible ETFs with a minimum percentage of involvement in alcohol and tobacco. On the other hand, as expected, all of the socially irresponsible ETFs had a high level of involvement in at least two of the “sin sectors”.
Table 3 and Table 4 report the main descriptive statistics and stochastic properties of the ETF returns (data are available as Supplementary Materials). On average, socially responsible ETFs had higher returns and lower volatilities than vice ones. On the basis of the ANOVA test, we did not reject the null hypothesis that all the return series for each group of ETFs had the same mean, because the differences were not statistically significant. Moreover, the rejection of the null hypothesis of the equality of variances would lead us to conclude that the differences were statistically significant. Skewness was mostly negative and kurtosis was higher than three in both groups, therefore the distributions of returns for all the ETFs were mainly negatively skewed and leptokurtic. Finally, the Jarque–Bera statistic rejects the null hypothesis that the returns are normally distributed in all cases.
Table 3.
Descriptive statistics social responsible ETFs.
Table 4.
Descriptive statistics vice ETFs.
3. Results
At this stage, with the rolling Fama–French five-factor regressions for each ETF estimated, we show in Table 5 and Table 6 the performance of the two proposed strategies: the long-only strategy and the long risk-free strategy, but also those related to the naïve strategy for all the portfolios. Cumulative returns and Sharpe, Sortino, and Omega ratios (where zero and the risk-free rate are taken as the thresholds) are displayed in all cases. Due to the 60-month rolling window, these results covered the period from 17 February 2006 to 31 July 2019 (amounting to 3385 usable observations). This interval can be considered to be the “out-of-sample” period.
Table 5.
Performance from responsible portfolios using a 5-year rolling window.
Table 6.
Performance from vice portfolios using a 5-year rolling window.
The results reported in Table 5 show that the long-only strategy clearly outperformed the naïve strategy and also the long-only risk-free one for all portfolios. We also found some interesting evidence. First, portfolios compounded by six to 12 assets showed significant increases and decreases in the performance ratios, which suggests a level of instability.
Second, the portfolio formed by the 13 assets with older inception dates (P13) reported the best performance measures for most of the ratios considered and, finally, there were no significant differences in the performance ratios for the rest of the portfolios when compared to P13. It must be pointed out that improvements around 60% in the Sharpe and Sortino ratios were obtained when the long-only strategy was applied. On the other hand, not so large but constant improvements around 3% were obtained when Omega ratios were compared among strategies.
The superior performance of the long-only strategy was also observed when we focused on Table 6 where ratios from sinner portfolios are reported, but in this case, a minimum of 15 assets were needed to improve the results of its naïve strategy and portfolios with 21 to 23 assets to obtain the best performance ratios. In this case, improvements in Sharpe and Sortino ratios when the long-only strategy was applied were lower, remaining around 20%, than those obtained with the naïve and the long-only risk-free strategies. In any case, the sinner portfolios showed worse results than those reported by the responsible ones, which means that initially an investor should opt for being a saint instead of a sinner.
Figure 1 and Table 7 help us to analyze the previous results in depth. Figure 1 shows the cumulative returns of the portfolio formed by 13 socially responsible ETFs (P13) following the long-only, the long-only with risk-free, and the naïve strategies. It also shows the cumulative returns for the same strategies but for the portfolio compounded by 15 vice ETFs (P15), and finally, it compares the cumulative returns of the long-only strategies for the P13 responsible portfolio and the P15 vice one.
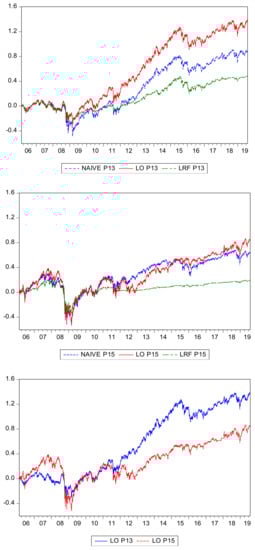
Figure 1.
Cumulative returns for socially responsible investment (SRI) and vice exchange traded funds (ETFs) using different strategies.
Table 7.
Positive and negative alphas over the rolling window.
We observed in all cases that the worst results for these strategies were provided when the rolling window employed for estimating the alphas covered the period from 2001 to 2011 (which means obtaining the first alphas in 2006 and the last ones in 2011).
This is a period of significant upward and downward trends in the economy with different crises that lead to obtaining negative returns in most of the assets on the stock markets, even the socially responsible ETFs.
On the other hand, there were significant upward trends in the cumulative returns for the portfolios when alphas were estimated in the period, which coincided with the end of the previous one (rolling sample from 2006 to 2011) and ended in 2017 (rolling sample from 2012 to 2017). Most of that period is characterized by a significant upward trend in the economy, during which it was recovering from the 2008 and the 2011 crises (dot.com and subprime crises, respectively). However, the new evidence of economic crisis in 2018 led to a decrease in the cumulative returns of the strategies, which followed the alphas that were estimated in the rolling windows ending in July 2019. We could deduce from these results that this rolling alpha procedure worked better in upward economic trends.
Table 7 reports the positive and negative alphas over the respective rolling windows (restricted to their inception dates). Focusing on the responsible ETFs, where we obtained the best performance results, we observed that there were a total of nine responsible ETFs (PBW, PZD, QCLN, PBD, PIO, IFEU, TAN, ICLN, and LIT) without positive alphas, which means that they did not contribute anything to the portfolio return when the long-only strategy was employed and only added the risk-free ratio return due to the negative alphas when the long-only with risk-free strategy was used. Most of these ETFs are related to the renewable or clean energy sectors, which were highlighted by Silva and Cortez [7], Reboredo et al. [66], and Rezec and Scholtens [67] as underperformers of their respective benchmarks.
On the other hand, there are ETFs such as IBB, XBI, FBT, RYH, PSCH and XHE that help to improve the performance of the portfolios with their high percentage of positive alphas. Most of them are related to the healthcare sector, as pointed out by Schramade [68] and Betti et al. [11] as the most investable and important sector for achieving the Sustainable Development Goals and, therefore, a perfect way to respond to the responsible (saint) preferences of the investors.
In essence, it has been clearly shown that saint investors obtain better performances than sinner ones, that it is more profitable to use a long-only strategy preferably on upward trends, and that it is more appropriate to invest in healthcare ETFs than in those focused on the renewable energy sector.
4. Discussion
For the sake of providing more robustness to our results, we consider transaction costs but also another approach. Following Blitz and Huij [69], who stated that funds underperform market portfolios due to expense ratios, we consider a 0.56% annual expense ratio (which corresponds to the mean of the expense ratios from the ETFs considered in this paper). The out-of-sample portfolio performance results are shown in Table 8 and Table 9. We observe that the profitability of our proposal takes into account expense ratios sufficiently, and, once again, the suitability of investing in socially responsible ETFs instead of investing in vice ETFs is proved.
Table 8.
Performance from responsible portfolios using a 5-year rolling window considering transaction costs.
Table 9.
Performance from vice portfolios using a 5-year rolling window considering transaction costs.
There are some authors such as Bauer et al. [28], Humphrey and Tan [70], or Sarwar et al. [42], among others, who have proposed using a 3-year rolling window for estimating the alphas. We also considered that procedure in order to compare the results with those obtained previously using a 5-year rolling window. In order to analyze this alternative procedure using the same terms as the previous one, we report the results in Table 10 and Table 11.
Table 10.
Performance from responsible portfolios using a 3-year rolling window considering transaction costs.
Table 11.
Performance from vice portfolios using a 3-year rolling window considering transaction costs.
We used a 3-year rolling window for the same “out-of-sample” period that was employed for the 5-year rolling average, that is, from 17 February 2006 to 31 July 2019 (amounting to 3385 usable observations) as well as the transaction costs. We found profitable strategies for both social (saint) and vice (sinner) ETFs and, once again, we obtained better performance results for the saint ETFs. However, these results did not outperform those obtained using the previous procedure (see Table 8 and Table 9) that employed a five-year rolling window, which was found to be the better procedure.
Therefore, we have shown the adequacy of the suggested methodology for improving the performance of investments, especially in responsible ones, in spite of some limitations that, however, do not lend merit to the results. First, we found just a few of ETFs with long inception dates, which led us to limit the sample and so were not able to analyze different periods of time. Second, we did not perform statistical significance tests to the different results such as those suggested by Burchi [71] or Herzel et al. [57] due to the high volume of performance measures that would make their exhibition cumbersome.
5. Conclusions
Given the different studies showing the profitability of the “triumvirate of Sin” investments (alcohol, tobacco, and gambling), investors may be unsure whether to invest in these sectors and become “sinners”, or remain “saints” and invest in socially responsible sectors.
This paper has analysed this uncertainty by developing various investment strategies based on the value of the alphas which are obtained from the estimation of the Fama-French five-factor model. Therefore, we estimated several portfolios using a spanning procedure, which to the best of our knowledge, has not been applied previously, and we analyzed whether the inclusion of assets improved the portfolio performance.
We have shown that saint investors obtain better performance measures than sinner investors using different rolling windows even when transaction costs are considered. We have demonstrated the suitability of investing in socially responsible ETFs instead of socially irresponsible ETFs, and the suitability of using a long-only strategy, which is the most profitable in spite of some limits related to the lack of availability of long inception dates or the absence of statistical significance tests. These limits do not take merits to the results but they must be taken into account in future research in order to improve the empirical evidence as well as comparing their performance with ETFs which track indices such as the Dow Jones Industrial average or the S&P500. To sum up, these better results for the socially responsible investment could be explained by the fact that ETFs are quickly becoming favourite investment for millennials who look to make a profit while making a positive difference in the world. Individual and institutional investors can employ this approach to increase the economic value to their investment strategies.
Supplementary Materials
Data are available at this website http://dx.doi.org/10.17632/ymkjh654h8.1.
Author Contributions
This work is an outcome of the joint efforts of the two authors. J.L.M.-Q. conceived the research idea, provided research materials, and analysis tools and contributed to the interpretation of the results. M.M.M.-Q. conceived the research idea and reviewed the related literature. Both authors provided contributions to the conclusions and implications of the research and wrote the manuscript and thoroughly read and approved the final version. All authors have read and agreed to the published version of the manuscript.
Funding
This research was funded by the Junta de Extremadura under the VI Action Plan for Research and Development 2017/20 through the GIMAF research group (reference GR18022).
Conflicts of Interest
The authors declare no conflict of interest.
References
- Renneboog, L.; Ter Horst, J.; Zhang, C. Socially responsible investments: Institutional aspects, performance, and investor behavior. J. Bank. Financ. 2008, 32, 1723–1742. [Google Scholar] [CrossRef]
- Sandberg, J.; Juravle, C.; Hedesström, T.M.; Hamilton, I. The heterogeneity of socially responsible investment. J. Bus. Ethics. 2009, 87, 519–533. [Google Scholar] [CrossRef]
- Eccles, N.S.; Viviers, S. The origins and meanings of names describing investment practices that integrate a consideration of ESG issues in the academic literature. J. Bus. Ethics. 2011, 104, 389–402. [Google Scholar] [CrossRef]
- Goettsche, M.; Steindl, T.; Gietl, S. Do customers affect the value relevance of sustainability reporting? Empirical evidence on stakeholder interdependence. Bus. Strategy Environ. 2016, 25, 149–164. [Google Scholar] [CrossRef]
- McWilliams, A.; Parhankangas, A.; Coupet, J.; Welch, E. Strategic decision making for the triple bottom line. Bus. Strategy Environ. 2016, 25, 193–204. [Google Scholar] [CrossRef]
- Miralles-Quirós, M.M.; Miralles-Quirós, J.L.; Arraiano, I.G. Sustainable development, sustainability leadership and firm valuation: Differences across Europe. Bus. Strategy Environ. 2017, 26, 1014–1028. [Google Scholar] [CrossRef]
- Silva, F.; Cortez, M.C. The performance of US and European green funds in different market conditions. J. Clean. Prod. 2016, 135, 558–566. [Google Scholar] [CrossRef]
- Segura, S.; Ferruz, L.; Salvador, M. Environmental versus economic performance in the EU ETS from the point of view of policy makers: A statistical analysis based on copulas. J. Clean. Prod. 2018, 176, 1111–1132. [Google Scholar] [CrossRef]
- Allevi, E.; Basso, A.; Bonenti, G.; Oggioni, G.; Riccardi, O. Measuring the environmental performance of green SRI funds: A DEA approach. Energy Econ. 2019, 79, 32–44. [Google Scholar] [CrossRef]
- Höchstädter, A.K.; Scheck, B. What’s in a Name: An analysis of impact investing understandings by academics and practitioners. J. Bus. Ethics. 2015, 132, 449–475. [Google Scholar] [CrossRef]
- Betti, G.; Consolandi, C.; Eccles, R.G. The relationship between investor materiality and the sustainable development goals: A methodological framework. Sustainability 2018, 10, 2248. [Google Scholar] [CrossRef]
- Cunha, F.A.F.S.; Oliveira, E.M.; Orsato, R.J.; Klotzle, M.C.; Oliveira, F.L.C.; Caiado, R.G.G. Can sustainable investments outperform traditional benchmarks? Evidence from global stock markets. Bus. Strategy Environ. 2020, 29, 682–697. [Google Scholar] [CrossRef]
- Talan, G.; Sharma, G. Doing well by doing good: A systematic review and research agenda for sustainable investment. Sustainability 2019, 11, 353. [Google Scholar] [CrossRef]
- Salaber, J. Religion and returns in Europe. Eur. J. Political Econ. 2013, 32, 149–160. [Google Scholar] [CrossRef]
- Fabozzi, F.; Ma, K.; Oliphant, B. Sin stock returns. J Portf. Manag. 2008, 35, 82–94. [Google Scholar] [CrossRef]
- Hong, H.; Kacperczyk, M. The price of sin: The effects of social norms on markets. J. Financ. Econ. 2009, 93, 15–36. [Google Scholar] [CrossRef]
- Richey, G.M. Fewer reasons to sin: A five-factor investigation of vice stock returns. Manag. Financ. 2017, 43, 1016–1033. [Google Scholar] [CrossRef]
- Blitz, D.; Fabozzi, F.J. Sin stocks revisited: Resolving the sin stock anomaly. J. Portf. Manag. 2017, 44, 105–111. [Google Scholar] [CrossRef]
- Fama, E.F.; French, K.R. A five-factor asset pricing model. J. Financ. Econ. 2015, 116, 1–22. [Google Scholar] [CrossRef]
- Fama, E.F.; French, K.R. Common risk factors in the returns on stocks and bonds. J. Financ. Econ. 1993, 33, 3–56. [Google Scholar] [CrossRef]
- Carhart, M. On persistence in mutual fund performance. J. Financ. 1997, 52, 57–82. [Google Scholar] [CrossRef]
- Derwall, J.; Guenster, N.; Bauer, R.; Koedijk, K. The eco-efficiency premium puzzle. Financ. Anal. J. 2005, 61, 51–63. [Google Scholar] [CrossRef]
- Statman, M.; Glushkov, D. The wages of social responsibility. Financ. Anal. J. 2009, 65, 33–46. [Google Scholar] [CrossRef]
- Chow, G.W.; Durand, R.B.; Koh, S. Are ethical investments good? Aust. J. Manag. 2014, 39, 645–665. [Google Scholar] [CrossRef]
- Brammer, S.; Brooks, C.; Pavelin, S. Corporate social performance and stock returns: UK evidence from disaggregate measures. Financ. Manag. 2006, 35, 97–116. [Google Scholar] [CrossRef]
- Derwall, J.; Verwijmeren, P. CSR and the cost of equity capital. In The Economic Virtues of SRI and CSR; Derwall, J., Ed.; ERIM Ph.D. Series Research in Management; Haveka: Alblasserdam, The Netherlands, 2007; pp. 193–213. [Google Scholar]
- Becchetti, L.; Ciciretti, R. Corporate social responsibility and stock market performance. Appl. Financ. Econ. 2009, 19, 1283–1293. [Google Scholar] [CrossRef]
- Bauer, R.; Otten, R.; Rad, A.T. Ethical investing in Australia: Is there a financial penalty? Pac. Basin Financ. J. 2006, 14, 33–48. [Google Scholar] [CrossRef]
- Mateus, I.B.; Mateus, C.; Todorovic, N. UK equity mutual fund alphas make a comeback. Int. Rev. Financ. Anal. 2016, 44, 98–110. [Google Scholar] [CrossRef]
- Angelidis, T.; Giamouridis, D.; Tessaromatis, N. Revisiting mutual fund performance evaluation. J. Bank. Financ. 2013, 37, 1759–1776. [Google Scholar] [CrossRef]
- Nofsinger, J.; Varma, A. Socially responsible funds and market crises. J. Bank. Financ. 2014, 48, 180–193. [Google Scholar] [CrossRef]
- Leite, P.; Cortez, M.C. Performance of European socially responsible funds during market crises: Evidence from France. Int. Rev. Financ. Anal. 2015, 40, 132–141. [Google Scholar] [CrossRef]
- Auer, B.R.; Schuhmacher, F. Do socially (ir)responsible investments pay? New evidence from international ESG data. Q. Rev. Econ. Financ. 2016, 59, 51–62. [Google Scholar] [CrossRef]
- Liston, D.; Soydemir, G. Faith-based and sin portfolios: An empirical inquiry into norm-neglect vs. norm-conforming investor behavior. Manag. Financ. 2010, 36, 876–885. [Google Scholar] [CrossRef]
- Kim, I.; Venkatachalam, M. Are sin stocks paying the price for accounting sins? J. Account. Audit. Financ. 2011, 26, 415–442. [Google Scholar] [CrossRef]
- Durand, R.B.; Koh, S.; Limkriangkrai, M. Saints versus sinners. Does morality matter? J. Int. Financ. Mark. Inst. Money 2013, 24, 166–183. [Google Scholar] [CrossRef]
- Richey, G.M. Sin Is In: An alternative to socially responsible investing? J. Invest. 2016, 25, 136–143. [Google Scholar] [CrossRef]
- Kempf, A.; Osthoff, P. The effect of socially responsible investing on portfolio performance. Eur. J. Manag. 2007, 13, 908–922. [Google Scholar] [CrossRef]
- Ziegler, A.; Busch, T.; Hoffmann, V.H. Disclosed corporate responses to climate change and stock performance: An international empirical analysis. Energ Econ. 2011, 33, 1283–1294. [Google Scholar] [CrossRef]
- Brzeszczyński, J.; McIntosh, G. Performance of portfolios composed of British SRI stocks. J. Bus. Ethics 2014, 120, 335–362. [Google Scholar] [CrossRef]
- Berkman, H.; Yang, W. Country-level analyst recommendations and international stock market returns. J. Bank. Financ. 2019, 103, 1–17. [Google Scholar] [CrossRef]
- Sarwar, G.; Mateus, C.; Todorovic, N. US sector rotation with five-factor Fama–French alphas. J. Asset Manag. 2018, 19, 116–132. [Google Scholar] [CrossRef]
- Sharpe, W.F. Capital asset prices: A theory of market equilibrium under conditions of risk. J. Financ. 1964, 19, 425–442. [Google Scholar] [CrossRef]
- Lintner, J. The valuation of risk assets and the selection of risky investments in stock portfolios and capital budgets. Rev. Econ. Stat. 1965, 47, 13–37. [Google Scholar] [CrossRef]
- Jensen, M.C. The performance of mutual funds in the period 1945-1964. J. Financ. 1967, 23, 389–416. [Google Scholar] [CrossRef]
- Titman, S.; Wei, K.C.J.; Xie, F. Capital investment and stock returns. J. Financ. Quant. Anal. 2004, 39, 677–700. [Google Scholar] [CrossRef]
- Novy-Marx, R. The other side of value: The gross profitability premium. J. Financ. Econ. 2013, 108, 1–28. [Google Scholar] [CrossRef]
- Fama, E.F.; MacBeth, J.D. Risk, return, and equilibrium: Empirical tests. J. Political Econ. 1973, 81, 607–636. Available online: https://www.jstor.org/stable/1831028 (accessed on 3 November 2020). [CrossRef]
- Griffin, J.M. Are the Fama and French factors global or country specific? Rev. Financ. Stud. 2002, 15, 783–803. Available online: https://www.jstor.org/stable/2696721 (accessed on 3 November 2020). [CrossRef]
- Mishra, S.; DeFusco, R.A.; Prakash, A.J. Skewness preference, value and size effects. Appl. Financ. Econ. 2008, 18, 379–386. [Google Scholar] [CrossRef]
- Barth, M.E.; Konchitchki, Y.; Landsman, W.R. Cost of capital and transparency. J. Account. Econ. 2013, 55, 206–224. [Google Scholar] [CrossRef]
- Verheyden, T.; De Moor, L.; Vanpée, R. Mutual fund performance: A market efficiency perspective. Invest. Anal. J. 2016, 45, 1–15. [Google Scholar] [CrossRef]
- Zeng, Y. Institutional investors: Arbitrageurs or rational trend chasers. Int. Rev. Financ. Anal. 2016, 45, 240–262. [Google Scholar] [CrossRef]
- Huberman, G.; Kandel, S. Mean–variance spanning. J. Financ. 1987, 42, 873–888. [Google Scholar] [CrossRef]
- Errunza, V.; Hogan, K.; Hung, M.W. Can the gains from international diversification be achieved without trading abroad? J. Financ. 1999, 54, 2075–2107. [Google Scholar] [CrossRef]
- Berrill, J.; Kearney, C. Firm-level internationalisation and the home bias puzzle. J. Econ. Bus. 2010, 62, 235–256. [Google Scholar] [CrossRef]
- Herzel, S.; Nicolosi, M.; Starica, C. The cost of sustainability in optimal portfolio decisions. Eur. J. Financ. 2012, 3–4, 333–349. [Google Scholar] [CrossRef]
- O’Hagan-Luff, M.; Berrill, J. Why stay-at-home investing make sense. Int. Rev. Financ. Anal. 2015, 38, 1–14. [Google Scholar] [CrossRef]
- Sharpe, W.F. Asset allocation: Management style and performance measurement. J. Portf. Manag. 1992, 18, 7–19. [Google Scholar] [CrossRef]
- Christopherson, J.A. Equity style classifications. J. Portf. Manag. 1995, 21, 32–43. [Google Scholar] [CrossRef]
- Reilly, F.K.; Norton, E.A. Investments, 6th ed.; Thompson-Southwestern: Mason, OH, USA, 2003. [Google Scholar]
- Sortino, F.; Satchell, S.E. Managing Downside Risk in Financial Markets: Theory, Practice and Implementation; Butterworth-Heinemann: Oxford, UK, 2001. [Google Scholar]
- Sortino, F. The Sortino Framework for Constructing Portfolios Focusing on Desired Target Return™ to Optimize Upside Potential Relative to Downside Risk; Elsevier Science: Amsterdam, The Netherlands, 2009. [Google Scholar]
- Shadwick, W.F.; Keating, C. A universal performance measure. J. Perform. Meas. 2002, 6, 59–84. [Google Scholar]
- DeMiguel, V.; Garlappi, L.; Uppal, R. Optimal versus naive diversification: How inefficient is the 1/N portfolio strategy? Rev. Financ. Stud. 2007, 22, 1915–1953. [Google Scholar] [CrossRef]
- Reboredo, J.C.; Quintela, M.; Otero, L.A. Do investors pay a premium for going green? Evidence from alternative energy mutual funds. Renew. Sust. Energ Rev. 2017, 73, 512–520. [Google Scholar] [CrossRef]
- Rezec, M.; Scholtens, B. Financing energy transformation: The role of renewable energy equity indices. Int. J. Green Energy 2017, 14, 368–378. [Google Scholar] [CrossRef]
- Schramade, W. Investing in the UN Sustainable Development Goals: Opportunities for companies and investors. J. Appl. Corp. Financ. 2017, 29, 87–99. [Google Scholar] [CrossRef]
- Blitz, D.; Huij, J. Evaluating the performance of global emerging markets equity exchange-traded funds. Emerg. Mark. Rev. 2012, 13, 149–158. [Google Scholar] [CrossRef]
- Humphrey, J.E.; Tan, D.T. Does it really hurt to be responsible? J. Bus. Ethics. 2014, 122, 375–386. [Google Scholar] [CrossRef]
- Burchi, A. The risk in socially responsible investing: The other side of the coin. J. Risk Financ. 2019, 20, 14–38. [Google Scholar] [CrossRef]
Publisher’s Note: MDPI stays neutral with regard to jurisdictional claims in published maps and institutional affiliations. |
© 2020 by the authors. Licensee MDPI, Basel, Switzerland. This article is an open access article distributed under the terms and conditions of the Creative Commons Attribution (CC BY) license (http://creativecommons.org/licenses/by/4.0/).