Abstract
The parameter extraction of proton exchange membrane fuel cells (PEMFCs) has been an active area of study over the past few years, relying on metaheuristic optimizers and experimental datasets to achieve accurate current/voltage (I/V) curves. This work develops a mirage search optimizer (MSO) to precisely estimate the PEMFC model parameters. The MSO employs two search techniques based on the physical phenomena of light bending caused by atmospheric refractive index gradients: a superior mirage for global exploration and an inferior mirage for local exploitation. The MSO employs optical physics to direct search behavior, in contrast to conventional optimization approaches, allowing for a dynamic balance between exploration and exploitation. Convergence efficiency is increased by its iteration-dependent control and fitness-based influence. Using two common PEMFC modules, a comparison study with previously published methodologies and new, recently developed optimizers—the Educational Competition Optimizer (ECO), basketball team optimization (BTO), the fungal growth optimizer (FGO), and the naked mole rat optimizer (NMRO)—was conducted to evaluate the proposed MSO for parameter identification. Furthermore, the two models were tested under various temperatures and pressures. For the three examples studied, the MSO achieved the best sum of squared errors (SSE) values with an intriguing overall standard deviation (STD). It is undeniable that the STD and cropped SSE values, among other difficult techniques, are quite competitive and display the fastest convergence. According to the MSO, the BCS 500W, Ballard Mark V, and Modular SR-12 each have MSO values of 0.011697781, 0.852056, and 1.42098181379214 × 10⁻⁴, respectively. Additionally, the comparison results demonstrate that the proposed MSO can be successfully used to quickly and accurately define the PEMFC model.
MSC:
68W50
1. Introduction
Precise PEMFC models support optimal stack design, component sizing, and thermal–water management. This is essential for scaling PEMFC technology from laboratory prototypes to large-scale industrial applications, transportation systems, and stationary power plants [1]. Furthermore, accurate parameters form the foundation for advanced control algorithms, real-time monitoring, and fault diagnosis. This capability is crucial for safe operation in electric vehicles, marine systems, aerospace, and backup power applications, where performance consistency is critical. It also enhances grid stability and enables low-carbon energy solutions for distributed and off-grid applications worldwide. Improved modeling accuracy reduces reliance on extensive experimental testing and trial-and-error design. This lowers development costs, accelerates commercialization, and minimizes maintenance expenses, supporting cost-effective global adoption of PEMFC technology [2].
PEMFC models typically involve nonlinear equations that relate current, voltage, temperature, pressure, and other physical phenomena. These models are often derived from semi-empirical formulations combining electrochemical kinetics, mass transport, and thermodynamic relationships. Because of this complexity, analytical solutions are impractical, and conventional linear techniques fail to yield accurate parameter values. The models exhibit strong parameter coupling, making the paramaters hard to isolate and estimate independently. This intrinsic nonlinearity makes the optimization landscape complex with multiple local minima, creating challenges in finding the true global optimum. To address these challenges, considerable research has focused on advanced estimation and optimization methodologies. A major trend in PEMFC parameter estimation is the use of modern metaheuristic algorithms, which do not require gradient information and can handle highly nonlinear and multimodal problems [3]. It is worth noting that the parameters of the semi-empirical PEMFC voltage model exhibit strong coupling, as the output voltage is determined by the combined effects of activation, ohmic, and concentration loss terms rather than by individual parameters in isolation. As a result, strict structural identifiability of all parameters cannot always be guaranteed. In this study, practical identifiability is emphasized by constraining all parameters within physically meaningful bounds reported in the literature and by fitting the model over a wide operating current range. This approach reduces ambiguity among correlated parameters and improves the robustness of the estimated values. Furthermore, repeated independent optimization runs yield consistent parameter sets with low variance, indicating stable convergence and reliable parameter estimation for engineering, modeling, control, and diagnostic applications.
Recently, a significant number of researchers have employed metaheuristic techniques for extracting the PEMFC model’s unidentified parameters, owing to major improvements in artificial intelligence–based methodologies. Metaheuristic techniques are the most effective and reliable methods for estimating PEMFC parameters, as this task is treated as an optimization problem [3,4]. The Flower Pollination Optimizer (FPO) [5] benefited from Lévy flight-based global search, which enhanced its ability to escape local optima during PEMFC parameter extraction. Despite this advantage, FPO may show high variability across runs, requiring multiple executions to ensure consistent parameter identification. Moreover, the whale optimization algorithm (WOA) [6] is easy to implement and performs well in capturing the nonlinear voltage–current characteristics of PEMFC models. Nevertheless, the WOA tends to suffer from premature convergence, particularly when estimating multiple highly correlated PEMFC parameters, which can lead to suboptimal solutions. The Grey Wolf Optimizer (GWO) [7] has been widely adopted for PEMFC parameter estimation because of its simple structure and fast convergence in early iterations. Nonetheless, the GWO may experience loss of population diversity during later stages, increasing the risk of stagnation near local optima. In [8], novel deep reinforcement learning was developed to reduce the operating costs of fuel cell hybrid electric buses (FCHEB), taking into consideration a predictive energy management strategy (PEMS) to enhance its optimization capability and driving condition adaptability.
The Bonobo Optimizer (BO) [9] exhibits strong global exploration capability, enabling it to identify feasible PEMFC parameter sets with acceptable accuracy. However, the BO often requires a relatively large population and many iterations to converge, resulting in increased computational cost and slower convergence for complex PEMFC stacks. The Slime Mould Optimizer (SMO) [10] has adaptively balanced exploration and exploitation, allowing it to handle the nonlinear and multimodal nature of PEMFC parameter estimation effectively. On the other hand, the SMO often requires a large number of fitness evaluations, increasing computational complexity. The grasshopper optimization algorithm (GOA) [11] has demonstrated strong global search ability and competitive estimation accuracy for PEMFC models. However, its performance is sensitive to control parameters, and improper tuning may degrade convergence speed and estimation reliability. The Shark Smell Optimizer (SSO) [12] has achieved high precision in PEMFC parameter extraction due to its gradient-inspired search mechanism. However, the SSO may struggle in highly multimodal search spaces and is sensitive to step-size parameters, which can affect stability and robustness.
The Jellyfish Search Optimizer (JSO) [13] incorporates adaptive movement strategies that enhance convergence stability in PEMFC parameter extraction problems. However, the JSO has exhibited oscillatory behavior near the optimal solution, which can limit fine local refinement of PEMFC parameters. The Manta Ray Foraging Optimizer (MRFO) [14] effectively balances exploration and exploitation, producing accurate PEMFC parameter estimates. Its limitation lies in relatively slow convergence during the final optimization stages, affecting overall efficiency. The chaotic Harris hawks optimizer (CHHO) [15] enhanced global exploration through chaotic dynamics, improving the accuracy of PEMFC parameter estimation. Nonetheless, the inclusion of chaos increases sensitivity to initial conditions and may reduce repeatability across independent runs. The Improved Artificial Ecosystem Optimizer (IAEO) [16] has enhanced solution accuracy and robustness in PEMFC parameter identification compared to its original version. Despite these improvements, the algorithm’s increased complexity leads to higher computational overhead. The Tree Growth Optimizer (TGO) [17] has provided stable convergence and reasonable estimation accuracy for PEMFC models. However, its limited diversification capability may restrict its effectiveness in highly multimodal parameter landscapes. In [18], an improved bald eagle search method is presented for investigating unknown values by reducing differences between measured and estimated data. The Coyote Optimization Algorithm (CO) [19] has leveraged social adaptation mechanisms to improve the robustness and consistency in PEMFC parameter extraction. However, CO often requires larger population sizes to achieve stable results, increasing computational time. The Pathfinder Optimizer (PFO) [20] has demonstrated good tracking capability and dynamic performance in PEMFC modeling. Despite this, it suffers from premature convergence when handling tightly coupled PEMFC parameters. The Black Widow Optimizer (BWO) [21] has shown strong exploitation capability, leading to competitive PEMFC parameter estimation accuracy. Its main drawback is the risk of rapid population reduction, which can lead to decreased diversity and suboptimal solutions. The Neural Network Optimizer (NNO) [22] effectively captured the nonlinear behavior of PEMFC systems and yielded accurate parameter estimation results. However, its training process was computationally intensive and highly dependent on parameter initialization.
Despite the benefits of self-adaptive nature optimizers, they require enhancements in areas such as convergence speed, time load, and statistical analysis. A new optimization technique called Mirage Search Optimization (MSO) is inspired by the physical phenomenon of mirages, in which light bends as a result of temperature-induced atmospheric refractive index gradients [23]. The superior mirage strategy and the inferior mirage strategy are two separate techniques that are derived from this idea. With its distinct inspiration from the physical occurrence of mirages, MSO sets itself apart from previous metaheuristic approaches. It integrates both superior and inferior mirage techniques to establish an evolving equilibrium between exploration and exploitation. In contrast to many algorithms that only use metaphors inspired by biology or society, MSO utilizes optical physics to guide search behavior, enabling agents to explore remote areas of the world and locally refine solutions in an organically adaptable manner. Its fitness-based influence and iteration-dependent agent distribution govern its dual-phase search mechanism, which improves convergence efficiency and prevents premature stagnation. MSO has been effectively used to solve engineering design and path-planning issues, and it is recognized for its ease of execution, speed of convergence, and simplicity. The following are the primary contributions of the paper:
- The use of MSO for defining fuel cell (FC) parameters is illustrated.
- The simulation results of the proposed MSO are compared with the following recent optimizers: the fungal growth optimizer [24], basketball team optimization (BTO) algorithm [25], the Differentiated Creative Search (DCS) [26]; the naked mole rat optimizer (NMRO) [27]; and the Educational Competition Optimizer (ECO) [28].
- The FC modules are tested with varying PH2/PO2 and temperature levels.
- The outcomes and statistical assessments demonstrate the MSO’s superiority compared with the experimental measures.
The remaining sections are arranged as follows: An optimal formulation of the dynamic model of PEMFC is presented in Section 2. Section 3 introduces the MSO for PEMFC, while the simulation results of the MSO when applied to the three PEMFC stacks are presented in Section 4. The key conclusions of this investigation are presented in Section 5.
2. Model of PEMFC
The I-V characteristics (polarization curves) can be mathematically displayed to form the PEMFC model. In this article, the steady-state performance of the PEMFC is described using the simplified electrochemical model proposed by Mann et al. [29]. This paradigm is widely employed in numerous literature analyses. The mathematical model for the output voltage of the PEMFCs stack (VStack) is illustrated in Equation (1), which comprises several series-connected cells (Ncells) [30,31,32].
where is the cell activation overpotential, is the Nernst voltage per cell, is the concentration overpotential, and is the cell ohmic voltage drop. The voltage can be calculated using (2) under a reference temperature of 25 °C. Thus, these three voltage drop amounts are provided as depicted in Equations (3)–(5) [33].
where
where
where and illustrate the regulating pressures of oxygen (O2) (atm) and hydrogen (H2), respectively, while represents the working temperature of the FC (K). Moreover, manifests the concentration of O2 (mol/cm3), MA signifies the membrane area (cm), whereas is the operating current (A) and ξ1 − ξ4 characterize semi-empirical coefficients [34,35]. In addition, l is the membrane thickness (cm), while Rc and Rm reveal the leads and the membrane ohmic resistances (Ω), respectively. In addition to this, demonstrates the membrane resistivity (Ω·cm), β is bounded within an empirical range, and λ is treated as a changeable parameter, while Jmax and J describe the maximum and actual thermal current densities (A/cm2), respectively [11,34].
where F, , and α represent Faraday’s ideal gas constants and the charge transfer coefficient, respectively. A deep look into (6) and (7) reveals that the concentration voltage drop can be replaced with the actual current density and temperature in a linear relationship.
Concentration polarization voltage is predicted to rise with higher current densities and higher cell temperatures [29,31]. To create an appropriate representation of the PEMFC, seven parameters are typically estimated.
The PEMFC’s considerable nonlinear properties and many unknown parameters make precise modeling difficult owing to a lack of manufacturing details. For the model to be accurate, seven crucial parameters must be determined. The summation of the squared error (SSE) that exists between the computed and experimental PEMFC voltages constitutes the model’s figure of significance. This definition frames the parameter estimation as a non-convex optimization problem that depends on SSE minimization as the objective function (FCF), as written in Equation (9) [11,36].
Therefore, the seven undetermined parameters (λ, ξ1 − ξ4, Rc, and β) are optimized using the proposed MSO to achieve the optimal SSE value.
3. MSO for Extraction of PEMFC Parameters
MSO optimizes a target objective function by simulating the trajectory of mirage light rays. The superior mirage strategy and the inferior mirage strategy are two techniques used to update the location of each search agent, which is a possible solution in the search space. These two tactics guide the search process toward the global optimum.
3.1. Step 1: Initialization
Every search agent Zyi (a potential solution) is started arbitrarily while staying inside the limits of the design parameters:
where i = 1, 2, …; Nx represents the index of the agent; LLd and HLd are the lowest and highest limits of dimension d; and d stands for the number of variables.
where Ny designates the population size, while R1 is a random number.
The objective function Mi is assessed for every search agent in the manner described below:
The solution vector linked to the lowest fitness score is then extracted, and the best solution is saved.
where ZyBest stands for the best solution discovered.
3.2. Step 2: Superior Mirage Strategy (SMS)
A subgroup of agents employs this stage, which is referred to as global exploration, to investigate distant regions early in the optimization process. First, the following formula is used to determine the number of agents (nSMS) employing this strategy:
where the current and maximum iterations are IT and ITmx. In addition, fewer agents conduct international investigations as IT iterations increase.
Next, the fitness-based influence factor is calculated as follows:
where ε is a tiny constant designed to prevent division by zero and is set to 10−8, while R2 represents an arbitrary number.
Consequently, the following is an update to the agent’s location:
where R1 is a vector of regularly distributed random variables, while R3 and R4 represent arbitrary numbers with a uniform distribution. This formula mimics agents recognizing distant optima and leaping in their direction.
3.3. Step 3: Inferior Mirage Strategy
This step is an example of local exploitation, as the surviving agents develop solutions in close proximity to potential locations. The fitness-based influence factor for this goal is calculated using the following method:
where R5 stands for a random number in this case. Agents who are more fit are encouraged to move more accurately by this aspect. Therefore, the following is an update to the agent’s position:
where R2 represents a vector of regularly distributed random variables, while R6 and R7 are random numbers with a uniform distribution.
This update permits some local heterogeneity while guiding individuals in the direction of the optimal solution.
3.4. Step 4: Boundary Control
The variables being controlled are guaranteed to remain within the following boundaries following updates:
This preserves all elements within a legitimate domain.
Each agent (i)’s objective function M_Newi is assessed for the new search agent (Zy_Newi) in the manner described below.
This choice can be modified as follows if the new fitness level surpasses the previous one:
Additionally, if needed, the global best is updated.
Until the maximum number of iterations is reached, steps 2–4 are repeated in the MSO. The best possible solution (ZyBest) and its matching objective value (MBest) will be provided at the final stage of the optimization.
Thus, the main steps for identifying the undetermined parameters of the FC in the proposed MSO are shown in Figure 1.
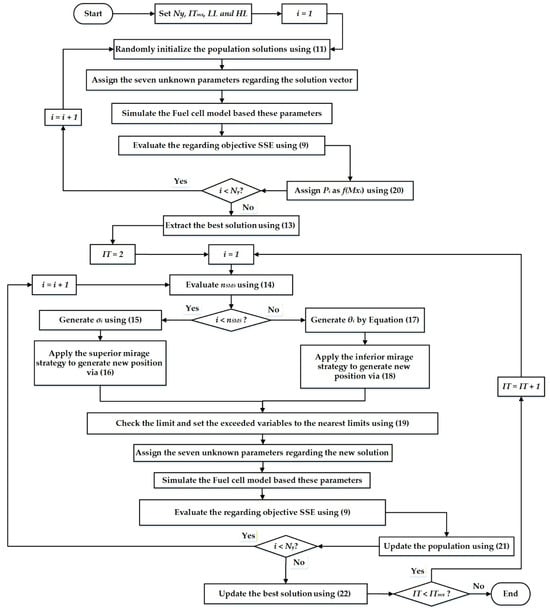
Figure 1.
Flowchart of the developed MSO.
The proportion of individuals participating in the superior mirage strategy is gradually reduced as iterations progress, allowing extensive exploration in the early stages and more stable exploitation in later stages. Empirical observations show that higher early participation improves convergence speed by promoting diversity, while reduced participation near convergence limits oscillations and enhances solution stability. The smooth convergence curves and low standard deviation of the final solutions across repeated runs confirm that the adopted proportional variation achieves a robust balance between convergence acceleration and stability.
4. Simulation Results
Three cases of typical commercial PEMFC stacks, namely the Ballard Mark V 5 kW, BCS 500 W, and Modular SR-12 PEM generators, are illustrated in this study to manifest the performance of the proposed MSO to obtain parameter extraction of FCs. Table 1 presents the datasheet of the various FCs. Meanwhile, Table 2 tabulates the upper and lower boundaries of the seven unknown parameters. These bounds are primarily derived from empirical ranges and physical constraints documented in the PEMFC literature, reflecting realistic operating conditions and material properties of the fuel cell stack. In addition, the selected limits also contribute to numerical stability during the optimization process by preventing non-physical or ill-conditioned solutions. This clarification has now been explicitly stated in the text accompanying Table 1 to improve transparency and reproducibility.

Table 1.
The datasheet of the various FCs.
Table 2.
The upper and lower boundaries of the seven unknown parameters.
The fitness function under a set of realistic constraints is defined as SSE. The population sizes for MSO, ECO, BTO, FGO, and NMRO are each set to 30. The high randomness of the metaheuristics is widely recognized. To verify the accuracy, as determined by the following metrics—mean absolute error (MAE), root mean square error (RMSE), and standard deviation (STD—the minimum SSE results shown are obtained over 55 independent executions.
4.1. BCS 500 W PEMFC Stacks
This stack comprises 32 cells, with a maximum current density of 0.469 A/cm2 and a rated power of 500 W [37]. As shown in Table 3, the MSO identifies the stack parameters that yield the optimal performance for this PEMFC model. To illustrate, the MSO achieved a small value of SSE of 1.16978 × 10⁻², which is lower than the ECO, BTO, FGO, and NMRO, with SSE values of 1.170530 × 10⁻², 1.17282 × 10⁻², 1.24770 × 10⁻², and 1.31393 × 10⁻², respectively. Additionally, other newly reported techniques are compared with the MSO to illustrate the robustness of the proposed MSO. The newly reported techniques are the shuffled frog-leaping algorithm (SFLA) [34], the grasshopper optimization algorithm (GOA) [16], an improved algorithm based on the heap-based optimizer IHBO [38], the firefly optimization algorithm (FOA) [34], the imperialist competitive algorithm (ICA) [34], Harris hawks’ optimization (HHO) [39], atom search optimization (ASO) techniques [39], the ant lion optimizer (ALO) [16], the whale optimization algorithm (WOA) [6], the moth-fame optimizer (MFO) [40], the multi-verse optimizer (MVO) [16], the salp swarm optimizer (SSO) [36], the equilibrium optimizer (EO) [38], the sine tree-seed algorithm (STSA) [38], the salp swarm algorithm (SSA) [41], the fractional-order modified Harris hawks optimizer (FMHHO) [42], the modified Harris hawks optimizer (MHHO) [42], the Harris hawks optimizer (HHO) [42], the vortex search algorithm and differential evolution (VSDE) [43], the vortex search algorithm (VSA) [43], and the manta rays foraging optimizer (MRFO) [38]. It can be observed that the MSO outperforms the reported and newly developed techniques in terms of SSE.
Table 3.
Parameters extracted using the proposed MSO and compared with those extracted using the reported optimizers for the BCS500W Stack.
A statistical comparison of diverse techniques is presented in Table 4 to evaluate the performance of the proposed MSO. Table 4 presents a comparison of the performance of the proposed MSO against a variety of state-of-the-art optimizers for estimating the parameters of the BCS500W fuel cell stack. The techniques are AEO [44], GOA [16], IHBO [38], FOA [34], HHO [39], ASO [39], ALO [16], WOA [6], MFO [40], MVO [16], SSO [36], EO [38], STSA [38], MRFO [38], SSA [41], FMHHO [42], MHHO [42], and HHO [42]. The comparison is based on four key statistical indicators: the best, mean, worst, and standard deviation (STD) values of the objective function over multiple independent runs. The results clearly demonstrate that MSO achieves one of the lowest SSE values (1.16978 × 10⁻²), which is equal to or superior to those of AEO, SCE, ELBA, and SMS. Furthermore, MSO exhibits a very small variation across runs, with a STD of 1.29501 × 10⁻⁵, indicating strong convergence stability and high robustness. In contrast, several well-known methods, such as WOA, MRFO, MHHO, and GOA, show significantly higher worst-case errors and large standard deviations, reflecting performance instability and sensitivity to initial conditions. Additionally, methods such as ECO, FGO, and NMRO exhibit large mean and worst values, suggesting weaker exploitation capability and slower convergence. Overall, the results confirm that MSO provides a well-balanced exploration–exploitation trade-off, achieves high solution precision, and maintains consistent reliability, outperforming most competing techniques in both accuracy and stability for the BCS500W stack modeling problem.
Table 4.
Statistical analysis between the proposed MSO and the reported optimizers for the BCS500W Stack.
For the BCS-500 W fuel cell case study, non-parametric statistical analysis, including the Wilcoxon rank-sum test, Friedman test, and Cliff’s delta effect size analysis, were applied, as shown in Table 5, Table 6 and Table 7. The Wilcoxon rank-sum test yielded extremely small p-values (p ≪ 0.05) for all pairwise comparisons between MSO and BTO, ECO, NMRO, and FGO, even after Bonferroni adjustment. The Friedman test also revealed a highly significant overall difference among the algorithms (p = 5.264 × 10−36), with MSO consistently achieving the lowest average rank. Moreover, Cliff’s delta analysis reported very large effect sizes (|δ| ≥ 0.991), with values approaching −1, indicating near-complete dominance of MSO. These results confirm the robustness, reliability, and decisive performance advantage of MSO for PEMFC parameter estimation.
Table 5.
Wilcoxon rank-sum (pairwise) for BCS500 PEMFC.
Table 6.
Friedman test for BCS-500 W PEMFC.
Table 7.
Statistical comparison results for BCS-500 W PEMFC.
Fifty-five independent runs were conducted with the relative optimum SSE value for the MSO, as illustrated in Figure 2. MSO outperformed the recently developed techniques ECO, BTO, FGO, and NMRO.
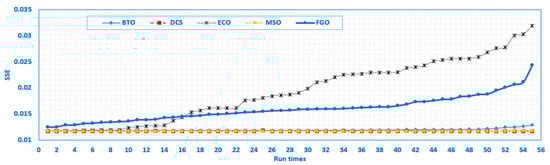
Figure 2.
Fifty-five run times for the MSO and the recently developed techniques for the BCS500W Stack.
The convergence characteristics of the MSO are shown in Figure 3. As illustrated, the proposed MSO has the ability to attain the minimum SEE value of 0.011697781 in fewer than 73 iterations, outperforming ECO, BTO, FGO, and NMRO.
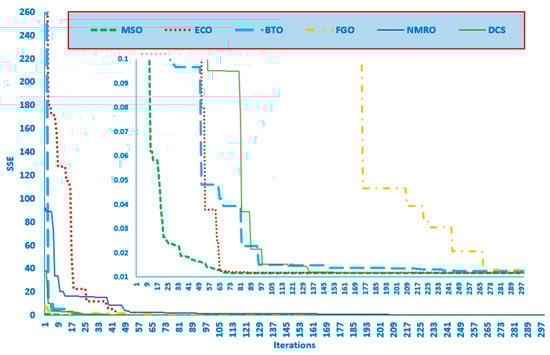
Figure 3.
The convergence rate for the MSO and the recently developed techniques for the BCS500W Stack.
The comparison between the simulated and experimental performance presented in Table 8 shows strong agreement across the entire operating range. The absolute error in voltage remained very small (0.0022 to 0.0146 V), corresponding to less than 0.07% VAE, indicating an accurate reproduction of the I–V curve. Similarly, the absolute error in output power was consistently low (0.0017 to 0.2319 W), with PAE values below 0.07%. These results confirm that the proposed model effectively captures the electrical behavior of the PV module, with high precision and stability across different operating points.
Table 8.
Simulated and experimental voltage and power, along with the percentage of individual absolute errors, for the BCS500W Stack.
Figure 4 and Figure 5 show the simulated and experimental stack power points and voltage points, respectively, versus the stack current of the BCS500W Stack obtained by the MSO. Excellent fitting among the simulated and measured V/I and P/I curves of 18 of the BCS500W Stack is illustrated in Figure 4 and Figure 5, respectively. The outcomes demonstrate that the MSO-based modeling closely matches the experimental data, demonstrating the accuracy with which MSO predicts power and current across a variety of voltage ranges.
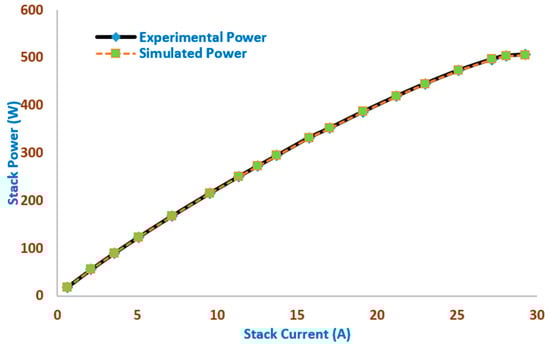
Figure 4.
The simulated and experimental stack power points versus stack current of the BCS500W Stack obtained by the MSO.
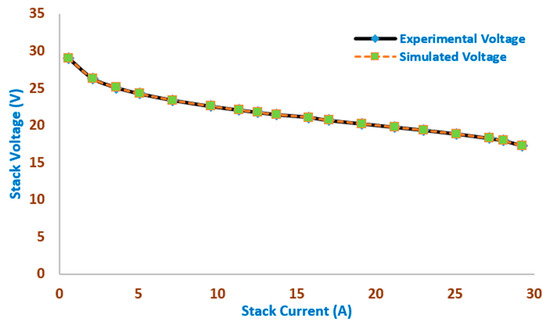
Figure 5.
The simulated and experimental stack voltage points versus the stack current of the BCS500W Stack obtained by the MSO.
4.2. Modular SR-12
The parameter extraction approaches are well validated using the Modular SR-12 PEMFC [38]. It was employed to verify the effectiveness of the parameter extraction approach based on the MSO. As described in Table 9, the MSO identified the optimal parameters of the stack that achieved the best values for this PEMFC model. To illustrate, the MSO achieved a small value of SSE of 1.42100 × 10⁻⁴, which is lower than those of ECO, BTO, and FGO, which achieved SSE values of 1.57500 × 10⁻⁴, 1.48159 × 10⁻⁴, and 1.70313 × 10⁻⁴, respectively. Additionally, other newly reported techniques were compared with the MSO to illustrate its robustness. The new reported techniques are AEO [44], SSA [41], SCE [44], MFO [40], STSA [38], EO [38], and FPA [5]. The MSO outperformed the reported technique and the newly developed techniques in this paper in terms of SSE. The findings presented above validate the efficiency of the parameter extraction method of the established MSO-based PEMFC model.
Table 9.
Parameters extracted using the proposed MSO and compared with those obtained using the reported optimizers for the Modular SR-12 stack.
A statistical comparison of diverse techniques to evaluate the performance of the proposed MSO is presented in Table 10. Table 10 presents the comparative performance of the proposed MSO against a variety of state-of-the-art optimizers for estimating the parameters of the BCS500W fuel cell stack. The techniques are SSA [41], FPA [5], EO [38], WOA [6], MRFO [38], STSA [38], and MFO [40]. The comparison is based on four key statistical indicators: best, mean, worst, and STD values of the objective function over multiple independent runs. The results clearly demonstrate that MSO achieves one of the lowest SSE values (1.42100 × 10⁻⁴), which is equal to or superior to those shown in Table 10. Furthermore, MSO exhibits very little variation across runs, with a STD of 1.15177 × 10⁻⁵, indicating strong convergence stability and high robustness. In contrast, several well-known methods, such as WOA, MRFO, STSA, SSA, FPA, and EO, show significantly higher worst-case errors and large standard deviations, reflecting performance instability and sensitivity to initial conditions. Additionally, methods such as ECO, FGO, and NMRO exhibit large mean and worst values, suggesting weaker exploitation capability and slower convergence. The results confirm that MSO provides a well-balanced exploration–exploitation trade-off, achieves high solution precision, and maintains consistent reliability, outperforming most competing techniques in both accuracy and stability for the BCS500W stack modeling problem.
Table 10.
Statistical analysis between the proposed MSO and the reported optimizers for the Modular SR-12 stack.
For the SR-12 fuel cell case study, rigorous non-parametric statistical tests were conducted to validate the superiority of the proposed MSO. The Wilcoxon rank-sum test was applied as shown in Table 11, which revealed extremely small p-values (p ≪ 0.05) for all pairwise comparisons between MSO and BTO, ECO, NMRO, and FGO. Furthermore, the Friedman test was applied, as shown in Table 12, which indicates a highly significant overall difference among all algorithms (p = 4.605 × 10−38), with MSO consistently achieving the top rank. In addition, Cliff’s delta effect size analysis was applied, as shown in Table 13, which yielded very large effect magnitudes (|δ| ≥ 0.945), with values approaching −1, indicating near-complete dominance of MSO over all competing optimizers. These findings are observed even after Bonferroni adjustment, confirming the statistically significant performance improvements. These results collectively demonstrate the robustness, reliability, and decisive superiority of the proposed MSO for PEM fuel cell parameter estimation.
Table 11.
Wilcoxon rank-sum (pairwise) for SR-12 PEMFC.
Table 12.
Friedman test for SR-12 PEMFC.
Table 13.
Statistical comparison results for SR-12 PEMFC.
Table 14 presents a detailed comparison between the experimental and simulated electrical characteristics of the SR_12 Module Stack, including voltage, power, and their corresponding percentage absolute errors. Across all 20 operating points, the simulated voltages and powers produced by the proposed model closely follow the experimental data, demonstrating the high accuracy and reliability of the modeling process. The percentage voltage absolute error (%VAE) and the percentage power absolute error (%PAE) remain extremely low—mostly below 0.01%—indicating excellent agreement between the measured and predicted values. This low level of error across the entire current range confirms the robustness of the proposed method in accurately estimating the voltage–current behavior and power output of the SR_12 stack under varying operating conditions. These results further validate the capability of the optimization algorithm to acheive precise parameter identification and high-fidelity simulation performance.
Table 14.
Simulated and experimental voltage and power, along with the percentage of individual absolute errors, for the SR_12 Module Stack.
The convergence characteristics of the MSO are denoted in Figure 6. It is illustrated that the proposed MSO is capable of attaining the minimum SSE value of 1.42100 × 10⁻⁴ in fewer than 81 iterations, compared with ECO, BTO, FGO, and DCS.
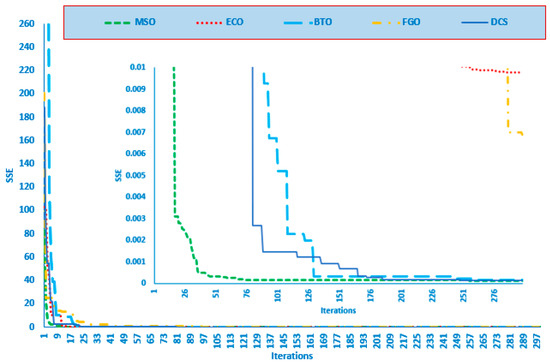
Figure 6.
The convergence rate for the MSO and the recently developed techniques for the SR_12 Module Stack.
Fifty-five independent runs were conducted with the relative optimum SSE value for the MSO, as illustrated in Figure 7. As shown, the MSO outperformed the recently developed techniques, namely ECO, BTO, and FGO.
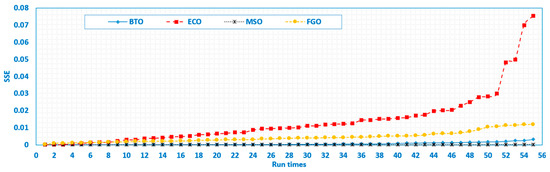
Figure 7.
Fifty-five run times for the MSO and the recently developed techniques for the SR_12 Module Stack.
Figure 8 and Figure 9 represent the simulated and experimental stack power points and voltage points, respectively, versus the stack current of the SR_12 Module Stack obtained by the MSO. Excellent fitting among the simulated and measured V/I and P/I curves of 18 of the SR_12 Module Stack is illustrated in Figure 8 and Figure 9, respectively. The outcomes demonstrate that the MSO-based modeling closely matches the experimental data, demonstrating the accuracy with which MSO predicts power and current across a variety of voltage ranges.
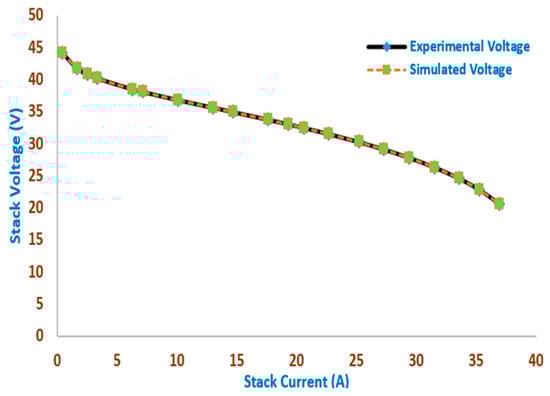
Figure 8.
The simulated and experimental stack voltage points versus the stack current of the SR_12 Module Stack obtained by the MSO.
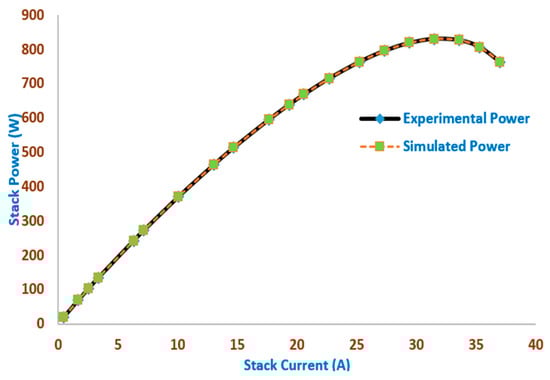
Figure 9.
Simulated and experimental stack power points versus stack current for the SR_12 Module Stack obtained by MSO.
4.3. Ballard Mark V
The Ballard Mark V fuel cell system with a 5 kW rated capacity is utilized, and the datasheet for the device is gathered from Reference [14]. Table 15 displays the optimal values of the generated PEMFC model using MSO-based parameter extraction. This is employed to verify the effectiveness of the parameter extraction approach based on MSO. As described in Table 15, the MSO identifies the optimal parameters of the stack that achieve the best values for this PEMFC model. To illustrate, the MSO achieved a small value of SSE of 0.852056, which was lower than those achieved by ECO, BTO, and DCS, which were 0.852058, 0.852475, and 0.852063, respectively. Additionally, other new reported techniques were compared with the MSO to illustrate the robustness of the proposed MSO. The newly reported techniques are the artificial ecosystem-based optimizer (AEO) [44], the neural network algorithm (NNA) [22], the flower pollination algorithm FPA [5], the enhanced Levy flight bat algorithm (ELBA) [44], the whale optimization algorithm (WOA) [6], the chaotic grasshopper optimization algorithm (CGOA) [41], shuffled complex evolution (SCE) [44], GHO [39], the grass fibrous root optimization algorithm (GRA) [41], the improved chimp optimization algorithm (ICHOA1) [46], marine predators and political optimizers (MPA) [47], and the artificial bee colony differential evolution optimizer (ABCDE) [44]. The results indicate that the MSO outperformed the reported techniques and the newly developed techniques in this paper in terms of SSE. The findings presented above validate the efficiency of the parameter extraction method of the established MSO-based PEMFC model.
Table 15.
Parameters extracted using the proposed MSO and compared with those obtained using the reported optimizers for the Ballard Mark V.
A statistical comparison of diverse techniques to evaluate the performance of the proposed MSO is shown in Table 16. Table 16 presents the comparative performance of the proposed MSO against a variety of state-of-the-art optimizers for parameter estimation of the BCS500W fuel cell stack. The techniques are ABCDE [44], ICHOA1 [46], AEO [44], FPA [5], SCE [44], ELBA [44], MPA [47], and WOA [6]. The comparison is based on four key statistical indicators: best, mean, worst, and STD values of the objective function over multiple independent runs. The results clearly demonstrate that MSO achieves one of the lowest SSE values (0.852056), which is equal to or superior to those shown in Table 16. Furthermore, MSO exhibits very little variation across runs, with a STD of 6.77 × 10⁻¹⁴, indicating strong convergence stability and high robustness. In contrast, several well-known methods, such as ABCDE [44], ICHOA1 [46], AEO [44], FPA [5], SCE [44], ELBA [44], MPA [47], and WOA [6], show significantly higher worst-case errors and large standard deviations, reflecting performance instability and sensitivity to initial conditions. Additionally, methods such as ECO, DCS, and BTO exhibit large mean and worst values, suggesting weaker exploitation capability and slower convergence. To illustrate, the results confirm that MSO provides a well-balanced exploration–exploitation trade-off, achieves high solution precision, and maintains consistent reliability, outperforming most competing techniques in both accuracy and stability for the Ballard Mark V stack modeling problem.
Table 16.
Statistical analysis comparing the proposed MSO with reported optimizers for the Ballard Mark V.
The convergence characteristics of the MSO are shown in Figure 10. The results illustrate that the proposed MSO achieved the minimum SEE of 0.852056 in fewer than 30 iterations, outperforming ECO, BTO, and DCS.
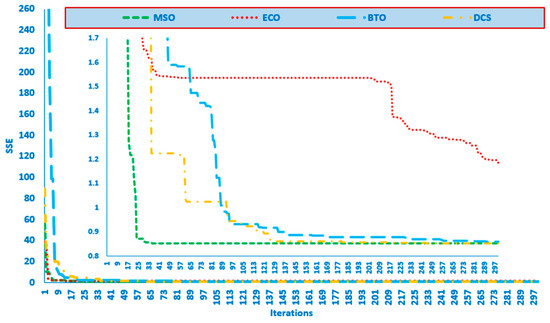
Figure 10.
The convergence rate for the MSO and the recently developed techniques for the Ballard Mark V Stack.
Fifty-five independent runs were conducted with the relative optimum SSE value for the MSO, as illustrated in Figure 11. The results show that the MSO outperformed the recently developed techniques, namely ECO, BTO, and FGO.
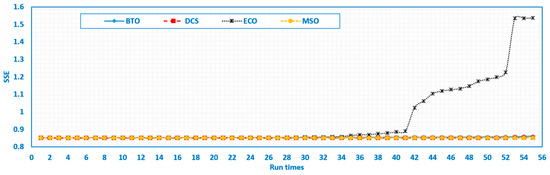
Figure 11.
Fifty-five run times for the MSO and the recently developed techniques for the Ballard Mark V Stack.
Table 17 presents a detailed comparison between the experimental and simulated electrical characteristics of the Ballard Mark V Stack, including voltage, power, and their corresponding percentage absolute errors. Across all 13 operating points, the simulated voltages and powers produced by the proposed model closely follow the experimental data, demonstrating the high accuracy and reliability of the modeling process. These results further validate the capability of the optimization algorithm to acheive precise parameter identification and high-fidelity simulation performance.
Table 17.
Simulated and experimental voltage and power, along with the percentage of individual absolute errors, for the Ballard Mark V Stack.
Figure 12 and Figure 13 represent the simulated and experimental stack power points and voltage points, respectively, versus the stack current of the Ballard Mark V Stack obtained by the MSO. Excellent fitting among the simulated and measured V/I and P/I curves of 13 of the SR_12 Module Stack is illustrated in Figure 12 and Figure 13, respectively. The outcomes demonstrate that the MSO-based modeling closely matches the experimental data, demonstrating the accuracy with which MSO predicts power and current across a variety of voltage ranges.
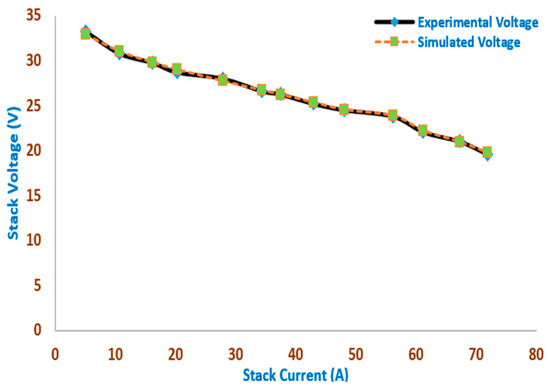
Figure 12.
The simulated and experimental stack voltage points versus the stack current of the Ballard Mark V Stack obtained by the MSO.
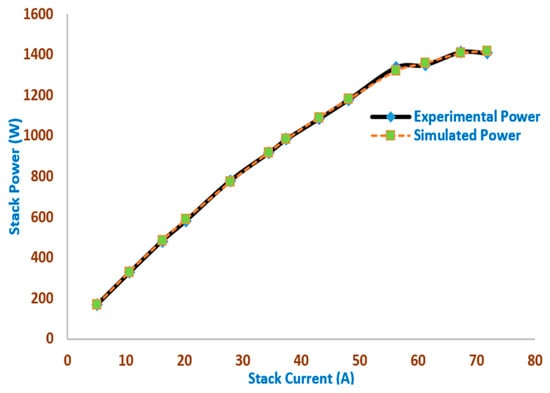
Figure 13.
The simulated and experimental stack power points versus the stack current of the Ballard Mark V Stack obtained by the MSO.
5. Conclusions
In this paper, a novel MSO is proposed to effectively extract the PEMFC model’s unidentified parameters. The final objective was to create a precise PEMFC model that delivers accurate FC simulation and modeling results. This is necessary because in the manufacturer’s datasheets, there are a number of unknown parameters. The total squared error between the measured and output voltages model the FC issue that is being optimized. The fitness function is directly minimized using the MSO while adhering to the limits of the issue. By contrasting the numerical model results with the experimental findings of the three commercial PEMFC stacks under study, the suggested MSO’s effectiveness is assessed. For each case study, the simulated results match the experimental findings. Additionally, the MSO results are compared with those from other optimization techniques, demonstrating that the MSO offers a more precise assessment of the PEMFC model. This leads to the MSO-based model having a significant advantage over the other optimization method-based models in the literature.Future work can extend the application of the proposed MSO beyond PEMFC parameter identification to a wider range of power system and energy-related problems [48,49]. In particular, MSO can be employed for parameter estimation and control tuning in renewable energy systems such as photovoltaic arrays [50], wind energy conversion systems [51], batteries [52], electric vehicles [53], and hybrid microgrids, where accurate modeling is essential for reliable operation. Moreover, its strong optimization capability makes it a promising tool for solving optimal power flow [54], economic dispatch [55], unit commitment, and energy management problems [56,57] in modern power systems with high penetration of renewables and energy storage.
Author Contributions
Conceptualization, G.M.; methodology, B.M.A.F. and S.H.H.; validation, B.M.A.F. and S.H.H.; formal analysis, G.M.; investigation, H.A.; resources, H.A.; data curation, H.A. and S.H.H.; writing—original draft, S.H.H. and G.M.; writing—review and editing, B.M.A.F.; visualization, B.M.A.F.; supervision, G.M.; project administration, H.A.; funding acquisition, H.A., B.M.A.F., S.H.H. and G.M. All authors have read and agreed to the published version of the manuscript.
Funding
Deanship of Graduate Studies and Scientific Research, Jazan University, Saudi Arabia.
Data Availability Statement
The original contributions presented in this study are included in the article. Further inquiries can be directed to the corresponding author.
Acknowledgments
The authors gratefully acknowledge the funding of the Deanship of Graduate Studies and Scientific Research, Jazan University, Saudi Arabia, through Project No. JU-20250234-DGSSR-RP-2025.
Conflicts of Interest
The authors declare no competing interests.
References
- Priya, K.; Sathishkumar, K.; Rajasekar, N. A comprehensive review on parameter estimation techniques for Proton Exchange Membrane fuel cell modelling. Renew. Sustain. Energy Rev. 2018, 93, 121–144. [Google Scholar] [CrossRef]
- Kandidayeni, M.; Macias, A.; Amamou, A.; Boulon, L.; Kelouwani, S.; Chaoui, H. Overview and benchmark analysis of fuel cell parameters estimation for energy management purposes. J. Power Sources 2018, 380, 92–104. [Google Scholar] [CrossRef]
- Yang, B.; Wang, J.; Yu, L.; Shu, H.; Yu, T.; Zhang, X.; Yao, W.; Sun, L. A critical survey on proton exchange membrane fuel cell parameter estimation using meta-heuristic algorithms. J. Clean. Prod. 2020, 265, 121660. [Google Scholar] [CrossRef]
- Ohenoja, M.; Leiviskä, K. Observations on the Parameter Estimation Problem of Polymer Electrolyte Membrane Fuel Cell Polarization Curves. Fuel Cells 2020, 20, 516–526. [Google Scholar] [CrossRef]
- Priya, K.; Rajasekar, N. Application of flower pollination algorithm for enhanced proton exchange membrane fuel cell modelling. Int. J. Hydrogen Energy 2019, 44, 18438–18449. [Google Scholar] [CrossRef]
- El-Fergany, A.A.; Hasanien, H.M.; Agwa, A.M. Semi-empirical PEM fuel cells model using whale optimization algorithm. Energy Convers. Manag. 2019, 201, 112197. [Google Scholar] [CrossRef]
- Ali, M.; El-Hameed, M.; Farahat, M. Effective parameters’ identification for polymer electrolyte membrane fuel cell models using grey wolf optimizer. Renew. Energy 2017, 111, 455–462. [Google Scholar] [CrossRef]
- Jia, C.; He, H.; Zhou, J.; Li, J.; Wei, Z.; Li, K.; Li, M. A novel deep reinforcement learning-based predictive energy management for fuel cell buses integrating speed and passenger prediction. Int. J. Hydrogen Energy 2025, 100, 456–465. [Google Scholar] [CrossRef]
- Sultan, H.M.; Menesy, A.S.; Kamel, S.; Tostado-Veliz, M.; Jurado, F. Parameter Identification of Proton Exchange Membrane Fuel Cell Stacks Using Bonobo Optimizer. In Proceedings of the 2020 IEEE International Conference on Environment and Electrical Engineering and 2020 IEEE Industrial and Commercial Power Systems Europe, EEEIC/I and CPS Europe 2020, Madrid, Spain, 9–12 June 2020. [Google Scholar] [CrossRef]
- Gupta, J.; Nijhawan, P.; Ganguli, S. Optimal parameter estimation of PEM fuel cell using slime mould algorithm. Int. J. Energy Res. 2021, 45, 14732–14744. [Google Scholar] [CrossRef]
- El-Fergany, A.A. Electrical characterisation of proton exchange membrane fuel cells stack using grasshopper optimiser. IET Renew. Power Gener. 2018, 12, 9–17. [Google Scholar] [CrossRef]
- Rao, Y.; Shao, Z.; Ahangarnejad, A.H.; Gholamalizadeh, E.; Sobhani, B. Shark Smell Optimizer applied to identify the optimal parameters of the proton exchange membrane fuel cell model. Energy Convers. Manag. 2019, 182, 1–8. [Google Scholar] [CrossRef]
- Gouda, E.A.; Kotb, M.F.; El-Fergany, A.A. Jellyfish search algorithm for extracting unknown parameters of PEM fuel cell models: Steady-state performance and analysis. Energy 2021, 221, 119836. [Google Scholar] [CrossRef]
- Selem, S.I.; Hasanien, H.M.; El-Fergany, A.A. Parameters extraction of PEMFC’s model using manta rays foraging optimizer. Int. J. Energy Res. 2020, 44, 4629–4640. [Google Scholar] [CrossRef]
- Menesy, A.S.; Sultan, H.M.; Selim, A.; Ashmawy, M.G.; Kamel, S. Developing and Applying Chaotic Harris Hawks Optimization Technique for Extracting Parameters of Several Proton Exchange Membrane Fuel Cell Stacks. IEEE Access 2020, 8, 1146–1159. [Google Scholar] [CrossRef]
- Rizk-Allah, R.M.; El-Fergany, A.A. Artificial ecosystem optimizer for parameters identification of proton exchange membrane fuel cells model. Int. J. Hydrogen Energy 2021, 46, 37612–37627. [Google Scholar] [CrossRef]
- Sultan, H.M.; Menesy, A.S.; Kamel, S.; Jurado, F. Tree Growth Algorithm for Parameter Identification of Proton Exchange Membrane Fuel Cell Models. Int. J. Interact. Multimed. Artif. Intell. 2020, 6, 101–111. [Google Scholar] [CrossRef]
- Alsaidan, I.; Shaheen, M.A.; Hasanien, H.M.; Alaraj, M.; Alnafisah, A.S. A PEMFC model optimization using the enhanced bald eagle algorithm. Ain Shams Eng. J. 2022, 13, 101749. [Google Scholar] [CrossRef]
- Sultan, H.M.; Menesy, A.S.; Kamel, S.; Jurado, F. Developing the coyote optimization algorithm for extracting parameters of proton-exchange membrane fuel cell models. Electr. Eng. 2021, 103, 563–577. [Google Scholar] [CrossRef]
- Gouda, E.A.; Kotb, M.F.; El-Fergany, A.A. Investigating dynamic performances of fuel cells using pathfinder algorithm. Energy Convers. Manag. 2021, 237, 114099. [Google Scholar] [CrossRef]
- Singla, M.K.; Nijhawan, P.; Oberoi, A.S. Parameter estimation of proton exchange membrane fuel cell using a novel meta-heuristic algorithm. Environ. Sci. Pollut. Res. 2021, 28, 34511–34526. [Google Scholar] [CrossRef]
- Fawzi, M.; El-Fergany, A.A.; Hasanien, H.M. Effective methodology based on neural network optimizer for extracting model parameters of PEM fuel cells. Int. J. Energy Res. 2019, 43, 8136–8147. [Google Scholar] [CrossRef]
- He, J.; Zhao, S.; Ding, J.; Wang, Y. Mirage search optimization: Application to path planning and engineering design problems. Adv. Eng. Softw. 2025, 203, 103883. [Google Scholar] [CrossRef]
- Abdel-Basset, M.; Mohamed, R.; Abouhawwash, M. Fungal growth optimizer: A novel nature-inspired metaheuristic algorithm for stochastic optimization. Comput. Methods Appl. Mech. Eng. 2025, 437, 117825. [Google Scholar] [CrossRef]
- Chen, Y.; Wang, G.; Yin, B.; Ma, C.; Wu, Z.; Gao, M. Basketball team optimization algorithm (BTOA): A novel sport-inspired meta-heuristic optimizer for engineering applications. Sci. Rep. 2025, 15, 21629. [Google Scholar] [CrossRef] [PubMed]
- Duankhan, P.; Sunat, K.; Chiewchanwattana, S.; Nasa-Ngium, P. The Differentiated Creative Search (DCS): Leveraging differentiated knowledge-acquisition and creative realism to address complex optimization problems. Expert Syst. Appl. 2024, 252, 123734. [Google Scholar] [CrossRef]
- Singh, S.; Mittal, N.; Nayyar, A.; Singh, U.; Singh, S. A hybrid transient search naked mole-rat optimizer for image seg-mentation using multilevel thresholding. Expert Syst. Appl. 2023, 213, 119021. [Google Scholar] [CrossRef]
- Lian, J.; Zhu, T.; Ma, L.; Wu, X.; Heidari, A.A.; Chen, Y.; Chen, H.; Hui, G. The educational competition optimizer. Int. J. Syst. Sci. 2024, 55, 3185–3222. [Google Scholar] [CrossRef]
- Mann, R.F.; Amphlett, J.C.; Hooper, M.A.I.; Jensen, H.M.; Peppley, B.A.; Roberge, P.R. Development and application of a generalised steady-state electrochemical model for a PEM fuel cell. J. Power Sources 2000, 86, 173–180. [Google Scholar] [CrossRef]
- Shaheen, A.; El-Sehiemy, R.; El-Fergany, A.; Ginidi, A. Fuel-cell parameter estimation based on improved gorilla troops technique. Sci. Rep. 2023, 13, 8685. [Google Scholar] [CrossRef]
- Saleh, I.M.M.; Ali, R.; Zhang, H. Simplified mathematical model of proton exchange membrane fuel cell based on horizon fuel cell stack. J. Mod. Power Syst. Clean Energy 2016, 4, 668–679. [Google Scholar] [CrossRef]
- Bhatia, S.K.; Joo, H.-S.; Yang, Y.-H. Biowaste-to-bioenergy using biological methods—A mini-review. Energy Convers. Manag. 2018, 177, 640–660. [Google Scholar] [CrossRef]
- Shaheen, A.M.; Alassaf, A.; Alsaleh, I.; El-Fergany, A.A. Enhancing model characterization of PEM Fuel cells with human memory optimizer including sensitivity and uncertainty analysis. Ain Shams Eng. J. 2024, 15, 103026. [Google Scholar] [CrossRef]
- Kandidayeni, M.; Macias, A.; Khalatbarisoltani, A.; Boulon, L.; Kelouwani, S. Benchmark of proton exchange membrane fuel cell parameters extraction with metaheuristic optimization algorithms. Energy 2019, 183, 912–925. [Google Scholar] [CrossRef]
- Shaheen, A.M.; Alassaf, A.; Alsaleh, I.; El-Fergany, A.A. Advancements in Model Parameter Estimation for Proton Ex-change Membrane Fuel Cells via Enhanced Artificial Hummingbird Algorithm. Int. J. Energy Res. 2024, 2024, 7616065. [Google Scholar] [CrossRef]
- El-Fergany, A.A. Extracting optimal parameters of PEM fuel cells using Salp Swarm Optimizer. Renew. Energy 2018, 119, 641–648. [Google Scholar] [CrossRef]
- Riad, A.J.; Hasanien, H.M.; Turky, R.A.; Yakout, A.H. Identifying the PEM Fuel Cell Parameters Using Artificial Rabbits Optimization Algorithm. Sustainability 2023, 15, 4625. [Google Scholar] [CrossRef]
- Abdel-Basset, M.; Mohamed, R.; Elhoseny, M.; Chakrabortty, R.K.; Ryan, M.J. An efficient heap-based optimization algo-rithm for parameters identification of proton exchange membrane fuel cells model: Analysis and case studies. Int. J. Hydrogen Energy 2021, 46, 11908–11925. [Google Scholar] [CrossRef]
- Mossa, M.A.; Kamel, O.M.; Sultan, H.M.; Diab, A.A.Z. Parameter estimation of PEMFC model based on Harris Hawks’ optimization and atom search optimization algorithms. Neural Comput. Appl. 2021, 33, 5555–5570. [Google Scholar] [CrossRef]
- Fathy, A.; Rezk, H.; Ramadan, H.S.M. Recent moth-flame optimizer for enhanced solid oxide fuel cell output power via optimal parameters extraction process. Energy 2020, 207, 118326. [Google Scholar] [CrossRef]
- Zhu, Y.; Yousefi, N. Optimal parameter identification of PEMFC stacks using Adaptive Sparrow Search Algorithm. Int. J. Hydrogen Energy 2021, 46, 9541–9552. [Google Scholar] [CrossRef]
- Yousri, D.; Mirjalili, S.; Machado, J.T.; Thanikanti, S.B.; Elbaksawi, O.; Fathy, A. Efficient fractional-order modified Harris hawks optimizer for proton exchange membrane fuel cell modeling. Eng. Appl. Artif. Intell. 2021, 100, 104193. [Google Scholar] [CrossRef]
- Fathy, A.; Elaziz, M.A.; Alharbi, A.G. A novel approach based on hybrid vortex search algorithm and differential evo-lution for identifying the optimal parameters of PEM fuel cell. Renew. Energy 2020, 146, 1833–1845. [Google Scholar] [CrossRef]
- Hachana, O.; El-Fergany, A.A. Efficient PEM fuel cells parameters identification using hybrid artificial bee colony dif-ferential evolution optimizer. Energy 2022, 250, 123830. [Google Scholar] [CrossRef]
- El-Hay, E.; El-Hameed, M.; El-Fergany, A. Optimized Parameters of SOFC for steady state and transient simu-lations using interior search algorithm. Energy 2019, 166, 451–461. [Google Scholar] [CrossRef]
- Abdel-Basset, M.; Mohamed, R.; El-Fergany, A.; Chakrabortty, R.K.; Ryan, M.J. Adaptive and efficient optimization model for optimal parameters of proton exchange membrane fuel cells: A comprehensive analysis. Energy 2021, 233, 121096. [Google Scholar] [CrossRef]
- Zaki Diab, A.A.; Tolba, M.A.; El-Magd, A.G.A.; Zaky, M.M.; El-Rifaie, A.M. Fuel cell parameters estimation via marine predators and political optimizers. IEEE Access 2020, 8, 166998–167018. [Google Scholar] [CrossRef]
- Aljumah, A.S.; Alqahtani, M.H.; Ginidi, A.R.; Shaheen, A.M. Combined heat and power dispatch with reserve constraints using a mutated trochoid searching optimizer. Electr. Power Syst. Res. 2026, 252, 112447. [Google Scholar] [CrossRef]
- Aljumah, A.S.; Alqahtani, M.H.; Ginidi, A.R.; Shaheen, A.M. A novel Kangaroo Escape Algorithm for efficient combined heat and power economic dispatch: Feasibility analysis and validations. Energy Rep. 2025, 14, 2535–2556. [Google Scholar] [CrossRef]
- Almutairi, S.Z.; Shaheen, A.M. A novel kangaroo escape optimizer for parameter estimation of solar photovoltaic cells/modules via one, two and three-diode equivalent circuit modeling. Sci. Rep. 2025, 15, 32669. [Google Scholar] [CrossRef]
- Chen, J.; Kim, M.-H. Review of Recent Offshore Wind Turbine Research and Optimization Methodologies in Their Design. J. Mar. Sci. Eng. 2022, 10, 28. [Google Scholar] [CrossRef]
- Shaheen, A.M.; Hamida, M.; Alassaf, A.; Alsaleh, I. Enhancing parameter identification and state of charge estimation of Li-ion batteries in electric vehicles using an improved marine predators algorithm. J. Energy Storage 2024, 84, 110982. [Google Scholar] [CrossRef]
- Shaheen, A.M.; Ellien, A.R.; El-Ela, A.A.; El-Rifaie, A.M. Electric vehicles with renewables integration in electrical power systems: A review of technologies, uncertainties and optimization allocations. Unconv. Resour. 2026, 9, 100252. [Google Scholar] [CrossRef]
- Alqahtani, M.H.; Almutairi, S.Z.; Shaheen, A.M.; Ginidi, A.R. Enhanced Kepler Optimization Method for Nonlinear Multi-Dimensional Optimal Power Flow. Axioms 2024, 13, 419. [Google Scholar] [CrossRef]
- Shaheen, A.M.; El-Rifaie, A.M.; Al Faiya, B.; Moustafa, G.; Alnami, H. Economic and environmental optimization-dispatch in large-scale power systems using weighted mean of vectors algorithm. Sustain. Comput. Inform. Syst. 2025, 48, 101265. [Google Scholar] [CrossRef]
- Su, W.; Wang, J. Energy Management Systems in Microgrid Operations. Electr. J. 2012, 25, 45–60. [Google Scholar] [CrossRef]
- Vera, Y.E.G.; Dufo-López, R.; Bernal-Agustín, J.L. Energy Management in Microgrids with Renewable Energy Sources: A Literature Review. Appl. Sci. 2019, 9, 3854. [Google Scholar] [CrossRef]
Disclaimer/Publisher’s Note: The statements, opinions and data contained in all publications are solely those of the individual author(s) and contributor(s) and not of MDPI and/or the editor(s). MDPI and/or the editor(s) disclaim responsibility for any injury to people or property resulting from any ideas, methods, instructions or products referred to in the content. |
© 2026 by the authors. Licensee MDPI, Basel, Switzerland. This article is an open access article distributed under the terms and conditions of the Creative Commons Attribution (CC BY) license.