Article

An Evolutionary Game-Theoretic Analysis of Dual-Channel Encroachment and Green Fulfillment in Platform-Based Supply Chains

by
Ali Ahsan
and
Yong He
*
School of Economics and Management, Southeast University, Nanjing 211189, China
*
Author to whom correspondence should be addressed.
Mathematics 2026, 14(1), 172; https://doi.org/10.3390/math14010172
Submission received: 14 November 2025 / Revised: 17 December 2025 / Accepted: 20 December 2025 / Published: 2 January 2026

Abstract

Growing climate concerns and rising consumer awareness of sustainability have reshaped strategic interactions in platform-based supply chains. This study examines how a manufacturer and an e-commerce platform make channel and fulfillment decisions under cap-and-trade regulation. The manufacturer chooses between non-encroachment and agency encroachment, while the platform decides between conventional and sustainable fulfillment. To capture the dynamic adaptation of boundedly rational agents, we develop an evolutionary game model (EGT) and characterize the evolutionary stable strategies. The findings indicate the following: (1) Platform investment in sustainable fulfillment exerts a strategic stabilizer effect, effectively protecting the reselling channel by reducing the manufacturer’s incentive to encroach even under moderate commission rates; (2) there exists a regulatory substitution effect between carbon pricing and commissions, where high carbon prices force manufacturers to encroach for survival, while low commissions encourage encroachment for profit; (3) consumer sensitivity exhibits a critical threshold behavior, where a synchronized transition to joint sustainability is impossible unless awareness exceeds a specific tipping point. Managerial insights suggest that platforms should view green logistics as a retention strategy to prevent channel fragmentation, while policymakers must coordinate carbon taxation with consumer awareness campaigns to avoid locking the system into non-green equilibria.

1. Introduction

Sustainable consumption has evolved from a niche preference into a decisive market force. With 80% of consumers willing to pay a premium for sustainable products [1], manufacturers face intense pressure to adopt green practices. This pressure is compounded by regulatory measures, such as government cap-and-trade systems, which compel firms to internalize the cost of carbon emissions [2]. Consequently, the market has seen a divergence in operational strategies. Sustainable small and medium-sized enterprises (SMEs) like Pela Case [3] focus on material innovation to reduce emissions, while major e-commerce platforms are increasingly decarbonizing their logistics networks by deploying electric vehicle fleets to meet regulatory and consumer demands [4,5]. These parallel developments raise the critical question of how the green manufacturing efforts of sellers interact with the green logistics investments of platforms.
Against this backdrop, e-commerce platforms have become a critical channel for sustainable brands, offering both market reach and operational efficiencies. With global e-commerce sales estimated at US$8.8 trillion in 2024 [5], manufacturers can leverage these platforms to offset the high upfront costs of green production. Younger consumers’ trust in sustainability claims makes online channels especially valuable for brand building and demand generation. Platforms generally operate under two selling formats [6,7]. In the reselling mode, the platform purchases products from the manufacturer, takes ownership of the inventory, and assumes responsibility for order fulfillment to the end consumer. In the agency mode, the platform acts as a marketplace where the manufacturer sells directly to consumers, often handling the order fulfillment independently. Manufacturers commonly begin with a single-channel strategy in the reselling mode because it reduces operational complexity and allows a quicker market entry [8]. However, as demand for sustainable products grows, some manufacturers consider adding an agency channel alongside the existing reseller relationship [9]. This market encroachment enables direct consumer engagement and translates into more transparent product information for environmentally conscious consumers. Digital native brands like Allbirds have leveraged this dual approach, selling directly to consumers while utilizing platform marketplaces to expand reach [10].
However, these sustainability pressures create a complex strategic dilemma defined by the potential for free-riding [11]. For the manufacturer, the decision to encroach is a mechanism to capture the sustainability-linked added value directly from consumers to offset the high costs of carbon abatement. For the platform, investing in sustainable fulfillment presents a strategic trade-off. While it attracts eco-conscious consumers to the marketplace, it may inadvertently strengthen the manufacturer’s reselling channel, allowing the manufacturer to benefit from the platform’s green image without encroaching. Conversely, if the platform does not invest, the manufacturer may be forced to encroach to ensure the product meets consumer sustainability expectations.
This interdependence creates a dynamic tension regarding how platform logistics choices and manufacturer channel strategies co-evolve when both are constrained by carbon quotas. Prior static models often assume rational optimization, failing to capture how boundedly rational agents adapt their strategies over time [12]. Therefore, this study addresses three core questions. First, how do cap-and-trade regulations and platform commission rates jointly drive the evolutionary stability of manufacturer encroachment? Second, under what conditions does a platform’s investment in sustainable fulfillment act as a deterrent to encroachment versus a complement? Third, can long-term cooperation be sustained in a decentralized green supply chain?
The contributions of this study are threefold. First, unlike prior static analyses of dual-channel supply chains [7,9], we employ evolutionary game theory to uncover the dynamic adaptation paths of manufacturers and platforms. This reveals how initial conditions and bounded rationality can trap firms in non-optimal non-green equilibria (0,0) even when a green transition is viable. Second, we integrate green logistics (platform side) and carbon abatement (manufacturer side) into a unified utility framework, extending prior platform-based EGT models that primarily focus on production-side abatement while overlooking the strategic role of sustainable fulfillment [12]. Third, we derive actionable regulatory thresholds showing how moderate carbon pricing combined with logistics subsidies can steer the system out of free-riding behaviors toward synergistic sustainability.
The remainder of this paper is organized as follows: Section 2 reviews the relevant literature. Section 3 introduces the model formulation and key assumptions. Section 4 develops the equilibrium analysis and characterizes the evolutionarily stable strategies. Section 5 presents the simulation analysis to illustrate the dynamic effects of key parameters. Finally, Section 6 concludes with a summary of findings, managerial implications, and directions for future research.

2. Literature Review

This study bridges three distinct streams of literature: e-commerce channel structures, sustainable supply chain management (SSCM), and EGT. While extensive research exists in each domain, this section critically evaluates how prior studies addressed the tension between economic efficiency and environmental sustainability, and highlights the specific gaps that necessitate the dynamic framework proposed in this paper.

2.1. E-Commerce Channel Structures and Dual-Channel Strategies

The first stream of literature examines the strategic trade-offs between reselling and agency formats. Early theoretical foundations established by Hagiu and Wright [13] emphasized that channel choice depended on information asymmetries and product characteristics. Subsequent analytical studies extended this by exploring the drivers of dual-channel adoption (encroachment). Zhang et al. [6] and Ha et al. [14] found that transaction fees and product substitutability were the primary determinants of whether a manufacturer added an agency channel. More recently, Wang et al. [7] compared reselling and agency models in the context of trade-in programs, finding that the selling format significantly altered the incentives for manufacturers to engage in circular economy practices.
However, the majority of these studies, including Wang et al. [7], focused on static equilibrium analysis. While recent work by Yu et al. [15] and Zhou and Duan [16] began to incorporate consumer environmental awareness into channel selection, they treated green attributes as static parameters rather than evolving strategic variables. Furthermore, while He et al. [17] highlighted the importance of logistics integration, they did not address how a platform’s investment in green logistics specifically alters the manufacturer’s incentive to encroach. This creates a gap in understanding how channel structure co-evolves with sustainability investments over time.

2.2. Green Supply Chain Management Under Regulation

The second stream focuses on operational strategies under environmental regulation. Foundational work by Xu et al. [18] established that government interventions, such as cap-and-trade mechanisms, effectively drove supply chain coordination. Ji et al. [19] and Taleizadeh et al. [20] extended this to dual-channel settings, examining how manufacturers could use cost-sharing contracts to manage carbon abatement expenses. Notably, Kang and Tan [11] identified that free-riding behaviors often undermine decarbonization efforts in supply chains, as downstream firms may benefit from upstream investments without contributing to the cost.
Despite these advances, a significant limitation in this stream is the isolation of production from fulfillment. Most studies, such as Lyu et al. [21], focused on manufacturer-led green production. Fewer studies addressed the platform’s role in reducing the carbon footprint of delivery. While Ghalehkhondabi et al. [22] examined green logistics, they assumed a fixed channel structure. Consequently, the literature lacks a unified framework that captures the feedback loop between a manufacturer’s carbon abatement decisions (production) and a platform’s green logistics investments (fulfillment) under regulatory constraints.

2.3. Evolutionary Game Theory in Supply Chains

The third stream utilizes EGT to model bounded rationality and long-term adaptation. Unlike static equilibrium models, EGT captures how firms adjust strategies over time in response to market and regulatory changes. Liu et al. [23] successfully applied EGT to model government–enterprise cooperation. Recent studies have expanded this domain, as Zhang et al. [24] used EGT to analyze blockchain adoption for carbon traceability among manufacturers and local governments, while Sun et al. [25] explored cooperative emission reduction behaviors under cap-and-trade regulations. Additionally, Guo et al. [12] developed a tripartite evolutionary model involving the government, manufacturers, and consumers to analyze green technology adoption in a platform context, finding that consumer-side subsidies were often more effective than manufacturer-side subsidies.
However, existing EGT applications have not yet addressed the specific encroachment vs. logistics dilemma in e-commerce. While Guo et al. [12] modeled the platform ecosystem, they treated the platform as a passive marketplace rather than a strategic investor in green logistics. They did not model the competitive tension where a platform’s green investment might deter a manufacturer from opening a competing channel. This study applies EGT specifically to this manufacturer–platform interplay, offering a novel perspective on how channel structures stabilize over time.

2.4. Theoretical Positioning and Research Innovations

Table 1 summarizes the positioning of this study relative to the existing literature. While prior research has addressed channel structure, green operations, and evolutionary dynamics in isolation, this study integrates them to resolve the strategic tensions described in the introduction. Specifically, this paper distinguishes itself through three key innovations. First, unlike Wang et al. [7] who utilized static models to find a one-time equilibrium, this study employs EGT to reveal the path-dependence of channel selection, showing how firms may get trapped in non-green equilibria even when a green transition is viable. Second, while Guo et al. [12] focused primarily on green production, this model integrates the platform’s green fulfillment as a strategic variable that directly impacts the manufacturer’s market share. Finally, we extend the work of Kang and Tan [11] by deriving specific regulatory thresholds required to push boundedly rational agents out of free-riding behaviors, offering actionable policy insights that transcend traditional equilibrium analyses.

3. Model

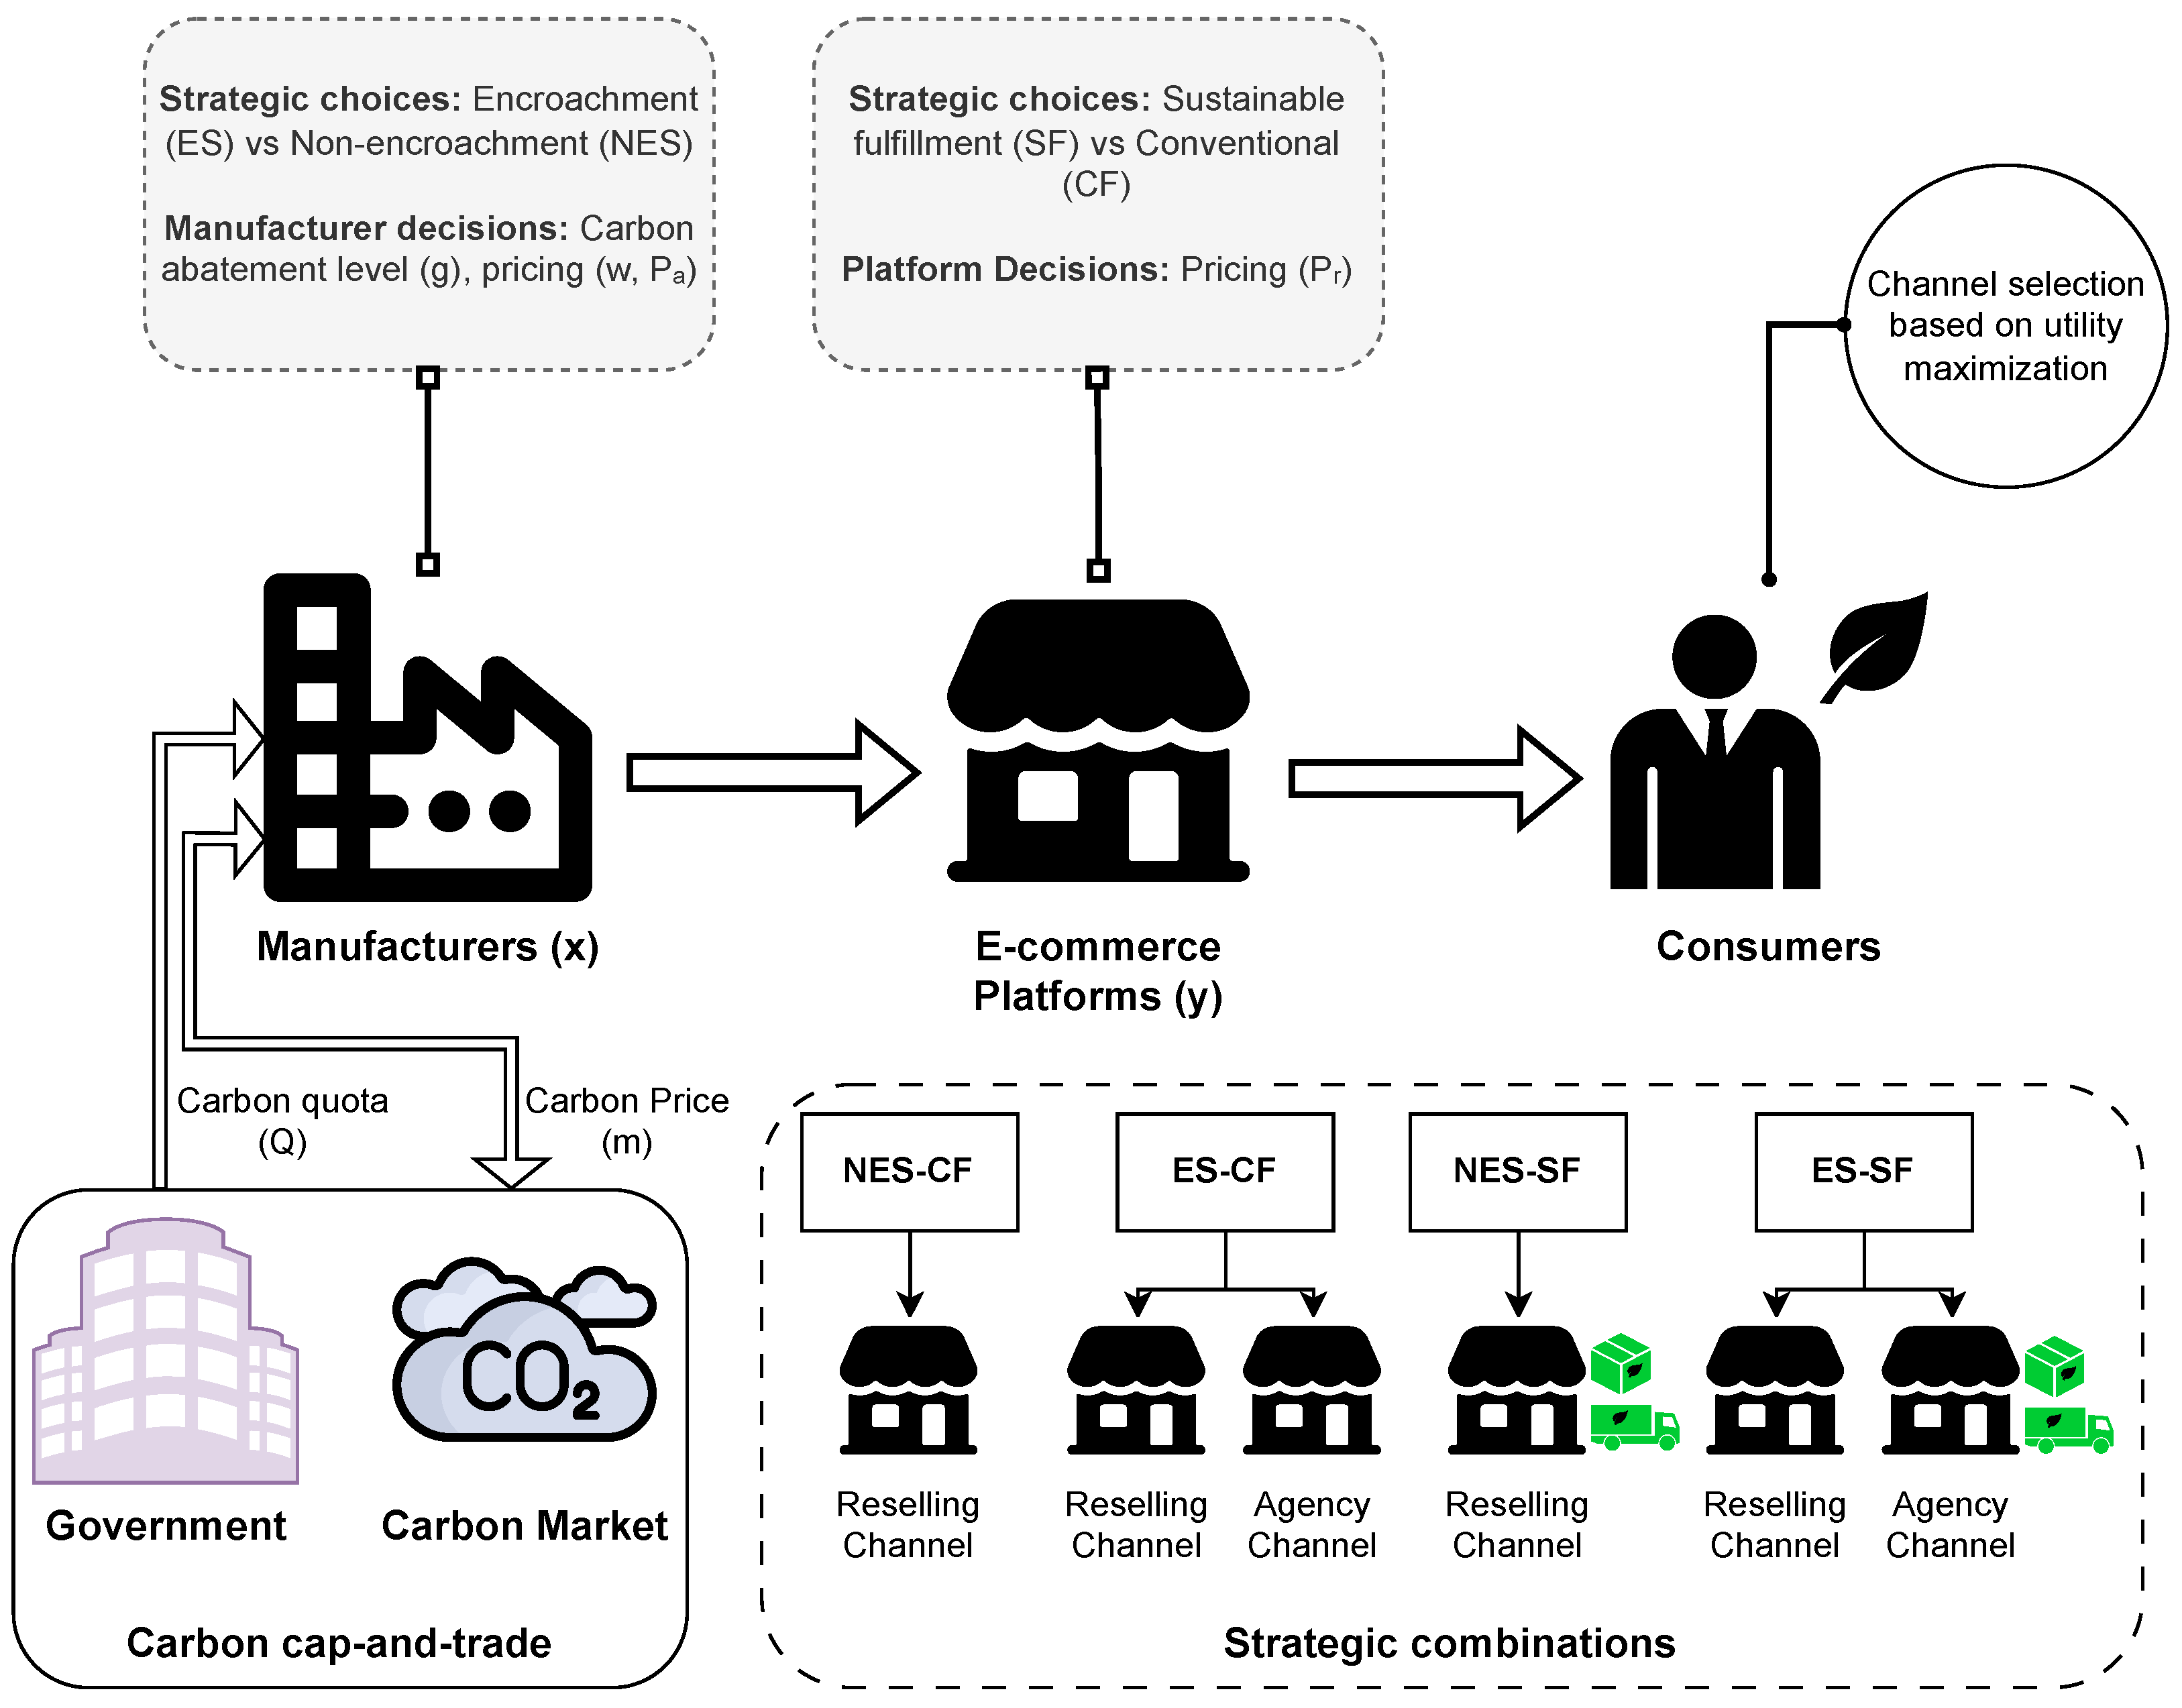
We investigate the strategic interaction between a large population of manufacturers (M) and e-commerce platforms (E) through a two-stage analytical framework (Figure 1). First, we employ a static Stackelberg game, with the manufacturer as the leader and the platform as the follower, to derive closed-form equilibrium strategies under complete information and perfect rationality. This provides benchmark outcomes for each possible strategic combination. Recognizing that in real-world settings decision-makers operate under bounded rationality and face information asymmetry, we then extend the analysis to a dynamic evolutionary game theory model. In this setting, each manufacturer chooses between a non-encroachment strategy (NES), selling only through the reselling channel, and an encroachment strategy (ES), selling directly via the platform’s agency model. Each platform simultaneously chooses between a conventional fulfillment process (CF), using traditional logistics, and a sustainable fulfillment process (SF), incorporating eco-friendly delivery methods such as electric vehicles, micromobility hubs, or carbon-neutral shipping. Key parameters and variables are summarized in Table 2.
Let x [ 0 , 1 ] denote the proportion of manufacturers adopting ES and y [ 0 , 1 ] the proportion of platforms adopting SF. The evolutionary framework captures the co-evolutionary dynamics of these strategies, where participants adapt over time by comparing payoffs and imitating more successful behaviors. Strategies yielding higher payoffs spread in the population according to replicator dynamics [26], enabling the analysis of stability conditions and the emergence of sustainable and dual-channel practices in the long run.

3.1. Model Assumptions

Assumption 1
(Carbon Cap-and-Trade Regulation). Manufacturers operate under a carbon cap-and-trade scheme, whereby emissions exceeding the allocated quota incur a cost at the carbon price m. The total carbon cost is given by m [ ( θ g ) d Q ] , where θ is the initial carbon emissions per unit, g is carbon abatement per unit ( 0 g θ ), d is the total demand, and Q is the carbon quota. This formulation follows standard treatments in the green supply chain literature [8,21].
Assumption 2
(Investment Cost of Carbon Abatement). The manufacturer incurs an investment cost for carbon abatement given by 1 2 k g 2 , where k is the scaling coefficient for abatement cost. This quadratic form reflects diminishing returns to abatement and is widely used in prior studies [16,27].
Assumption 3
(Consumer Preference and Demand Functions). To capture consumer choice behavior, we employ a utility-based vertical differentiation framework [28], which is widely adopted in dual-channel green supply chain literature [7,19]. We assume the market size is normalized to 1, and consumers are heterogeneous in their valuation v for the basic product, where v is uniformly distributed on [ 0 , 1 ] . Consumers derive utility from both the product’s functional value and its sustainability attributes. Let v and ϕ v denote the consumer’s valuation for the reselling and agency channels, respectively. The parameter 0 < ϕ < 1 represents the value discount factor for the agency channel. This reflects the theoretical assumption that consumers perceive lower transaction convenience or trust when purchasing directly from a manufacturer compared to an established platform retailer [19]. Furthermore, sustainability efforts are modeled as quality attributes that linearly enhance utility. We model the consumer’s green utility as the sum of production abatement (g) and platform sustainability effort (s). This additive formulation reflects the “lifecycle” view of sustainable consumption, where consumers derive value from reducing the total carbon footprint of their purchase, comprising both the physical product and its delivery. The utilities are given by U r = v P r + δ e and U a = ϕ v P a + δ e , where P r and P a are the retail and agency prices, and δ e captures the marginal utility from sustainability effort e. Consumers choose the channel with the highest non-negative utility: max ( U r , U a , 0 ) . Integrating the uniform distribution over the derived indifference thresholds yields the demand functions: (1) NES and CF: d r = 1 P r + δ g ; (2) NES and SF: d r = 1 P r + δ ( g + s ) ; (3) ES and CF: d r = 1 + P r P a ϕ 1 , d a = P a + δ g ( ϕ 1 ) P r ϕ ( ϕ 1 ) ϕ ; (4) ES and SF: d r = 1 + P r P a δ s ϕ 1 , d a = P a + δ g ( ϕ 1 ) P r ϕ + δ s ϕ ( ϕ 1 ) ϕ .
Note that denominators ( ϕ 1 ) and ( ϕ 1 ) ϕ are negative since 0 < ϕ < 1 ; feasibility conditions ensure that resulting demands remain positive.
Assumption 4
(Feasibility and Positivity). To ensure equilibrium results are economically meaningful and mathematically valid, we impose three parameter restrictions. First, we assume m θ < ϕ and m θ + α ϕ < ϕ . Mathematically, these conditions ensure positive prices and demands. Economically, they imply that regulatory carbon costs ( m θ ) and commission fees ( m θ + α ϕ ) must not exceed the consumer’s baseline valuation ϕ , or otherwise the market would collapse. Second, the abatement cost coefficient k is bounded by ( m + δ α δ ) ( δ θ + ϕ ) 2 θ ϕ < k < ( m + δ α δ ) 2 4 m θ + 2 ( 1 + α ) ϕ . The lower bound is derived from the Hessian stability condition (Second-Order Condition), ensuring that the abatement investment cost function is strictly convex. Economically, this means the cost of abatement must rise sufficiently fast to prevent unbounded investment levels. The upper bound ensures that the optimal abatement level g * does not exceed initial emissions θ (i.e., g * < θ ). Finally, we require either 1 + s δ > t + ϕ or t + ϕ 1 . These conditions guarantee that demand in both channels remains non-negative under dual-channel competition.

3.2. Profit Functions Under Different Strategic Scenarios

To facilitate subsequent analysis, we introduce abbreviations for each scenario: (1) Non-encroachment with conventional fulfillment (NES-CF), (2) Non-encroachment with sustainable fulfillment (NES-SF), (3) Encroachment with conventional fulfillment (ES-CF), and (4) Encroachment with sustainable fulfillment (ES-SF). For each scenario, we specify the profit functions for both the manufacturer and the platform, denoted by π with appropriate superscripts and subscripts. Here, d r and d a are determined according to the demand functions given in Section 3 and depend on the particular strategy profile.

3.2.1. Non-Encroachment with Conventional Fulfillment (NES-CF)

In the NES-CF scenario, the manufacturer sells exclusively through the reselling channel, and the platform adopts conventional fulfillment. The platform’s profit is given by:
π r NES - CF = ( P r w ) d r
where P r is the retail price, w is the wholesale price, and d r is the reselling-channel demand. The manufacturer’s profit is:
π m NES - CF = w d r 1 2 k g 2 m ( θ g ) d r Q
where k is the abatement cost coefficient, g is the carbon abatement, m is the carbon price, θ is the initial carbon emissions per unit, and Q is the allocated carbon quota. The last term represents the net carbon trading outcome, which can be positive (cost) if emissions exceed the quota, or negative (revenue) if emissions fall below the quota.

3.2.2. Non-Encroachment with Sustainable Fulfillment (NES-SF)

In the NES-SF scenario, the manufacturer sells only through the reselling channel, but the platform invests in sustainable fulfillment, incurring a per-unit cost t associated with sustainable effort s. The platform’s profit is:
π r NES - SF = ( P r w t ) d r
and the manufacturer’s profit is:
π m NES - SF = w d r 1 2 k g 2 m ( θ g ) d r Q

3.2.3. Encroachment with Conventional Fulfillment (ES-CF)

In the ES-CF scenario, the manufacturer adopts a dual-channel strategy, selling through both the reselling and agency channels, while the platform uses conventional fulfillment. The platform’s profit is:
π r ES - CF = ( P r w ) d r + ( α P a ) d a
where P a is the agency price, d a is the agency-channel demand, and α is the commission rate for the agency channel. The manufacturer’s profit is:
π m ES - CF = w d r + ( 1 α ) P a d a 1 2 k g 2 m ( θ g ) ( d r + d a ) Q

3.2.4. Encroachment with Sustainable Fulfillment (ES-SF)

In the ES-SF scenario, the manufacturer sells through both channels and the platform adopts sustainable fulfillment, incurring the per-unit cost t associated with effort s. The platform’s profit is:
π r ES - SF = ( P r w t ) d r + ( α P a ) d a
and the manufacturer’s profit is:
π m ES - SF = w d r + ( 1 α ) P a d a 1 2 k g 2 m ( θ g ) ( d r + d a ) Q
Proofs of concavity are presented in Appendix A.1. The optimal decision variables for each scenario are provided in Appendix A.2. These results serve as the basis for the evolutionary dynamics analysis in the next section.

3.3. Evolutionary Dynamics of Manufacturer and Platform Strategies

In markets characterized by bounded rationality and information asymmetry, manufacturers and platforms adjust their strategic choices incrementally rather than instantaneously optimizing [11]. To capture these adaptive processes, we adopt an evolutionary game-theoretic framework in which the prevalence of competing strategies evolves in proportion to their relative performance.
Manufacturers:
F m , E S = y π m ES - SF + ( 1 y ) π m ES - CF , F m , N E S = y π m NES - SF + ( 1 y ) π m NES - CF , F ¯ m = x F m , E S + ( 1 x ) F m , N E S ,
where x [ 0 , 1 ] is the proportion of manufacturers adopting the environmentally sustainable (ES) strategy, F m , E S and F m , N E S are the corresponding expected payoffs (fitness values), and F ¯ m is the average fitness of the manufacturer population.
Platforms:
F r , S F = x π r ES - SF + ( 1 x ) π r NES - SF , F r , C F = x π r ES - CF + ( 1 x ) π r NES - CF , F ¯ r = y F r , S F + ( 1 y ) F r , C F ,
where y [ 0 , 1 ] is the proportion of platforms choosing the sustainable-friendly (SF) mode, F r , S F and F r , C F are the associated fitness values, and F ¯ r is the average fitness of the platform population.

4. Equilibrium Analysis and Evolutionary Stable Strategies

The adaptive dynamics follow the replicator system
x ˙ = x F m , E S F ¯ m ,
y ˙ = y F r , S F F ¯ r ,
where x is the proportion of manufacturers choosing ES and y is the proportion of platforms choosing SF. The fixed points ( x * , y * ) satisfy x ˙ = 0 and y ˙ = 0 in Equations (9) and (10) and correspond to the possible long-term outcomes of the evolutionary game.
Proposition 1
(Equilibrium Points and Stability). Let ( x * , y * ) denote an equilibrium point of the replicator dynamics Equations (9) and (10). The system admits the following equilibrium points (the proof is provided in Appendix B.1):
1. 
( x * , y * ) = ( 0 , 0 ) , all manufacturers choose NES and all platforms choose CF.
2. 
( x * , y * ) = ( 0 , 1 ) , all manufacturers choose NES and all platforms choose SF.
3. 
( x * , y * ) = ( 1 , 0 ) , all manufacturers choose ES and all platforms choose CF.
4. 
( x * , y * ) = ( 1 , 1 ) , all manufacturers choose ES and all platforms choose SF.
5. 
( x * , y * ) = ( x i * , y j * ) , an interior equilibrium where
x i * = π r NES - CF π r NES - SF π r ES - CF + π r ES - SF + π r NES - CF π r NES - SF , y j * = π m NES - CF π m ES - CF π m ES - CF + π m ES - SF + π m NES - CF π m NES - SF
which satisfy 0 < x i * < 1 and 0 < y j * < 1 and are obtained by solving F m , E S = F ¯ m and F r , S F = F ¯ r simultaneously.
The determinant det ( J ) and trace tr ( J ) at each equilibrium are given in Table 3. An equilibrium is locally asymptotically stable (and hence an ESS) if det ( J ) > 0 and tr ( J ) < 0 . For each equilibrium, presented in Proposition 1, local stability is determined by the Jacobian matrix J ( x , y ) of the system Equations (9) and (10).
J ( x , y ) = ( 2 x 1 ) [ y π m ES - SF + π m NES - CF π m NES - SF + π m NES - CF + π m ES - CF ( y 1 ) ] ( x 1 ) x π m ES - CF π m ES - SF π m NES - CF + π m NES - SF ( y 1 ) y π r ES - CF π r ES - SF π r NES - CF + π r NES - SF ( 2 y 1 ) [ x π r ES - CF + π r ES - SF + π r NES - CF + π r NES - CF + π r NES - SF ( x 1 ) ]
Proposition 2
(ESS Conditions for Equilibrium Points). The evolutionary stability of each equilibrium point ( x * , y * ) is determined by the following conditions (with all threshold values such as k 1 , k 2 , k 3 , ϕ 1 , t 1 , t 2 , θ 1 , θ 2 , θ 3 , θ 4 defined in Appendix B.3 and the stability proof provided in Appendix B.2):
1. 
( 0 , 0 ) is ESS if s δ < t and θ 1 < θ < θ 2 and either ( ϕ < ϕ 1 and k 1 < k < k 2 and 3 α < 1 ) or ( k > k 1 and ( ϕ 1 ϕ or 3 α 1 )).
2. 
( 1 , 0 ) is ESS if s δ < t and either ( 3 α < 1 and ϕ < ϕ 1 and k > k 2 ) or ( 0 < θ < θ 1 or θ > θ 2 and (( ϕ < ϕ 1 and k 1 < k < k 2 and 3 α < 1 ) or ( k > k 1 and ( ϕ 1 ϕ or 3 α 1 )))).
3. 
( 0 , 1 ) is ESS if s δ > t and θ 3 < θ < θ 4 and either ( k 1 < k < k 3 and ( t < t 1 or ( 3 α < 1 and ϕ < ϕ 1 and t t 2 ))) or ( k > k 1 and t t 1 and ( 3 α 1 or t > t 2 or ϕ > ϕ 1 or t + ϕ > 1 )).
4. 
( 1 , 1 ) is ESS if s δ > t and either ( k > k 3 and ( t < t 1 or ( ϕ < ϕ 1 and t t 2 ))) or ( 0 < θ < θ 3 or θ > θ 4 and (( k 1 < k < k 3 and ( t < t 1 or ( 3 α < 1 and ϕ < ϕ 1 and t t 2 ))) or ( k > k 1 and t t 1 and ( 3 α 1 or t > t 2 or ϕ > ϕ 1 or t + ϕ > 1 )))).
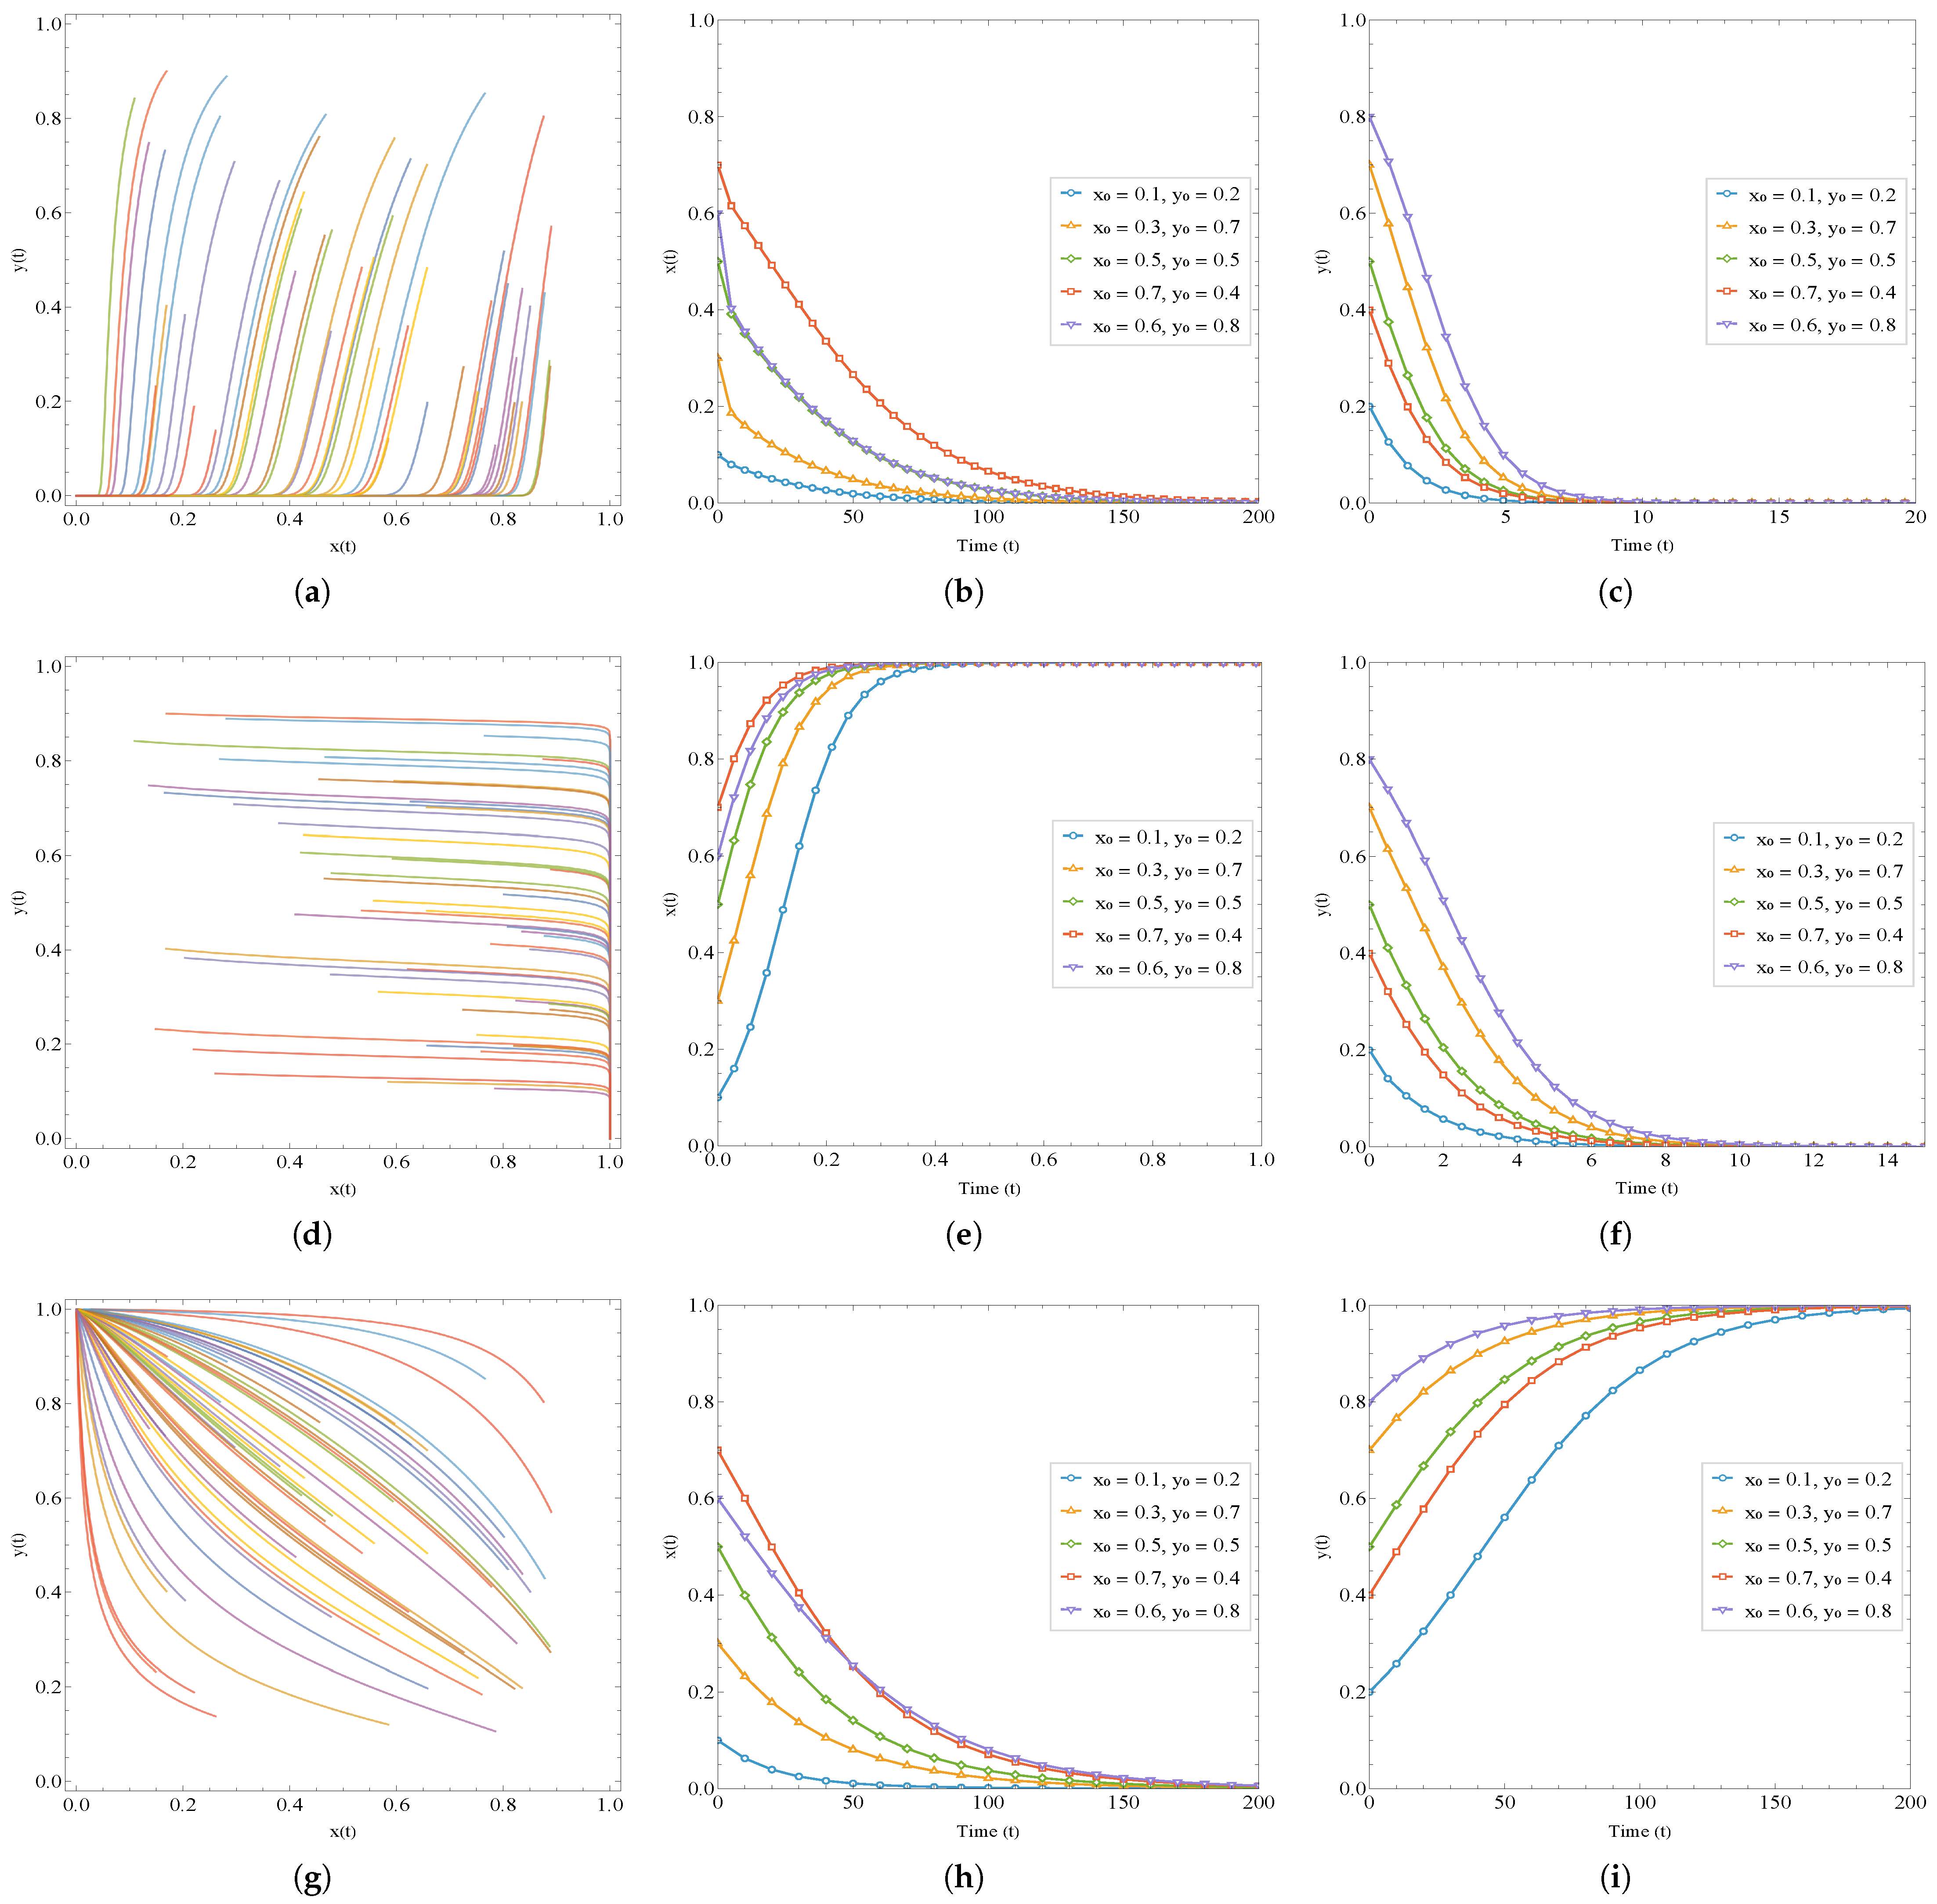
For the equilibrium ( 0 , 0 ) , the system stabilizes in a non-green state (NES, CF), as illustrated in Figure 2a–c. This outcome is primarily driven by cost barriers. The condition s δ < t implies that the marginal revenue generated from consumers’ green sensitivity is insufficient to cover the platform’s sustainable fulfillment costs. Simultaneously, the manufacturer retains the single-channel strategy because the regulatory penalty ( m θ ) is moderate and not high enough to force abatement, while the transaction costs of encroachment (commission α and fixed costs) outweigh the potential margin gains of the direct channel. Consequently, without external incentives or higher consumer sensitivity, both parties maximize profit by maintaining the status quo.
For the equilibrium ( 1 , 0 ) , the system shifts to unilateral encroachment (Figure 2d–f). Here, the platform remains conventional due to high logistics costs ( s δ < t ), but the manufacturer adopts the agency channel. The stability conditions indicate this occurs under two distinct economic regimes. First, when commission rates are sufficiently low ( 3 α < 1 ), increasing the manufacturer’s margin in the direct channel. Second, when carbon emissions are extreme ( θ > θ 2 ). In the latter case, high regulatory costs render the low-margin wholesale channel unviable, compelling the manufacturer to encroach to capture the higher retail price ( P a ) and offset carbon penalties. Economically, this represents a scenario where the manufacturer bears the full burden of sustainability while the platform avoids green investment.
For the equilibrium ( 0 , 1 ) , the system stabilizes in platform-led sustainability, as shown in Figure 2g–i. This occurs when the green value proposition is strong ( s δ > t ), incentivizing the platform to invest. Crucially, the manufacturer chooses not to encroach. As noted by Kang and Tan [11], this creates a free-rider dynamic where the manufacturer benefits from the increased demand ( d r ) driven by the platform’s green efforts without incurring the costs of opening a direct channel. Stability here indicates that the platform’s investment successfully disincentivizes encroachment, resolving the channel conflict through unilateral contribution.
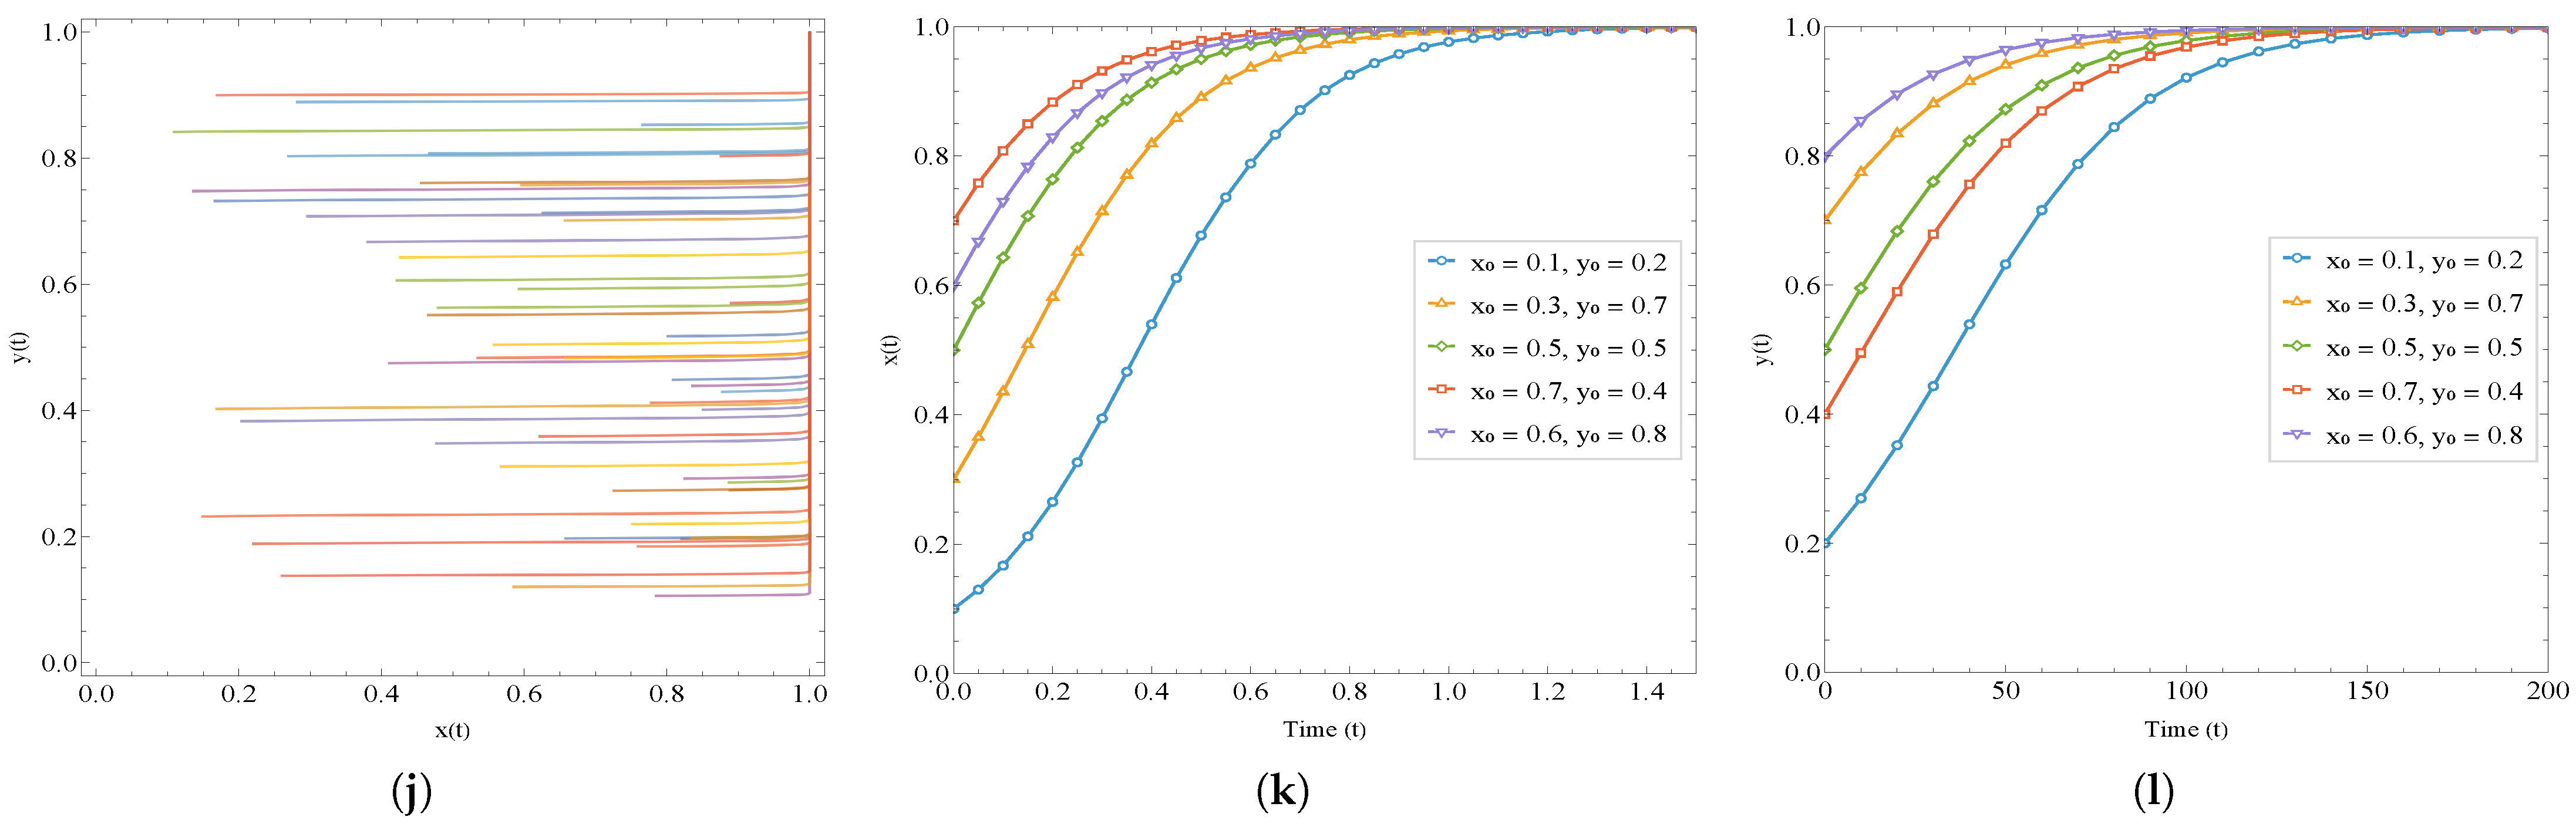
For the equilibrium ( 1 , 1 ) , the system converges to joint green adoption (Figure 2j–l). This state requires high consumer environmental sensitivity ( s δ > t ) and favorable market conditions for the manufacturer, such as high brand trust ϕ or low abatement coefficients k. In this scenario, the market is large enough to support both channels. The platform invests to capture the green premium in logistics, while the manufacturer encroaches to capture the green premium in production. Regulatory pressure acts as a catalyst here as carbon prices rise, forcing the system away from partial adoption and toward this fully sustainable equilibrium to minimize long-term compliance costs.

5. Simulation Analysis and Managerial Implications

To examine the evolutionary dynamics of manufacturers and platforms, we conduct numerical simulations using Wolfram Mathematica. Parameter values are calibrated based on empirical evidence from e-commerce logistics and carbon markets to ensure the results reflect realistic industry conditions [16,27]. We consider a baseline scenario representative of consumer electronics or home goods. The economic parameters are set with a commission rate α = 0.20 (consistent with Amazon/JD.com) and an agency discount factor ϕ { 0.75 , 0.90 } to capture varying levels of brand trust. For environmental parameters, we set consumer sensitivity δ = 0.85 , platform sustainable effort s { 0.1 , 0.3 } with associated cost t { 0.2 , 0.25 } , and manufacturer abatement cost k { 1.1 , 1.3 } . Finally, regulatory parameters are fixed at m = 0.4 (based on China’s pilot ETS) with initial carbon intensity θ { 0.7 , 1.45 } to simulate both low- and high-emission industries. Based on these baselines, we analyze the evolutionary paths of ( x , y ) to identify the strategic tipping points for encroachment and sustainable fulfillment.

5.1. Evolutionary Speed and Convergence

While Proposition 2 identifies the final stability conditions, it is crucial to understand the speed of adaptation. We analyze the three most critical parameters, specifically the commission rate ( α ), consumer sensitivity ( δ ), and carbon price (m), to understand how they accelerate or retard the transition to player strategies.
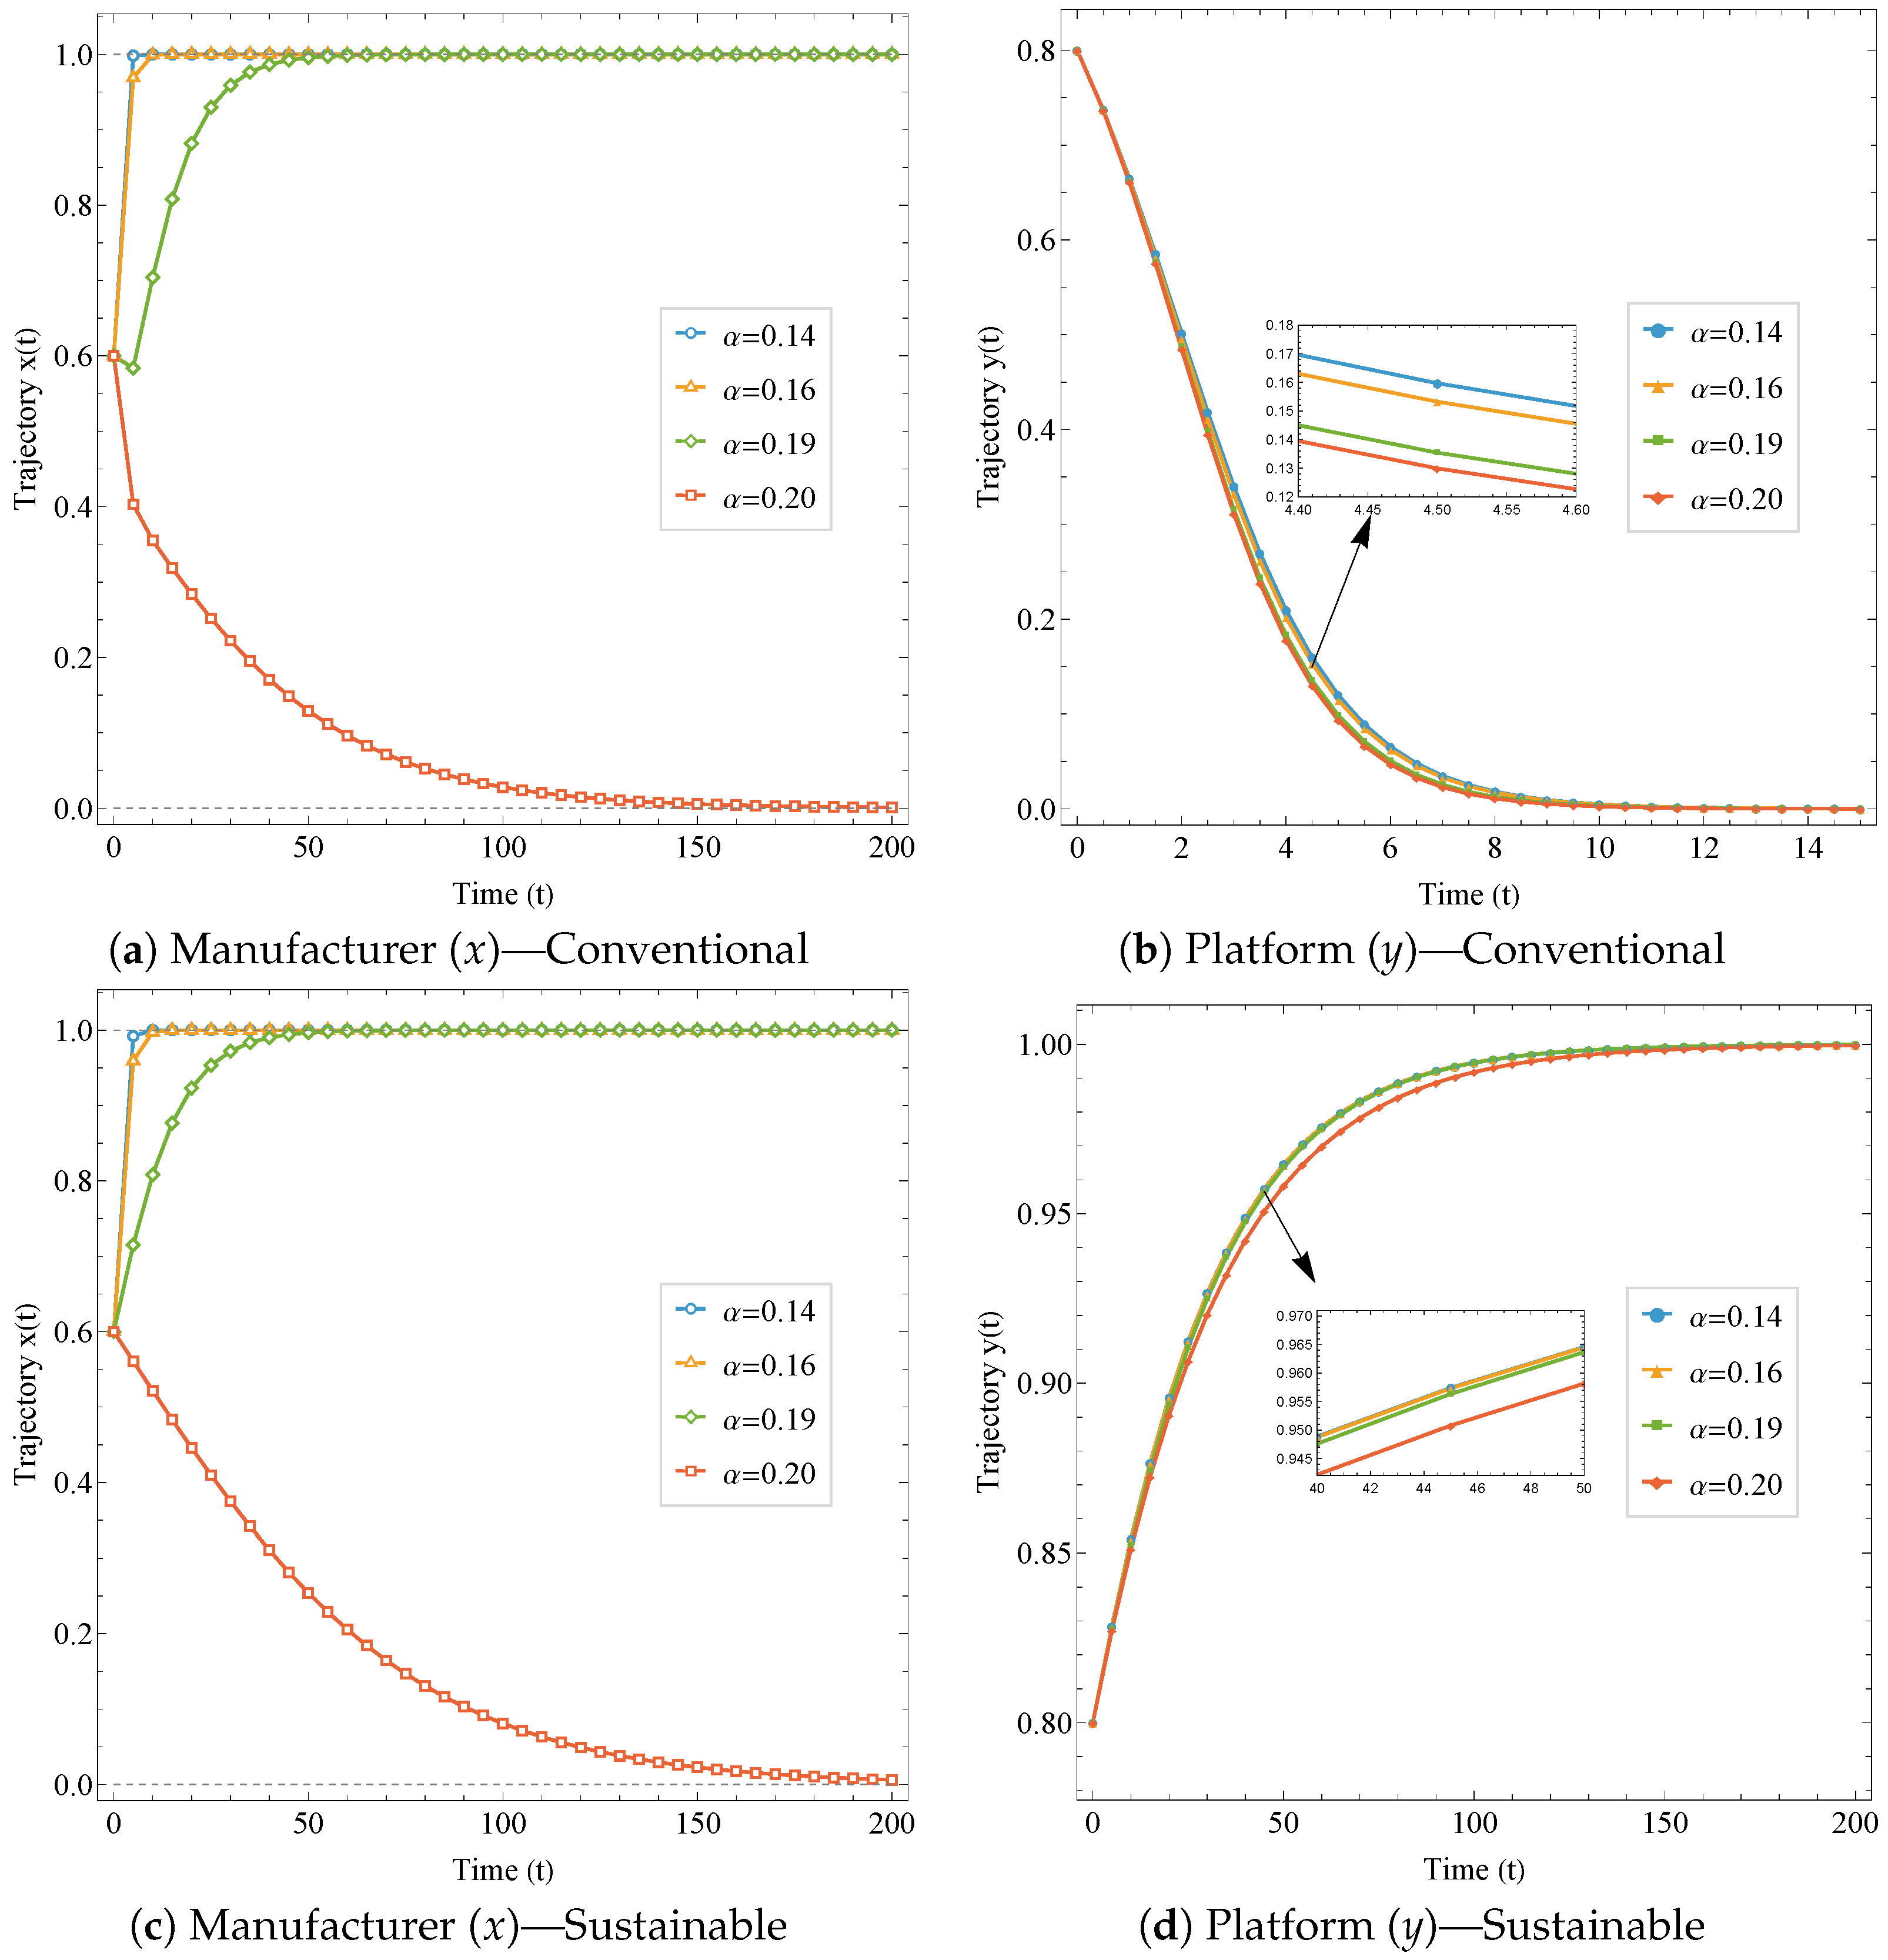
Impact of commission rate ( α ). Figure 3 compares the evolutionary paths under different commission structures. Consistent with condition 2 in Proposition 2, lower commission rates significantly accelerate the manufacturer’s adoption of the agency channel. The simulation reveals a critical tipping point. As shown in Figure 3a,c, when the commission rate is maintained at 0.20, the manufacturer remains in the reselling channel ( x 0 ). However, a slight reduction to 0.19 triggers a shift toward encroachment ( x 1 ). Furthermore, comparing the sustainable scenario (Figure 3c) with the conventional one Figure 3a indicates that platform green investment does not deter encroachment if commissions are low. Instead, the manufacturer encroaches slightly faster in the sustainable scenario, effectively free-riding on the platform’s green logistics to capture the premium market share.
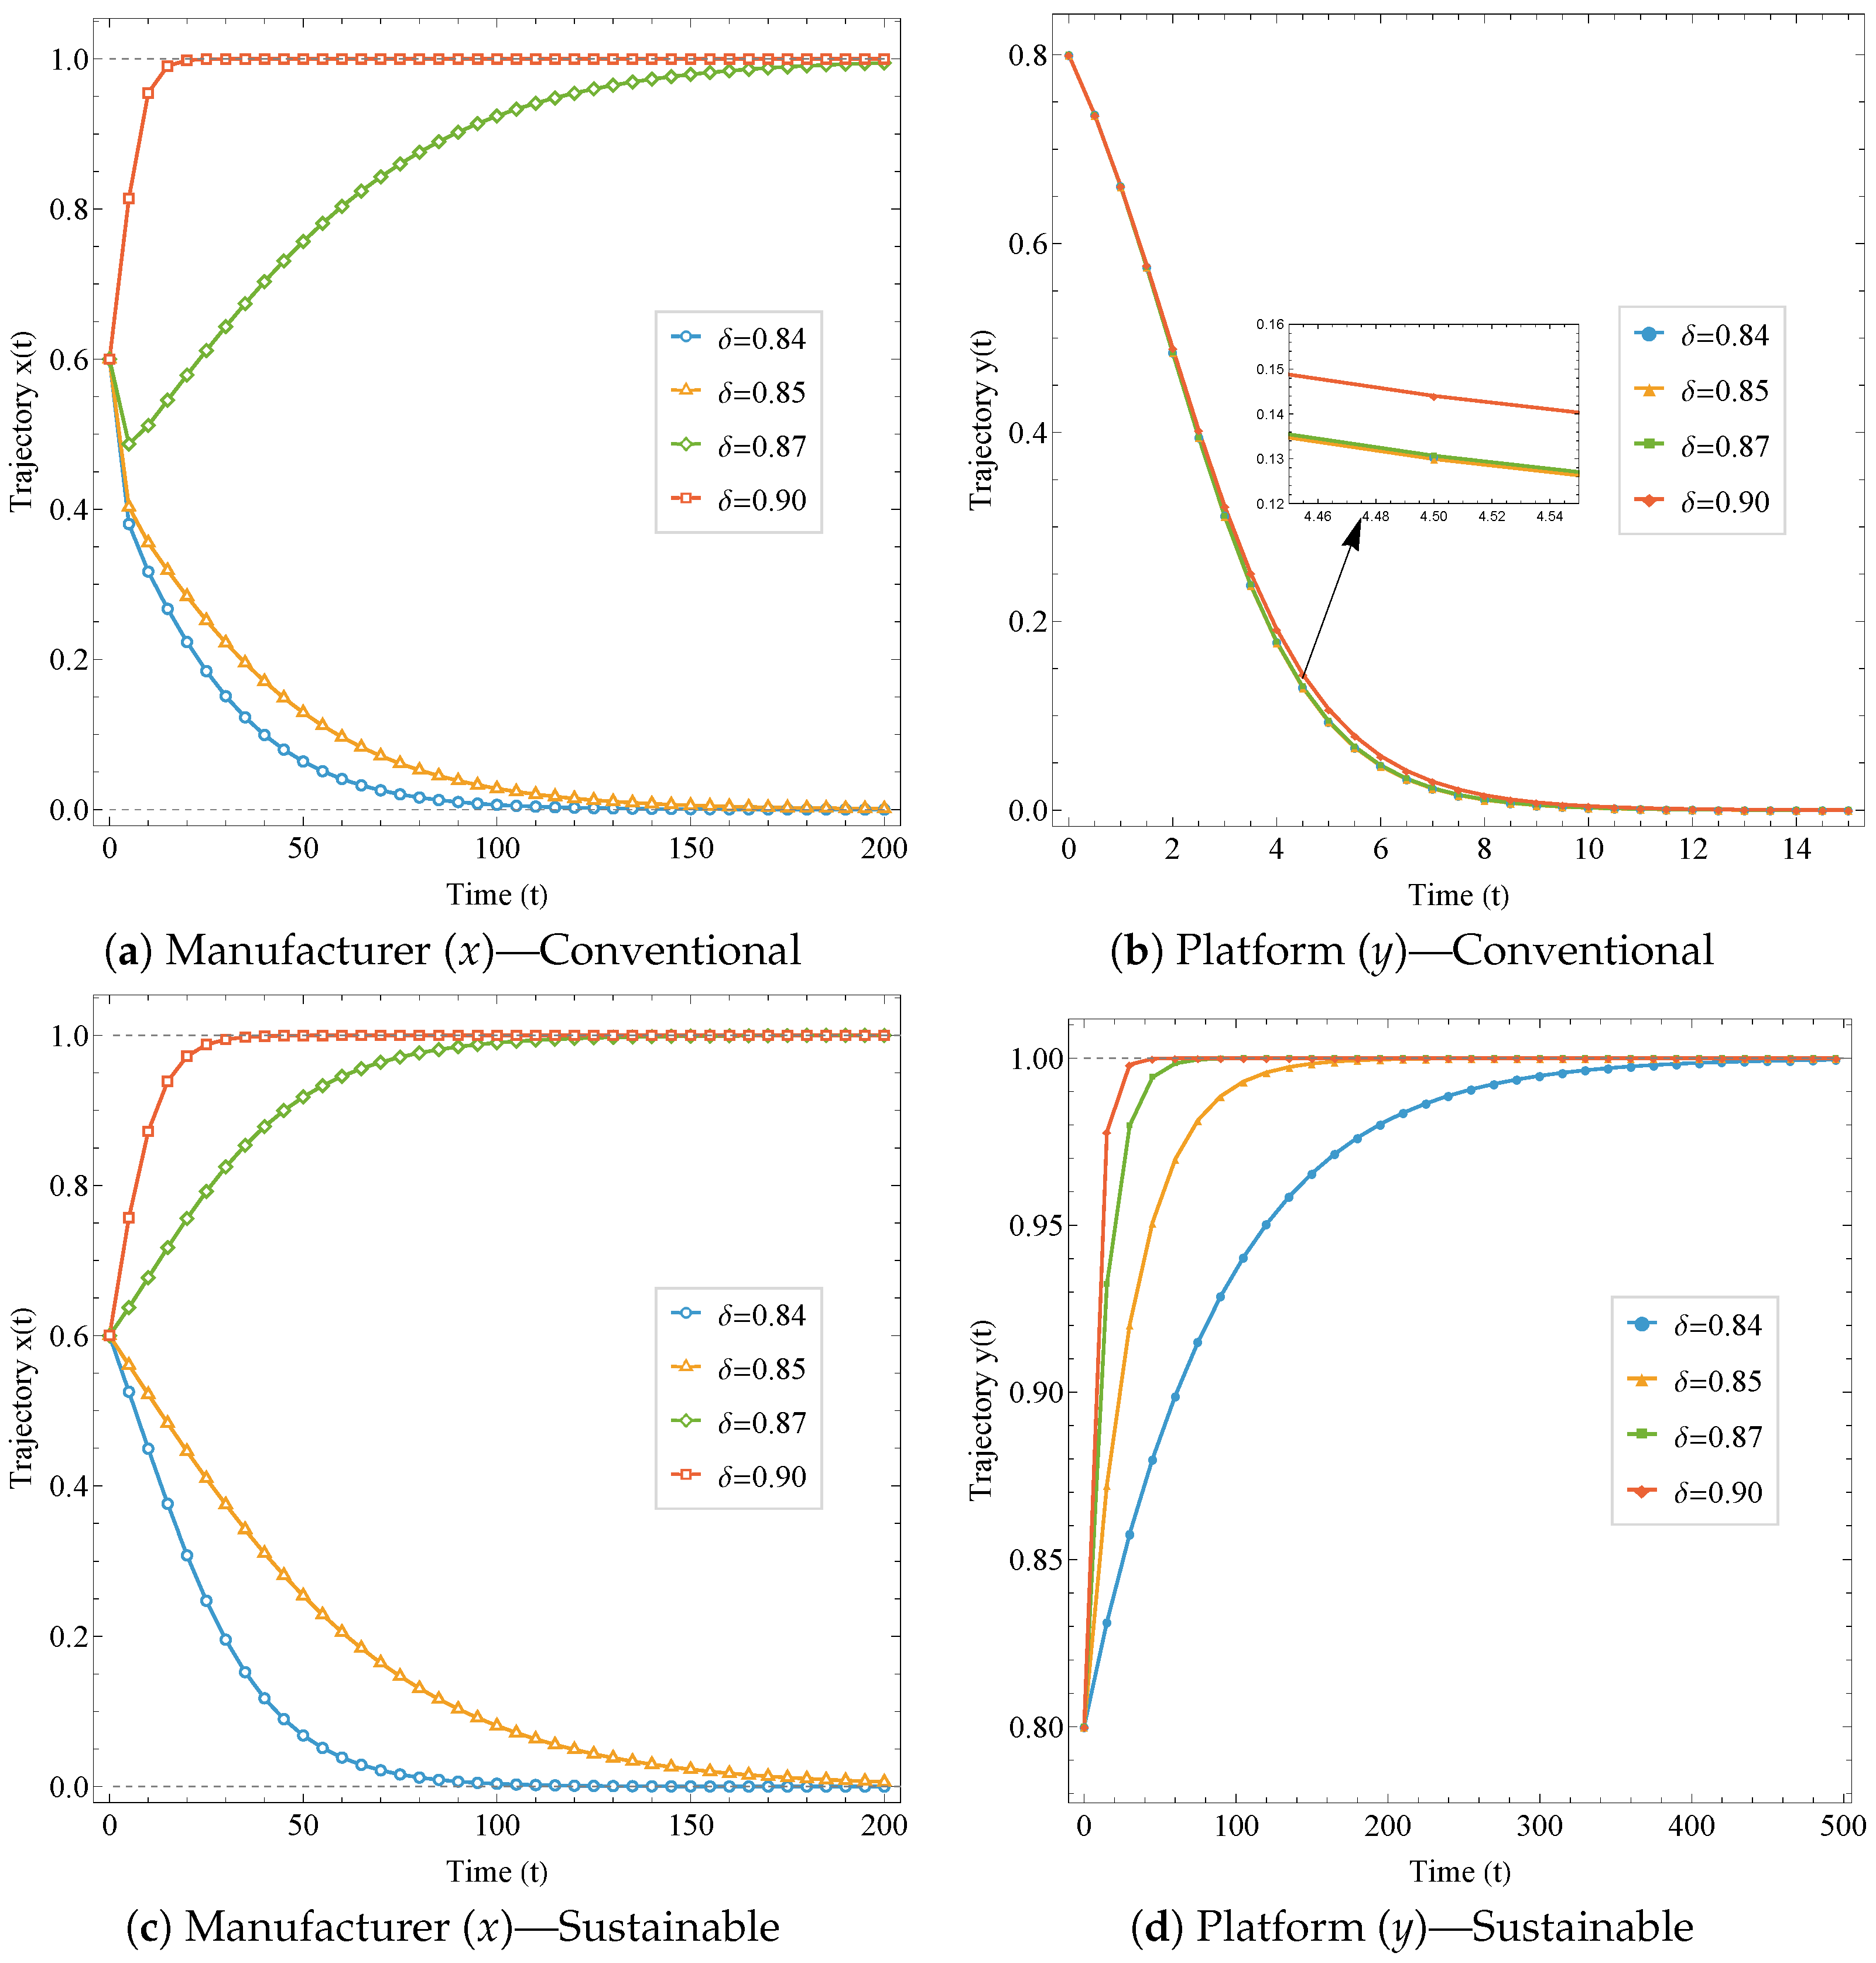
Impact of consumer sensitivity ( δ ). Figure 4 demonstrates the synchronizing effect of consumer awareness. The simulation reveals a sharp threshold behavior. As shown in Figure 4c, when sensitivity is below a critical level ( δ 0.85 ), the manufacturer refuses to encroach ( x 0 ) despite the platform’s green investment. However, a small increase to δ = 0.87 triggers a rapid shift to encroachment ( x 1 ). Simultaneously, in the Sustainable Fulfillment scenario (Figure 4d), higher sensitivity drastically reduces the platform’s adoption time; at δ = 0.90 , the platform achieves full green adoption ( y = 1 ) in less than half the time required at δ = 0.84 . This validates the theoretical insight that high consumer sensitivity is the prerequisite for overcoming the coordination friction between channel partners.
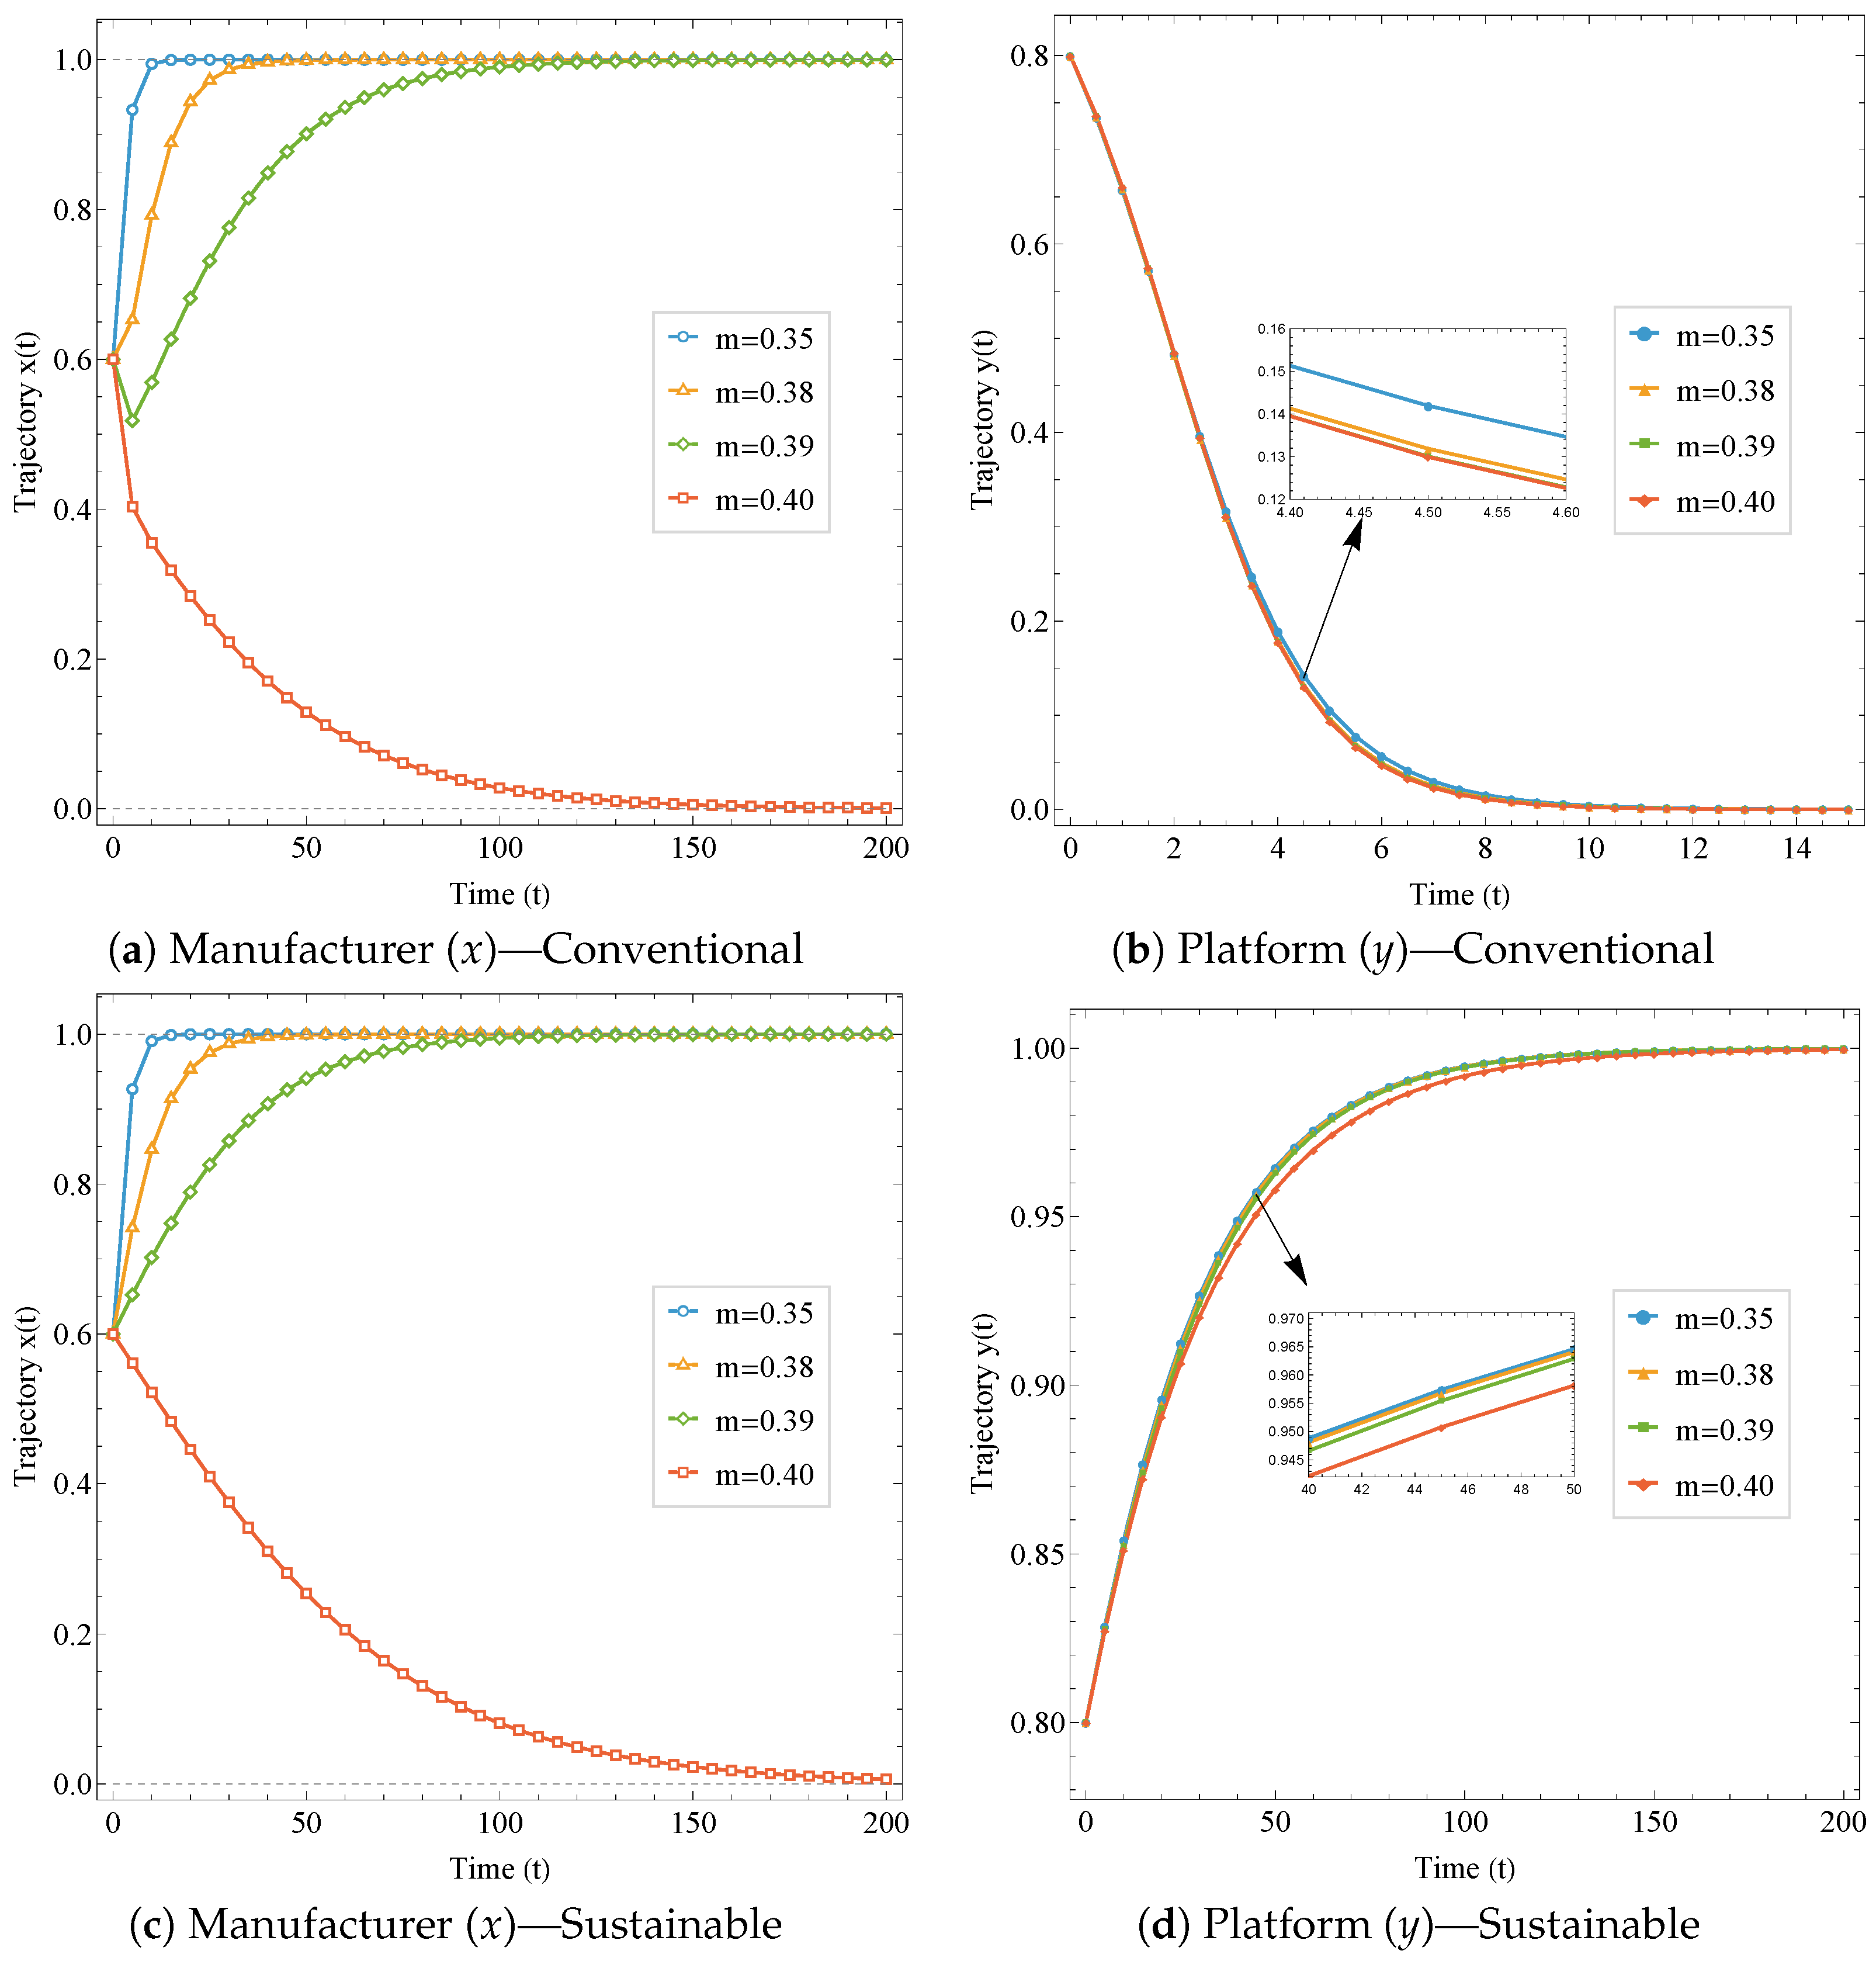
Impact of carbon price (m). Figure 5 reveals a complex dampening effect of regulatory pressure. Contrary to the intuition that regulation forces action, the simulation shows that excessive carbon prices can suppress investment. As shown in Figure 5a, when carbon price is moderate ( m = 0.35 ), the manufacturer aggressively encroaches ( x 1 ). However, as the price rises to m = 0.40 , the manufacturer retreats to the reselling channel ( x 0 ), likely because the high regulatory cost erodes the margin required to support a direct channel. Similarly, for the platform (Figure 5d), higher carbon prices ( m = 0.40 ) noticeably slow down the rate of green adoption compared to lower prices. This suggests that while carbon pricing is necessary, setting it too high strains the supply chain’s liquidity, inadvertently delaying voluntary green investments.

5.2. Strategic Stability Regions and Policy Implications

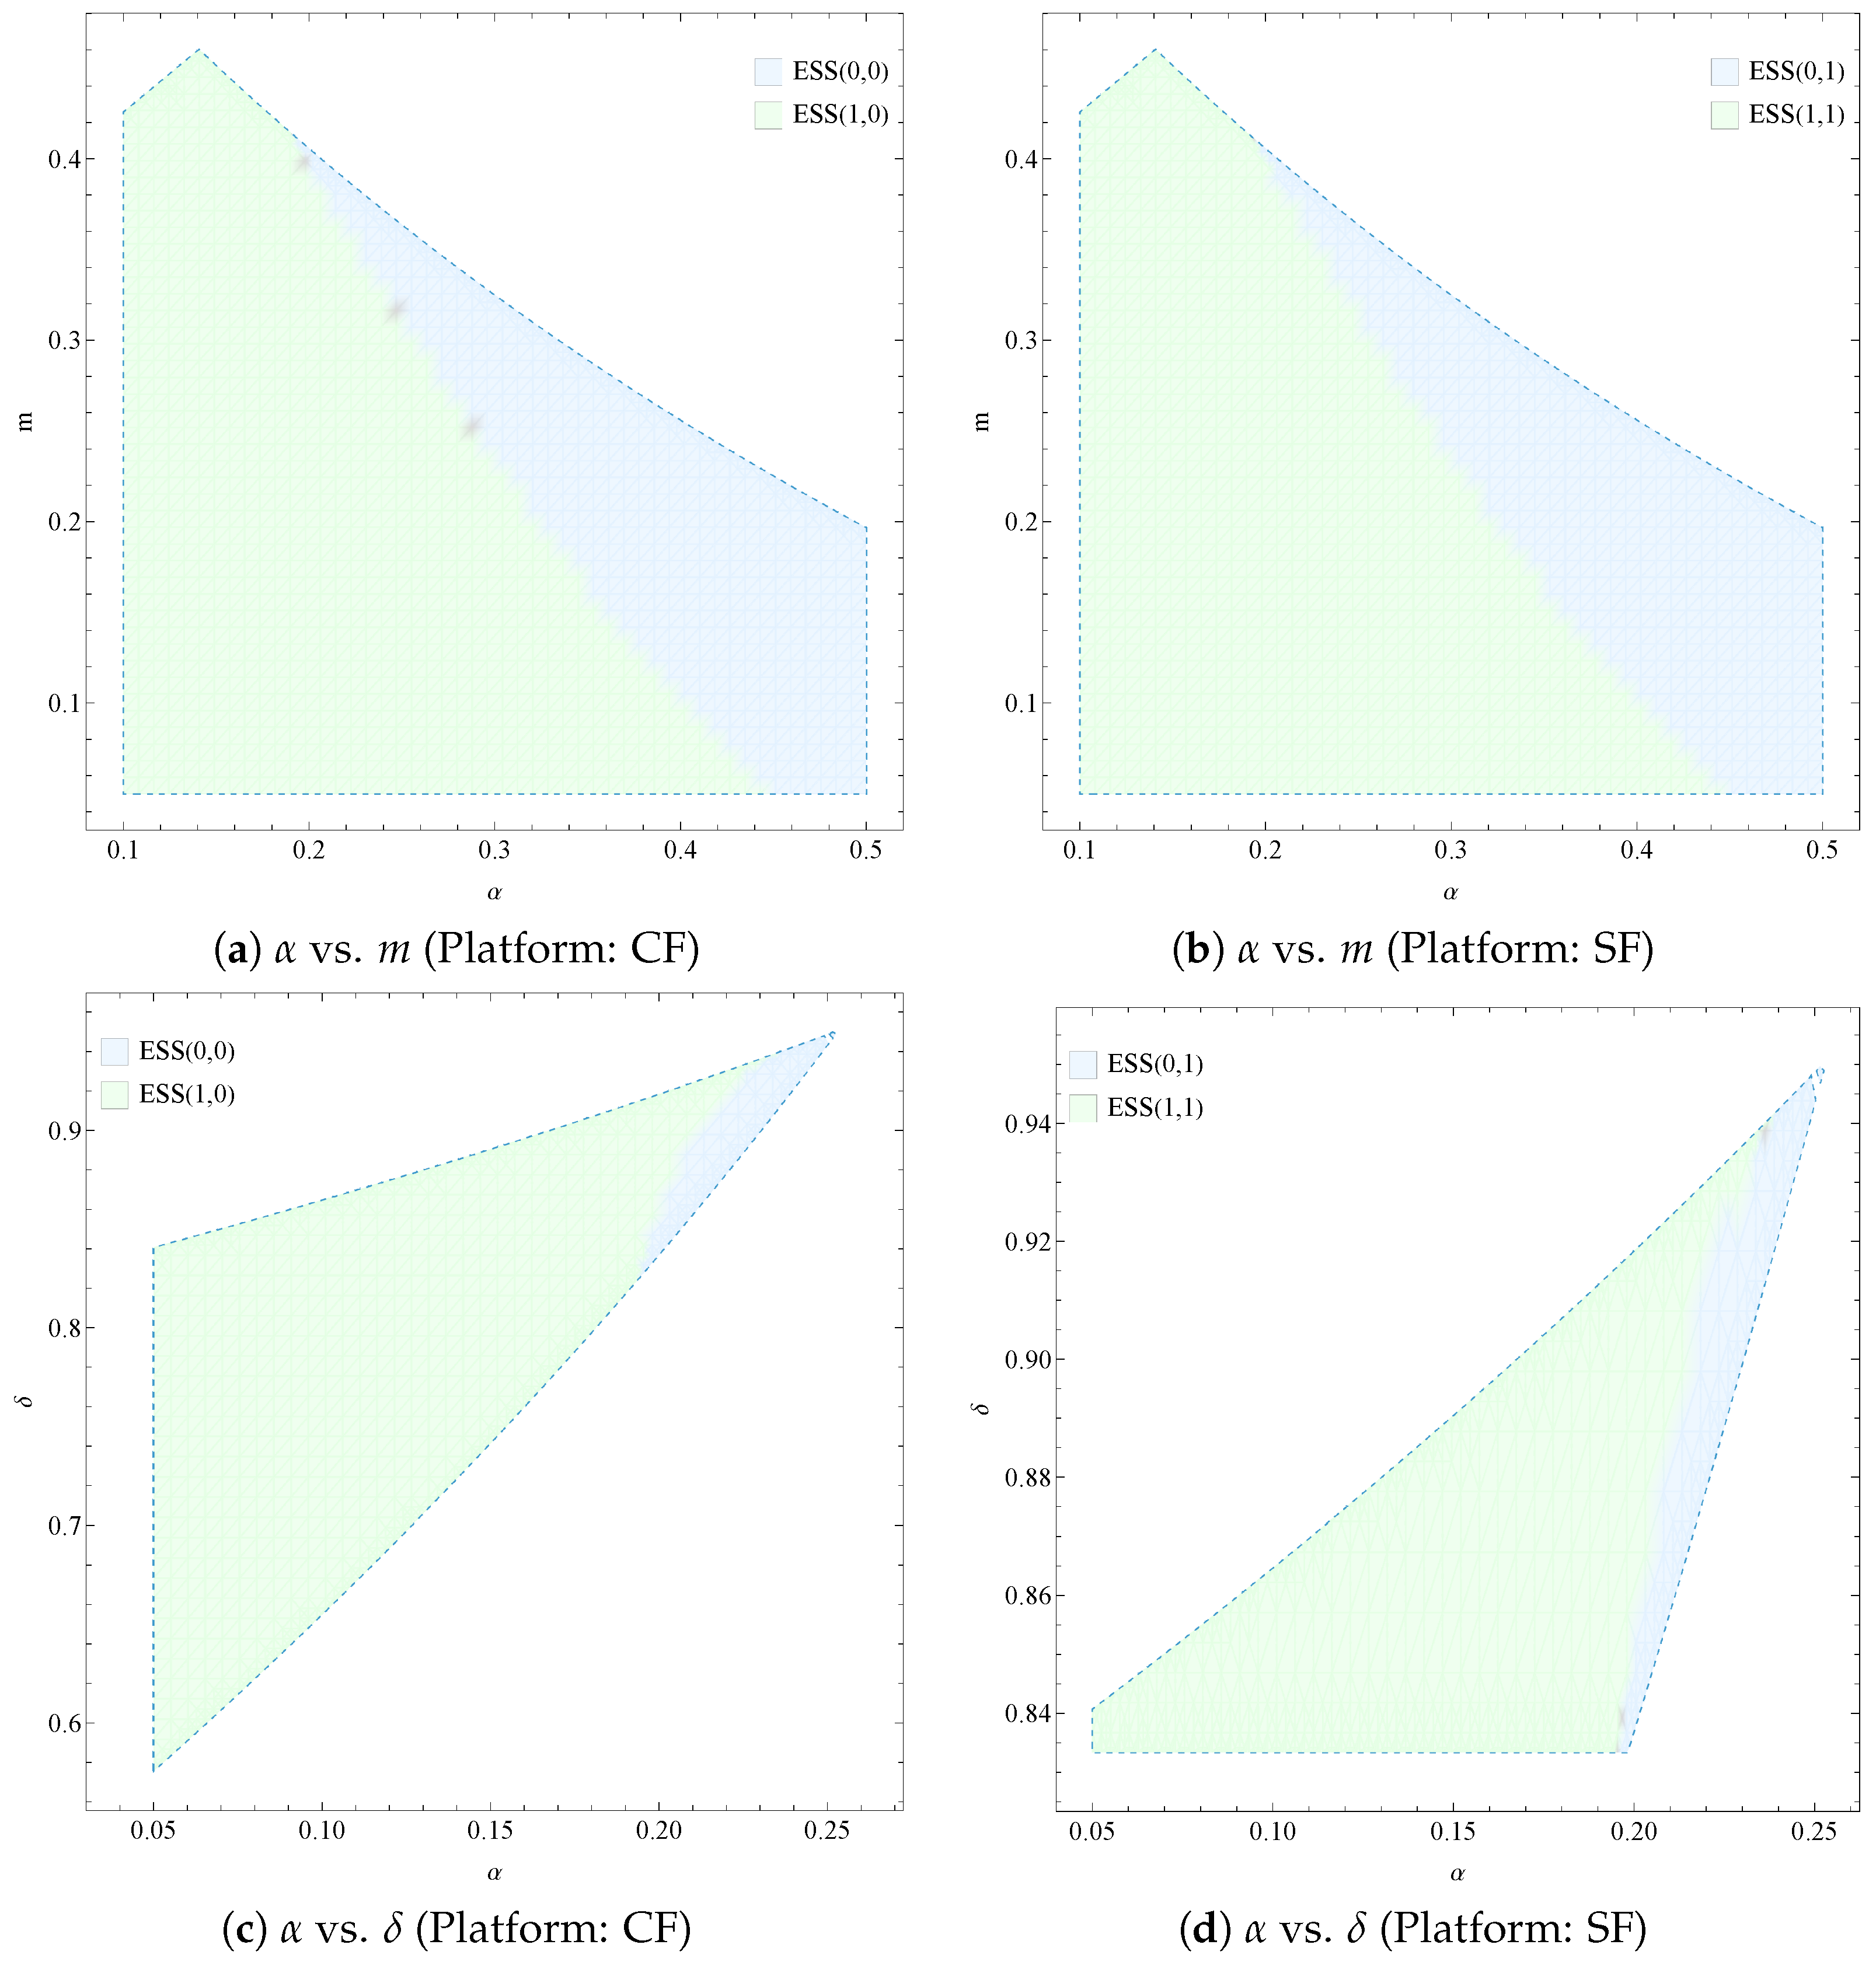
Regarding the interaction between policy and platform strategy, we examine the structural stability of the system using the region plots in Figure 6. These plots map the boundary between encroachment (green region) and non-encroachment (blue region).
Comparing platform conventional fulfillment (left column) with platform sustainable fulfillment (right column) demonstrates that platform investment significantly alters channel stability. This is most visible when comparing Figure 6c,d. In the conventional scenario (c), the manufacturer encroaches across almost the entire parameter space of consumer sensitivity ( δ ). However, when the platform invests in green logistics (d), a significant non-encroachment (blue region) emerges, particularly when commission rates ( α ) are higher ( > 0.20). This indicates that the platform’s investment in sustainable fulfillment expands the stability region of the reselling channel, allowing the manufacturer to derive sufficient utility from the platform’s services without needing to establish a direct channel.
Figure 6a,b highlight the trade-off between regulatory pressure (m) and platform fees ( α ). In both scenarios, the encroachment (green region) dominates when α and m are low, as manufacturers seek to recover margins through direct sales. However, as carbon prices rise or commission rates increase, the blue region expands, indicating that high costs eventually discourage encroachment. Comparing (a) and (b) reveals that while the overall structural stability remains similar, the sustainable fulfillment scenario (b) allows the platform to maintain the reselling partnership (blue region) under slightly broader conditions. This suggests that while green logistics contributes to stability, the primary drivers of encroachment in this specific parameter range remain the economic pressures of carbon regulation and commission fees.

6. Conclusions and Future Research

This study employs evolutionary game theory to investigate the dynamic relationship between manufacturer encroachment and platform sustainable fulfillment under cap-and-trade regulations. By analyzing the stability of four strategic equilibria, including the non-green state (0,0), unilateral encroachment (1,0), platform-led sustainability (0,1), and joint green adoption (1,1), we derive three key findings that directly address the research questions posed in the introduction.
  • Platform investment as a channel stabilizer addressing RQ2. We find that platform investment in sustainable fulfillment acts as a strategic deterrent against manufacturer encroachment. Simulation results demonstrate that when the platform invests in green logistics, the stability region of the reselling channel expands significantly compared to the conventional scenario. By enhancing the utility of the platform-fulfilled product, the platform reduces the manufacturer’s incentive to encroach and effectively secures loyalty through sustainability. This suggests that green logistics function as a barrier that preserves the wholesale partnership.
  • Regulatory substitution between carbon price and commissions addressing RQ1. The analysis reveals a substitution effect between regulatory pressure (m) and platform fees ( α ). In low-carbon-price regimes, manufacturer encroachment is driven by profit motives to escape high commission rates ( 3 α > 1 ). However, in high-carbon-price regimes ( m > 0.6 ), encroachment becomes a survival strategy to capture the sustainability-linked added value needed to offset abatement costs. Consequently, aggressive carbon regulation tends to fragment the supply chain unless platforms lower commissions to compensate manufacturers.
  • Thresholds for long-term cooperation addressing RQ3. Long-term strategic cooperation (1,1) is highly sensitive to initial conditions. Our numerical analysis identifies a critical threshold for consumer sensitivity ( δ ). Below this threshold ( δ 0.85 ), the system remains trapped in non-green equilibria or unilateral encroachment despite regulatory pressure. A synchronized transition to the joint green state requires δ to exceed this tipping point, indicating that policy interventions must prioritize consumer awareness alongside corporate taxation.

6.1. Managerial and Policy Implications

For platform managers, this study recommends reframing sustainability investments. Instead of viewing green logistics solely as a compliance cost, managers should evaluate it as a retention strategy. If the threat of encroachment is high due to low consumer sensitivity or high carbon prices, investing in electric vehicle fleets can be more effective than lowering commission rates to retain merchants. The simulation confirms that platform-led sustainability can stabilize the channel even when commission rates remain moderate.
For policymakers, the results highlight a risk of regulatory fragmentation. Aggressive cap-and-trade policies without supporting logistics subsidies may force manufacturers to build redundant and inefficient direct-to-consumer channels solely to capture margins. Policy designs should encourage platform-led sustainability where economies of scale in green logistics can be leveraged across multiple manufacturers. To avoid the non-green equilibrium, subsidies should be conditional on joint participation to push the system past the critical consumer sensitivity threshold.

6.2. Limitations and Future Research

This study relies on linear demand functions and a fixed carbon price parameter. Future research could explore non-linear demand structures, model the carbon trading market as a dynamic third player, or examine the competition between multiple manufacturers on a shared platform to better reflect the reality of ecosystems like Amazon or JD.com. Additionally, the assumption that consumers value the agency channel less than the reselling channel ( ϕ < 1 ) specifically reflects the context of SMEs. Future work could relax this assumption to investigate scenarios involving high-equity brands where the direct channel may command a premium ( ϕ > 1 ). Finally, incorporating endogenous consumer awareness where sensitivity evolves over time would provide deeper insights into the long-term viability of green supply chains.


Author Contributions

Conceptualization, A.A. and Y.H.; methodology, A.A.; software, A.A.; validation, A.A. and Y.H.; formal analysis, A.A.; investigation, A.A.; resources, A.A.; data curation, A.A.; writing—original draft preparation, A.A.; writing—review and editing, Y.H.; visualization, A.A.; supervision, Y.H.; project administration, Y.H.; funding acquisition, Y.H. All authors have read and agreed to the published version of the manuscript.

Funding

This work is supported by the National Natural Science Foundation of China (Nos. 72171047 and 72571062).

Data Availability Statement

The original contributions presented in this study are included in the article. Further inquiries can be directed to the corresponding author.

Conflicts of Interest

The authors declare no conflicts of interest.

Abbreviations

The following abbreviations are used in this manuscript:
EGTEvolutionary Game Theory
ESSEvolutionarily Stable Strategy
NESNon-Encroachment Strategy
ESEncroachment Strategy
CFConventional Fulfillment
SFSustainable Fulfillment
MManufacturer(s)
EE-commerce platform(s)
NES-CFNon-Encroachment with Conventional Fulfillment
NES-SFNon-Encroachment with Sustainable Fulfillment
ES-CFEncroachment with Conventional Fulfillment
ES-SFEncroachment with Sustainable Fulfillment

Appendix A. Stackelberg Game Solutions

Appendix A.1. Proof of NES-CF

The Stackelberg game is solved in two stages: the platform chooses P r to maximize π r , then the manufacturer chooses w and g to maximize π m given P r . First-order conditions yield the unique equilibrium ( P r * , w * , g * ) and corresponding profits. The Hessians for NES-CF are:
H π m ( w , g ) = 1 m + δ 2 m + δ 2 k + m δ , H π r ( P r ) = 2 .
Principal minors confirm concavity if k > 0 and 4 k ( m + δ ) 2 > 0 . Similar conditions hold for NES-SF, ES-CF, and ES-SF, summarized as:
k > max ( m + δ ) 2 4 , ( m + δ α δ ) 2 2 ( 1 α ) ϕ .

Appendix A.2. Optimal Solutions for All Scenarios

For the NES-CF scenario, the optimal decision variables are derived analytically as follows:
d r * = k k m θ 4 k ( m + δ ) 2 , w * = 2 k ( 1 + m θ ) m ( m + δ ) ( 1 + δ θ ) 4 k ( m + δ ) 2 , g * = ( m + δ ) ( 1 + m θ ) 4 k + ( m + δ ) 2 , P r * = k ( 3 + m θ ) m ( m + δ ) ( 1 + δ θ ) 4 k ( m + δ ) 2 , π m NES - CF = 2 m Q ( m + δ ) 2 + k ( 1 + 8 m Q 2 m θ + m 2 θ 2 ) 8 k 2 ( m + δ ) 2 , π r NES - CF = k 2 ( 1 + m θ ) 2 4 k + ( m + δ ) 2 2 .
For the ES-CF scenario, the optimal decision variables are:
d r * = 1 4 , d a * = m 2 2 m ( 1 + α ) δ + 2 k θ + ( 1 + α ) ( 1 + α ) δ 2 2 k ϕ 4 m 2 2 m ( 1 + α ) δ + ( 1 + α ) ( 1 + α ) δ 2 + 2 k ϕ , w * = 1 + 2 m θ ϕ 2 ( m θ + ( 1 + α ) ϕ ) m ( m + δ α δ ) + k ( 1 + α ) ϕ ( m + δ α δ ) 2 + 2 k ( 1 + α ) ϕ , P a * = k ( 1 + α ) ϕ 2 + m 2 ( δ θ + ϕ ) m ( 1 + α ) δ 2 θ + ( 1 + α ) δ ϕ + k θ ϕ m 2 2 m ( 1 + α ) δ + ( 1 + α ) ( 1 + α ) δ 2 + 2 k ϕ , g * = ( m + δ α δ ) ( m θ + ( 1 + α ) ϕ ) m 2 2 m ( 1 + α ) δ + ( 1 + α ) ( 1 + α ) δ 2 + 2 k ϕ , P r * = 3 ( 1 ϕ ) 4 + m δ ( m + δ α δ ) θ + m ( m + δ α δ k θ ) ϕ + k ( 1 + α ) ϕ 2 ( m + δ α δ ) 2 + 2 k ( 1 + α ) ϕ , π m ES - CF = 1 + 8 m Q ϕ 8 k ( m θ + ( 1 + α ) ϕ ) 2 2 ( m + δ α δ ) 2 + 4 k ( 1 + α ) ϕ , π r ES - CF = 1 ϕ 16 + k α ( m θ + ( 1 + α ) ϕ ) 2 m ( m + δ α δ ) + k ( 1 + α ) ϕ ( 1 + α ) ( m + δ α δ ) 2 + 2 k ( 1 + α ) ϕ 2 + k m α θ m θ + ϕ α ϕ ( 1 + α ) ( m + δ α δ ) 2 + 2 k ( 1 + α ) ϕ .
For the NES-SF scenario, the optimal decision variables are:
d r * = k 1 t + s δ m θ 4 k ( m + δ ) 2 , w * = 2 k 1 t + s δ + m θ m ( m + δ ) 1 t + s δ + δ θ 4 k ( m + δ ) 2 , g * = ( m + δ ) 1 + t s δ + m θ 4 k + ( m + δ ) 2 , P r * = k 3 + t + 3 s δ + m θ ( m + δ ) m + m s δ + t δ + m δ θ 4 k ( m + δ ) 2 , π m NES - SF = 2 m Q ( m + δ ) 2 + k 8 m Q + ( 1 t + s δ ) 2 + 2 m ( 1 + t s δ ) θ + m 2 θ 2 8 k 2 ( m + δ ) 2 , π r NES - SF = k 2 1 + t s δ + m θ 2 4 k + ( m + δ ) 2 2 .
For the ES-SF scenario, the optimal decision variables are:
d r * = 1 + t s δ + ϕ 4 ( 1 + ϕ ) , d a * = 1 t + s δ ϕ 4 ( 1 + ϕ ) + k m θ + k ( 1 + α ) ϕ ( m + δ α δ ) 2 + 2 k ( 1 + α ) ϕ , w * = 1 t + s δ + m θ α ϕ 2 ( m 2 ( 1 + α ) 2 δ 2 ) ( m θ + ( 1 + α ) ϕ ) 2 ( m + δ α δ ) 2 + 4 k ( 1 + α ) ϕ , P a * = k ( 1 + α ) ϕ 2 + m 2 ( δ θ + ϕ ) m ( 1 + α ) δ 2 θ + ( 1 + α ) δ ϕ + k θ ϕ m 2 2 m ( 1 + α ) δ + ( 1 + α ) ( 1 + α ) δ 2 + 2 k ϕ , g * = ( m + δ α δ ) ( m θ + ( 1 + α ) ϕ ) m 2 2 m ( 1 + α ) δ + ( 1 + α ) ( 1 + α ) δ 2 + 2 k ϕ , P r * = 3 + t + 3 s δ 3 ϕ 4 + m δ ( m + δ α δ ) θ + m ( m + δ α δ k θ ) ϕ + k ( 1 + α ) ϕ 2 ( m + δ α δ ) 2 + 2 k ( 1 + α ) ϕ , π m ES - SF = m Q t 2 + s 2 δ 2 2 t ( 1 + s δ ϕ ) 2 s δ ( 1 + ϕ ) + ( 1 + ϕ ) ( 1 + 4 k θ 2 + ϕ ) 8 ( 1 + ϕ ) + k ( 1 + α ) ( 1 + α ) δ 2 θ 2 2 m θ ( δ θ + ϕ ) + ϕ ( 2 k θ 2 + ϕ α ϕ ) 2 ( m + δ α δ ) 2 + 4 k ( 1 + α ) ϕ , π r ES - SF = t 2 + s 2 δ 2 2 t ( 1 + s δ ϕ ) 2 s δ ( 1 + ϕ ) ( 1 + ϕ ) ( 1 ϕ + 4 α ϕ ) 16 ( 1 + ϕ ) + α ( m 2 θ 2 + ( ( m + ( 1 + α ) δ ) ( m + δ α δ ) 3 ( m θ + ( 1 + α ) ϕ ) 2 ) / ( ( m + δ α δ ) 2 + 2 k ( 1 + α ) ϕ ) 2 ) 4 ( 1 + α ) 2 ϕ + α ( m + δ α δ ) ( m θ + ( 1 + α ) ϕ ) ( m 2 θ + ( 1 + α ) 2 δ ϕ ) 2 ( 1 + α ) 2 ϕ ( m + δ α δ ) 2 + 2 k ( 1 + α ) ϕ .

Appendix B. Evolutionary Game Analysis

Appendix B.1. Proof of Equilibrium Points (Proposition 1)

If we solve for x ˙ = 0 and y ˙ = 0 in the replicator dynamic system defined by Equations (9) and (10), it is evident that x = 0 or 1 and y = 0 or 1 are clear solutions. Hence, the first four equilibrium points ( 0 , 0 ) , ( 0 , 1 ) , ( 1 , 0 ) , ( 1 , 1 ) have been demonstrated to be true.
Concerning the fifth equilibrium point (the interior solution), if either the manufacturer or the platform possesses a dominant strategy, then the fitness function of the dominant strategy would always be greater than the other strategy. This would lead to the fitness differentials ( F m , E S F m , N E S ) or ( F r , S F F r , C F ) being consistently positive or negative, driving the system to the boundaries.
However, when no strategy holds dominance for either the manufacturer or the platform (i.e., the fitness differential can be zero), an interior equilibrium exists. We let the fitness differential functions equal 0:
y ( π m ES - SF π m ES - CF π m NES - SF + π m NES - CF ) + π m ES - CF π m NES - CF = 0 ,
x ( π r ES - SF π r NES - SF π r ES - CF + π r NES - CF ) + π r NES - SF π r NES - CF = 0 .
Solving these linear equations yields the interior coordinates y j * and x i * , respectively, as presented in Proposition 1. This point ( x i * , y j * ) constitutes a valid equilibrium only when 0 < x i * < 1 and 0 < y j * < 1 .

Appendix B.2. Proof of ESS Conditions for (0,0)

Stability of the equilibrium ( 0 , 0 ) requires det ( J ) > 0 and tr ( J ) < 0 , with
det ( J ) = π m ES - CF π m NES - CF π r NES - SF π r NES - CF ,
tr ( J ) = π m ES - CF + π r NES - SF π m NES - CF π r NES - CF .
Local stability requires the following inequalities to hold:
π r NES - SF < π r NES - CF = k 2 ( t s δ ) 2 + t s δ + 2 m θ 4 k + ( m + δ ) 2 2 < 0 ,
π m ES - CF < π m NES - CF = N D < 0 ,
where
N = 4 k m 2 α δ 2 m ( 2 + α ) δ + 2 k ( 2 + ϕ α ϕ ) θ 2 + 8 k m ( m + δ α δ ) 2 + ( α 1 ) 2 k + ( m + δ ) 2 ϕ θ + ( m + δ ) 2 ( m + δ α δ ) 2 ( ϕ 1 ) 8 k 2 ( α 1 ) ( 2 α 1 ) ϕ 2 + 2 k ϕ ( 1 + α ) m 2 + 2 ( α 1 ) m δ ( α 1 ) ( 2 α 1 ) δ 2 + ( α 1 ) ( 2 α 1 ) ( m + δ ) 2 ϕ ,
D = 8 4 k ( m + δ ) 2 ( m + δ α δ ) 2 2 k ( 1 α ) ϕ .
The first inequality (A5) is satisfied whenever s δ < t . The second inequality depends on the quadratic form of N in θ , with discriminant
Δ = 16 k m 2 4 k ( m + δ ) 2 ( m + δ α δ ) 2 + 2 k ( 1 + α ) ϕ × 2 m α δ ( 1 ϕ ) 2 k ( 1 ϕ ) ϕ + 2 α ( 1 ϕ ) ( δ 2 + 3 k ϕ ) + α 2 ( δ 2 δ 2 ϕ 4 k ϕ 2 ) .
If Δ < 0 (which occurs when 3 α < 1 , ϕ < 1 3 α 1 3 α + 2 α 2 , and k > α δ ( 2 m ( 2 + α ) δ ) ( 1 ϕ ) 2 ϕ ( 1 3 α ( 1 ϕ ) + ϕ + 2 α 2 ϕ ) ), then the quadratic has no real roots. Under these conditions, the leading coefficient is negative, so N < 0 for all θ , and inequality (A6) fails, making local stability impossible. Otherwise, when Δ 0 , stability requires θ to fall within the range defined by the real roots θ 1 and θ 2 . Thus, the ESS conditions for ( 0 , 0 ) are s δ < t , θ 1 < θ < θ 2 , and specific conditions on k and α listed in Proposition 2. The ESS conditions for the other equilibria ( 1 , 0 ) , ( 0 , 1 ) , and ( 1 , 1 ) are derived in a similar manner.
The threshold parameters θ 1 , θ 2 , θ 3 , θ 4 represent the critical carbon intensity levels where regulatory costs flip the manufacturer’s profitability between strategies.

Appendix B.3. Threshold Values

ϕ 1 = 1 3 α 1 3 α + 2 α 2 , k 1 = α δ ( 2 m ( 2 + α ) δ ) 4 + 2 ( 1 α ) ϕ , k 2 = α δ ( 2 m ( 2 + α ) δ ) ( 1 ϕ ) 2 ϕ ( 1 3 α ( 1 ϕ ) + ϕ + 2 α 2 ϕ ) , k 3 = α δ ( 2 m ( 2 + α ) δ ) ( 1 + t s δ + ϕ ) 2 4 α 2 ( 1 ϕ ) ϕ 2 + 2 ϕ ( 1 + t s δ + ϕ ) 2 + 2 α ϕ ( t 2 + s 2 δ 2 + 2 s δ ( 1 ϕ ) 3 ( 1 ϕ ) 2 2 t ( 1 + s δ ϕ ) ) , t 1 = s ( 1 + α ) δ + ( α 1 ) ( 1 ϕ ) 2 α ( 1 ϕ ) ( 2 + ( α 1 ) ϕ ) 1 + α , t 2 = 1 ϕ + α ( 1 ϕ 2 ( 1 ϕ ) ( 2 + ( α 1 ) ϕ ) ) 1 + α , θ 1 = k m 2 E 1 ( 4 k ( δ + m ) 2 ) [ 2 ( α 1 ) k ϕ + ( α δ + δ + m ) 2 ] 2 k m [ ( α 1 ) ϕ ( ( δ + m ) 2 2 k ) + ( α δ + δ + m ) 2 ] 2 k m 2 [ 2 k ( ( α 1 ) ϕ + 2 ) + α δ ( ( α 2 ) δ 2 m ) ] , θ 2 = k m 2 E 1 ( 4 k ( δ + m ) 2 ) [ 2 ( α 1 ) k ϕ + ( α δ + δ + m ) 2 ] + 2 k m [ ( α 1 ) ϕ ( ( δ + m ) 2 2 k ) + ( α δ + δ + m ) 2 ] 2 k m 2 [ 2 k ( ( α 1 ) ϕ + 2 ) + α δ ( ( α 2 ) δ 2 m ) ] , θ 3 = k m 2 ( 4 k ( m + δ ) 2 ) E 2 ( 1 ϕ ) [ ( m + δ α δ ) 2 + 2 k ( 1 α ) ϕ ] 2 k m ( 1 ϕ ) [ ( 1 + t s δ ) ( m + δ α δ ) 2 ( 1 α ) ( ( m + δ ) 2 2 k ( 1 + t s δ ) ) ϕ ] 2 k m 2 ( 1 ϕ ) [ α δ ( 2 m + ( 2 + α ) δ ) + 2 k ( 2 + ( α 1 ) ϕ ) ] , θ 4 = k m 2 ( 4 k ( m + δ ) 2 ) E 2 ( 1 ϕ ) [ ( m + δ α δ ) 2 + 2 k ( 1 α ) ϕ ] + 2 k m ( 1 ϕ ) [ ( 1 + t s δ ) ( m + δ α δ ) 2 ( 1 α ) ( ( m + δ ) 2 2 k ( 1 + t s δ ) ) ϕ ] 2 k m 2 ( 1 ϕ ) [ α δ ( 2 m + ( 2 + α ) δ ) + 2 k ( 2 + ( α 1 ) ϕ ) ] , E 1 = 2 m α δ ( 1 ϕ ) 2 k ( 1 ϕ ) ϕ + 2 α ( 1 ϕ ) ( δ 2 + 3 k ϕ ) + α 2 ( δ 2 δ 2 ϕ 4 k ϕ 2 ) , E 2 = α δ ( 1 t + s δ ) 2 ( 2 m + ( 2 + α ) δ ) + 2 ( 1 + t s δ ) [ α δ ( 2 m + ( 2 + α ) δ ) + k ( 1 + t + 3 α + t α s ( 1 + α ) δ ) ] ϕ + [ α δ ( 2 m + ( 2 + α ) δ ) 4 k ( 1 + t ( 1 + α ) + s δ + α ( 3 + α s δ ) ) ] ϕ 2 + 2 k ( 1 + α ) ( 1 + 2 α ) ϕ 3 .
Note: E 1 and E 2 are auxiliary terms.

References

  1. Durand-Hayes, S.; Gooding, M.; Crane, B. Voice of the Consumer Survey 2024: Shrinking the Consumer Trust Deficit; Technical Report; PwC: London, UK, 2024. [Google Scholar]
  2. Xu, X.; Zhang, M.; Chen, L.; Yu, Y. The Region-Cap Allocation and Delivery Time Decision in the Marketplace Mode under the Cap-and-Trade Regulation. Int. J. Prod. Econ. 2022, 247, 108407. [Google Scholar] [CrossRef]
  3. Case, P. Sustainability Practices. 2025. Available online: https://pelacase.com/pages/sustainability-practices (accessed on 12 October 2025).
  4. Amazon. E-Bikes and on-Foot Deliveries: Watch How Amazon Packages Reach Customers in New York City. 2024. Available online: https://www.aboutamazon.com/news/transportation/amazon-delivery-new-york-nyc (accessed on 1 May 2025).
  5. Quynh, D.D. Greener Logistics for a Booming E-Commerce Industry. 2024. Available online: https://lot.dhl.com/more-sustainable-logistics-booming-e-commerce-industry/ (accessed on 10 August 2025).
  6. Zhang, C.; Li, Y.; Ma, Y. Direct Selling, Agent Selling, or Dual-Format Selling: Electronic Channel Configuration Considering Channel Competition and Platform Service. Comput. Ind. Eng. 2021, 157, 107368. [Google Scholar] [CrossRef]
  7. Wang, W.; Feng, L.; Chen, X.; Yang, L.; Choi, T.M. Impacts of Selling Models: Who Should Offer Trade-in Programs in E-Commerce Supply Chains? Transp. Res. Part E Logist. Transp. Rev. 2024, 186, 103524. [Google Scholar] [CrossRef]
  8. Yang, M. Green Investment and E-Commerce Sales Mode Selection Strategies with Cap-and-Trade Regulation. Comput. Ind. Eng. 2023, 177, 109036. [Google Scholar] [CrossRef]
  9. Ha, A.Y.; Tong, S.; Wang, Y. Channel Structures of Online Retail Platforms. Manuf. Serv. Oper. Manag. 2022, 24, 1547–1561. [Google Scholar] [CrossRef]
  10. James, D. Allbirds Begins Selling on Amazon|Retail Dive. 2023. Available online: https://www.retaildive.com/news/allbirds-begins-selling-on-amazon-dtc/700694/ (accessed on 10 May 2025).
  11. Kang, K.; Tan, B.Q. Carbon Emission Reduction Investment in Sustainable Supply Chains under Cap-and-Trade Regulation: An Evolutionary Game-Theoretical Perspective. Expert Syst. Appl. 2023, 227, 120335. [Google Scholar] [CrossRef]
  12. Guo, L.; Zhang, Q.; Wu, J.; Santibanez Gonzalez, E.D. An Evolutionary Game Model of Manufacturers and Consumers’ Behavior Strategies for Green Technology and Government Subsidy in Supply Chain Platform. Comput. Ind. Eng. 2024, 189, 109918. [Google Scholar] [CrossRef]
  13. Hagiu, A.; Wright, J. Marketplace or Reseller? Manag. Sci. 2015, 61, 184–203. [Google Scholar] [CrossRef]
  14. Ha, A.Y.; Luo, H.; Shang, W. Supplier Encroachment, Information Sharing, and Channel Structure in Online Retail Platforms. Prod. Oper. Manag. 2022, 31, 1235–1251. [Google Scholar] [CrossRef]
  15. Yu, L.; Xu, H.; Zhang, Z. Dynamic Decision-Making of the e-Commerce Supply Chain Considering Greenwashing and Sales Format. Socio-Econ. Plan. Sci. 2025, 98, 102170. [Google Scholar] [CrossRef]
  16. Zhou, H.; Duan, Y. Online Channel Structures for Green Products with Reference Greenness Effect and Consumer Environmental Awareness (CEA). Comput. Ind. Eng. 2022, 170, 108350. [Google Scholar] [CrossRef]
  17. He, P.; He, Y.; Tang, X.; Ma, S.; Xu, H. Channel Encroachment and Logistics Integration Strategies in an E-Commerce Platform Service Supply Chain. Int. J. Prod. Econ. 2022, 244, 108368. [Google Scholar] [CrossRef]
  18. Xu, X.; He, P.; Xu, H.; Zhang, Q. Supply Chain Coordination with Green Technology under Cap-and-Trade Regulation. Int. J. Prod. Econ. 2017, 183, 433–442. [Google Scholar] [CrossRef]
  19. Ji, J.; Zhang, Z.; Yang, L. Carbon Emission Reduction Decisions in the Retail-/Dual-Channel Supply Chain with Consumers’ Preference. J. Clean. Prod. 2017, 141, 852–867. [Google Scholar] [CrossRef]
  20. Taleizadeh, A.A.; Adeli, M.; Abedsoltan, H. Sustainability, Pricing and Marketing in a Dual Channel Supply Chain with Different Retailing Scenarios and Carbon Emission Reduction. J. Clean. Prod. 2025, 496, 145149. [Google Scholar] [CrossRef]
  21. Lyu, R.; Zhang, C.; Li, Z.; Li, Y. Manufacturers’ Integrated Strategies for Emission Reduction and Recycling: The Role of Government Regulations. Comput. Ind. Eng. 2022, 163, 107769. [Google Scholar] [CrossRef]
  22. Ghalehkhondabi, I.; Maihami, R.; Ahmadi, E.; Fallahtafti, A. Saving Money and the Environment: Studying Pricing Problem in Sustainable Third-Party Logistics with Green and Marketing Initiatives Using Game Theory. Int. J. Syst. Sci. Oper. Logist. 2024, 11, 2314543. [Google Scholar] [CrossRef]
  23. Liu, K.; Li, W.; Jia, F.; Lan, Y. Optimal Strategies of Green Product Supply Chains Based on Behaviour-Based Pricing. J. Clean. Prod. 2022, 335, 130288. [Google Scholar] [CrossRef]
  24. Zhang, C.; Xu, Y.; Zheng, Y. Blockchain Traceability Adoption in Low-Carbon Supply Chains: An Evolutionary Game Analysis. Sustainability 2024, 16, 1817. [Google Scholar] [CrossRef]
  25. Sun, H.; Wang, K.; Du, X. Cooperative emission reduction behaviour of supply chain enterprises under cap-and-trade and government subsidies. Environ. Dev. Sustain. 2025, 27, 2549–2579. [Google Scholar] [CrossRef]
  26. Hofbauer, J.; Sigmund, K. Evolutionary Games and Population Dynamics, 1st ed.; Cambridge University Press: Cambridge, UK, 1998. [Google Scholar] [CrossRef]
  27. Lyu, R.; Zhang, C.; Li, Z. Optimal Strategies of Green Express Packaging Recycling and Sales Mode in an Online Platform. J. Clean. Prod. 2023, 390, 136090. [Google Scholar] [CrossRef]
  28. Mussa, M.; Rosen, S. Monopoly and product quality. J. Econ. Theory 1978, 18, 301–317. [Google Scholar] [CrossRef]
Figure 1. Model Overview: Strategic Interactions between Manufacturers and E-commerce Platforms.
Mathematics 14 00172 g001
Figure 2. Comprehensive phase diagrams and trajectory plots for all equilibrium points. (a) Phase: ( 0 , 0 ) . (b) x-trajectory: ( 0 , 0 ) . (c) y-trajectory: ( 0 , 0 ) . (d) Phase: ( 1 , 0 ) . (e) x-trajectory: ( 1 , 0 ) . (f) y-trajectory: ( 1 , 0 ) . (g) Phase: ( 0 , 1 ) . (h) x-trajectory: ( 0 , 1 ) . (i) y-trajectory: ( 0 , 1 ) . (j) Phase: ( 1 , 1 ) . (k) x-trajectory: ( 1 , 1 ) . (l) y-trajectory: ( 1 , 1 ) .
Mathematics 14 00172 g002aMathematics 14 00172 g002b
Figure 3. Impact of commission rate ( α ) on evolutionary trajectories. Top row: Conventional fulfillment. Bottom row: Sustainable fulfillment. Lower commissions accelerate encroachment (x) across both scenarios.
Mathematics 14 00172 g003
Figure 4. Impact of consumer sensitivity ( δ ). High sensitivity synchronizes the transition to the green equilibrium (1,1), particularly enhancing the platform’s speed of adoption (y) in the sustainable scenario (d).
Mathematics 14 00172 g004
Figure 5. Impact of carbon price (m). High regulatory costs force manufacturer encroachment (left column) but dampen the platform’s speed of sustainable investment (right column) due to reduced profitability.
Mathematics 14 00172 g005
Figure 6. Strategic stability regions. Green regions indicate manufacturer encroachment ( x 1 ). Blue regions indicate non-encroachment ( x 0 ).
Mathematics 14 00172 g006
Table 1. Comparison of this study with related literature.
Author(s)MethodContextKey FocusGap Filled by This Study
Ha et al. [9]Static gamePlatform encroachmentImpact of service effort on agency sellingIgnores environmental externalities
Xu et al. [18]Static gameGreen supply chainCap-and-trade pricing coordinationIgnores platform logistics and dynamics
Wang et al. [7]Static gameE-commerce channelsSelling models & Trade-in programsStatic analysis; ignores carbon regulation
Liu et al. [23]EGTGreen supply chainGovernment subsidy strategiesFocuses on Gov-Firm; ignores channel conflict
Sun et al. [25]EGTCooperative supply chainEmission reduction under Cap-and-TradeFocuses on supplier-Mfg; ignores platform
Kang and Tan [11]EGTSustainable supply chainFree-riding under Cap-and-TradeIgnores platform agency selling dynamics
Guo et al. [12]EGTPlatform ecosystemGreen technology & consumer subsidiesTreats platform as passive; ignores logistics
This studyEGTGreen platform supply chainEncroachment & green logisticsIntegrates EGT, platform logistics, and carbon regulations
Table 2. Model Parameters and Decision Variables.
SymbolDefinition
Parameters
mCarbon price
θ Initial carbon emissions per unit
dTotal market size (normalized to 1)
QAllocated carbon quota
kScaling coefficient for abatement cost
vPerceived value of the product
α Commission rate for the agency channel
ϕ Value discount factor for agency channel ( 0 < ϕ < 1 )
δ Demand sensitivity to sustainability
tUnit cost to achieve sustainable effort s
sPlatform’s sustainable fulfillment effort
Decision Variables
gManufacturer’s carbon abatement per unit ( 0 g θ )
P r Retail price (reselling channel)
P a Agency price (direct channel)
wWholesale price
xProportion of manufacturers adopting ES
yProportion of platforms adopting SF
Table 3. Determinant and trace of J at the equilibrium points.
Equilibrium ( x * , y * ) det ( J ) tr ( J )
( 0 , 0 ) ( π m E S , C F π m N E S , C F ) ( π r N E S , S F π r N E S , C F ) π m E S , C F π m N E S , C F π r N E S , C F + π r N E S , S F
( 1 , 0 ) ( π m E S , C F π m N E S , C F ) ( π r E S , S F π r E S , C F ) π m E S , C F + π m N E S , C F π r E S , C F + π r E S , S F
( 0 , 1 ) ( π m E S , S F π m N E S , S F ) ( π r N E S , S F π r N E S , C F ) π m E S , S F π m N E S , S F + π r N E S , C F π r N E S , S F
( 1 , 1 ) ( π m E S , S F π m N E S , S F ) ( π r E S , S F π r E S , C F ) π m E S , S F + π m N E S , S F + π r E S , C F π r E S , S F
Interior ( x i * , y j * ) ( π m E S , C F π m N E S , C F ) ( π m E S , S F π m N E S , S F ) · ( π r E S , S F π r E S , C F ) ( π r N E S , S F π r N E S , C F ) ( π m E S , C F + π m E S , S F + π m N E S , C F π m N E S , S F ) · ( π r E S , C F + π r E S , S F + π r N E S , C F π r N E S , S F ) 0
Disclaimer/Publisher’s Note: The statements, opinions and data contained in all publications are solely those of the individual author(s) and contributor(s) and not of MDPI and/or the editor(s). MDPI and/or the editor(s) disclaim responsibility for any injury to people or property resulting from any ideas, methods, instructions or products referred to in the content.