Abstract
This study investigates a novel modification for a modified Weibull distribution called the new modification of modified Weibull distribution. Some distributions related to the NMMWD are given. Some characterization of the NMMWD, including quantiles, Bowley skewness, Moors kurtosis, and moments, are given in closed forms. The hazard rate function of the new distribution takes two distinct shapes, the increasing and the bathtub shapes. Different estimating approaches are investigated utilizing complete data. Three real data sets from the engineering field are analyzed to demonstrate the suggested model’s flexibility in practice. In comparison to certain well-known distributions, the proposed distribution fits the tested data better according to both parametric and non-parametric tests. A simulation study is presented to compare the various estimating approaches using mean square error and average absolute bias.
Keywords:
modified Weibull distribution; different estimation methods; application to real life data; bathtub hazard rate MSC:
62F10; 60E05
1. Introduction
Highly elastic statistical distributions that are consistent with data from many real-life problems have become essential for statisticians. Therefore, many statisticians have developed a number of generalizations, modifications, and distributions that are highly elastic and fit well with various real-life data. Consequently, there are many statistical distributions, making it easier for researchers to choose the appropriate distribution to model various data across a wide range of fields.
The Weibull distribution [1] is widely employed in various sectors, including the medical sector, engineering, and industry. It has the limitation of being unable to describe the complex lifetime of some systems due to a lack of bathtub-shaped or unimodal-shaped hazard rate functions. Therefore, several authors have proposed some modifications to the Weibull distribution to overcome this problem.
Many authors have presented extensions to distributions including [2,3,4,5] (for more details, see [6]), with the same cumulative distribution function as [7], which is in the form , where is monotone increasing function. Ref. [6] suggested a new distribution with . Recently, based on the idea given by [7], several authors, including [8,9,10,11,12], proposed and investigated other generalizations and distributions with high flexibility and different properties.
The main objective of this study is to present and investigate a new modification of the Weibull distribution called the new modification of modified Weibull distribution (NMMWD) based on the idea presented in [7], where . This distribution is also a generalization of the modified Weibull distribution.
The aims listed below provide compelling reasons for the significance of the suggested distribution.
- To present and study the various properties and potential uses of a new modification of the modified Weibull distribution.
- To calculate certain characteristics including, quantiles, Bowley skewness, Moors kurtosis, and moments in explicit forms.
- To demonstrate how the hazard rate function for the new distribution might take increasing and bathtub shapes.
- To study several estimation techniques for the unknown parameters of the new distribution using complete data.
- To demonstrate the importance of the new distribution in the field of engineering using different estimation techniques based on complete data.
- To verify the effectiveness of different estimation techniques used to estimate the distribution parameters using a simulation study based on complete data.
This research is presented in seven sections, each section focusing on one of the characteristics of the new distribution. Section 2 presents the basic structure of the NMMWD in detail. Some statistical properties are calculated in Section 3. Section 4 investigates the behavior of the hazard rate function for NMMWD. The different estimation techniques of the parameters of NMMWD are presented in Section 5. In Section 6, the applications to three real data sets are presented to show the importance of the NMMWD in engineering field. A simulation study is performed in Section 7 to evaluate and compare the performance of various estimation techniques. Finally, the main findings of the paper are summarized in Section 8.
2. The New Modification of the Modified Weibull Distribution
The cumulative distribution function (CDF) of NMMWD with parameter vector can be given by multiplying the cumulative hazard rate function for Weibull distribution by the component
where is the scale parameter, and and are the shape parameters.
Thus the probability density function (PDF), the survival function (SF), and the hazard rate function (HRF) of NMMWD are respectively given by
and
Some possible shapes for the PDF of NMMWD are shown in Figure 1. Based on different values of parameters, the PDF of NMMWD can be decreasing, modified bathtub and unimodal. Figure 2a shows the shapes for the CDF of NMMWD and Figure 2b shows the shapes for the survival function of the NMMWD with different values of NMMWD parameters.
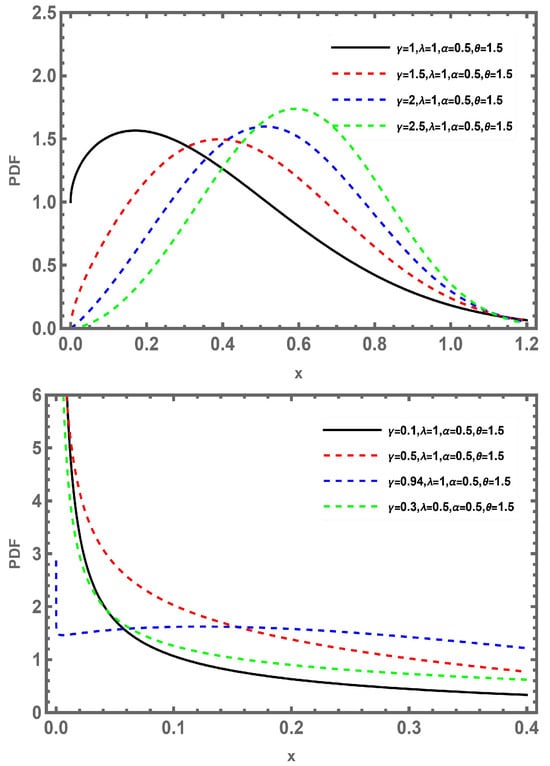
Figure 1.
The PDFs of NMMWD with different values of parameters.
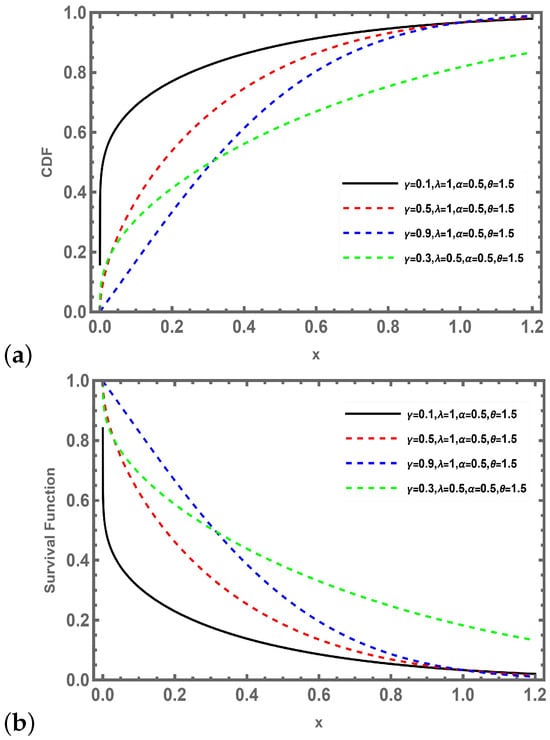
Figure 2.
(a) The CDFs of NMMWD with different paremeter values, (b) the survival functions of NMMWD with different parameter values.
Models Related to NMMWD
Considering the CDF of NMMWD given by (1), some well-known distributions can be obtained as sub-models, as shown in Table 1. Also, we can show that the GIBD (New) can be related to NMMWD as follows:
- GIBD
The SF of GBID can be given as
Let , and , then for , it is clear that . So, the SF of NMMWD can be obtained. The IBD given in [13], which is a special case of GIBD, can be related to MWD, which is a special case of the NMMWD, as shown in [2].

Table 1.
The sub-models from NMMWD.
Table 1.
The sub-models from NMMWD.
| Distribution | CDF | Reference | ||||
|---|---|---|---|---|---|---|
| MWD | - | - | - | 1 | [2] | |
| WD | - | - | 0 | - | [1] | |
| ED | - | 1 | - | 0 | [14] | |
| RD | 2 | - | 0 | [14] | ||
| E-VD | 1 | 0 | - | 1 | ||
| RNMMWD | - | - | - | New | ||
| RMWD | - | 1 | [9] |
3. Statistical Properties
This section investigates some statistical properties of NMMWD, including quantiles, Bowley skewness, Moors kurtosis, and moments. The explicit form of the quantile of the NMMWD is derived, which is important for generating random sample data from the NMMWD for simulation studies. It is also important to compute Bowley skewness and Moors kurtosis measures, which are less sensitive to outliers.
3.1. Quantiles
Lemma 1.
Let be a random variable with CDF of NMMWD defined by Equation (1). The quantile of NMMWD can be calculated as
where is the Lambert W function (for more details, see [15]).
Proof.
Upon using the CDF of NMMWD, set . Then,
By performing simple algebraic operations on (7), we obtain
By applying the definition of the Lambert W function on Equation (8), Equation (6) is obtained; see Appendix A. □
3.2. Bowley Skewness and Moors Kurtosis Measures
Assume is the quantile of NMMWD as defined by (8). As a result, the Bowley skewness (BSkew) and Moors kurtosis (Mkur) of NMMWD can be calculated, respectively, as
and
3.3. Moments
Lemma 2.
Let be a random variable with PDF of NMMWD defined by Equation (2). Then the moment of NMMWD cab be given as
where is considered as natural number, is an ordinary gamma function, is an incomplete gamma function, and (for more details, see [15]).
Proof.
Upon using (2), the moments of the NMMWD can be written as
Using the substitution , reveals that , where is the Lambert W function (for more details, see [15,16]). Using in Wolfram Mathematica 11, it is easy to show that . It is evident by ratio test for convergent that the convergent condition of can be given as , see [17]. Thus, the Formula (12) reduces to
As given in [16], page 17, it is clear that . Hence, (13) can be written as
By calculating the integral (14), the formula in (11) can be easily obtained. □
4. Behavior of the HRF Shapes
This section investigates the behavior of the HRF of NMMWD and displays the NMMWD HRF shapes, such as increasing and bathtub shapes. Considering (4), it is easy to obtain the first derivative of as
Setting in (15) yields
which is the same formula in [2] for MWD.
Lemma 3.
The HRF of NMMWD can take increasing and bathtub shapes based on the following conditions:
- 1.
- h(x;Φ) has increasing shaped from zero to infinity if .
- 2.
- h(x;Φ) has increasing shaped from λ to infinity if .
- 3.
- h(x;Φ) has bathtub shaped if .
Proof.
For , , and , the following results are satisfied.
- It is easy to prove that by L’Hospital’s rule and calculate that directly for . Also, it is clear that when and . So, has an increasing shape that goes from zero to infinity when .
- Upon taking , it is easy to prove that by L’Hospital’s rule and calculate that directly. Also, it is clear that when and . So, has increasing shaped that goes from to infinity when .
- It is evident that can be calculated by L’Hospital’s rule and can be calculated directly for . Also, based on the formula , it is clear that has two roots, given as and . Since for , so, has a unique root for , which is . Then, when and when . Hence, the hazard rate has a bathtub shape.
□
We now explicitly summarize the limiting behavior of the hazard rate function as for the three cases , , and as followss:
Using different parameter values, as described in Lemma 3, the behavior of HRF of the NMMWD can have increasing and bathtub shapes, as illustrated in Figure 3.
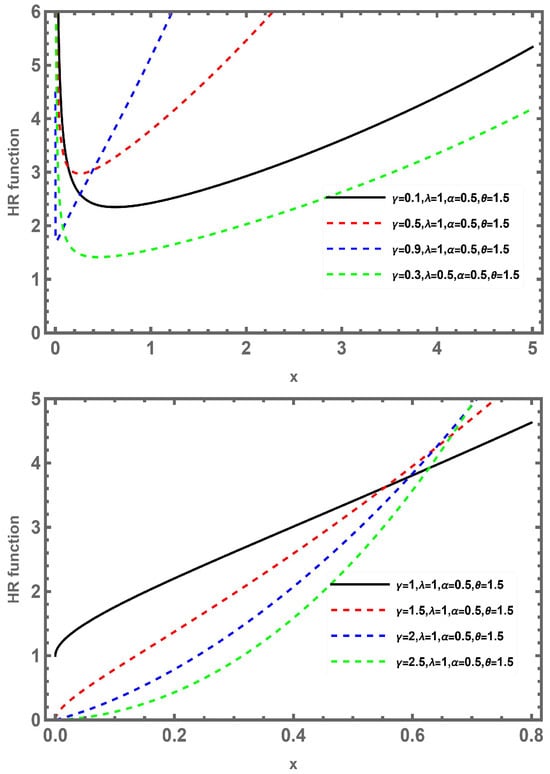
Figure 3.
The HRFs of NMMWD with different values of parameters.
5. Different Methods of Estimation
This section discusses five distinct estimation strategies applicable to NMMWD: maximum likelihood estimation (MLE), least square estimation (LSE), weighted least square estimation (WLSE), Cram–von Mises estimation (CVME), and Anderson–Darling estimation (ADE). The new model’s unknown parameters are estimated using these techniques.
5.1. Maximum Likelihood Estimation
Assume is an independent random sample of size n from NMMWD. Then the log-likelihood function can be obtained from Equation (2) as follows:
To obtain the MLE of , the following first partial derivative of (16) with regard to , , and are calculated.
and
5.2. The Parameters , , and Are Known
5.3. The Parameters , , , and Are Unknown
Setting the expressions , , , and to zero and solving them yields the MLE of . Since nonlinear equations are not analytically solvable, a numerical method like the Newton–Raphson algorithm can be used by employing FindRoot in software Wolfram Mathematica v.11.
5.4. Fisher Information Matrix
The asymptotic variance–covariance matrix can be calculated as
where , , see Appendix B. The ACIs for the parameters , , , and based on the asymptotic variance–covariance matrix are given as follows:
5.5. Least Square and Weighted Least Square Estimations
In a study by [18], LSE and WLSE were used to estimate beta distribution parameters. These approaches will be applied to estimate the parameters of NMMWD. Consider , , as the ordered sample of a random sample of size n. The LSE of the NMMWD parameters can be calculated by minimizing the following function
with regard to the unknown parameters or by solving the following non-linear equations
and
where
and
To determine the WLSE of the unknown parameters of NMMWD, minimizes a function
with regard to the unknown parameters or solve the non linear equations
and
where , , and are given by (22), (23), (24), and (25) respectively.
5.6. Cramér–Von Mises Estimation
A study by [19] found that CVME has lower bias compared to other minimum distance estimators. Obtaining the CVME for NMMWD can be done by minimizing the function
with regard to the unknown parameters or by solving the following non-linear equations
and
where , , and are given by (22), (23), (24), and (25) respectively.
5.7. Anderson–Darling Estimation
The author of [20] investigated the characteristics of ADE. According to his study, the A-DE of NMMWD can be obtained by minimizing the following function
with regard to the unknown parameters or by solving the following non-linear equations:
and
where , , and are given by (22), (23), (24), and (25) respectively.
6. Application to Real Data
In this section, three engineering real data sets are analyzed to show that the NMMWD offers enhanced flexibility for modeling these data sets better than their sub-models and some well-known distributions. We use the various estimating methods discussed in Section 5 to calculate the estimates of the NMMWD’s unknown parameters for all data sets. Initially, the proposed distribution and its sub-models, in addition to a set of well-known distributions that have bathtub hazard rate shapes summarized in Table 2, can be fitted with each data set using a non-parametric test, namely the K-S test, with its associated p-value. Next, we compare NMMWD with its sub-models and the set of well-known distributions summarized in Table 2 using three parametric tests: AIC, AICc and HQIC. Lower values for AIC, AICc and HQIC imply a better fit. All computations and graphical displays were performed using the Wolfram Mathematica 11.
Table 2.
Some well-known distributions with bathtub hazard rate shapes.
6.1. Electronic Ground Support Equipment Data
The data presented in [23], given by [24], includes 107 observed lifetimes of a unit of electronic ground support equipment. The data set, measured in hours, consists of the following values: 1.0, 6.4, 19.2, 54.2, 88.4, 114.8, 1.2, 6.8, 28.1, 55.6, 89.9, 115.1, 1.3, 6.9, 28.2, 56.4, 90.8, 117.4, 2.0, 7.2, 29.0, 58.3, 91.1, 118.3, 2.4, 7.9, 29.9, 60.2, 91.5, 119.7, 2.9, 8.3, 30.6, 63.7, 92.1, 120.6, 3.0, 8.7, 32.4, 64.6, 97.9, 121.0, 3.1, 9.2, 33.0, 65.3, 100.8, 122.9, 3.3, 9.8, 35.3, 66.2, 102.6, 123.3, 35, 10.2, 36.1, 70.1, 103.2, 124.5, 3.8, 10.4, 40.1, 71.0, 104.0, 125.8, 4.3, 11.9, 42.8, 75.1, 104.3, 126.6, 4.6, 13.8, 43.7, 75.6, 105.0, 127.7, 4.7, 14.4, 44.5, 78.4, 105.8, 128.4, 4.8, 15.6, 50.4, 79.2, 106.5, 129.2, 5.2, 16.2, 51.2, 84.1, 110.7, 129.5, 5.4, 17.0, 52.0, 86.0, 112.6, 129.9, 5.9, 17.5, 53.3, 87.9, 113.5.
Figure 4 shows that this data set first takes a convex shape and subsequently a concave shape, indicating that its hazard rate appears like a bathtub. Table 3 shows the ML estimates for the NMMWD, MWD, WD, RNMMWD, RMWD, Add-MWD, Add-WD, RNMWD, MWED, NMW3D, and MCD, as well as the accompanying K-S distance and the associated p-value, AIC, AICc and HQIC. From Table 3, it is clear that the NMMWD has the lowest AIC, AIC, AICc and HQIC values, indicating the best fit among all distributions. Figure 5 displays the estimated SF and HRF for all distributions. It should be noted that the NMMWD distribution may well model these lifetime data with bathtub-shaped HR. Table 4 summarizes the values of estimates of the un-known parameters of NMMWD and the accompanying K-S distance and the associated p-value for the five different estimation techniques proposed. It is evident from Table 4 that the CVME is the best since it has the lowest value of K-S and largest value of p-value associated to K-S test.
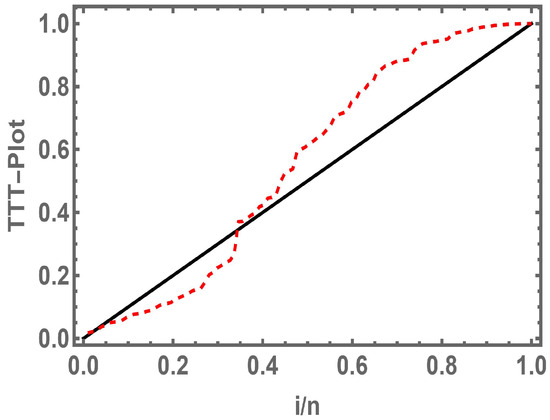
Figure 4.
The TTT-plot of the electronic ground support equipment data.
Table 3.
The ML estimates of unknown parameters, the K-S with the corresponding p-value, the AIC, the AICc and the HQIC for different models using the electronic ground support equipment data.
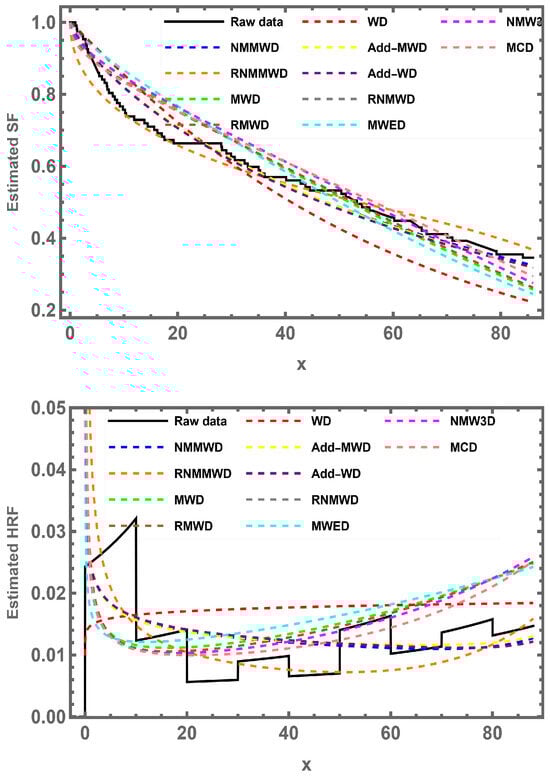
Figure 5.
Estimated SF and HRF of NMMWD for the electronic ground support equipment data.
Table 4.
The estimates of NMMWD parameters based on different methods of estimation and the K-S test with the associated p-value for the electronic ground support equipment data.
The approximate variance–covariance matrix is given by
Thus the 95% ACIs of , , , and are respectively given by {0.0084, 0.0552}, {0.6213, 0.9742}, {0.0074, 0.0079}, and {2.6556, 18.418}.
6.2. Main Rotor Blade Data
Consider the reliability measures, given by [25], using the MMIR system database collected from October 1995 to September 1999 of a helicopter main rotor blade part code xxx-015-001-107. The data set, measured in hours, consists of the following values: 1634.3, 2094.3, 3318.2, 1100.5, 2166.2, 2317.3, 1100.5, 2956.2, 1081.3, 819.9, 795.5, 1953.5, 1398.3, 795.5, 2418.5, 1181, 204.5, 1485.1, 128.7, 204.5, 2663.7, 1193.6, 1723.2, 1778.3, 254.1, 403.2, 1778.3, 3078.5, 2898.5, 2943.6, 3078.5, 2869.1, 2260, 3078.5, 26.5, 2299.2, 26.5, 26.5, 1655, 26.5, 3180.6, 1683.1, 3265.9, 644.1, 1683.1, 254.1, 1898.5, 2751.4, 2888.3, 3318.2, 2080.2, 1940.1.
Figure 6 shows that this data set first takes a convex shape and subsequently a concave shape, indicating that its hazard rate appears like a bathtub. Table 5 shows the ML estimates for the NMMWD, MWD, WD, RNMMWD, RMWD, Add-MWD, Add-WD, RNMWD, MWED, NMW3D, and MCD, as well as the accompanying K-S distance and the associated p-value, AIC, AICc and HQIC. From Table 5, it is clear that the Add-MWD, RNMMWD, and NMMWD have the lowest AIC, AICc and HQIC values, indicating the best fit among all distributions. Figure 7 displays the estimated SF and HRF for all distributions. It should be noted that the NMMWD distribution may well model these lifetime data with bathtub-shaped HR. Table 6 summarizes the values of estimates of the un-known parameters of NMMWD and the accompanying K-S distance and the associated p-value for the proposed five different estimation techniques. It is evident from Table 6 that the ADE is the best since it has the lowest value of K-S and largest value of p-value associated to K-S test.
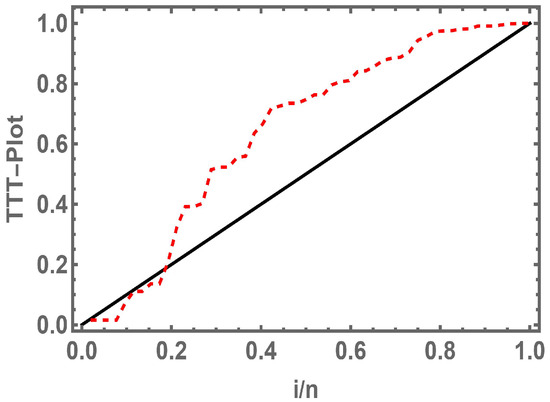
Figure 6.
The TTT-plot of the main rotor blade data.
Table 5.
The ML estimates of unknown parameters, the K-S with the corresponding p-value, the AIC, the AICc and the HQIC for different models using the main rotor blade data.
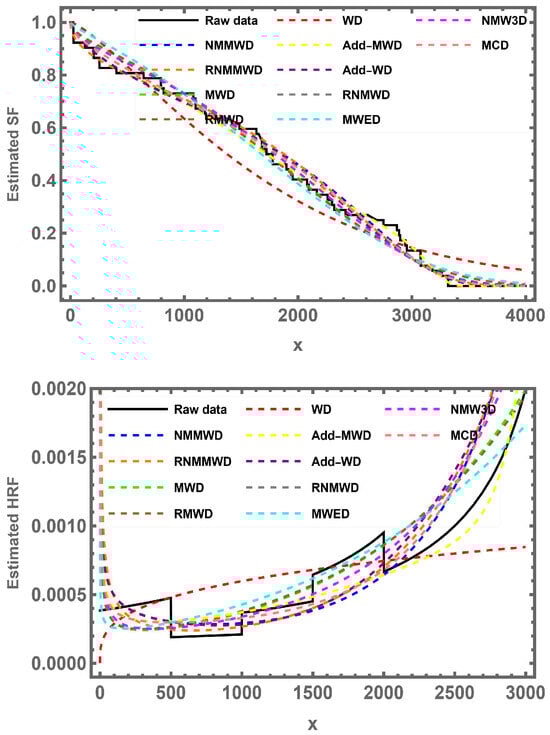
Figure 7.
Estimated SF and HRF of NMMWD for the main rotor blade data.
Table 6.
The estimates of parameters of NMMWD based on different methods of estimation and the K-S test with the associated p-value for the main rotor blade data.
The approximate variance–covariance matrix is given by
Thus the 95% ACIs of , , , and are, respectively, given by {0.0, 0.0114}, {0.2723, 1.0928}, {0.0002, 0.0004}, and {0.0, 6.2982}.
6.3. Rear Dump Truck Data
Consider the data set, given by [26] and analyzed by [27], of a 180-ton rear dump truck, which consists of 128 times to failure. The data set, measured in hours, consists of the following values: 78, 158, 331, 381, 523, 620, 664, 1805, 1817, 2068, 3253, 4489, 4725, 4961, 5138, 5200, 5278, 5711, 6400, 6444, 6677, 7999, 8001, 8489, 9000, 9086, 10,262, 10,817, 11,062, 11,082, 11,086, 11,122, 11,534, 12,031, 12,339, 12,733, 13,265, 13,508, 13,673, 13,780, 14,443, 14,501, 14,656, 14,906, 14,983, 15,004, 15,062, 15,072, 15,136, 15,206, 15,247, 15,700, 15,714, 15,972, 16,186, 16,284, 16,329, 16,425, 16,605, 16,723, 16,731, 16,797, 16,859, 17,090, 17,305, 17,484, 17,510, 17,511, 17,536, 17,621, 17,703, 17,809, 17,968, 17,984, 18,175, 18,443, 18,458, 18,667, 18,669, 18,701, 18,723, 18,822, 18,860, 18,922, 18,935, 18,945, 18,960, 18,961, 18,979, 19,013, 19,032, 19,034, 19,169, 19,184, 19,201, 19,416, 19,455, 19,525, 19,595, 19,601, 19,613, 19,643, 19,671, 19,713, 19,785, 19,801, 19,937, 19,990, 20,432, 20,433, 20,434, 20,698, 21,460, 21,543, 21,584, 21,602, 21,645, 21,706, 21,762, 21,867, 21,912, 21,914, 21,937, 21,938, 21,939, 21,951, 21,954, 21,982.
Figure 8 shows that this data set first takes a convex shape and subsequently a concave shape, indicating that its hazard rate appears like a bathtub. Table 7 shows the ML estimates for the NMMWD, MWD, WD, RNMMWD, RMWD, Add-MWD, Add-WD, RNMWD, MWED, NMW3D, and MCD, as well as the accompanying K-S distance and the associated p-value, AIC, AICc and HQIC. From Table 7, it is clear that the NMMWD has the lowest AIC, AIC, AICc and HQIC values, indicating the best fit among all distributions. Figure 9 displays the estimated SF and HRF for all distributions. It should be noted that the NMMWD distribution may well model these lifetime data with bathtub-shaped HR. Table 8 summarizes the values of estimates of the unknown parameters of NMMWD and the accompanying K-S distance and the associated p-value for the proposed five different estimation techniques. It is evident from Table 8 that the CVME is the best since it has the lowest value of K-S and largest value of p-value associated to K-S test.
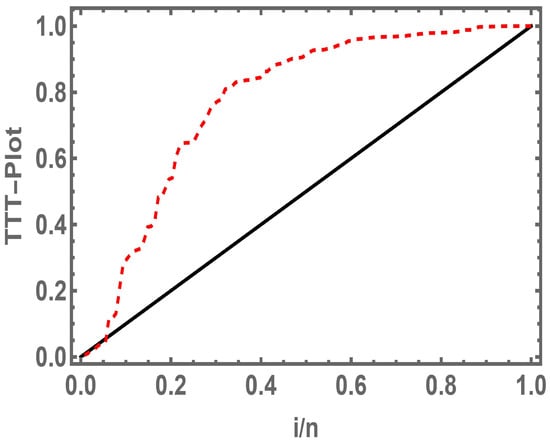
Figure 8.
The TTT-plot of the rear dump truck data.
Table 7.
The ML estimates of unknown parameters, the K-S with the corresponding p-value, the AIC, the AICc and the HQIC for different models using the rear dump truck data.
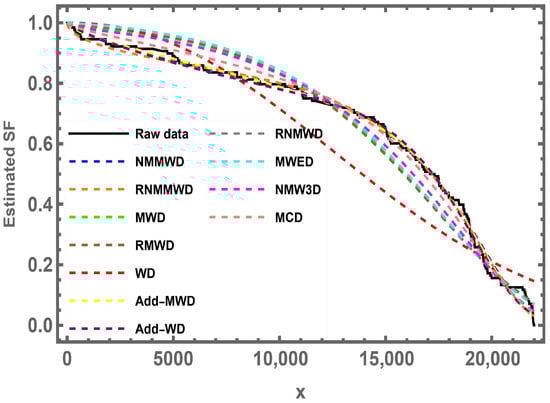
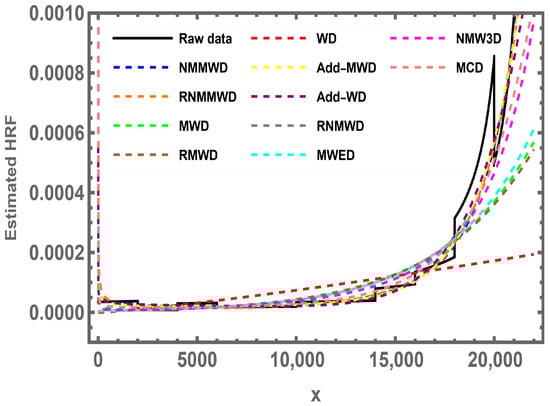
Figure 9.
Estimated SF and estimated HRF of NMMWD for the rear dump truck data.
Table 8.
The estimates of NMMWD parameters based on different methods of estimation and the K-S test with the associated p-value for the rear dump truck data.
The approximate variance–covariance matrix is given by
Thus the 95% ACIs of , , , and are, respectively, given by {0.0, 0.0011}, {0.4168, 1.0189}, {0.00004, 0.00006}, and {2.6263, 6.0026}.
7. Simulation Study
To explore the simulation study employing MSE and AAB, the effectiveness of the different estimation methods outlined in Section 5 was assessed. To assess how effectively various strategies work in estimating the unknown parameters of NMMWD, the following steps are employed:
- Three sets of initial values for the parameters , , , and are assigned to the NMMWD. Two sets, and , correspond to bathtub-shaped hazard functions, and one set, , corresponds to an increasing hazard function.
- Assume sample sizes n = (50, 100, 150, 200, 250, 300, 350, 400) and then generate random samples of these sizes from Equation (6).
- For each method shown in Section 5, calculate the estimate values of the parameters , , and of the NMMWD.
- Steps 2 and 3 should be repeated N = 1000 times.
- Compute the MSEs and AABs of the parameters , , and for the five different methods.
All calculations are performed using Wolfram Mathematica 11. The values of MSEs and AABs of the parameters , , and of the NMMWD for the different methods of estimation are reported in Table 9, Table 10, Table 11, Table 12, Table 13 and Table 14. While studying these tables, we observed several important and desired results. We summarized these results as follows:
Table 9.
MSEs and AAB for parameters and under proposed methods with varying sample size n based on the initial values of parameters .
Table 10.
MSEs and AABs for parameters and under proposed methods, for varying sample sizes n based on the initial parameter values .
Table 11.
MSEs and AABs for parameters and under proposed methods, for varying sample sizes n based on the initial parameter values of parameters .
Table 12.
MSEs and AAB sfor parameters and under proposed methods, for varying sample sizes n based on the initial parameter values .
Table 13.
MSEs and AABs for parameters and under proposed methods, for varying sample size n based on the initial parameter values .
Table 14.
MSEs and AABs for parameters and under proposed methods, for varying sample size n based on the initial parameter values .
- As the generated sample size increases, the AAB and MSE values decrease for all the estimation methods used in this study, indicating that the estimates are consistent.
- Considering the AABs and MSEs, we find that MLE and WLSE are superior to the other estimation techniques used in this study because they consistently produce the lowest AABs and MSEs for all parameters.
- The tables show the stability of the performance of different estimation methods based on MSE and AAB values when changing the data generation mechanism from the bathtub to increasing hazard shapes and from the bathtub to the bathtub hazard shapes with small changes in initial parameters.
8. Conclusions
This paper dealt with a new modification of modified Weibull distribution called the NMMWD. The MWD, RMWD, RNMMWD, and WD are considered its sub-models. Some statistical properties, including quantiles, moments, Bowley skewness, and Moors kurtosis were derived in closed forms. We found that the HRF shapes for this distribution are extremely obvious and can take both increasing and bathtub shapes. Additionally, the inflection point for the HRF bathtub form was easily identified. The classical estimation methods of the NMMWD, including MLE, LSE, WLSE, CVME, and ADE, were investigated. Three engineering data sets were utilized to show that the NMMWD is applicable and more compatible with engineering disciplines than its sub-distributions and some well-known distributions using non-parametric and parametric tests. In particular, we found that the NMMWD performed better than the other distributions, achieving the lowest AIC, AICc and HQIC values in the electronic ground support equipment data and the rear dump truck data. For electronic ground support equipment data, the CVME is the best among the methods based on the p-value corresponding to the K-S test. Further, the ADE is the best for the main rotor blade data. Furthermore, the CVME is the best based on a non-parametric test for the rear dump truck data. The simulation study was also presented to compare the proposed estimation methods using MSEs and AABs. Furthermore, the simulation study demonstrated that MLE and WLSE consistently produced the lowest MSEs and AABs across a range of sample sizes. We also concluded that when changing the data generation mechanism from bathtub to increasing hazard forms and from bathtub to bathtub hazard forms with small changes in the initial parameters, the performance of the different estimation methods remains stable. For future work, these methods can be extended to other censoring schemes. The problem of Bayesian estimation of the unknown parameters under complete and censoring data from the NMMWD can also be investigated.
Author Contributions
Conceptualization, K.S.S. and H.M.M.R.; Methodology, A.S.A.-M., K.S.S. and H.M.M.R.; Software, H.M.M.R.; Validation, A.S.A.-M. and H.M.M.R.; Formal analysis, K.S.S.; Investigation, K.S.S. and H.M.M.R.; Resources, A.S.A.-M. and H.M.M.R.; Data curation, H.M.M.R.; Writing—original draft, H.M.M.R.; Writing—review and editing, A.S.A.-M. and K.S.S.; Visualization, H.M.M.R.; Supervision, K.S.S.; Project administration, A.S.A.-M.; Funding acquisition, A.S.A.-M. All authors contributed equally to the conception, design, analysis, and writing of this manuscript. All authors have read and agreed to the published version of the manuscript.
Funding
This work was supported and funded by the Deanship of Scientific Research at Imam Mohammad Ibn Saud Islamic University (IMSIU) (grant number IMSIU-DDRSP2503).
Data Availability Statement
The original contributions presented in this study are included in the article. Further inquiries can be directed to the corresponding author.
Conflicts of Interest
The authors declare that they have no conflicts of interest.
Abbreviations
The following abbreviations are used in this manuscript:
| CDF | Cumulative distribution function |
| Probability density function | |
| HRF | Hazard rate function |
| SF | Survival function |
| AIC | Akaike information criterion |
| AICc | corrected Akaike information criterion |
| HQIC | Hannan-Quinn information criterion |
| K-S | Kolmogorov-Smirnov |
| NMMWD | New modification of modified Weibull distribution |
| MWD | Modified Weibull distribution |
| RNMMWD | Reduced new modification of modified Weibull distribution |
| RMWD | Reduced modified Weibull distribution |
| WD | Weibull distribution |
| MWED | Modified Weibull extension distribution |
| Add-MWD | Additive modified Weibull distribution |
| RNMWD | Reduced new modified Weibull distribution |
| MGLED | Modified generalized linear exponential distribution |
| MCD | Modified Chen distribution |
| Add-WD | Additive Weibull distribution |
| NMW3D | New extension of Modified Weibull distribution |
| GIBD | Generalized integrated beta distribution |
| IBD | Integrated beta distribution |
| MLE | Maximum likelihood estimation |
| LSE | Least square estimation |
| WLSE | Weighted least square estimation |
| CVME | Cramér Von-Mises estimation |
| ADE | Anderson Darling estimation |
| ACI | Approximate confidence interval |
| MMIR | Maintenance Malfunction Information Reporting |
Appendix A
Appendix B
The second partial derivatives of (2) to perform the approximate variance–covariance matrix are given by
References
- Weibull, W.A. Statistical distribution function of wide applicability. J. Appl. Mech. 1951, 18, 293–297. [Google Scholar] [CrossRef]
- Lai, C.D.; Xie, M.; Murthy, D.N.P. A modified Weibull distribution. IEEE Trans. Reliab. 2003, 52, 33–37. [Google Scholar] [CrossRef]
- Xie, M.; Tang, Y.; Goh, T.N. A modified Weibull extension with bathtub-shaped failure rate function. Reliab. Eng. Syst. Saf. 2002, 76, 279–285. [Google Scholar] [CrossRef]
- Chen, Z. A new two-parameter lifetime distribution with bathtub shape or increasing failure rate function. Stat. Probab. Lett. 2000, 49, 155–161. [Google Scholar] [CrossRef]
- Xie, M.; Lai, C.D. Reliability analysis using an additive Weibull model with bathtub-shaped failure rate function. Reliab. Eng. Syst. Saf. 1996, 52, 87–93. [Google Scholar] [CrossRef]
- Nadarajah, S.; Kotz, S. On Some Recent Modifications of Weibull Distribution. IEEE Trans. Reliab. 2005, 54, 561–562. [Google Scholar] [CrossRef]
- Gurvich, M.R.; Dibenedetto, A.T.; Rande, S.V. A new statistical distribution for characterizing the random strength of brittle materials. J. Mater. Sci. 1997, 32, 2559–2564. [Google Scholar] [CrossRef]
- Thach, T.T.; Briš, R. An additive Chen-Weibull distribution and its applications in reliability modeling. Qual. Reliab. Eng. Int. 2021, 37, 352–373. [Google Scholar] [CrossRef]
- Ghazal, M.G.M.; Radwan, H.M.M. A reduced distribution of the modified Weibull distribution and its applications to medical and engineering data. Math. Biosci. Eng. 2022, 19, 13193–13213. [Google Scholar] [CrossRef] [PubMed]
- Ghazal, M.G.M. A new extension of the modified Weibull distribution with applications for engineering data. Probabilistic Eng. Mech. 2023, 74, 103523. [Google Scholar] [CrossRef]
- Ghazal, M.G.M. Modified Chen distribution: Properties, estimation, and applications in reliability analysis. AIMS Math. 2024, 9, 34906–34946. [Google Scholar] [CrossRef]
- Al-Moisheer, A.S.; Sultan, K.S.; Radwan, H.M.M. A Novel Adaptable Weibull Distribution and Its Applications. Axioms 2025, 14, 490. [Google Scholar] [CrossRef]
- Lai, C.D.; Jones, G.; Xie, M. Integrated beta model for bathtub-shaped hazard rate data. Qual. Technol. Quant. Manag. 2016, 13, 229–240. [Google Scholar] [CrossRef]
- Bain, L.J. Analysis for the Linear Failure-Rate Life-Testing Distribution. Technometrics 1974, 16, 551–559. [Google Scholar] [CrossRef]
- Mezo, I. The Lambert W Function: Its Generalizations and Applications, 1st ed.; Chapman and Hall/CRC: Boca Raton, FL, USA, 2022. [Google Scholar]
- Gradshteyn, I.S.; Ryzhik, I.M. Table of Integrals, Series, and Products, 7th ed.; Elsevier/Academic Press: Amsterdam, The Netherlands, 2007. [Google Scholar]
- Mahmoud, M.A.W.; Ghazal, M.G.M.; Radwan, H.M.M. Modified Generalized Linear Exponential Distribution: Properties and applications. Stat. Optim. Inf. Comput. 2023, 12, 231–255. [Google Scholar] [CrossRef]
- Swain, J.J.; Venkatraman, S.; Wilson, J.R. Least-squares estimation of distribution functions in johnson’s translation system. J. Stat. Comput. Simul. 1988, 29, 271–297. [Google Scholar] [CrossRef]
- MacDonald, P.D.M. Comment on An estimation procedure for mixtures of distributions by Choi and Bulgren. J. R. Stat. Soc. Ser. B (Stat. Methodol.) 1971, 33, 326–329. [Google Scholar] [CrossRef]
- Boos, D.D. Minimum distance estimators for location and goodness of fit. J. Am. Stat. Assoc. 1981, 76, 663–670. [Google Scholar] [CrossRef]
- He, B.; Cui, W.; Du, X. An additive modified Weibull distribution. Reliab. Eng. Syst. Saf. 2016, 145, 28–37. [Google Scholar] [CrossRef]
- Almalki, S.J. A reduced new modified Weibull distribution. Commun. Stat.-Theory Methods 2018, 47, 2297–2313. [Google Scholar] [CrossRef]
- Hand, D.J.; Daly, F.; McConway, K.; Lunn, D.; Ostrowski, E. A Handbook of Small Data Sets; CRC Press: Tokyo, Japan, 1993. [Google Scholar]
- Juran, J.; Gryna, F. Quality Planning and Analysis; McGrawHill: New York, NY, USA, 1980; p. 204. [Google Scholar]
- Pham, H. A Vtub-Shape Hazard Rate Function with Applications to System Safety. Int. J. Reliab. Appl. 2002, 3, 1–16. [Google Scholar]
- Coetzee, J.L. Reliability degradation and the equipment replacement problem. In Proceedings of the International Conference of Maintenance Societies, Melbourne, Australia, 22–23 May 1996; Volume 21. [Google Scholar]
- Pulcini, G. Modeling the failure data of a repairable equipment with bathtub type failure intensity. Reliab. Eng. Syst. Saf. 2001, 71, 209–218. [Google Scholar] [CrossRef]


Disclaimer/Publisher’s Note: The statements, opinions and data contained in all publications are solely those of the individual author(s) and contributor(s) and not of MDPI and/or the editor(s). MDPI and/or the editor(s) disclaim responsibility for any injury to people or property resulting from any ideas, methods, instructions or products referred to in the content. |
© 2025 by the authors. Licensee MDPI, Basel, Switzerland. This article is an open access article distributed under the terms and conditions of the Creative Commons Attribution (CC BY) license (https://creativecommons.org/licenses/by/4.0/).