Abstract
Sustainability assessment has emerged as a critical research area given the pressing challenges of balancing economic growth, environmental protection, and social equity. This study aims to develop an objective and reproducible framework to evaluate sustainability efficiency across countries by integrating multiple development dimensions into a unified decision model. Despite substantial prior research, inconsistencies often arise due to data heterogeneity and conflicting criteria. To address this gap, a hybrid multi-criteria decision-making (MCDM) framework was developed by combining the Double Normalization Method based on Removal Effects of Criteria (DNMEREC) for objective weighting and the Double Normalization Measurement of Alternatives and Ranking according to Compromise Solution (DNMARCOS) method for ranking alternatives. This integration ensures balanced consideration of beneficial and non-beneficial criteria while minimizing subjectivity. The model was empirically validated through a comparative assessment of G7 and BRICS countries using twelve sustainability indicators covering economic, environmental, and social dimensions. Results show significant variations in sustainability efficiency, with G7 countries generally demonstrating higher overall performance, while BRICS nations exhibit strong growth potential but face environmental and structural constraints. These findings confirm the robustness of the DNMEREC-DNMARCOS framework and highlight its adaptability to complex, multidimensional datasets. The study contributes a transparent methodological tool for researchers and policymakers seeking evidence-based strategies to enhance global sustainability performance and bridge development gaps.
MSC:
90B50
1. Introduction
The pursuit of sustainable development has emerged as one of the defining global challenges of the twenty-first century. Climate change, biodiversity loss, rising inequality, and unsustainable consumption patterns continue to undermine the stability of ecosystems and societies worldwide. According to the National Oceanic and Atmospheric Administration (NOAA), global surface temperatures have already risen by approximately 1.1 °C above pre-industrial levels, with severe implications for food security, human health, and natural resource availability [1]. At the same time, a report compiled by the Sustainable Development Solutions Network (SDSN) found that none of the Sustainable Development Goals (SDGs) is on track to be achieved by 2030, and only 17% of targets are on course, while progress on many social and environmental targets has stalled or regressed [2]. Against this backdrop, major economies such as the G7 (Group of Seven) and BRICS (Brazil, Russia, India, China, and South Africa, with recent expansion including other emerging economies) play a pivotal role in shaping the trajectory of sustainable development due to their economic dominance, demographic weight, and environmental footprints [3]. Understanding the effectiveness of these economies in achieving sustainability is therefore not only a matter of domestic concern but also a global priority. Against this backdrop, a systematic comparison of sustainability efficiency across key economic blocs becomes essential for identifying best practices, addressing weaknesses, and accelerating collective progress toward the SDGs [4].
The G7 countries are widely recognized for their advanced economies, technological innovation, and historically high environmental footprints, but they also demonstrate stronger institutional frameworks for environmental regulations and social welfare policies [5]. In contrast, BRICS countries, while accounting for a substantial share of global population and GDP growth, continue to face challenges in decoupling economic expansion from environmental degradation and social inequality [6]. The divergence in sustainability performance between these blocks reflects persistent developmental gaps with significant implications for global equity and environmental justice. While G7 nations are often associated with higher investments in renewable energy, green technologies, and climate governance mechanisms [7], BRICS countries frequently struggle with infrastructural deficits, energy dependency on fossil fuels, and disparities in social development [8]. Consequently, a systematic comparative assessment between G7 and BRICS offers critical insights into the multidimensional nature of sustainability efficiency, highlighting both best practices and structural obstacles that must be addressed in the pursuit of the 2030 Agenda [9].
The academic discourse on sustainability assessment has traditionally relied on composite indicators such as the Human Development Index (HDI), Environmental Performance Index (EPI), and direct SDG indices [10]. While these measures provide valuable macro-level benchmarks, they are often criticized for their reliance on pre-determined weights, lack of sensitivity to trade-offs, and limited ability to capture efficiency in resource use [11]. For instance, HDI emphasizes social dimensions but downplays environmental externalities, whereas EPI foregrounds ecological indicators without fully integrating economic dynamics. Recent studies further reveal that aggregated indicators may obscure intra-bloc disparities and temporal trends that are crucial for policy interventions [12]. Therefore, there is a growing recognition that sustainability assessments require more nuanced, multidimensional, and methodologically rigorous approaches that integrate efficiency analysis with multi-criteria evaluation.
In response to these limitations, scholars have increasingly adopted Multi-Criteria Decision-Making (MCDM) methods to evaluate sustainability performance across nations and regions. Methods such as Data Envelopment Analysis (DEA), Technique for Order of Preference by Similarity to Ideal Solution (TOPSIS), and Measurement of Removal Effects of Criteria (MEREC) have been widely applied in environmental and socio-economic assessments [13]. DEA-based models, for example, allow the identification of efficiency frontiers but often require large datasets and may struggle with heterogeneous inputs and outputs [14]. Similarly, distance-based methods like TOPSIS and MARCOS provide ranking robustness but are sensitive to weighting schemes and normalization processes [15,16]. The recent literature emphasizes hybridization of methods, such as integrating objective weighting models (MEREC, CRITIC, entropy) with advanced ranking techniques (MARCOS, MAIRCA), to enhance robustness, accuracy, and interpretability in sustainability studies [17,18]. However, comparative applications of these hybrid frameworks across major geopolitical blocks such as G7 and BRICS remain limited, leaving a significant gap in both theoretical and applied sustainability research.
Despite the expansion of MCDM-based sustainability assessment, critical gaps persist in the literature. There is a lack of systematic comparative studies between advanced economies (G7) and emerging economies using efficiency-oriented sustainability frameworks. Existing studies tend to focus either on single blocs or on individual countries, thereby neglecting the structural dynamics of global developmental divides. In addition, reliance on single-method approaches constrains the reliability of findings, as results may vary significantly depending on the choice of weighting or ranking technique. Hybrid methods that incorporate objective criteria weighting and compromise ranking mechanisms have only recently gained traction, but their applications remain scarce. Furthermore, there is an urgent temporal justification: the post-COVID-19 recovery period has reshaped global economic and environmental trajectories, while the 2030 SDG deadline is rapidly approaching, necessitating timely evaluations of progress and challenges [2]. Addressing these gaps is not only academically significant but also vital for informing international policy frameworks and cooperative sustainability strategies.
The primary objective of this study is to assess and compare sustainability efficiency between the G7 and BRICS economies, with a particular focus on identifying structural asymmetries and developmental gaps that shape long-term growth trajectories. By adopting a hybrid multi-criteria decision-making (MCDM) methodology that integrates the Double Normalization Method based on the Removal Effects of Criteria (DNMEREC) and the Double Normalization Measurement of Alternatives and Ranking according to Compromise Solution (DNMARCOS), the study aims to generate a robust, transparent, and multidimensional evaluation framework. Specifically, the research seeks to answer three guiding questions:
- How do G7 and BRICS countries differ in terms of sustainability efficiency across economic, social, and environmental dimensions?
- What structural drivers explain the persistence of efficiency gaps between advanced and emerging economies?
- How can methodological innovations in MCDM improve the accuracy, comparability, and interpretability of sustainability assessments?
This study contributes to sustainability assessment and comparative development research in several ways. Methodologically, it introduces a hybrid multi-criteria decision-making framework that combines the strengths of DNMEREC and DNMARCOS, enhancing the robustness and transparency of efficiency evaluations. Conceptually, it extends sustainability analysis beyond single-dimensional measures by integrating economic, social, and environmental indicators within a comparative framework. Empirically, it provides a systematic evaluation of G7 and BRICS economies, highlighting structural asymmetries, efficiency gaps, and developmental challenges. Practically, the findings offer policymakers and international organizations actionable insights for designing targeted reforms and advancing the United Nations’ Sustainable Development Goals (SDGs).
The remainder of this paper is structured as follows. Section 2 provides a detailed review of the relevant literature on sustainability assessment and methodological approaches. Section 3 outlines the research methodology, including the integration of the DNMEREC and MARCOS methods. Section 4 presents the empirical analysis of sustainability efficiency across G7 and BRICS economies, followed by a sensitivity analysis to verify the robustness of results. Section 5 discusses the key findings in light of broader sustainability debates, while Section 6 concludes with final remarks and policy implications for advancing sustainable development strategies in both G7 and BRICS contexts.
2. Literature Review
This research investigation addresses sustainability efficiency challenges across G7 and BRICS economies through the lens of innovative dual normalization methodologies for developmental gap assessment. The research design was implemented in two phases of literature review. The first phase focused on synthesizing and analyzing sustainability measurement methods that have been developed and applied in different contexts. The second phase focused on comparative studies between the G7 and BRICS, aiming to clarify the differences and similarities in their approaches to sustainable development. In addition, MCDM methods were also exploited, thereby creating a methodological foundation for the current study. Notable examples of these contemporary approaches include SIMUS, COMET, SPOTIS, and DARIA-TOPSIS methodologies. The VIKOR method uses a compromise ranking approach with regret measures to rank the alternatives [19], while the COMET and SPOTIS techniques offer complete resistance to rank reversal problems [20,21]. The RA-DEA approach ranks performance using input–output comparisons based on prospect theory [22]. These distinguishing characteristics of modern MCDM tools point out the importance of establishing innovative normalization application methods for assessing developmental disparities between advanced and emerging economic regions.
2.1. Sustainability Measurement Approaches
The measurement of sustainability has attracted increasing scholarly attention, with approaches ranging from sector-specific assessments to integrative indicator frameworks. At the corporate level, Bade et al. assessed sustainability maturity in the pharmaceutical industry using the ESG framework, revealing that while large and publicly traded firms exhibited higher target-setting maturity, implementation often imposed short-term supply chain risks [23]. Similarly, Atkins et al. examined the resilience of ESG metrics during the COVID-19 crisis, concluding that existing indicators failed to capture the dynamic reactivity of firms under stress and calling for a holistic reformulation that integrates the social dimension more strongly [24]. These studies underscore both the value and limitations of ESG-based measurement, particularly when applied under conditions of uncertainty and disruption.
Expanding the lens to logistics and operational contexts, Ali et al. evaluated warehouse-level sustainability initiatives in Saudi Arabia’s frozen food supply chains. Employing fuzzy Delphi, Best–Worst Method, and CoCoSo, their study highlighted how green operations and sustainable work culture directly enhanced performance outcomes [25]. This illustrates how hybrid MCDM approaches can capture the multidimensionality of sustainability at the operational scale. In a similar line, a multi-case study on global sustainable supply chain governance across emerging markets, including China, Vietnam, and India, revealed that contractual and relational governance jointly shape social responsibility and performance outcomes, emphasizing the importance of governance adaptability in complex market environments [26]. This reinforces that sustainability measurement in supply chains must account for relational dynamics and institutional contexts, not only operational efficiency. Parallel insights emerge from Camarinha-Matos et al., who analyzed collaborative approaches in sustainable and resilient manufacturing [27]. Their review emphasized the role of digital transformation and networked collaboration in distributing sustainability responsibilities across actors while also noting the need for measurable indicators that reflect resilience and interconnectivity.
At the urban scale, Bose et al. combined Importance–Performance Analysis with SEM to evaluate perceived sustainability in Siliguri City, India [28]. Their findings suggest that dimensions such as social quality, connectivity, and environmental quality drive satisfaction and loyalty, reinforcing the significance of stakeholder-centered perceptions in sustainability assessments. This resonates with Ghobakhloo et al., who proposed a roadmap for Industry 5.0 transformation [29]. By structuring 11 enabling actions through interpretive structural modeling, they demonstrated how proactive governmental support, eco-innovation, and stakeholder integration form the backbone of sustainable industrial transition, offering policymakers a sequenced framework for managing complexity.
In the agri-food domain, Silvestri et al. conducted a systematic review to consolidate indicators of sustainability and the circular economy [30]. Their classification into clusters of assessment, best practice, and decision-making underscored the importance of integrating environmental, social, and economic dimensions while also identifying emerging impact categories such as supply chain cooperation and eco-innovation. This comprehensive indicator framework complements other sectoral approaches by pointing toward the necessity of multidimensional measurement systems tailored to specific contexts.
Although previous studies have shown diversity in sustainability measurement approaches, ranging from ESG frameworks, interpretive structural models, and indicator-based assessments to hybrid MCDM and perception-based assessments, there are still notable gaps. Most of these approaches are effective only in individual sectors, such as pharmaceuticals, logistics, manufacturing, urban development, or agriculture (food), so they do not create broad comparability between economies or regions. Furthermore, the absence of a systematic combination of objective weighting techniques and data normalization limits the stability and reliability of the ranking results. To overcome these problems, the current study chooses the DNMEREC-DNMARCOS methodological framework to assess and compare sustainability performance between G7 and BRICS economies. This approach not only extends the applicability of MCDM to international comparisons but also ensures methodological rigor through a double-standardization mechanism, thereby providing a more comprehensive and robust assessment.
2.2. G7 and BRICS Comparative Studies
Comparative studies between the G7 and BRICS have recently expanded the scope of assessment to many different dimensions of sustainable development, from quality of life, science and technology, and macroeconomic policy to governance and environment. Girardi et al. show significant differences in quality of life and female labor between the two blocs through discriminant analysis, thereby emphasizing the role of gender variables in shaping the level of social development [31]. In another approach, Cicero exploits Scopus data to forecast scientific production trends, thereby pointing out the shift in global research focus, especially the strong rise of China in the BRICS region [32]. These two studies show that in addition to economic factors, social and knowledge indicators are increasingly becoming effective tools to explain the development differentiation between the two major economic blocs.
At the macro-policy and environmental level, Luo & Kamarudin analyzed the impact of macro-prudential policies on CO2 emissions; the results indicated that the impact was heterogeneous, both reducing emissions but at the same time causing carbon leakage risks in the high-emission group [33]. Yang et al. further extend this approach by examining the impact of positive governance on net zero emissions targets, thereby affirming the importance of institutional reform, especially in the BRICS region, where governance is not yet strong enough to promote green energy transition [34]. At a more comprehensive level, Ofori & Appiah-Opoku propose a four-dimensional SDGs framework approach—environment, economy, human development, and energy—to assess progress across the two blocs but at the same time point out the inconsistencies in policy design that limit comparability and coordination [3]. Complementing these institutional analyses, recent macroeconomic studies highlight the role of green financial instruments in shaping sustainable growth trajectories. Empirical evidence from China shows that while green credit policies significantly expand the real economic scale, they may also temporarily reduce efficiency due to structural adjustment costs [35]. This finding reinforces the notion that sustainable development in emerging economies requires a balance between financial incentives, industrial transformation, and governance stability.
Besides the institutional and policy aspects, energy and environment emerge as an important research axis. Biswas et al. applied the MCDM method with the improved LOPCOW algorithm to compare energy efficiency and environmental sustainability; the results showed that some BRICS countries, such as Brazil, can achieve the same ranking as G7 countries [36]. Ofori et al. also show the decisive role of financial development and governance in progress towards carbon neutrality while affirming the differences between blocs, as the G7 benefits more clearly from political governance factors such as accountability [37].
2.3. Application in MCDM
The application of multi-criteria decision-making (MCDM) has evolved rapidly, with recent studies demonstrating its adaptability across diverse domains ranging from sustainability assessment to energy planning and healthcare optimization. In sustainability-focused research, several hybrid MCDM frameworks have been developed to better capture uncertainty and the multidimensional nature of decision environments. For instance, in 2021, Wang et al. proposed a scheme selection of design for disassembly (DFD) based on sustainability, integrating interval 2-tuple linguistic intuitionistic fuzzy numbers with regret theory [38]. This model effectively addresses both ambiguity in linguistic evaluations and behavioral decision tendencies, thereby enhancing the reliability of sustainability assessments. Similar hybrid approaches—such as fuzzy DEMATEL–VIKOR, IFS-TOPSIS, and regret-theory-based frameworks—demonstrate the increasing methodological convergence between fuzzy logic, behavioral theory, and MCDM in sustainability evaluation. In addition, Wang et al. introduced a hybrid MEREC-OCRA framework to objectively weight indicators and evaluate sustainability performance in Silk Road countries, highlighting disparities across nations and offering policy implications for regional development [13]. Similarly, Parvaneh & Hammad applied a hybrid MCDM model to the power sector, integrating sustainability pillars in technology selection, with findings underscoring the importance of carbon capture in enhancing long-term sustainability [39]. These contributions reflect the growing emphasis on embedding objectivity and multidimensional sustainability perspectives into decision-making.
Beyond sustainability, extensions of MCDM have been used in energy investment and technology prioritization. Wang et al. proposed a Prospect Theory–DEA model to incorporate behavioral risk perceptions in renewable energy investments, while Nhieu & Dang employed a MEREC–Spherical Fuzzy CoCoSo approach to identify suitable marine energy technologies in Vietnam, demonstrating the value of hybrid models in handling uncertainty and expert judgment [22,40]. Such studies reveal a methodological trend: combining objective weighting with fuzzy or behavioral extensions enhances robustness and realism in energy-related evaluations.
Applications of MCDM in broader socio-economic and digital contexts are also notable. Wang et al. assessed fintech development in ASEAN using DCRITIC–Fuzzy EDAS, showing how linguistic and quantitative integration can guide digital transformation strategies [41]. Mutambik developed a hybrid IFS-ANP-DEMATEL-TOPSIS model to evaluate supply chain digitalization in line with circular economy principles, emphasizing the role of digital resilience in sustainable operations [42]. Salehipour et al. extended MCDM to heritage tourism using BMW-WLC, highlighting how comprehensive criteria can inform sustainable cultural resource management [43]. Băcescu Ene et al., by applying the SMART method in healthcare, further demonstrated the adaptability of MCDM to public health resilience during crises such as COVID-19 [44]. Collectively, these works indicate that MCDM’s versatility lies in its ability to integrate qualitative and quantitative judgments across highly contextualized problem domains.
Methodological innovation in MCDM has recently focused on normalization procedures and objective weighting. Gopisetty & Sama introduced the DN-WENSLO and DN-RPEM methods to evaluate socio-economic performance, integrating double normalization for greater accuracy [45]. Güçlü compared hybrid models combining DNMARCOS, AROMAN, and MACONT, concluding that DNMARCOS demonstrated superior ranking stability [46]. Similarly, Puska et al. advanced DNMEREC–DNCRADIS for electric car selection, confirming the stabilizing effect of double normalization through sensitivity and correlation analysis [47]. Al-Barakati & Rani extended the DNMA approach with interval-valued intuitionistic fuzzy sets to optimize healthcare waste treatment, while Baydaş et al. systematically compared normalization techniques in CODAS, identifying maximum normalization as particularly robust for economic data analysis [48,49]. Together, these studies signal a clear methodological shift towards double normalization frameworks that enhance reliability, mitigate bias, and deliver stable rankings across domains.
From this body of work, several insights emerge. First, the integration of objective weighting (MEREC, CRITIC, entropy) with advanced aggregation or normalization (OCRA, MARCOS, CODAS, DN-based methods) is increasingly viewed as essential for addressing data heterogeneity and complex sustainability trade-offs. Second, the rise in double normalization approaches (DNMARCOS, DNCRADIS, DN-WENSLO, DN-RPEM, DNMA) highlights the importance of methodological rigor in ensuring ranking stability and robustness, especially in cross-country comparisons. Third, while applications span energy, tourism, healthcare, and supply chains, relatively fewer studies have systematically compared sustainability efficiency between advanced and emerging economies. Thus, by employing a DNMEREC-DNMARCOS approach to examine sustainability efficiency in G7 and BRICS economies, this study builds upon prior methodological advancements while addressing an important research gap in comparative global sustainability assessment.
3. Methodology
In this section, an integrated multi-criteria decision-making (MCDM) framework is presented to evaluate the sustainability performance of the selected countries. The framework combines two key methods: Double-Normalized MEREC for determining objective weights and Double-Normalized MARCOS for ranking alternatives, forming a comprehensive dual normalization decision structure. To facilitate understanding, Figure 1 provides a conceptual flowchart illustrating the dual normalization process of the proposed framework. In simple terms, the “double normalization” mechanism involves performing two separate normalization procedures, one maximizing and one minimizing the criteria, depending on whether higher or lower values are preferable. The results of both procedures are then integrated to obtain final weights and rankings. This dual treatment allows the model to balance between optimistic (best-case) and pessimistic (worst-case) scenarios, enhancing objectivity and reducing the influence of outliers or data asymmetry.
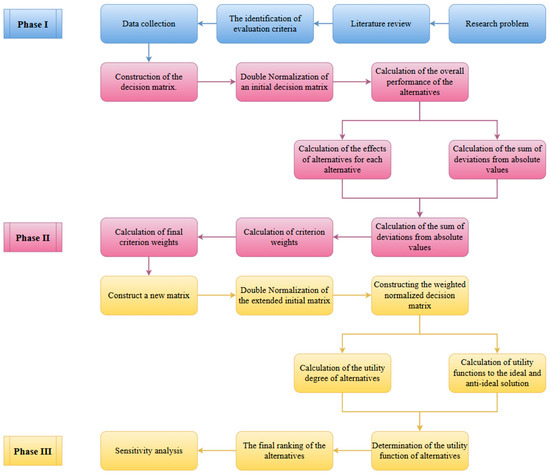
Figure 1.
The application flowchart.
In phase I, preprocessing procedures are implemented to define the research problem and collect data. Research begins with identifying the research problem and the factors or conditions that may be relevant to the problem. In the next step, a literature review is conducted to identify research gaps and trends. The most important outcome of this process is the identification of evaluation criteria. From there, data relevant to the evaluation criteria are collected from reliable open databases. Before proceeding to the next phase, the dataset was examined for potential outliers and inconsistencies through descriptive statistical checks. No significant anomalies were detected among the G7 and BRICS countries, ensuring that the data were robust and comparable. Moreover, the double normalization mechanism applied in subsequent DNMEREC-DNMARCOS stages further mitigates the potential influence of extreme values, thereby minimizing bias and preserving the integrity of the results. To reduce potential data bias and uncertainty, objective weights were calculated through the DNMEREC method, while the DNMARCOS method ensured comparability among criteria with different scales and directions. Additionally, sensitivity analysis was performed to verify the stability and robustness of the ranking outcomes.
In phase II, based on the collected data, the MEREC (Method based on the Removal Effect of Criteria) technique is used to determine the objective weights of the criteria. First introduced by Keshavarz-Ghorabaee et al., MEREC belongs to the family of objective weighting methods that do not rely on subjective judgment but instead provide weights based on the intrinsic data distribution in the decision matrix [50]. In its standard formulation, the MEREC method uses linear normalization exclusively for unfavorable criteria, those for which lower values are preferred. This normalization method involves scaling each criterion value by the minimum value in that criterion, essentially converting all data into a comparable, minimized form. However, subsequent studies, such as that by Puška et al. in 2022, applied the MEREC method using a maximization approach, where all values were normalized to the highest values—effectively treating all criteria as beneficial [51]. This distinction highlights the flexibility of the MEREC framework in adapting to different types of criteria. To take into account both beneficial and non-beneficial criteria more comprehensively, this study proposes a modified version of MEREC, called the double-normalized MEREC (DNMEREC) method, introduced by Puška et al. in 2023 [52]. In this approach, criteria are standardized based on their nature: beneficial criteria are maximized, while unfavorable criteria are minimized. Then, the MEREC algorithm is applied separately to both normalized matrices. The individual weight vectors obtained from each normalization are then averaged to calculate the final weight. This dual perspective weighting ensures that the resulting weights reflect data relationships involving both the best-case (maximum) and worst-case (minimum) values on the original decision matrix, thus providing a more robust and balanced assessment of criterion importance.
In phase III, after determining the weights, the next phase of this study is to rank the countries representing the BRICS and G7 economic blocs. Given the wide range of MCDM methods available for this purpose, this study applies the MARCOS method, as proposed by Stević et al. in 2020 [53]. The MARCOS method evaluates alternatives based on their “utility” relative to both an ideal (best-case) and a non-ideal (worst-case) reference point. To enhance the reliability of this ranking process, this study applies an improved method of the MARCOS method, called double normalization MARCOS (DNMARCOS). Similar to the DNMEREC weighting phase, the DNMARCOS method combines both minimization and maximization regularization strategies depending on the type of criteria. By calculating the distances of alternatives under both normalization and result integration schemes, DNMARCOS provides a more comprehensive and nuanced ranking of alternatives, capturing their performance over a wider range of conditions.
In addition, a sensitivity analysis was performed to assess the robustness of the proposed DNMEREC-DNMARCOS framework. This test involved the sequential removal of selected criteria and recalculation of sustainability rankings to observe potential variations. The results showed that the ranking patterns remained largely consistent, confirming that the model’s outputs are stable and not overly sensitive to minor changes in the input structure. Such consistency further supports the reliability and practical applicability of the methodology for comparative sustainability evaluation. The calculation steps of the DNMEREC-DNMARCOS approach are outlined as follows:
The detailed procedure of the calculations in stage II is described as the following steps:
Step II-1: Construction of the decision matrix .
Step II-2: Normalization of an initial decision matrix . At this stage, a decision matrix is first established, where alternatives are evaluated based on the chosen criteria. The next step is to normalize the data. Two types of normalization are applied: one assumes that all criteria are to be maximized, and the other assumes that all criteria are to be minimized. As a result, two separate normalized matrices are obtained, and subsequent procedures are carried out independently for each case.
Step II-3 Calculation of the overall performance of the alternatives and . This process guarantees that larger values of correspond to higher performance. In the case of non-beneficial criteria, the opposite holds true, where smaller values of indicate better performance.
Step II-4 Calculation of the effects of alternative ith for each criterion jth, denoted as and . Here, the performance of alternatives is recalculated by excluding criterion jth at a time from the evaluation.
Step II-5 Calculation of the sum of deviations from absolute values and . In this step, the contribution of the jth criterion is removed in order to measure its relative effect.
Step II-6 Calculation of criterion weights and . The weights of each criterion are derived based on the deviations observed in the previous stage.
Step II-7 Calculation of final criterion weights . Since weights are obtained separately for each type of normalization, the final weight of each criterion is computed as the average of the two.
Step II-8 Correction of the final criterion weights . Because the sum of average weights may differ from one, a correction is applied to normalize the values, ensuring that the total equals unity.
The detailed procedure of the calculations in stage III is described as the following steps:
Step III-9 Construction of a new matrix by expanding the initial matrix. In this stage, the original decision matrix is extended by introducing the ideal () and anti-ideal () solutions, as defined in Equation (1).
where
Step III-10 Normalization of the extended initial matrix (P). The elements of the normalized matrix are obtained through the application of Equations (11) and (12).
Step III-11 Construction of the weighted normalized decision matrix . Here, the normalized matrix A is multiplied by the corresponding weight coefficients of the criteria to generate the weighted decision matrix, as shown in Equations (13) and (14).
Step III-12 Calculation of the utility degree of alternatives . By applying Equations (14)–(17), the utility degrees of each alternative relative to both the anti-ideal () and ideal () solutions are determined.
where
Step III-13 Determination of utility functions. Utility functions corresponding to the ideal and anti-ideal solutions are computed using Equations (18) and (19).
where represents the utility function in relation to the anti-ideal solution, while represents the utility function in relation to the ideal solution.
Step III-14 Determination of the utility function of alternatives . This step defines the compromise level of each alternative in relation to the ideal and anti-ideal references. The formulation is provided in Equations (20) and (21).
Step III-15 The final score of the alternatives . The ranking is obtained by dividing the MARCOS values under beneficial normalization by those under non-beneficial normalization. The alternative with the highest resulting value is considered the most favorable according to the MARCOS method.
4. Numerical Results
4.1. Problem Description
In this section, evaluating the sustainability efficiency of the G7 and BRICS regions, the selection of criteria plays a decisive role in shaping the depth and credibility of the analysis. A meaningful comparison between advanced economies and emerging powers requires indicators that capture not only short-term growth but also long-term sustainability and resilience. For this reason, the chosen twelve criteria reflect a multidimensional framework where social, environmental, and economic dimensions intersect. They reveal not just how nations grow, but also how they sustain prosperity while minimizing inequalities and ecological costs. Other potential sustainability indicators, such as governance quality, income inequality, and renewable energy share, were also considered during the design of the evaluation framework. However, these variables were excluded due to inconsistent data availability across the G7 and BRICS economies and the subjective nature of their measurement, which could compromise the objectivity and comparability of the results. This integrated perspective is vital to understanding why developmental gaps persist between the G7 and BRICS and how they might be bridged through policies that balance efficiency with inclusiveness.
From a social perspective, the criteria underscore the importance of human resources as the foundation of sustainable development. C1 (Agriculture, forestry, and fishing) reflects the structural role of primary sectors in many BRICS economies, where agriculture and natural resources continue to support livelihoods and national output. In contrast, G7 countries have shifted toward services and high-value manufacturing, revealing different stages of economic transformation. C2 (Labor force) illustrates the demographic advantage of BRICS, where abundant labor supplies create opportunities for growth but also pose challenges in terms of employment quality and labor absorption. To complement this, C3 (Human capital index) highlights the skills, education, and health of the workforce—areas where G7 consistently outperforms BRICS, underscoring the centrality of human capital in fostering innovation, technological progress, and inclusive development. These social indicators jointly reveal a critical gap: while BRICS possesses demographic potential, G7 benefits from highly skilled populations, pointing to the need for emerging economies to invest more deeply in human capital formation.
The environmental dimension is captured through C4 (Annual greenhouse gas emissions, including land use), which serves as a direct measure of ecological sustainability and climate responsibility. Industrial expansion in BRICS is often accompanied by rising emissions, deforestation, and intensive land use, reflecting the tension between rapid development and environmental stewardship. In contrast, G7 economies, while historically major emitters, are increasingly investing in renewable energy, decarbonization strategies, and climate adaptation. This divergence emphasizes a core developmental gap: BRICS must navigate the dual challenge of maintaining economic dynamism while adopting greener growth pathways, whereas G7 countries focus on transitioning toward low-carbon economies and exporting sustainability standards globally. Including this environmental indicator ensures that sustainability efficiency is not narrowly defined by economic performance but is evaluated within the broader planetary boundaries that constrain future development.
The economic perspective encompasses a wide range of criteria, highlighting disparities in income levels, stability, trade, and investment capacity. C5 (GDP per capita) remains one of the most visible markers of developmental gaps, with G7 nations enjoying much higher living standards, while BRICS nations strive to raise income levels across large and diverse populations. C6 (GDP growth), however, tells the opposite story: BRICS economies often record higher growth rates, reflecting their catch-up potential, while G7 exhibits slower but more stable economic expansion. Stability is further assessed through C7 (Inflation, consumer prices) and C8 (Inflation, GDP deflator), which reveal that emerging economies are more prone to inflationary pressures and macroeconomic volatility, whereas advanced economies generally maintain stronger monetary stability. The integration into global trade networks is represented by C9 (Exports of goods and services) and C10 (Imports of goods and services), where G7’s mature and diversified trade structures contrast with BRICS’ growing but often resource-driven trade profiles. Finally, C11 (Gross capital formation) and C12 (Gross national expenditure) provide insight into investment and demand dynamics. BRICS economies often emphasize capital formation as a driver of industrialization and infrastructure expansion, while G7 rely more heavily on sustained domestic consumption, innovation, and services to fuel long-term growth. These economic indicators collectively illuminate the structural contrasts that define the G7-BRICS divide.
The data used for constructing the decision matrix was collected from reputable international databases, including the World Bank Open Data [54] and the Sustainable Statistics [55]. The reference period covered the most recent five years with available data to ensure temporal consistency. Each indicator (C1–C12) represents one criterion in the decision matrix, with rows corresponding to the 12 countries (G7 and BRICS). Quantitative values were normalized prior to analysis, where beneficial and non-beneficial criteria were adjusted according to their direction of preference. This standardization enabled a coherent comparative evaluation of sustainability efficiency across all indicators and economies.
Table 1 shows the twelve criteria form a comprehensive and balanced framework for sustainability efficiency assessment. They reveal not only the absolute differences in income, labor quality, and environmental responsibility but also the relative strengths and vulnerabilities of both groups. The G7 exemplifies maturity, stability, and high levels of human capital but faces challenges in sustaining growth and addressing historical emissions. Meanwhile, BRICS embody dynamism, demographic potential, and rising global influence but must overcome structural bottlenecks in education, inequality, and environmental management. By framing sustainability efficiency through these multidimensional lenses, the analysis provides a pathway to understanding how developmental gaps can be narrowed. Ultimately, bridging these divides requires not only stronger economic performance but also integrated strategies that invest in people, protect the environment, and foster inclusive growth across both advanced and emerging economies.

Table 1.
List of the criteria used in robot selection.
The selection of these twelve criteria was systematically grounded in an extensive review of sustainability assessment literature and aligned with internationally recognized frameworks such as the United Nations Sustainable Development Goals (SDGs) and the World Bank’s development indicators. This approach ensured that each criterion holds empirical relevance, data consistency, and cross-national comparability. Expert opinions were not directly used; instead, the framework relies on globally validated indicators to minimize subjectivity and enhance the reproducibility of the analysis.
4.2. Application of the DNMEREC-DNMARCOS Method
The foundation of any MCDM analysis is the construction of a decision matrix. As outlined in the preceding section, the alternatives and criteria were identified, leading to the development of the initial decision matrix (Table 2). The first step in applying an MCDM method involves normalizing the data, which in this study follows the MEREC approach. Normalization is performed to standardize the data and ensure its comparability for further analysis. In the maximization-based normalization process (Table 3), the highest value of an alternative is assigned a score of 1, while in the minimization case, the lowest value receives a score of 1. Conversely, in the minimization-based normalization (Table 4), the procedure is reversed: for criteria that require maximization, the lowest value is given 1, whereas for criteria requiring minimization, the highest value is assigned 1. These two forms of normalization inherently yield different outcomes, which consequently lead to variations in the ranking of alternatives. This illustrates the validity of employing such an approach, since if the values of alternatives were perfectly inversely proportional, the method would lose its effectiveness.
Table 2.
Decision matrix.
Table 3.
Normalized decision matrix with criterion maximization.
Table 4.
Normalized decision matrix with criterion minimization.
Once normalization is completed, the next step is to compute the weights of the criteria, since ranking procedures generally require weighted data. In this study, the weights are obtained using the DNMEREC method. After normalization, the procedure involves several stages: first, the overall performance of the alternatives is calculated (Equation (3)); then, the effect of each alternative on the criteria is measured (Equation (4)), followed by calculating deviations from the absolute values (Equation (5)). Finally, the criterion weights and adjusted weights are determined (Table 5). The results indicate that criterion C4 recorded the highest weight (w = 0.237), while criterion C12 was assigned the lowest weight (w = 0.004), as detailed in Figure 2.
Table 5.
Weights of criteria.
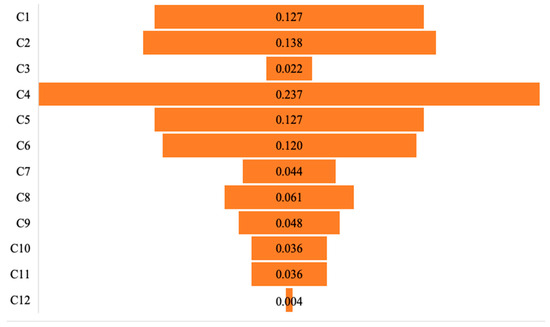
Figure 2.
The weighting of criteria.
The analysis further showed that the weights vary significantly depending on the type of normalization applied. The most notable difference was observed in criterion C2, which had a weight of w1 = 0.189 when using maximization, but only w2 = 0.088 when minimization was applied. This highlights the importance of employing double normalization in weight determination, since single normalization could lead to biased results. By using the DNMEREC procedure, a balanced compromise weight is achieved that reflects both normalization approaches.
The ranking of alternatives was obtained through the application of the DNMARCOS method after incorporating the weights derived from the DNMEREC procedure. This process began by extending the decision matrix with the addition of both the ideal and anti-ideal solutions (Equation (10)). Following this, normalization of the extended matrix was carried out (Equations (11)–(12)), and the weighted normalized decision matrix was calculated (Equation (13)). Subsequently, the utility degrees of alternatives were determined in relation to both the ideal and anti-ideal references (Equations (14)–(17)). These values were then used to construct the utility functions (Equations (18)–(19)), representing the boundaries of performance in the weighted normalized matrix. Finally, the compromise utility functions were derived (Equations (20)–(21)), and the alternatives were ranked by dividing the beneficial normalization results by the non-beneficial normalization results.
The results of this procedure are shown in Table 6 and Figure 3. The ranking indicates clear disparities in the performance of the observed countries. China emerged as the best-performing alternative with a utility score of 2.417, significantly surpassing other countries. Japan (1.661) and Canada (1.430) followed, forming a strong group of high-ranking performers, driven by their economic strength, technological development, and relatively favorable sustainability indicators. India (1.272) and Germany (1.175) also achieved competitive positions, reflecting moderate success in balancing environmental and economic dimensions.
Table 6.
Results of the DNMARCOS method.
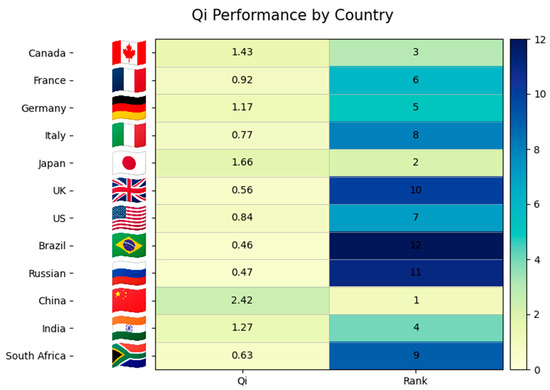
Figure 3.
The final ranking of the countries.
A second group of countries displayed mid-level performance, with values ranging approximately between 0.8 and 1.1. These included United Kingdom, South Korea, France, and Italy, which showed moderate outcomes but lacked the outstanding indicators that characterized the leading group.
By contrast, the lowest-performing alternatives were Brazil (0.455) and Russia (0.469), both of which ranked at the bottom of the list. Their weak performance was largely associated with higher greenhouse gas emissions, lower human capital scores, and relatively weaker macroeconomic stability.
The overall ranking reveals a sharp distinction between the top performers and those at the lower end, indicating that sustainability achievements across the observed set of countries are highly uneven. Importantly, the results underscore the dominant role of environmental and economic indicators, particularly greenhouse gas emissions (C4), in shaping the final outcomes. These findings confirm that countries with strong environmental policies and high economic capacity are more likely to achieve superior sustainability rankings.
4.3. Sensitivity Analysis
Sensitivity analysis was applied to evaluate the robustness of the results derived from the DNMEREC-DNMARCOS method, using a scenario-based framework. Two distinct strategies were employed to design these scenarios. The first strategy involved sequentially removing each criterion used to assess the sustainable competitiveness of countries. This allowed for recalculating the corresponding criterion weights and country rankings. The second strategy focused on the performance values of the alternatives, following the DNMARCOS procedure, in order to determine variations in alternative rankings.
In the first strategy, a total of 12 scenarios were generated, with each scenario excluding one criterion at a time. The resulting criterion weights and rankings of alternatives are summarized in Table 7 and Table 8 and Figure 4. The detailed outcomes for each scenario are as follows:
Table 7.
The sensitivity analysis scenario weights.
Table 8.
The sensitivity analysis scenario ranking.
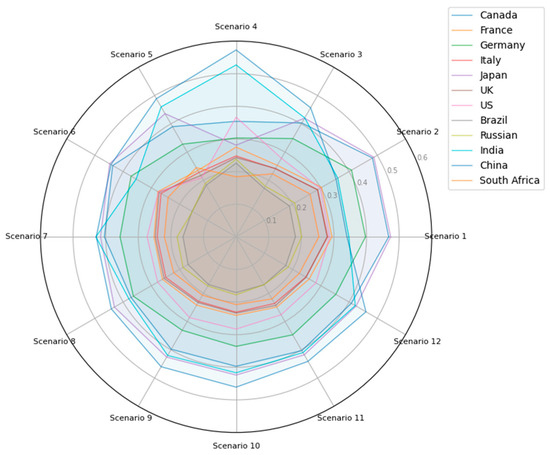
Figure 4.
The sensitivity analysis scenario results.
- Scenario 1—When the “Agriculture, forestry, and fishing” (C1) was removed, Japan emerged as the leading country, followed by Canada and Germany. China fell from its dominant position in the base, suggesting that C1 contributes significantly to China’s relative advantage.
- Scenario 2—When the “Labor force” (C2) was removed, Japan retained its lead, with Canada and Germany close behind. The removal of labor force data has diminished China’s competitiveness, highlighting the importance of demographics and the size of its workforce in its sustained growth performance.
- Scenario 3—When the “Human capital index” (C3) was removed, China rose to the top spot, overtaking Japan, while India improved its ranking. This suggests that C3 played a decisive role for Japan, whose ranking declined due to the exclusion of human capital, while China and India consolidated their positions.
- Scenario 4—When the “Annual greenhouse gas emissions including land use” (C4) was removed, China continues to lead the rankings, followed by India and the United States. This shows that environmental emissions are a limiting factor in China’s sustainable development performance, and eliminating them would improve its relative position.
- Scenario 5—When the “GDP per capita” (C5) was removed, India took the top spot, surpassing China and Japan, while Canada dropped in the rankings. This shows that GDP per capita is the main driver of advanced economies, while its absence shifts the advantage to developing economies with high growth drivers.
- Scenario 6—When the “GDP growth” (C6) was removed, Japan regained the top spot, closely followed by China and Canada. India’s ranking dropped, underscoring the importance of growth for emerging economies, which lose relative strength when this criterion is excluded.
- Scenario 7—When the “Inflation, consumer prices” (C7) was removed, India took the top spot, followed by China and Japan. Removing inflation as a stabilizing factor helped emerging markets improve, while developed economies saw their gains diminish.
- Scenario 8—When the “Inflation, GDP deflator” (C8) was removed, China regained the top spot, followed by India and Japan. The small changes in the rankings suggest that this inflation measure is less decisive than other macroeconomic indicators.
- Scenario 9—When the “Exports of goods and services” (C9) was removed, China continues to dominate, while Japan and India hold steady. This stability implies that export volumes, while relevant, do not significantly alter the comparative sustainability rankings.
- Scenario 10—When the “Imports of goods and services” (C10) was removed, China remains at the top, with Japan at second and India at third. The limited impact of this criterion suggests that imports are not the main determinant of competitiveness in this context.
- Scenario 11—When the “Gross capital formation” (C11) was removed, China retained its lead, ahead of Japan and India. The existence of the ranking models confirms that capital investment, while relevant, is less influential in shaping overall performance.
- Scenario 12—When the “Gross national expenditure” (C12) was removed, China still leads, with Japan and India close behind. However, the removal of this criterion slightly disrupted the middle-ranking countries, suggesting that national spending affects the balance between developed and emerging economies.
In all twelve scenarios, the top-performing countries (China, Japan, Canada, and India) consistently occupy the top positions, although their internal order changes depending on the criteria excluded. Meanwhile, countries like Brazil, Russia and South Africa consistently rank lower, indicating structural constraints regardless of the scenario. The most influential criteria were C3 (Human Capital Index) and C5 (GDP per capita), the removal of which significantly changed the leadership structure. In contrast, indicators such as C8 (GDP deflator) and C10 (Imports of goods and services) have small impacts, indicating low sensitivity. These findings confirm that while rankings are generally stable, the method does capture how several important development and environmental dimensions shape sustainable development performance across the G7 and BRICS regions.
5. Discussion
The findings of this study reveal a nuanced picture of sustainable competitiveness among the G7 and BRICS countries. The numerical results obtained through the DNMEREC-DNMARCOS framework show that China, Japan, and Canada consistently emerge as top performers, while countries such as Brazil, Russia, and South Africa remain at the lower end of the rankings. This outcome indicates that the methodology successfully captures both structural advantages and persistent challenges across advanced and emerging economies.
The ranking results carry significant meaning for understanding global development dynamics. The consistent leadership of China and Japan highlights the combined importance of demographic size, industrial output, and human capital in shaping sustainable competitiveness. A closer examination reveals that China’s high ranking, despite its considerable greenhouse gas emissions, is driven by its exceptional economic and structural performance—particularly in GDP growth (C6), exports of goods and services (C9), and gross capital formation (C11). These indicators reflect China’s rapid industrial expansion and investment-driven model, which significantly enhances its sustainability efficiency from an economic perspective. Additionally, China’s large-scale investments in renewable energy, technological infrastructure, and green innovation have partially mitigated the adverse environmental effects of industrialization. Japan’s high ranking, by contrast, is attributed to its robust human capital base (C3), stable labor structure (C2), and macroeconomic consistency (C7–C8), all of which demonstrate institutional maturity and resilience. This contrast underscores two different pathways to achieving sustainability efficiency: growth-driven dynamism in emerging economies and institutional balance in advanced ones. Meanwhile, the recurrent lower positioning of Brazil, Russia, and South Africa underscores systemic economic vulnerabilities and the limited contribution of certain structural indicators to long-term sustainability. The internal reordering of the top countries across different scenarios further illustrates the delicate balance between economic, environmental, and social factors.
The observed gaps between countries can be attributed to several drivers. Advanced economies such as Japan and Canada benefit from strong human capital development and high per capita income, which act as stabilizing forces. In contrast, emerging economies like China and India gain relative strength from rapid GDP growth, demographic advantages, and investment-driven expansion, though their positions are often weakened by environmental pressures such as greenhouse gas emissions. These divergences highlight why developed economies retain stable but slower growth, while emerging economies demonstrate high volatility in competitiveness rankings depending on which criteria are emphasized.
Compared with earlier studies on global competitiveness and sustainability indices, these findings align with the general observation that human capital and income indicators remain decisive for developed countries, while growth-related and demographic factors drive emerging economies. However, by employing the double normalization procedure, this study adds a methodological innovation that highlights the sensitivity of results to different normalization strategies. Previous works often assumed proportionality in rankings, but the present analysis demonstrates that outcomes can diverge significantly when critical criteria such as human capital or GDP per capita are excluded.
From a practical perspective, the results provide valuable policy implications. For advanced economies, maintaining leadership requires reinforcing innovation, education, and climate mitigation policies, since their relative position weakens when human capital is diminished. For emerging economies, the findings stress the importance of balancing rapid growth with sustainable practices. For instance, China and India gain substantially when growth-related indicators are prioritized but lose competitiveness when emissions and environmental factors are considered. This implies that for long-term sustainability, integrating green development into national strategies is essential to avoid eroding gains in competitiveness.
Nonetheless, the study is not without limitations. The reliance on aggregated macroeconomic indicators may overlook within-country disparities, particularly for large economies like China, India, and the United States. Additionally, the model focuses on a limited set of twelve criteria, which, while comprehensive, may not fully capture the multidimensional nature of sustainability, such as governance quality, technological innovation, or social inclusion. Finally, while the sensitivity analysis confirms robustness, further extensions using time-series data or broader cross-country samples could enhance the generalizability of results.
6. Conclusions and Policy Recommendations
This study set out to examine sustainability efficiency across the G7 and BRICS regions, guided by the central objective of identifying developmental gaps and understanding their implications for long-term growth. By applying the hybrid DNMEREC-DNMARCOS methodology, the analysis provided a multidimensional perspective on performance, encompassing economic vitality, human capital, and environmental responsibility. The research revealed clear asymmetries between advanced economies and emerging ones while also uncovering nuanced variations within each group. Countries such as China, Japan, and Canada consistently demonstrated strong sustainability efficiency, balancing competitiveness with environmental considerations, whereas Brazil, Russia, and South Africa faced persistent challenges linked to resource dependence, institutional fragility, and ecological pressures.
The novelty of the study lies in the methodological approach: the double normalization framework enhanced objectivity and reduced bias in weight assignment, ensuring that results are less dependent on arbitrary assumptions. The application of DNMEREC-DNMARCOS not only produced robust and consistent rankings but also confirmed the persistence of structural gaps between G7 and BRICS economies. These findings make an important contribution to the literature on comparative sustainability, highlighting the role of innovative decision-making models in addressing global development challenges. Ultimately, the study provides a structured evidence base to assess where progress has been made, where vulnerabilities persist, and what interventions are most urgently required to close the gaps between advanced and emerging economies.
From a theoretical standpoint, this research advances the growing field of sustainability assessment in several meaningful ways. First, it integrates the DNMEREC and DNMARCOS approaches into a coherent hybrid framework, thereby addressing long-standing concerns about weighting bias and the comparability of heterogeneous datasets. Second, it extends multi-criteria decision-making (MCDM) theory by demonstrating how double normalization can increase transparency, stability, and interpretability of results. Third, by situating the analysis within the comparative context of G7 and BRICS economies, the study contributes to development theory by empirically demonstrating how sustainability efficiency can both illuminate and explain persistent inequalities in global governance and economic performance. In doing so, it bridges methodological rigor with substantive insights, positioning MCDM not merely as a technical tool but as a theoretical lens for understanding sustainability as a multidimensional and unevenly distributed phenomenon.
The findings carry direct and actionable implications for practitioners and policymakers. For advanced economies in the G7, the results underscore the need to consolidate their leadership role by prioritizing innovation-driven growth and committing to environmental stewardship. While these nations generally rank high in sustainability efficiency, the evidence suggests that economic strength must be accompanied by deeper integration of social inclusiveness and green technologies to maintain long-term competitiveness.
For BRICS countries, the results highlight pressing structural challenges. Many are experiencing rapid economic growth but remain constrained by environmental degradation, overreliance on extractive industries, and disparities in human capital. These inefficiencies risk undermining the sustainability of their growth trajectories. Policymakers in these regions must therefore adopt integrated strategies that simultaneously boost productivity, expand education and skill development, and implement stricter environmental safeguards.
The methodological framework also has practical value beyond the two blocks studied. Governments, development agencies, and international organizations can adapt the DNMEREC-DNMARCOS approach to benchmark sustainability performance, design targeted reforms, and allocate resources more effectively. For businesses, the insights can inform strategic investment decisions in regions where sustainability efficiency signals both risk and opportunity. The capacity to objectively evaluate multidimensional criteria enhances decision-making in contexts where trade-offs between growth, equity, and ecology are unavoidable. Furthermore, the implications of this study extend beyond theoretical contributions. The hybrid DNMEREC-DNMARCOS framework has strong potential for real-world applications, as it can be adapted to assess sustainability, technology adoption, or renewable energy planning where multiple conflicting criteria must be considered. Its double normalization mechanism ensures adaptability across diverse datasets, making it suitable for evaluating not only national sustainability but also sectoral or regional performance. This transferability demonstrates that the proposed model is not limited to the G7–BRICS context but can serve as a practical decision-support tool in policy analysis, corporate strategy, and sustainable development planning.
6.1. Policy Recommendations
Building upon the empirical results, several policy implications can be derived to bridge sustainability efficiency gaps and accelerate progress toward the Sustainable Development Goals (SDGs). First, developed economies, particularly the G7, must take a leading role in global sustainability transitions. Their technological capacity, financial strength, and institutional maturity provide them with unique leverage to accelerate the shift toward renewable energy systems, resource-efficient industries, and circular economic models. Beyond advancing their domestic agendas, G7 countries should actively promote international technology diffusion and the sharing of best practices, particularly in clean energy, waste management, and sustainable agriculture. Structured programs in capacity building, knowledge transfer, and joint research initiatives would allow emerging economies to bypass outdated development models and adopt more sustainable pathways. Importantly, G7’s responsibility extends beyond leadership to that of enabler, ensuring that their advancements foster inclusive growth rather than widening global inequalities.
Second, BRICS countries must prioritize internal reforms that strengthen human capital and institutional capacity. Investments in education, healthcare, and digital infrastructure can enhance productivity, labor market resilience, and the quality of governance, which are critical for long-term sustainability. Moreover, these reforms must be coupled with stronger environmental regulations to address rising greenhouse gas emissions and ecological degradation. Establishing transparent regulatory systems, strengthening enforcement mechanisms, and aligning national policies with international commitments such as the Paris Agreement and the SDGs will be essential to prevent growth from occurring at the expense of environmental integrity.
Third, deepened multilateral cooperation between G7 and BRICS is indispensable. The findings suggest that unilateral approaches are insufficient to address global sustainability challenges. Instead of reinforcing geopolitical competition, both blocs should pursue collaborative frameworks in sustainable finance, cross-border climate adaptation, and technology exchange. Establishing joint funds for renewable energy investment, coordinated research programs in green innovation, and mechanisms for knowledge-sharing on climate resilience would narrow development disparities while enhancing collective resilience to global risks.
Finally, international institutions such as the United Nations, World Bank, and IMF should integrate sustainability efficiency indicators into their monitoring and financing frameworks. Development loans and aid programs should explicitly reward efficiency improvements in energy use, carbon reduction, and human capital development. This shift would create tangible incentives for both G7 and BRICS nations to align economic growth with sustainability performance. By embedding efficiency considerations into financial mechanisms, global institutions can ensure that sustainability becomes not only a policy aspiration but also a measurable criterion for international support.
6.2. Limitations Acknowledgment
Despite the significant contributions this study makes, several limitations should be recognized to provide a balanced understanding of the results. The selection of indicators, although comprehensive across economic, social, and environmental dimensions, cannot fully capture the multidimensional nature of sustainability. Certain qualitative aspects, such as governance quality, cultural resilience, and social equity, remain difficult to quantify and were therefore not included in the present framework. This constraint reflects the broader challenge in sustainability assessment, where the balance between data availability and conceptual inclusiveness must always be negotiated.
Moreover, the use of cross-sectional data restricts the ability to observe long-term developments and temporal fluctuations, such as those driven by economic shocks, technological transitions, or climate change. As sustainability is an inherently dynamic process, future studies could benefit from incorporating longitudinal datasets to reveal temporal evolution and causal linkages more effectively.
While the DNMEREC-DNMARCOS methodological framework was designed to reduce subjectivity through objective weighting and dual normalization, some degree of interpretive bias remains unavoidable in the choice of indicators and model structure. Similarly, the reliance on aggregated national-level data may conceal intra-country variations, particularly in large economies such as China, India, or the United States, where regional disparities are pronounced. Furthermore, the analytical focus on G7 and BRICS countries, though purposeful for comparative depth, inevitably limits the generalizability of the findings to other geopolitical contexts with distinct developmental or institutional conditions. These limitations do not undermine the study’s contributions. Rather, they underscore the need for cautious interpretation and open avenues for future research to enhance methodological depth, expand geographical coverage, and integrate more nuanced sustainability indicators.
6.3. Future Research Directions
In the future, follow-up studies could extend and address current gaps using various approaches. Using time-series data will help better analyze trends and trajectories, thereby reflecting the evolution of sustainability performance under the impact of economic, technological, or climate change. At the same time, expanding the scope of the study beyond the G7 and BRICS to include regional groups, such as ASEAN, the African Union, or Latin America, would provide a more global perspective and test the adaptability of the methodological framework. In such extensions, the DNMEREC-DNMARCOS model can be applied to other regions or sectors, provided that the evaluation criteria, normalization schemes, and aggregation weights are carefully adjusted to reflect local data characteristics and policy priorities. This flexibility allows the framework to serve as a transferable and robust decision-making tool for sustainability assessment across diverse contexts. Another notable direction is to integrate qualitative aspects, such as institutional trust, social inclusion, or political stability, into the quantitative assessment model, thereby making the analysis more comprehensive. In addition, methodological innovations, such as combining DNMEREC-DNMARCOS with fuzzy logic, entropy measures or prospect theory, could increase the robustness and reliability of the results. Ultimately, collaboration between academia, government agencies, and the business sector will be key because only when research knowledge is directly linked to strategic policy and practice can academic contributions truly have an impact on advancing global sustainable development goals.
Author Contributions
Conceptualization, H.-K.N. and N.-L.N.; methodology, H.-K.N.; validation, N.-L.N.; formal analysis, N.-L.N.; data curation, H.-K.N.; writing—original draft preparation, H.-K.N.; writing—review and editing, H.-K.N.; supervision, N.-L.N. All authors have read and agreed to the published version of the manuscript.
Funding
This research is funded by the University of Economics Ho Chi Minh City—UEH, Vietnam.
Data Availability Statement
The original contributions presented in this study are included in the article. Further inquiries can be directed to the corresponding authors.
Conflicts of Interest
The authors declare no conflicts of interest.
References
- Rebecca, L.L.; Dahlman, L. Climate Change: Global Temperature. 2025. Available online: https://www.climate.gov/news-features/understanding-climate/climate-change-global-temperature (accessed on 11 May 2025).
- Igini, M. None of 17 UN SDGs on Track to Be Achieved By 2030, Report Finds. 2025. Available online: https://earth.org/none-of-17-un-sdgs-on-track-to-be-achieved-by-2030-report-finds/ (accessed on 1 March 2025).
- Ofori, E.K.; Appiah-Opoku, S. Sustainable development goals in BRICS and G7 countries: Increasing accomplishments through policy synergies in four dimensions. Sustain. Dev. 2024, 32, 287–306. [Google Scholar] [CrossRef]
- Nations, U. Sustainable Development Goals. Available online: https://www.un.org/sustainabledevelopment/ (accessed on 22 April 2025).
- Kartal, M.T.; Mukhtarov, S.; Kirikkaleli, D. Achieving environmental quality through stringent environmental policies: Comparative evidence from G7 countries by multiple environmental indicators. Geosci. Front. 2025, 16, 101956. [Google Scholar] [CrossRef]
- Naseem, S.; Mohsin, M.; Zia-UR-Rehman, M.; Baig, S.A.; Sarfraz, M. The influence of energy consumption and economic growth on environmental degradation in BRICS countries: An application of the ARDL model and decoupling index. Environ. Sci. Pollut. Res. 2022, 29, 13042–13055. [Google Scholar] [CrossRef] [PubMed]
- Liu, W.; Shen, Y.; Razzaq, A. How renewable energy investment, environmental regulations, and financial development derive renewable energy transition: Evidence from G7 countries. Renew. Energy 2023, 206, 1188–1197. [Google Scholar] [CrossRef]
- Kumar, A.; Soti, N.; Gupta, S.; Deepa. Addressing energy poverty in BRICS economies: Insights from panel data analysis and policy implications for sustainable development goals. Environ. Dev. Sustain. 2024, 1–23. [Google Scholar] [CrossRef]
- Guang-Wen, Z.; Murshed, M.; Siddik, A.B.; Alam, M.S.; Balsalobre-Lorente, D.; Mahmood, H. Achieving the objectives of the 2030 sustainable development goals agenda: Causalities between economic growth, environmental sustainability, financial development, and renewable energy consumption. Sustain. Dev. 2023, 31, 680–697. [Google Scholar] [CrossRef]
- Zhang, Y.; Wu, Z. Environmental performance and human development for sustainability: Towards to a new Environmental Human Index. Sci. Total Environ. 2022, 838, 156491. [Google Scholar] [CrossRef]
- Arcagök, U. Review of the environmental performance index (EPI): Methods, constraints and recommendations. Istanb. Manag. J. 2024, 96, 59–73. [Google Scholar] [CrossRef]
- Assa, J. Less is more: The implicit sustainability content of the human development index. Ecol. Econ. 2021, 185, 107045. [Google Scholar] [CrossRef]
- Wang, C.-N.; Nguyen, H.-K.; Nhieu, N.-L. Assessing sustainability on the modern Silk Road: An objective weighting methodological approach. PLoS ONE 2025, 20, e0324538. [Google Scholar] [CrossRef]
- Kyrgiakos, L.S.; Kleftodimos, G.; Vlontzos, G.; Pardalos, P.M. A systematic literature review of data envelopment analysis implementation in agriculture under the prism of sustainability. Oper. Res. 2023, 23, 7. [Google Scholar] [CrossRef]
- Pramanik, P.K.D.; Biswas, S.; Pal, S.; Marinković, D.; Choudhury, P. A comparative analysis of multi-criteria decision-making methods for resource selection in mobile crowd computing. Symmetry 2021, 13, 1713. [Google Scholar] [CrossRef]
- Bánhidi, Z.; Dobos, I. Sensitivity of TOPSIS ranks to data normalization and objective weights on the example of digital development. Cent. Eur. J. Oper. Res. 2024, 32, 29–44. [Google Scholar] [CrossRef]
- Esangbedo, M.O.; Tang, M. Evaluation of enterprise decarbonization scheme based on grey-MEREC-MAIRCA hybrid MCDM method. Systems 2023, 11, 397. [Google Scholar] [CrossRef]
- Wang, C.-N.; Tran Thi, D.-O.; Nhieu, N.-L.; Hsueh, M.-H. An Integrated Entropy–MAIRCA Approach for Multi-Dimensional Strategic Classification of Agricultural Development in East Africa. Mathematics 2025, 13, 2465. [Google Scholar] [CrossRef]
- Zhang, N.; Zhou, Y.; Liu, J.; Wei, G. VIKOR method for Pythagorean hesitant fuzzy multi-attribute decision-making based on regret theory. Eng. Appl. Artif. Intell. 2023, 126, 106857. [Google Scholar] [CrossRef]
- Zhang, D.; Rahnema, F. Continuous-energy time-dependent coarse mesh transport (COMET) method for kinetics calculations. Nucl. Sci. Eng. 2024, 198, 565–577. [Google Scholar] [CrossRef]
- Shekhovtsov, A.; Paradowski, B.; Więckowski, J.; Kizielewicz, B.; Sałabun, W. Extension of the SPOTIS method for the rank reversal free decision-making under fuzzy environment. In Proceedings of the 2022 IEEE 61st Conference on Decision and Control (CDC), Cancun, Mexico, 6–9 December 2022; pp. 5595–5600. [Google Scholar]
- Wang, C.-N.; Nguyen, H.-K.; Nhieu, N.-L. Integrating Prospect Theory with DEA for Renewable Energy Investment Evaluation in South America. Renew. Energy 2025, 247, 123018. [Google Scholar] [CrossRef]
- Bade, C.; Olsacher, A.; Boehme, P.; Truebel, H.; Bürger, L.; Fehring, L. Sustainability in the pharmaceutical industry—An assessment of sustainability maturity and effects of sustainability measure implementation on supply chain security. Corp. Soc. Responsib. Environ. Manag. 2024, 31, 224–242. [Google Scholar] [CrossRef]
- Atkins, J.; Doni, F.; Gasperini, A.; Artuso, S.; La Torre, I.; Sorrentino, L. Exploring the effectiveness of sustainability measurement: Which ESG metrics will survive COVID-19? J. Bus. Ethics 2023, 185, 629–646. [Google Scholar] [CrossRef]
- Ali, S.S.; Kaur, R.; Khan, S. Evaluating sustainability initiatives in warehouse for measuring sustainability performance: An emerging economy perspective. Ann. Oper. Res. 2023, 324, 461–500. [Google Scholar] [CrossRef]
- Xiang, Y.; Liu, L. Global sustainable supply chain governance, effectiveness of social responsibility, and performance in emergent markets: An exploratory multiple case study. Rev. Adm. Empresas 2025, 65, e2024-0587. [Google Scholar]
- Camarinha-Matos, L.M.; Rocha, A.D.; Graça, P. Collaborative approaches in sustainable and resilient manufacturing. J. Intell. Manuf. 2024, 35, 499–519. [Google Scholar] [CrossRef] [PubMed]
- Bose, A.; Basak, D.; Roy, S.; Chowdhury, I.R.; Abdo, H.G.; Aldagheiri, M.; Almohamad, H. Evaluation of urban sustainability through perceived importance, performance, satisfaction and loyalty: An integrated IPA–SEM-based modelling approach. Sustainability 2023, 15, 9788. [Google Scholar] [CrossRef]
- Ghobakhloo, M.; Iranmanesh, M.; Morales, M.E.; Nilashi, M.; Amran, A. Actions and approaches for enabling Industry 5.0-driven sustainable industrial transformation: A strategy roadmap. Corp. Soc. Responsib. Environ. Manag. 2023, 30, 1473–1494. [Google Scholar] [CrossRef]
- Silvestri, C.; Silvestri, L.; Piccarozzi, M.; Ruggieri, A. Toward a framework for selecting indicators of measuring sustainability and circular economy in the agri-food sector: A systematic literature review. Int. J. Life Cycle Assess. 2024, 29, 1446–1484. [Google Scholar] [CrossRef]
- Girardi, G.C.; Rubbo, P.; Broday, E.E.; Arnold, M.; Picinin, C.T. Comparative Analysis between Quality of Life and Human Labor in Countries Belonging to G7 and BRICS Blocks: Proposition of Discriminant Analysis Model. Economies 2024, 12, 124. [Google Scholar] [CrossRef]
- Cicero, T. Forecasting the Scientific Production Volumes of G7 and BRICS Countries in a Comparative Analysis. Publications 2025, 13, 6. [Google Scholar] [CrossRef]
- Luo, H.; Kamarudin, F. Macroprudential policies and CO2 emissions: A comparative analysis of G7 and BRIC countries. PLoS ONE 2024, 19, e0296363. [Google Scholar] [CrossRef]
- Yang, T.; Gyimah, J.; Nwigwe, U.A.; Yao, X. The pursuit of net-zero carbon in G7 and BRICS: The impact of good governance system. Sustain. Futures 2025, 9, 100415. [Google Scholar] [CrossRef]
- Jiang, S.; Yuan, X. Does green credit promote real economic development? Dual empirical evidence of scale and efficiency. PLoS ONE 2025, 20, e0326961. [Google Scholar] [CrossRef]
- Biswas, S.; Datta, D.; Kar, S. Energy efficiency and environmental sustainability: A multi-criteria based comparison of BRICS and G7 countries. In Emerging Technology and Management Trends in Environment and Sustainability; Routledge: London, UK, 2023; pp. 107–124. [Google Scholar]
- Ofori, E.K.; Onifade, S.T.; Ali, E.B.; Alola, A.A.; Zhang, J. Achieving carbon neutrality in post COP26 in BRICS, MINT, and G7 economies: The role of financial development and governance indicators. J. Clean. Prod. 2023, 387, 135853. [Google Scholar] [CrossRef]
- Wang, W.; Tian, G.; Zhang, T.; Jabarullah, N.H.; Li, F.; Fathollahi-Fard, A.M.; Wang, D.; Li, Z. Scheme selection of design for disassembly (DFD) based on sustainability: A novel hybrid of interval 2-tuple linguistic intuitionistic fuzzy numbers and regret theory. J. Clean. Prod. 2021, 281, 124724. [Google Scholar] [CrossRef]
- Parvaneh, F.; Hammad, A. Application of Multi-Criteria Decision-Making (MCDM) to select the most sustainable Power-Generating technology. Sustainability 2024, 16, 3287. [Google Scholar] [CrossRef]
- Nhieu, N.-L.; Dang, T.D. Harnessing Vietnam’s coastal potential: Prioritizing marine energy technologies with an objectively weighting decision-making approach. Renew. Energy 2024, 230, 120881. [Google Scholar] [CrossRef]
- Wang, C.-N.; Nhieu, N.-L.; Liu, W.-L. Unveiling the landscape of Fintech in ASEAN: Assessing development, regulations, and economic implications by decision-making approach. Humanit. Soc. Sci. Commun. 2024, 11, 100. [Google Scholar] [CrossRef]
- Mutambik, I. Assessing Critical Success Factors for Supply Chain 4.0 Implementation Using a Hybrid MCDM Framework. Systems 2025, 13, 489. [Google Scholar] [CrossRef]
- Salehipour, M.; Kazemi, N.; Jokar Arsanjani, J.; Karimi Firozjaei, M. Developing a Multi-Criteria Decision Model to Unlock Sustainable Heritage Tourism Potential. Sustainability 2025, 17, 3703. [Google Scholar] [CrossRef]
- Băcescu Ene, G.-V.; Stoia, M.-A.; Cojocaru, C.; Todea, D.A. SMART Multi-Criteria Decision Analysis (MCDA)—One of the Keys to Future Pandemic Strategies. J. Clin. Med. 2025, 14, 1943. [Google Scholar] [CrossRef]
- Gopisetty, Y.B.; Sama, H.R. An integrated MCDM approach using double normalization: Introducing the DN-WENSLO and DN-RPEM methods for socio-economic performance evaluation. J. Oper. Res. Soc. 2025, 1–27. [Google Scholar] [CrossRef]
- Güçlü, P. Comparative analysis of the MCDM methods with multiple normalization techniques: Three hybrid models combine MPSI with DNMARCOS, AROMAN, and MACONT methods. Bus. Econ. Res. J. 2024, 15, 129–154. [Google Scholar] [CrossRef]
- Puška, A.; Božanić, D.; Mastilo, Z.; Pamučar, D. Extension of MEREC-CRADIS methods with double normalization-case study selection of electric cars. Soft Comput.-A Fusion. Found. Methodol. Appl. 2023, 27, 7097. [Google Scholar] [CrossRef]
- Al-Barakati, A.; Rani, P. Assessment of healthcare waste treatment methods using an interval-valued intuitionistic fuzzy double normalization-based multiple aggregation approach. Environ. Dev. Sustain. 2023, 26, 19397–19424. [Google Scholar] [CrossRef]
- Baydaş, M.; Yılmaz, M.; Jović, Ž.; Stević, Ž.; Özuyar, S.E.G.; Özçil, A. A comprehensive MCDM assessment for economic data: Success analysis of maximum normalization, CODAS, and fuzzy approaches. Financ. Innov. 2024, 10, 105. [Google Scholar] [CrossRef]
- Keshavarz-Ghorabaee, M.; Amiri, M.; Zavadskas, E.K.; Turskis, Z.; Antucheviciene, J. Determination of objective weights using a new method based on the removal effects of criteria (MEREC). Symmetry 2021, 13, 525. [Google Scholar] [CrossRef]
- Puška, A.; Nedeljković, M.; Šarkoćević, Ž.; Golubović, Z.; Ristić, V.; Stojanović, I. Evaluation of Agricultural Machinery Using Multi-Criteria Analysis Methods. Sustainability 2022, 14, 8675. [Google Scholar] [CrossRef]
- Puška, A.; Štilić, A.; Stojanović, I. Approach for multi-criteria ranking of Balkan countries based on the index of economic freedom. J. Decis. Anal. Intell. Comput. 2023, 3, 1–14. [Google Scholar] [CrossRef]
- Stević, Ž.; Brković, N. A Novel Integrated FUCOM-MARCOS Model for Evaluation of Human Resources in a Transport Company. Logistics 2020, 4, 4. [Google Scholar] [CrossRef]
- World Bank Open Data. 2025. Available online: https://data.worldbank.org/ (accessed on 1 June 2025).
- Sustainable Statistics. 2025. Available online: https://www.statista.com/search/sustanable (accessed on 1 June 2025).


Disclaimer/Publisher’s Note: The statements, opinions and data contained in all publications are solely those of the individual author(s) and contributor(s) and not of MDPI and/or the editor(s). MDPI and/or the editor(s) disclaim responsibility for any injury to people or property resulting from any ideas, methods, instructions or products referred to in the content. |
© 2025 by the authors. Licensee MDPI, Basel, Switzerland. This article is an open access article distributed under the terms and conditions of the Creative Commons Attribution (CC BY) license (https://creativecommons.org/licenses/by/4.0/).