Abstract
The studies in epidemic-like processes have drawn much attention for the last decades. Structural or dynamical heterogeneity has been reported to have great impact on the statistical properties of the epidemic dynamics. In this work, we investigate the susceptible-infected-susceptible (SIS) process with heterogeneous infection and curing rates in wheel graphs. Specifically, the wheel graph is composed of a center node with one infection setting while the others are with another infection setting. We first apply an individual-based mean-field approximation framework to model and analyze the concerned SIS process in wheel graphs. We derive the approximate solutions of the steady-state fraction of infected nodes as well as the epidemic threshold. We conduct simulations to verify the proposed theories. This work has the potential to expand our understanding of the complex impact of dynamical and structural heterogeneity over dynamics of epidemic-like processes.
Keywords:
mean-field approximation; susceptible-infectious-susceptible (SIS); epidemic model; wheel graph MSC:
05C50; 05C82; 37H20; 60J28
1. Introduction
The last few decades have witnessed rapid developments in the modeling and analysis of the epidemic-like processes in networks [1,2,3,4]. Two of the most studied, basic epidemic-like processes are the susceptible-infected-susceptible (SIS) process and the susceptible-infected-recovered (SIR) process. The SIS process assumes that an individual could be one of the two states, namely, susceptible state or infected state. An infected individual is capable of infecting one of its neighbors and the viral state of its neighbor would change. On the other hand, any infected individual would recover. For the SIR process, if an infected individual recovers, it will never become infected. The relation between individuals is usually described by the topology of networks. A complex network may be a single-layered one or a multi-layer one composed of multi-networks connecting to each other. The topology of a network could be static without dynamics in structure, or dynamical and changing according to some patterns.
The structure of networks poses great impact on the statistical properties of dynamics. Methodologies such as mean-field approximations [1,5,6], message-passing [7], master equation [8] and others were proposed to investigate the impact of topology on dynamics. Pastor-Satorras et al. investigated thoroughly the epidemic-like processes in single-layer network with static or dynamical topology [1]. Bianconi reviewed numerous related works on multilayer networks and provided insights into the impact of multilayer structure on dynamics [2]. In order to characterize high-order relations beyond pair-wise interaction, the models, such as simplicial complex and hypergraph, are employed to describe the high-order structure of networks [9].
The heterogeneity of network structure as well as dynamical pattern makes great impact on the epidemic-like process. Investigations theoretically and empirically on the heterogeneity give insights into the statistical properties of dynamics. The SIS process with heterogenous infection rates in single networks is the most typical scenario which has attracted ample attention. Theoretical frameworks such as mean-field approximations have been employed to model and analyze this scenario. Only a limited amount of knowledge about the statistical properties could be derived and predicted straightforward from the general form of these frameworks. In this sense, much effort needs to be expended toward the generalization of this framework to various graphs, which help to provide mathematical as well as physical insights into the impact of structural heterogeneity over SIS process. Previous theories are usually verified via some simple and typical kind of graphs such as complete graph, bipartite graph and star graph. Still, it is of great interest to investigate the frameworks in various special types of graphs [10,11]. Each type of graphs exhibits a unique combination of properties, making them useful in different scenarios. Theories derived for specific graphs could be simply and directly employed by those from the research area like computer networks. In this work, we investigate the SIS epidemic process with heterogeneous infection and curing rates in finite-size wheel graphs. Specifically, by means of an individual-based mean-field approximation framework, we model and analyze the concerned SIS process in the wheel graph. We confine ourselves to the scenario where the center node is with one specific infection setting while all the other nodes possess another one. We derive the steady-state mean fraction of infected nodes. Also, we obtain the epidemic threshold for the concerned scenario. We conduct simulations to verify the proposed theories. Experimental results demonstrate the accuracy of the proposed theories which give approximations to the steady-state properties of the SIS process in wheel graphs. To the best of our knowledge, this work is the first to investigate the statistical properties of the heterogeneous SIS process in wheel graphs. This work could be regarded as a useful supplementary to previous works. From the point view of topology, compared to those like star graph and complete graph which are commonly studied, the wheel graph is hard to investigate for it could be considered a more complex of a star and a ring. Wheel graph exhibits high-degree symmetry. These features make it too unique to study.
This is organized as follows. Section 2 gives a review of related works. Section 3 first introduces useful notations and rehearse the theoretical framework we employed. Then, the approximate solutions of the steady-state mean fraction of infected nodes as well as the epidemic threshold are derived. The method of experiments is presented. Section 4 demonstrates the simulations for the comparison between the proposed theory and the simulation results. The accuracy of the proposed theories is also verified.
2. Literature Review
The epidemic-like process in networks could be investigated from the view point of the structure heterogeneity. Pastor-Satorras et al. applied the mean-field approximation methodology to characterize the structural heterogeneity over dynamics and reported the existence of an epidemic threshold for single and static networks [12]. Chakrabarti et al. [13] and Van Mieghem [14] investigated impact of topology of finite networks over discrete-time and continuous-time SIS process, respectively. These works provided approximated solutions to calculate the steady-state prevalence of the epidemics. Another critical statistical property, i.e., the epidemic threshold, could be approximately calculated and bounded by the largest eigenvalue of the adjacency matrix of topology for SIS process in finite single networks [13,14], multilayer networks [2] or high-order structure [9,15]. Using a perturbation approximation method, Wang et al. determined how the interconnection pattern between different layers affects the epidemic threshold for SIS process in interconnected networks which are a special sort of multilayer network [16]. Bianconi elaborated how the maximum eigenvalue of the reaction matrix of the multilayer network determines the epidemic threshold [2]. Burgio et al. focused on the dynamics of adaptive higher-order systems where some kind of adaptive group-level mechanisms are applied so as to affect the spread of contagion in hypergraphs by means of master equation methodology [15].
On the other hand, it is of interest to investigate the epidemic-like process in networks from the viewpoint of the heterogeneity of dynamics. The SIS process with homogeneous nodal infection and curing rates in single and multilayer networks have been studied previously [1,2]. The epidemic threshold could be regarded as a critical point for the effective infection rate defined as the infection rate divided by the curing rate such that the epidemics would persist if and otherwise. In order to characterize the SIS process with heterogeneous infection and curing rates, Van Mieghem and Omic extended the N-intertwined mean-field approximation (NIMFA) to the heterogeneous NIMFA (HNIMFA) [17]. It was reported that introducing a complex matrix incorporating adjacency matrix and effective infection rate helps in analyzing the statistical properties like epidemic threshold.
The structural or dynamical heterogeneity may appear in a more complex form and a mixed pattern. Dong et al. investigated a complex scenario where an epidemic-like rumor propagating on simplex via some kind of adaptive transitions between active and passive individuals [18]. Dong et al. pointed out that high-order interactions can lower the epidemic threshold when investigating a rumor propagation model on 2-simplex. The above-mentioned works mostly focused on the process with a Markov property. In contrast, Lin et al. focused on the non-Markovian propagation on high-order structures and reported some kind of equivalence between Markovian and non-Markovian [19]. Another implicit assumption of most previous works is the independence of the dynamical process and the network topology. Cai et al. revealed the recovery probability could be affected by the network structure in continuous-time SIS process in static and annealed network [20].
Previous works were proposed and suited to the SIS process in general networks. It is still intriguing to apply these theories to specific types of networks. The steady-state fraction of infected nodes as one of the most studied statistical properties has attracted much attention. Chakrabarti et al. [13] and Van Mieghem [14] derived the approximations to the steady-state fraction of infected nodes for SIS process with homogeneous infection and curing rates. Omic and Van Mieghem employed the NIMFA framework to derive approximations to the variance as well as bounds on the variance of probability of nodal infection for SIS process with homogeneous infection and curing rates in general finite networks [21]. Especially, Omic and Van Mieghem obtained the expressions for the complete bipartite graphs. Jiao et al. derived the approximations to the steady-state fraction of infected nodes as well as the epidemic threshold for the SIS process with heterogeneous infection rates and curing rates in bipartite graphs and star graphs [22]. For the same scenario, Guo et al. investigated the variance of the epidemic dynamics and derived the approximations to the SIS process [23]. Wang et al. investigated the steady-state fraction of infected nodes as well as the epidemic threshold for the SIS process with heterogeneous curing rates in complete graphs [24]. Based on the works in [24], Guo et al. derived the variance and verified the accuracy [25]. Zhao and Liu proposed a model to incorporate the disease process and the control strategy over the disease in bipartite networks [10]. Using optimization method, they investigated an optimal control problem for reducing cost of disease control and provided the optimal solutions. Jafarizadeh investigated the problem of optimizing the convergence rate to the healthy state with constrains on the total curing resources for controlling the SIS process in complete bipartite networks [11]. By working out the corresponding multi-objective optimization problem, Jafarizadeh found out the Pareto solution.
3. Methodology
3.1. Notations and Model
The SIS process with homogeneous infection and curing rates is composed of two independent Poisson processes, namely, the infection process and the curing process. A schematic diagram of the SIS process in a finite network with N nodes is shown in Figure 1. The network could be represented by a graph where nodes and links describe individuals and some sort of relations between them, respectively. The topology of a finite network is denoted by an adjacency matrix A. We consider the network where the relation between any nodal pair is symmetric. A node i is regarded as a neighbor of a node j if there is a link between them. The topology of this kind of network is denoted by a symmetric adjacency matrix , where if there is no link between the i-th node and the j-th node, and if there is a link between these nodes.
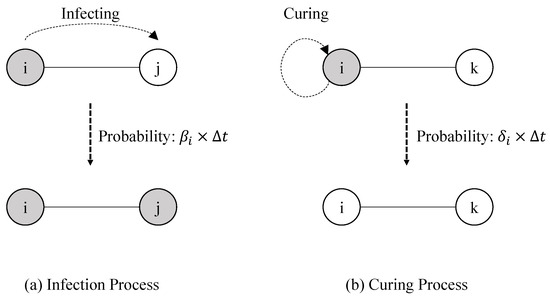
Figure 1.
Schematic diagram of the SIS process consisting of two independent Poisson processes from a nodal pairwise viewpoint. (a) The infection process describes the Poisson process between a nodal pair where the node i is infected and the node j is susceptible. Over a small time interval , the probability of infection transmission is , meaning that the node i would infect its susceptible neighbor j at rate . (b) The curing process shows that a node i being in the infection state recovers and becomes the susceptible state with probability over a small time interval .
At any time, each node could be one of the two viral states, namely the infected state or the susceptible state. We denote by a Bernoulli random variable , the state of the node i at time t, such that . The variable means that the node i is in the infected state. Otherwise, the variable represents that the node i is in the susceptible but healthy state. The infection process between the nodal pair in a network is a Poisson process where the infected node i tends to infect its susceptible neighbor j at rate , as shown in Figure 1a. In other words, the probability of infection transmission is over a small time interval . The infection process assumes that the neighbor j should remain susceptible during the time interval . If the node i can manage to infect its susceptible neighbor j, the viral state of the node j would change to the infected state. The curing process could be described as a Poisson process where an infected node i would recover and change to the susceptible state at a rate , as shown in Figure 1b. We denote by the probability of the viral state being in the infected state at time t. Then, the probability represents that the viral state is in the susceptible state. For the special case where and for any i, the SIS process is named as the homogeneous one. Otherwise, it is named as the heterogeneous SIS process or the in-homogeneous SIS process.
In this work, we confine to the SIS process with heterogeneous infection and curing rates in a wheel graph. Figure 2 is a schematic diagram of the concerned scenario, where the wheel graph with 6 nodes is composed of a circuit of 5 nodes as well as a center node connecting to each node of the circuit. A circuit is a graph where each node is only connected to its previous and next nodes such that its topology appears to be a circle. Specifically, we consider the scenario where the wheel graph is composed of a center node with infection rate and curing rate while the others are assigned the setting . In other words, the infection and the curing rates of the center node are and , respectively. The infection and the curing rates of the other nodes are and . It is straightforward to regard the SIS process with heterogeneous infection and curing rates in the wheel graph as a system. The viral state of the system could be denoted by a vector with the i-th component representing the viral state of node i.
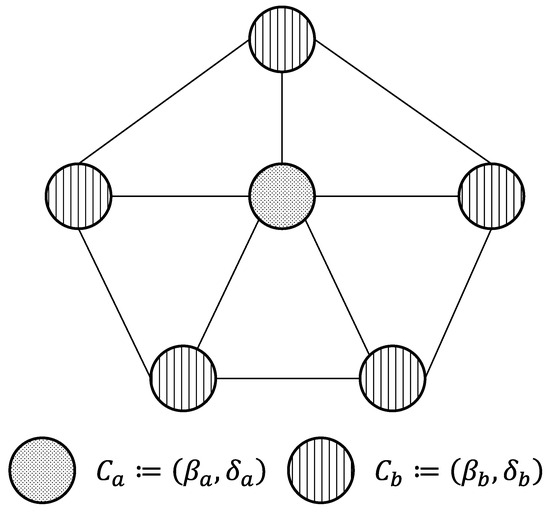
Figure 2.
The concerned scenario is the SIS process with heterogeneous infection and curing rates in the wheel graph. The center node is assigned the infection setting , while the others are assigned the infection setting .
We denote by and the topology of a wheel graph and a circuit graph, respectively. A wheel graph with nodes is composed of a center node as well as a circuit graph of N nodes. Equation (1) represents the adjacency matrix of the wheel graph with 6 nodes:
where is the all-one vector and is defined as
The HNIMFA model [17], employed as the theory framework in this work, is elaborated in the following. For a network with nodes, the exact differential equation for the viral state of a specific node i in the network can be expressed as
The nodal viral state at time t is rewritten as
by means of the property of Bernoulli variable. Using the assumption that and after some manipulations, the differential equation is rewritten as
Similarly, the ordinary differential equations for all nodal viral states can be expressed as
Denoting by , these equations can be further rewritten in the matrix form,
3.2. Steady-State Fraction of Infected Nodes
For the concerned scenario shown in Figure 2 such that
we investigate the statistical properties of the heterogeneous SIS process in the wheel graph composed of one center node and a circuit of N nodes.
Substituting the settings (8)–(10) of the concerned scenario into (7) leads to
where we denote by the viral state of the center node without loss of generality and by .
We then arrive at
where .
For , where and , we get
The mean fraction of infected nodes is one intriguing statistical property for the steady state. Since the infection rate as well as curing rate of any node of the circuit is equal, the steady-state property of a node of the circuit is equivalent to the others. We denote by and the mean fraction of infected nodes at time t and its steady-state mean value, respectively. We could derive the exact solution to , shown as Theorem 1.
Theorem 1.
For the concerned scenario shown in Figure 2, the mean value of the steady-state fraction of infected nodes can be calculated by
where and are the solutions of the following equations:
and
Proof of Theorem 1.
Because the whole network is composed of the center node and the other N nodes, the steady-state fraction of infected nodes for the whole wheel graph can be written as a linear combination (14) of one center node and the other N nodes constituting a circuit. The steady-state properties of any node in the circuit is equivalent. If we can derive the expressions for the steady-state viral states of the center node as well as any other node, we can calculate .
3.3. Epidemic Threshold
For the SIS process with homogeneous infection rate and curing rate in finite networks, there exists an epidemic threshold [13,14]. Specifically, if we observe the steady-state fraction of infected nodes as a function of the effective infection rate , there exists a specific value such that if or if . In other words, a kind of virus can persist in a network if the effective infection rate . Otherwise, the virus will disappear quickly and stop existing. The existence of the epidemic threshold could be observed and verified via simulations. It was proved that the inverse value of the largest eigenvalue of the adjacency matrix is an upper bound for the epidemic threshold [13,14].
For the heterogeneous SIS process in networks, the epidemic threshold appears to be the form of a vector rather than a scalar. In order to investigate the epidemic threshold for the heterogeneous SIS process, we introduce the matrix defined as
The matrix R was reported to be related to the epidemic threshold of heterogeneous SIS process in finite networks [17], shown as Lemma 1.
Lemma 1.
For the heterogeneous SIS process in a connected graph, the epidemic threshold is determined by the vector which follows .
Proof of Lemma 1.
The proof is shown as Theorem 3 in [17]. □
For the concerned scenario, we can obtain a relation between the matrix R and the vector of the epidemic threshold, where the vector is a special effective infection rate .
Theorem 2.
The epidemic threshold for the concerned heterogeneous SIS process in the wheel graph composed of one center node and the other N nodes is the vector of a special effective infection rate that obeys
where and . In other words, any combination meets Equation (21) implies a specific epidemic threshold.
Proof of Theorem 2.
According to Lemma 1, the epidemic threshold is a vector which meets . By means of Lemma 1 as well as several theorems about the largest eigenvalue of wheel graph [26], we could find out the setting . The details of the proof are shown in Appendix A. □
3.4. Simulation Method
It is proper to regard the SIS process as a system in a finite network. Specifically, we define the system state by the vector of the viral state. The probability of the system state being is not zero for the SIS process in finite networks. So, the real steady state of the system state is the one with all nodes being susceptible, which is named the absorbing state. Once the system gets into the absorbing state, it is not capable of leaving it. It is intriguing to investigate the metastable state rather than the steady state of the SIS process in a finite network. It was reported that the steady state of NIMFA provides a proper approximation to the metastable state of the SIS process in a finite network.
Though it is hard to define and detect the metastable state for the pure SIS process in finite networks, it is possible to employ a simulation method named -SIS model to approximately simulate the pure SIS process. Van Mieghem proposed the et al. -SIS model by introducing an extra self-infection process into the SIS process [27]. Each node is assigned with an independent self-infection process with rate so that every node will try to infect itself. In this way, the absorbing state will never exist for the transition probability from to any other system state is not zero. There is no need to detect the absorbing state while conducting simulations by -SIS model. Simulations by means of -SIS model with tiny but proper provide promisingly accurate experimental results [28].
We use the -SIS model to approximately simulate the SIS process. The self-infection rate is set to be . For a fix configuration of SIS-process parameters, we start one instance of -SIS model and record the concerned values of system state until the end of a predefined simulation time. Then, we could calculate several critical statistics based on the recorded data.
4. Results
4.1. Time Evolution and Steady State
We implement a simulator which is based on the -SIS model described in Section 3.4. After initiating an instance of simulation, the simulator keeps recording the state change of the system as time changes.
Figure 3 shows an instance of simulation. Specifically, it shows the number of infected nodes as a function of the simulation time for the SIS process with heterogeneous infection and curing rates in the wheel graph with nodes. The thin curves and the thick straight line represent the simulation results and the steady-state mean value of fraction of infected nodes calculated by the proposed theory (14). We could obtain the expectation of the steady-state fraction of infected nodes by calculating the time-average value of the simulation results.
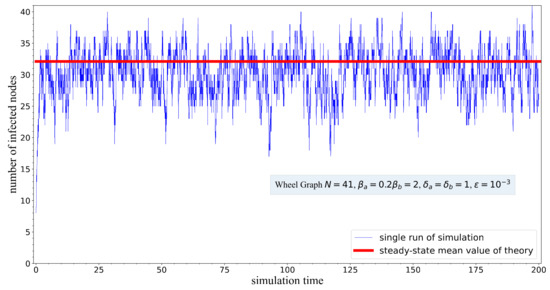
Figure 3.
The temporal evolution of the fraction of infected nodes for one single run of the simulation. The curves denote the simulation results obtained by means of the -model. The straight line represents the theoretical results calculated by (14).
4.2. Steady-State Infection Fraction
The comparisons of the fraction of infected nodes as a function of infection rate are shown in Figure 4 and Figure 5 for different configurations. The scattered markers and the dotted curves represent the simulation results and the theory for the steady-state fraction of infected nodes.
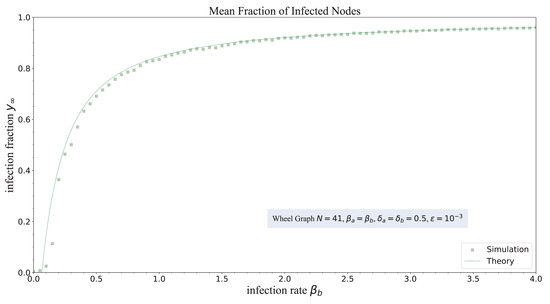
Figure 4.
The steady-state mean value of fraction of infected nodes versus the infection rate for . Scattered markers and curves represent the simulation results and the theoretical results (14), respectively.
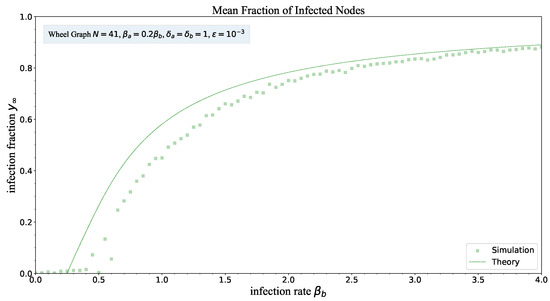
Figure 5.
The steady-state mean value of fraction of infected nodes versus the infection rate for . Scattered markers and curves represent the simulation results and the theoretical results (14), respectively.
Each data point, i.e., one marker, is computed based on simulation results for a given and fixed configuration of SIS process in the wheel graph with nodes. Running one simulation instance and then calculating the time-average value of the fraction of infected nodes leads to the value of one data point specified by a marker in the figures.
5. Discussion
According to the time evolution of the number of infected nodes shown in Figure 3, the curve representing the number of infected nodes rises up at the beginning and then reaches a plateau, followed by some fluctuations lasting for a long period. The simulation results show the existence of the metastable state which appears to be a kind of plateau. Also, Figure 3 demonstrates that the simulation results could be approximated by the proposed theory (14) for the given configuration of infection rates and curing rates.
The comparisons shown in Figure 4 and Figure 5 demonstrate that the theory derived in Theorem 1 could provide proper approximations to the SIS process with heterogeneous infection and curing rates in the wheel graph. Especially for large infection rate , the proposed theory exhibits promising accuracy in predicting the steady-state mean fraction of infected nodes. Though there appear to be some deviations between the theory and the simulations for small , the deviations are still limited and could be ascribed to the assumptions used by the NIMFA framework. The proposed theory overestimates the simulation results for any configuration. The employed NIMFA framework uses the assumption that such that is overestimated for [14]. For a given , the theoretical result is larger than the simulation result. But the discrepancy between theory and simulation decreases gradually as the infection rate increases. For large effective infection rate , the discrepancy would become smaller.
The steady-state mean fraction of infected nodes stays low for the regime of small infection rate . At some critical point, the fraction rises suddenly, followed by a smooth increase. For large infection rate , the fraction would stay steady and gradually get close to one. The observed critical point verifies the existence of an epidemic threshold for any configuration of simulation. The epidemic threshold depends on the configuration of the SIS process in the wheel graph. Though the theory derived in Theorem 2 is not that accurate, it provides a bound on the epidemic threshold.
6. Conclusions
Deriving general exact expressions with promising accuracy and computational complexity for critical statistical properties of the SIS process with heterogeneous infection and curing rates in finite networks is still challenging. But, it is still possible and intriguing to concentrate on special sorts of networks and obtain solutions to several critical statistical properties. In this work, we focused on the scenario of the SIS process with heterogeneous infection and curing rates in wheel graphs. We employed the HNIMFA framework to model and analyze the statistical properties including the steady-state fraction of infected nodes as well as the epidemic threshold. Specifically, we focused on the wheel graph composed of the center node with infection setting different from the other nodes. We applied the HNIMFA framework to the concerned scenario and derived the expectation of the steady-state fraction of infected nodes. We also proved the condition that the epidemic threshold must follow. Then, we employed the -SIS model to conduct simulations to verify the proposed theories. In addition, we provided explanations to the discrepancy between the simulation results and the proposed theories.
In future works, we will apply the HNIMFA framework to analyze other sorts of finite networks. It is also important to improve the accuracy of the approximations while keeping the computational complexity low. The expectation of the fraction of infected nodes draws much attention. The variance, as one of the statistical properties, is also critical to characterize the dynamics of epidemic-like processes. But there is a lack of related works. The NIMFA framework, as an individual-based low-order mean-field approximation, has difficulty in achieving high accuracy. Employing methodologies such as master equation [8] or high-order approximations [5,29] may help to keep a balance between prediction accuracy and computational complexity. Though main our works are limited to the SIS process, we would like to expand our work to accommodate the SIR process. The applications of model in predicting real-world epidemic process is of great interest. It is still challenging to incorporating the conventional model-driven method and the data-driven method to verify the applicability of previous models or improve these models.
Author Contributions
Conceptualization, L.J. and D.G.; methodology, L.J.; software, L.J. and D.G.; validation, L.J., D.G. and Y.W.; formal analysis, L.J.; investigation, D.G.; resources, L.J. and D.G.; data curation, L.J. and D.G.; writing—original draft preparation, L.J., D.G. and Y.W.; writing—review and editing, L.J., D.G. and Y.W.; visualization, L.J. and D.G.; supervision, L.J. and D.G.; project administration, D.G.; funding acquisition, L.J. and D.G. All authors have read and agreed to the published version of the manuscript.
Funding
This work was supported by the National Natural Science Foundation of China under Grant 62202059.
Data Availability Statement
The raw data supporting the conclusions of this article will be made available by the authors upon request.
Acknowledgments
We would like to thank the anonymous reviewers for their insightful suggestions and comments.
Conflicts of Interest
The authors declare no conflicts of interest.
Abbreviations
The following abbreviations are used in this manuscript:
| SIS | Susceptible Infected Susceptible |
| NIMFA | N-Intertwined Mean-field Approximation |
| HNIMFA | Heterogeneous N-Intertwined Mean-field Approximation |
Appendix A. Proof of Theorem 2
We denote by and the adjacency matrix. Substituting the effective infection rates and for into leads to
We start by the effective infection matrix for the circuit graph, i.e.,
The maximum eigenvalue of a circuit graph is , which was proved in [26] ((5.6) on p. 123). We thus get . We denote by and .
Adding another node to and connecting with all existing nodes leads to a new matrix with maximum eigenvalue proved in [26] (art. 60 on p. 61). Hence, the max eigenvalue could be expressed as
where .
Substituting and into (A3) and after some manipulations lead to
The epidemic threshold is determined by . For any combination, meets , the epidemic threshold can be expressed as according to Lemma 1.
References
- Pastor-Satorras, R.; Castellano, C.; Van Mieghem, P.; Vespignani, A. Epidemic processes in complex networks. Rev. Mod. Phys. 2015, 87, 925–979. [Google Scholar] [CrossRef]
- Bianconi, G. Multilayer Networks: Structure and Function; Oxford University Press: Oxford, UK, 2018. [Google Scholar] [CrossRef]
- de Arruda, G.F.; Rodrigues, F.A.; Moreno, Y. Fundamentals of spreading processes in single and multilayer complex networks. Phys. Rep. 2018, 756, 1–59. [Google Scholar] [CrossRef]
- de Arruda, G.F.; Aleta, A.; Moreno, Y. Contagion dynamics on higher-order networks. Nat. Rev. Phys. 2024, 6, 468–482. [Google Scholar] [CrossRef]
- Ward, J.A.; Tapper, A.; Simon, P.L.; Mann, R.P. Micro-scale foundation with error quantification for the approximation of dynamics on networks. Commun. Phys. 2022, 5, 71. [Google Scholar] [CrossRef]
- Silva, D.H.; Rodrigues, F.A.; Ferreira, S.C. Accuracy of discrete- and continuous-time mean-field theories for epidemic processes on complex networks. Phys. Rev. E 2024, 110, 014302. [Google Scholar] [CrossRef]
- Newman, M.E.J. Message passing methods on complex networks. Proc. R. Soc. Math. Phys. Eng. Sci. 2023, 479, 0774. [Google Scholar] [CrossRef]
- Ortega, E.; Machado, D.; Lage-Castellanos, A. Dynamics of epidemics from cavity master equations: Susceptible-infectious-susceptible models. Phys. Rev. E 2022, 105, 024308. [Google Scholar] [CrossRef]
- Majhi, S.; Perc, M.; Ghosh, D. Dynamics on higher-order networks: A review. J. R. Soc. Interface 2022, 19, 43. [Google Scholar] [CrossRef] [PubMed]
- Zhao, R.; Liu, Q. Dynamical behavior and optimal control of a vector-borne diseases model on bipartite networks. Appl. Math. Model. 2022, 102, 540–563. [Google Scholar] [CrossRef]
- Jafarizadeh, S. Convergence Speed and Robustness Analysis of Epidemic Spreading Processes with Time-Delay. IEEE Trans. Netw. Sci. Eng. 2023, 10, 3818–3833. [Google Scholar] [CrossRef]
- Pastor-Satorras, R.; Vespignani, A. Epidemic dynamics and endemic states in complex networks. Phys. Rev. E 2001, 63, 066117. [Google Scholar] [CrossRef] [PubMed]
- Chakrabarti, D.; Wang, Y.; Wang, C.; Leskovec, J.; Faloutsos, C. Epidemic thresholds in real networks. ACM Trans. Inf. Syst. Secur. 2008, 10, 1:1–1:26. [Google Scholar] [CrossRef]
- Van Mieghem, P.; Omic, J.; Kooij, R. Virus Spread in Networks. IEEE/ACM Trans. Netw. 2009, 17, 1–14. [Google Scholar] [CrossRef]
- Burgio, G.; St-Onge, G.; Hebert-Dufresne, L. Characteristic scales and adaptation in higher-order contagions. Nat. Commun. 2025, 16, 4589. [Google Scholar] [CrossRef]
- Wang, H.; Li, Q.; D’Agostino, G.; Havlin, S.; Stanley, H.E.; Van Mieghem, P. Effect of the interconnected network structure on the epidemic threshold. Phys. Rev. E 2013, 88, 022801. [Google Scholar] [CrossRef]
- Van Mieghem, P.; Omic, J. In-homogeneous Virus Spread in Networks. arXiv 2014, arXiv:1306.2588. [Google Scholar] [CrossRef]
- Dong, Y.; Huo, L.; Perc, M.; Boccaletti, S. Adaptive rumor propagation and activity contagion in higher-order networks. Commun. Phys. 2025, 8, 261. [Google Scholar] [CrossRef]
- Lin, Z.; Han, L.; Feng, M.; Liu, Y.; Tang, M. Higher-order non-Markovian social contagions in simplicial complexes. Commun. Phys. 2024, 7, 175. [Google Scholar] [CrossRef]
- Cai, C.R.; Cai, D.Q. Correlation between transition probability and network structure in epidemic model. Chaos Solitons Fractals 2025, 194, 116142. [Google Scholar] [CrossRef]
- Omic, J.; Van Mieghem, P. Epidemic Spreading in Networks-Variance of the Number of Infected Nodes; Technical Report Report20090707; Quantum and Computer Engineering Department, Delft University of Technology: Delft, The Netherlands, 2009. [Google Scholar]
- Jiao, L.; Yin, H.; Guo, D.; Lyu, Y. Heterogeneous Malware Spread Process in Star Network. In Proceedings of the 2017 IEEE 37th International Conference on Distributed Computing Systems Workshops (ICDCSW), Atlanta, GA, USA, 5–8 June 2017; pp. 265–269. [Google Scholar] [CrossRef]
- Guo, D.; Jiao, L.; Jiao, J.; Meng, K. Variance of the Infection Number of Heterogeneous Malware Spread in Network. Appl. Sci. 2024, 14, 3972. [Google Scholar] [CrossRef]
- Wang, K.; Guo, D.; Quan, W. Analyzing NDN NACK on Interest Flooding Attack via SIS Epidemic Model. IEEE Syst. J. 2020, 14, 1862–1873. [Google Scholar] [CrossRef]
- Guo, D.; Jiao, L.; Feng, W. Statistical Properties of SIS Processes with Heterogeneous Nodal Recovery Rates in Networks. Appl. Sci. 2024, 14, 9987. [Google Scholar] [CrossRef]
- Van Mieghem, P. Graph Spectra for Complex Networks; Cambridge University Press: Cambridge, UK, 2010. [Google Scholar] [CrossRef]
- Van Mieghem, P.; Cator, E. Epidemics in networks with nodal self-infection and the epidemic threshold. Phys. Rev. E 2012, 86, 016116. [Google Scholar] [CrossRef] [PubMed]
- Li, C.; van de Bovenkamp, R.; Van Mieghem, P. Susceptible-infected-susceptible model: A comparison of N-intertwined and heterogeneous mean-field approximations. Phys. Rev. E 2012, 86, 026116. [Google Scholar] [CrossRef]
- Cator, E.; Van Mieghem, P. Second-order mean-field susceptible-infected-susceptible epidemic threshold. Phys. Rev. E 2012, 85, 056111. [Google Scholar] [CrossRef]
Disclaimer/Publisher’s Note: The statements, opinions and data contained in all publications are solely those of the individual author(s) and contributor(s) and not of MDPI and/or the editor(s). MDPI and/or the editor(s) disclaim responsibility for any injury to people or property resulting from any ideas, methods, instructions or products referred to in the content. |
© 2025 by the authors. Licensee MDPI, Basel, Switzerland. This article is an open access article distributed under the terms and conditions of the Creative Commons Attribution (CC BY) license (https://creativecommons.org/licenses/by/4.0/).