Article

Pricing and Emission Reduction Strategies of Heterogeneous Automakers Under the “Dual-Credit + Carbon Cap-and-Trade” Policy Scenario

College of Management Science, Chengdu University of Technology, Chengdu 610059, China
*
Authors to whom correspondence should be addressed.
Mathematics 2025, 13(14), 2262; https://doi.org/10.3390/math13142262
Submission received: 4 June 2025 / Revised: 2 July 2025 / Accepted: 10 July 2025 / Published: 13 July 2025

Abstract

Against the backdrop of increasingly severe global climate change, the automotive industry, as a carbon-intensive sector, has found its low-carbon transformation crucial for achieving the “double carbon” goals. This paper constructs manufacturer decision-making models under an oligopolistic market scenario for the single dual-credit policy and the “dual-credit + carbon cap-and-trade” policy, revealing the nonlinear impacts of new energy vehicle (NEV) credit trading prices, carbon trading prices, and credit ratio requirements on manufacturers’ pricing, emission reduction effort levels, and profits. The results indicate the following: (1) Under the “carbon cap-and-trade + dual-credit” policy, manufacturers can balance emission reduction costs and NEV production via the carbon trading market to maximize profits, with lower emission reduction effort levels than under the single dual-credit policy. (2) A rise in credit trading prices prompts hybrid manufacturers (producing both fuel vehicles and NEVs) to increase NEV production and reduce fuel vehicle output; higher NEV credit ratio requirements raise fuel vehicle production costs and prices, suppressing consumer demand. (3) An increase in carbon trading prices raises production costs for both fuel vehicles and NEVs, leading to decreased market demand; hybrid manufacturers reduce emission reduction efforts, while others transfer costs through price hikes to boost profits. (4) Hybrid manufacturers face high carbon emission costs due to excessive actual fuel consumption, driving them to enhance emission reduction efforts and promote low-carbon technological innovation.

1. Introduction

With the acceleration of global climate governance and the rigid constraints of China’s “double carbon” goals, the automotive industry has been thrust into the critical stage of low-carbon transformation [1,2]. As the world’s largest automotive producer and consumer, China’s automotive industry accounts for 7–10% of the country’s total carbon emissions, making its emission reduction outcomes directly vital to fulfilling national climate commitments [3]. To overcome the diminishing efficiency of traditional fiscal subsidy policies, China has implemented the “dual-credit” policy since 2017. Through a market-oriented trading mechanism for Corporate Average Fuel Consumption (CAFC) credits and NEV credits [4], this policy seeks to establish a long-term incentive mechanism for enterprises’ low-carbon transformation. However, three structural contradictions have emerged during policy implementation: First, imbalance between credit supply and demand has triggered market failures. After the 2020 policy adjustment, the threshold for obtaining credits was raised, causing trading prices to surge from approximately 800 yuan/credit in 2019 to 2088 yuan/credit in 2021, with some transaction unit prices even exceeding 3000 yuan/credit. High credit costs have directly eroded automakers’ profits; for example, Changan Automobile’s profit per vehicle decreased by 4000 yuan. This has forced enterprises to adjust production strategies and increase investments in NEV production. Second, rigid policy constraints have led to cost shifting. Fuel vehicle enterprises have been compelled to adopt “credit procurement as a substitute for technological innovation” to meet NEV credit ratio requirements [5]. Data show that in 2022, for enterprises with low NEV penetration rates and reliance on fuel vehicle profits, credit procurement costs accounted for 15–20% of net profits. After the 2023 revision of the dual-credit Management Measures, the credit calculation standard for NEV models was reduced by 40%, and a 38% credit ratio target was set for 2025, further strengthening the policy’s technology-innovation-oriented guidance. Third, single-policy tools struggle to balance multiple objectives. According to 2022 “dual-credit” data, NEV positive credits reached 15,240,800 points that year, while negative credits were only 462,600 points—a nearly 33-fold surplus of positive credits. This implies that even if all negative credits were offset by purchasing positive credits, transaction volume would account for only 3% of total positive credits. The large number of idle credits indicates partial failure of market regulation functions.
These structural contradictions suggest that as NEV market share continues to rise, the supply-demand dynamics of credits have changed significantly, weakening the promotional role of the “dual-credit” policy and necessitating further updates to its management measures. The cap-and-trade policy, through cross-industry quota flow and price discovery functions, can compensate for the lack of a flexible adjustment mechanism in the dual-credit policy [6]. For automotive enterprises, both the dual-credit and cap-and-trade policies bring changes in costs and benefits. Under the dual-credit policy, producing NEVs generates NEV credits that can be traded in the market for profits, incentivizing enterprises to increase R&D and production investments in NEVs; meanwhile, if an enterprise fails to meet fuel consumption credit standards, it must purchase credits to comply, increasing costs. The carbon trading market further raises emission costs for fuel vehicles, as the acquisition and trading of carbon emission quotas affect corporate costs. Enterprises exceeding emission limits must purchase additional quotas, representing extra expenses. From a societal perspective, studying the combined impact of these two policies on automotive enterprises can better evaluate the environmental benefits of policy portfolios. The synergistic effect of the dual-credit and cap-and-trade policies can more effectively reduce carbon emissions in the automotive industry and deal with environmental challenges like climate change.
Therefore, analyzing the mechanisms of different carbon policy combinations is of urgent practical importance. By examining the simultaneous effects of dual-credit and cap-and-trade policies, enterprises can more accurately assess market positioning and competitiveness to formulate rational pricing strategies for NEVs and fuel vehicles. This aids in determining optimal emission reduction levels and technology investment directions, unlocking enterprises’ emission reduction potential, and driving proactive measures to support national carbon goals.
Based on the above research context, the key issues to be addressed in this paper are as follows: (1) What are the optimal emission reduction and pricing strategies for different types of manufacturers under the “dual-credit + carbon cap-and-trade” policy combination? (2) How do key policy factors influence the formulation of optimal pricing and emission reduction strategies? (3) What are the differentiated strategies of heterogeneous manufacturers under the single dual-credit policy and “dual-credit + carbon cap-and-trade” policy scenarios.
To address the above issues, this study focuses on a monopoly market scenario and constructs decision models under the single dual-credit policy and the “cap-and-trade + dual-credit” policy. By establishing profit functions that include interaction terms of policy factors, the research derives critical conditions for manufacturers’ optimal decisions and reveals how monopolistic manufacturers adjust their pricing and emission reduction strategies in response to policy-induced changes. The study will quantitatively analyze the collaborative impact paths of credit prices, carbon trading prices, and policy intensity parameters, providing a theoretical basis for preventing policy failure risks in “winner-takes-all” market structures.
The research contributions of this study are threefold: First, this research constructs decision models for the sole dual-credit policy and the “carbon trading + dual-credit” policy in a monopolistic market context. It reveals the nonlinear effects of new energy vehicle (NEV) credit trading prices, carbon trading prices, and credit ratio requirements on automakers’ pricing, emission reduction effort levels, and profits, providing a new analytical framework for evaluating the synergistic effects of carbon policy combinations. Second, by constructing profit functions with interaction terms of policy factors, the study analyzes the critical conditions for manufacturers’ optimal decisions under different policies. This helps automakers adjust their production, pricing, and emission reduction strategies according to policy environments, offering practical guidance for enterprise decision optimization. Finally, the study quantitatively analyzes the synergistic impact pathways of credit prices, carbon prices, and policy intensity parameters, providing a theoretical basis for preventing policy failure risks in monopolistic market structures. It also offers references for policymakers to design scientific and reasonable policy mixes to promote the low-carbon transformation of the automotive industry.
The remaining sections are organized as follows: Section 2 reviews the relevant research on the dual-credit policy, carbon cap-and-trade policy, and their impacts on automotive supply chains and automakers’ production and emission reduction decisions. Section 3 describes the research problem’s scenario, specifying key assumptions such as emission reduction cost functions, credit calculation rules, and demand functions, and defining policy parameters and decision variables. Section 4 establishes decision models under the sole dual-credit policy and the “carbon trading + dual-credit” policy, respectively, solves for equilibrium solutions by scenario, and derives optimal pricing, emission reduction effort levels, and profits. Section 5 quantitatively analyzes the impacts of credit prices, carbon trading prices, and policy intensity on automakers’ pricing, emission reduction, demand, and profits, comparing the effects of the two policies. Section 6 uses Matlab for numerical simulations to visually demonstrate the nonlinear effects of policy factors on key variables. Section 7 summarizes the research findings, proposes policy implications and management recommendations, and identifies research limitations and future research directions.

2. Materials and Methods

This literature review is structured into three parts: research on the dual-credit and cap-and-trade policies, research on the impact of low-carbon policies on automotive supply chains, and research on production and emission reduction decisions of automakers in monopoly markets.

2.1. Research on Dual-Credit and Cap-and-Trade Policies

The introduction and widespread implementation of the dual-credit policy in the automotive industry have sparked extensive attention and in-depth research from academia. Studies on the policy’s mechanism and impacts have been conducted from multiple perspectives, including theoretical modeling, industry development, and compliant production. Li et al. (2023) selected listed NEV enterprises in China’s Shanghai and Shenzhen stock markets as research samples and used a Difference-in-Differences model to validate the policy’s positive effects on promoting the healthy development of the NEV industry [7]. Peng and Li (2022) reviewed the evolution of China’s NEV industry policies based on the 2T model and evaluated the intensity of the dual-credit policy using a Policy Intensity index, providing valuable references for policy optimization [8]. Ou et al. (2018) further used a quantitative model to accurately assess the policy’s role in improving NEV market penetration and driving sustained industry growth [9]. Cheng and Mu (2018) analyzed the policy’s specifics, noting its effectiveness in addressing production decision challenges faced by NEV manufacturers [10]. Chen et al. (2018) developed a game theory model covering joint decisions of traditional and EV manufacturers, analyzing how they adjust production strategies to optimize outcomes under the dual-credit policy [11]. Cheng et al. (2025) pointed out that in the field of power markets, recent research has innovatively integrated evolutionary game theory and deep reinforcement learning, providing a new perspective for optimizing market mechanisms. Its cross—disciplinary integration approach brings inspiration to the in-depth research and optimization of the dual-credit policy [12].
In the realm of cap-and-trade policy research, scholars have revealed its impacts on supply chain management, corporate operations, and environmental outcomes through diverse methodologies. Chaabane et al. (2012) demonstrated the effectiveness of cap-and-trade systems in reducing supply chain unit carbon emission costs [13]. Drake et al. (2016) modeled how manufacturers adopting low-carbon production strategies could achieve significant profit growth under cap-and-trade frameworks [14]. Song and Leng (2012) further showed that under certain conditions, the mechanism could boost expected profits while reducing emissions [15]. Wang and Wu (2021) analyzed waste recycling data to reveal that in closed-loop supply chains, manufacturer-led recycling strategies under cap-and-trade could maximize profits for all members [16]. Zhang et al. (2022) constructed a mathematical model for inventory management in closed-loop supply chains under cap-and-trade, emphasizing that government carbon quotas must be set within reasonable ranges to achieve both emission reductions and profit growth for supply chain members [17].

2.2. Impacts of Low-Carbon Policies on Automotive Supply Chains

The dual-credit policy has profoundly influenced pricing mechanisms, profit distribution, and emission reduction strategies in automotive supply chains. At the pricing and revenue allocation level, the policy reshapes supply chain pricing logic and profit distribution by affecting production planning for fuel and NEV manufacturers [18,19,20]. Cheng et al. (2022) developed a theoretical framework to analyze automakers’ production decisions and pricing behaviors under the policy [21]. Li et al. (2020) noted that the policy not only facilitates cross-industry chain collaboration in the NEV sector but also enhances overall industry profitability through such collaboration [22]. Ma et al. (2023) found that the dual-credit policy effectively stimulates NEV technological innovation [23]. Yu et al. (2023) further explored the policy’s innovation incentives and strategic choices for automakers. From an emission reduction strategy perspective, the policy pressures manufacturers to reduce fuel consumption and increase NEV production, motivating proactive emission reduction measures [3]. Yi et al. (2023) studied carbon emission reduction and investment in fuel vehicle supply chains under the policy [24], while Zhang et al. (2023) investigated how it influences automakers’ product line decisions and subsequent CO2 emissions [25].
As a key environmental regulation tool, the cap-and-trade policy has deeply impacted supply chain operational decisions, particularly in pricing and profit distribution. Xu et al. (2017) showed that fluctuations in carbon trading prices affect firms’ optimal production decisions and profit levels, with manufacturers’ profits positively correlated and retailers’ profits negatively correlated with carbon prices [26]. Luo et al. (2016) analyzed pricing and emission reduction decisions of competing manufacturers with differing emission reduction efficiencies under cap-and-trade [27]. Chen et al. (2021) explored how technology transfer between competing manufacturers under cap-and-trade impacts supply chain member profits and social welfare. In the realm of emission reduction efficacy [28], Chai et al. (2022) examined four carbon reduction strategies for manufacturing firms in remanufacturing contexts under cap-and-trade [29], while Tong et al. (2022) studied the dual impacts of carbon trading mechanisms and consumer low-carbon preferences on emission reduction strategies in vehicle manufacturer-led supply chains [30]. Xu et al. (2017) analyzed make-to-order supply chain decisions under cap-and-trade, finding that optimal production first decreases then stabilizes, while emission reduction levels first increase then stabilize as carbon prices rise [31]. Bai et al. (2018) compared optimal strategies in decentralized and centralized decision models, showing that centralized decision-making improves overall supply chain profits and reduces carbon emissions [32].

2.3. Production and Emission Reduction Decisions of Automakers in Monopoly Markets

Due to its significant economies of scale, broad industrial linkages, and high entry/exit barriers, the automotive industry is often characterized as an oligopolistic market. Scholars have analyzed firm behavior and strategy in monopoly contexts through various economic models. Yu et al. (2022) used supply chain network models to study non-cooperative competition in oligopolistic markets over finite planning horizons, showing that profit-driven firms enhance sustainable operations, emphasizing consumer education and identifying environmental policies for sustainable profitability [33]. Shao et al. (2019) compared monopoly and duopoly markets, recommending higher environmental taxes and lower EV subsidies in duopolies [34]. Yu et al. (2022) found that monopoly-competitive structures without scale economies hinder NEV diffusion, while credit cooperation using profit-sharing strategies mitigates this effect [35]. Liu et al. (2023) analyzed optimal product line strategies and policy impacts under dual-credit and subsidy phase-out policies for monopoly automakers [36]. Wang et al. (2024) constructed Stackelberg game models for monopoly and duopoly markets to refine government subsidy adjustment strategies for NEV development [37]. Zhou et al. (2024) investigated optimal rollover strategies and pricing for monopoly NEV manufacturers under stricter NEV credit calculation standards [38]. Stepanova and Tesorierre (2010) compared industry profits and R&D tendencies in non-cooperative/cooperative R&D models for duopolies and monopolies [39], while Ishikawa and Shibata (2021) studied asymmetric spillover effects on R&D investments in oligopolies, finding that received spillovers have greater impacts than emitted ones and increased competition may favor R&D rivalry over cooperation [40]. Cheng et al. (2025) conducted research on power markets, providing cross-disciplinary theoretical references and new analytical ideas for analyzing the dynamics of production decisions of automotive enterprises under emission reduction policies and evaluating the impact of policy combinations on emission reduction and sustainable development in the automotive industry [41].
In summary, as a substitute for traditional subsidy policies, the dual-credit policy has accelerated automakers’ transformation, increased NEV market share, and reduced fuel consumption. While existing studies provide valuable insights, gaps remain: most focus on single policies, with limited research on “dual-credit + cap-and-trade” policy combinations. Additionally, studies on low-carbon strategies often overlook supply chain firms’ competitive-cooperative dynamics, failing to integrate inter-manufacturer competition and collaboration into decision frameworks. In reality, such dynamics are crucial for balancing development and achieving win-win outcomes to drive industry efficiency. Current research on competitive-cooperative markets and low-carbon strategies is limited.
Building on these research gaps and considering the future policy scenario of integrating the dual-credit and carbon trading policies, this paper examines the production and emission reduction strategies of dual-production and pure NEV manufacturers in a monopolistic market. It analyzes the internal mechanisms and significance of how policy factors influence manufacturers’ production and low-carbon transformation. The study aims to reveal the underlying principles of policy combinations acting on different market structures, enrich the theoretical outcomes of incentive policies for the NEV industry and enterprises’ strategic production and transformation, and provide quantitative references for policy-making and corporate decisions. To emphasize the contributions of this study, relevant literature is systematically organized in Table 1.

3. Problem Description and Model Assumptions

3.1. Problem Description

In a monopoly market scenario, two types of automotive products are supplied: NEVs and fuel vehicles, sold by Manufacturer (M1) and Manufacturer (M2), respectively. M1 produces both NEVs and fuel vehicles, while M2 produces only NEVs. The two types of NEVs are homogeneous products for consumers. To investigate the impacts of different policies on automakers’ production, emission reduction, and pricing strategies, this study constructs decision models for automakers under the single “dual-credit” policy and the “cap-and-trade + dual-credit” policy. The following specific assumptions are made to ensure the rigor and feasibility of model analysis.

3.2. Model Assumptions

Assumption 1. 
To reduce carbon emissions from fuel vehicles and improve energy efficiency, M1 invests in emission reduction. Drawing on Jiang et al. (2022) [42], the emission reduction cost function for M1 to reduce fuel vehicle energy consumption is assumed as:
G ( θ ) = 1 2 τ θ 2
where τ is the emission reduction effort cost coefficient for M1, and θ is M1’s emission reduction effort level. This function reflects the characteristic of increasing marginal cost of emission reduction efforts. In reality, M1 can increase the level of emission reduction efforts by investing in the emission reduction level and technologies of fuel vehicles. For example, through measures such as R&D investment in engine combustion technology of fuel vehicles, application of lightweight vehicle materials, and development of intelligent energy management systems, the emission level of fuel vehicles can be reduced, thereby enhancing the level of emission reduction efforts.
Assumption 2. 
Assume the actual average fuel consumption value of fuel vehicles is e R , and the national specified average fuel consumption compliance value is e S . Currently, the fuel vehicle fuel consumption level fails to meet the standard, that is, e R > e S . Before emission reduction, M1 generates a CAFC negative credit of  e R > e S . For each fuel vehicle produced. After investing in emission reduction, the CAFC negative credit per fuel vehicle produced by M1 becomes e S ( 1 θ ) e R , where its positive/negative value depends on the emission reduction effort level.
Assumption 3. 
Each NEV produced by the two manufacturers generates a positive NEV credit of δ ( δ > 0 ) . Therefore, producing q NEVs results in NEV credits of q δ .
Assumption 4. 
Let the NEV credit ratio requirement be η , so that producing q fuel vehicles requires matching NEV credits of η q .
Assumption 5. 
CAFC negative credits from fuel vehicle production cannot be sold but can be offset by NEV positive credits. NEV positive credits from NEV production can be traded at the market price p N in credit transactions.
Assumption 6. 
Assume the total market demand for vehicles is 1, with a price sensitivity coefficient of 1 for both products and zero production costs (this assumption does not affect the conclusions but only reduces computational complexity). Consumer demand for fuel vehicles depends not only on price but also on preferences for NEVs and low-carbon awareness. Therefore, the demand functions for fuel vehicles and NEVs are assumed to be:
q 1 F = ( 1 α ) p 1 F + β θ
q i N = α p i N
where α ( 0 < α < 1 ) is the proportion of consumers preferring new energy vehicles, p 1 F is the price of fuel vehicles, β ( 0 < β < 1 ) is the low-carbon preference awareness of fuel vehicle consumers, and θ is the emission reduction effort level of M1. A larger α indicates a smaller proportion of consumers preferring fuel vehicles in the market. A larger β indicates that fuel vehicle consumers attach greater importance to emission reduction.
Assumption 7. 
In reality, credits under the dual-credit policy cannot be carried forward across years. Manufacturers maximize profits only by selling all NEV credits annually. Therefore, this study considers only the production and emission reduction strategies of the two monopoly manufacturers within a single period (one year).
Assumption 8. 
Based on real-world scenarios, NEVs require additional large batteries, resulting in higher carbon emissions during production than fuel vehicles. Let the unit carbon emissions from NEV production be c N and those from fuel vehicle production be c F , satisfying  c N > c F .
Assumption 9. 
In addition to being constrained by the dual-credit policy, both manufacturers are also subject to the cap-and-trade policy. At the initial production stage, manufacturers receive free initial carbon allowances. During actual production: If a manufacturer’s actual total carbon emissions exceed T , it must purchase the shortfall of carbon allowances from the carbon trading market; if actual total carbon emissions are below T , the manufacturer can sell surplus carbon allowances to the carbon trading market. The carbon trading price is   p c .
Assumption 10. 
To ensure the Hessian matrix is negative definite and the equilibrium solutions and profits are positive, without loss of generality, assume:
τ > max τ 1 , τ 2 , τ 3 ,   0 < p c < 1 α η e 1 + e 2 p N c F ,   0 < p N < 1 α η + e R e S .
To facilitate the model formulation, the relevant notations are defined as in Table 2.

4. Model Construction and Solution

4.1. Model 1: Monopoly Model Under the Single Dual-Credit Policy

When manufacturers are only constrained by the dual-credit policy, M1 decides the price of fuel vehicles, the price of NEVs, and the emission reduction effort level ( p 1 F , p 1 N , θ ) , while M2 only needs to decide the price of NEVs p 2 N . The two manufacturers do not affect each other. The price decisions and profit discussions of the manufacturers in the following two scenarios are as follows:
(1) Scenario 1: M1’s actual fuel consumption after emission reduction exceeds the compliance value.
In this scenario, the profit functions of the two manufacturers are as follows, respectively:
π 1 S 1 = p 1 F q 1 F + p 1 N q 1 N + p N e S ( 1 θ ) e R q 1 F p N η q 1 F + p N δ q 1 N 1 2 τ θ 2
π 2 S 1 = p 2 N q 2 N + p N δ q 2 N
When manufacturers are only constrained by the dual-credit policy, the two manufacturers do not affect each other. First, we derive the Hessian matrix of M1 profit π 1 : H = τ + 2 p β e R β p e R 0 β p e R 2 0 0 0 2 . Then, to ensure that the Hessian matrix satisfies the negative definiteness requirement, | H 1 | = τ + 2 p β e R < 0 , | H 2 | = β 2 + 2 τ 2 p N β e R p N 2 e R 2 > 0 , | H 3 | = 2 β 2 4 τ + 4 p N β e R + 2 p N 2 e R 2 < 0 . Thus, τ > 2 p N β e R and τ > 1 2 ( β + e R p N ) 2 . Let τ 1 = 1 2 ( β + p N e R ) 2 and τ 2 = 2 e R p N β , with { τ 1 , τ 2 } < τ . Finally, take the second derivative of M2’s profit π with respect to the NEV price p 2 N , 2 π S 1 * p 2 N 2 = 2 < 0 , π 2 is a concave function with respect to p 2 N , and thus attains a maximum value.
Thus, based on Equations (4) and (5), by taking the first-order derivatives of M1 profit π 1 with respect to the emission reduction effort level θ , the fuel vehicle price p 1 F , and the NEV prices and p 2 N , we can derive the optimal emission reduction effort level θ S 1 * , the optimal fuel vehicle price p 1 F S 1 * , the optimal NEV prices p 1 N S 1 * , p 2 N S 1 * , the fuel vehicle demand q 1 F S 1 * , and the NEV demands q 1 N S 1 * and q 2 N S 1 * .
Proposition 1. 
Under Scenario 1 of the single dual-credit policy, the equilibrium emission reduction effort level θ S 1 * , fuel vehicle price p 1 F S 1 * , NEV prices p 1 N S 1 * , p 2 F S 1 * , fuel vehicle demand  q 1 F S 1 * , NEV demands  q 1 N S 1 * , q 2 N S 1 * , profit of M1  π 1 S 1 * , and profit of M2  π 2 S 1 *  are respectively:
2 π S 1 * p 2 N 2 = 2 < 0
θ S 1 * = ( β + p N e R ) ( α 1 + p N ( η e S + e R ) ) β 2 2 τ + p N e R ( 2 β + p N e R )
p 1 N S 1 * = p 2 N S 1 * = α p N δ 2
q 1 F S 1 * = τ ( 1 + α + ( η e S + e R ) p N ) β 2 2 τ + p N e R ( 2 β + p N e R )
q 1 N S 1 * = q 2 N S 1 * = α + p N δ 2
π 1 S 1 * = Z 1
π 2 S 1 * = 1 4 ( α + p N δ ) 2
The value of  Z 1 is shown in  Appendix A.
(2) Scenario 2: M1’s Actual Fuel Consumption After Emission Reduction Is Less Than the Compliance Value.
In this scenario, the profit functions of the two manufacturers are as follows, respectively:
π 1 S 2 = p 1 F q 1 F + p 1 N q 1 N p N η q 1 F + p N δ q 1 N 1 2 τ θ 2
π 2 S 2 = p 2 N q 2 N + p N δ q 2 N
When manufacturers are only constrained by the dual-credit policy and do not affect each other, we first derive the Hessian matrix of M1’s profit π 1 : H = τ β 0 β 2 0 0 0 2 . Then, to ensure the requirement of the Hessian matrix being negative definite, | H 1 | = τ < 0 , | H 2 | = 2 τ β 2 > 0 , | H 3 | = 2 β 2 4 τ < 0 . Then: τ > 1 2 β 2 and τ > 1 2 ( β + p N e R ) 2 . Therefore, let τ 3 = 1 2 β 2 with the following constraint: max { τ 1 , τ 2 , τ 3 } < τ . Finally, take the second derivative of M2’s profit π 2 with respect to the NEV price p 2 N , 2 π S 1 * p 2 N 2 = 2 < 0 , π 2 is a concave function with respect to p 2 N , and thus attains a maximum value.
Meanwhile, the NEV prices p 1 N S 2 * and p 2 N S 2 * , the demands q 1 N S 2 * and q 2 N S 2 * , and M2’s profit π 2 S 2 * are consistent with the results of Proposition 1. Thus, based on Equation (13), by taking the first-order derivatives of M1’s profit π 1 with respect to the emission reduction effort level θ , the fuel vehicle price p 1 F , and the NEV price p 1 N , the optimal emission reduction effort level θ S 1 * , the optimal fuel vehicle price p 1 F S 1 * , and the fuel vehicle demand q 1 F S 1 * can be obtained.
Proposition 2. 
Under Scenario 2 of the single dual-credit policy, when M1’s actual fuel consumption after emission reduction is less than the compliance value, the NEV prices  p 1 N S 2 * , p 2 N S 2 * , demands  q 1 N S 2 * , q 2 N S 2 * , and M2’s profit  π 2 S 2 *  are consistent with the equilibrium results of Scenario 1. However, the equilibrium emission reduction effort level θ S 2 * , fuel vehicle price  p 1 F S 2 * , fuel vehicle demand  q 1 F S 2 * , and M1’s profit  π 1 S 2 *  are inconsistent, and are respectively:
θ S 2 * = ( ( 1 α ) p N η ) β 2 τ β 2
p 1 F S 2 * = ( 1 α ) τ + p N η ( τ β 2 ) 2 τ β 2
q 1 F S 2 * = τ ( 1 + α + p N η ) β 2 2 τ
π 1 S 2 * = 1 4 ( α + p N δ ) 2 2 τ ( 1 + α + p N η ) 2 ( β 2 + 2 τ ) ( β 2 2 τ ) 2

4.2. Model 2: Monopoly Model Under the “Dual-Credit + Carbon Cap-and-Trade” Policy

When manufacturers are simultaneously constrained by the dual-credit policy and the carbon cap-and-trade, the decision-making sequence is similar to the single dual-credit policy. M1 determines the fuel vehicle price, NEV price, and emission reduction effort level ( p 1 F , p 1 N , θ ) , while M2 only needs to determine the NEV price p 2 N . The two manufacturers do not affect each other. The price decisions and profit discussions of the manufacturers under the two scenarios are as follows:
(1) Scenario 1: M1’s Actual Fuel Consumption After Emission Reduction Is Greater Than the Compliance Value.
In this scenario, the profit functions of the two manufacturers are as follows, respectively:
π 1 C 1 = p 1 F q 1 F + p 1 N q 1 N p c ( c F q 1 F + c N q 1 N T 1 ) + p N ( e S ( 1 θ ) e R ) q 1 F p N η q 1 F + p N δ q 1 N 1 2 τ θ 2
π 2 C 1 = p 2 N q 2 N p c ( c N q 2 N T 2 ) + p N δ q 2 N
Based on the same derivation process as Proposition 1, Proposition 3 can be obtained through calculation.
Proposition 3. 
Under Scenario 1 of the dual policy, the equilibrium emission reduction effort level θ C 1 * , fuelvehicle price p 1 F C 1 * , NEV prices p 1 N C 1 * , p 2 N C 1 * , fuel vehicle demand q 1 F C 1 * , NEV demands p 1 N C 1 * , p 2 N C 1 * , profit of M1 π 1 C 1 * , and profit of M2 π 2 C 1 * are respectively:
θ C 1 * = ( β + p N e R ) ( α 1 + c F p c + ( η e S + e R ) p N ) β 2 2 τ + p N e R ( 2 β + p N e R )
p 1 F C 1 * = ( β + p N e R ) ( β c F p c + p N e R ( α + β + 1 ) + β p N ( η e S ) ) τ ( α + c F p c + p N ( e R e S + η ) + 1 ) β 2 2 τ + p N e R ( 2 β + p N e R )
p 1 N C 1 * = p 2 N C 1 * = α p N δ + p c c N 2
q 1 F C 1 * = τ ( 1 + α + c F p c + ( η e S + e R ) p N β 2 2 τ + p N e R ( 2 β + p N e R )
q 1 N C 1 * = q 2 N C 1 * = α + p N δ p c c N 2
π 1 C 1 * = Z 2
π 2 C 1 * = 1 4 ( α + p N δ ) 2 c N 2 p c 2 4 p c 1 2 c N ( α + p N δ c N p c ) T 2
The value of Z 2 is shown in  Appendix B.
(2) Scenario 2: Actual Fuel Consumption After Emission Reduction Is Less Than the Compliance Value. In this scenario, the profit functions of the two manufacturers are as follows, respectively:
π 1 C 2 = p 1 F q 1 F + p 1 N q 1 N p c ( c F q 1 F + c N q 1 N T 1 ) p N η q 1 F + p N δ q 1 N 1 2 τ θ 2
π 2 C 2 = p 2 N q 2 N p c ( c N q 2 N T 2 ) + p N δ q 2 N
Based on the same derivation process as Proposition 2, Proposition 4 can be obtained through calculation.
Proposition 4. 
Under Scenario 2 of the dual policy, when M1’s actual fuel consumption after emission reduction is less than the compliance value, the NEV prices p 1 F S 1 * , p 2 F S 2 * , demands  q 1 F S 2 * , q 2 N S 2 * , and M2’s profit π 2 S 2 * are consistent with the equilibrium results of Scenario 1. The equilibrium emission reduction effort level θ C 2 * , fuel vehicle price p 1 F C 1 * , fuel vehicle demand q 1 F C 2 * , M1’s profit π 1 C 2 * , and M2’s profit π 2 C 2 * are respectively:
θ C 2 * = β ( α 1 + c F p c + η p N ) β 2 2 τ
p 1 F C 2 * = ( β 2 τ ) ( c F p c + p N η ) + ( α 1 ) τ β 2 2 τ
q 1 F C 2 * = τ ( 1 + α + c F p c + p N η ) + ( c F + c N ) p c β 2 β 2 2 τ
π 1 C 2 * = Z 3
The value of Z 3 is shown in  Appendix C.

5. Model Analysis

5.1. Impact Analysis of Dual-Credit Policy Factors

This section mainly analyzes the effects of key policy factors in the dual-credit policy on equilibrium solutions. The selected key policy factors are the NEV credit ratio requirement, η , and the trading price of NEV credits, P N .
(1)
Impact of an increase in the NEV credit ratio requirement on fuel vehicle pricing:
Proposition 5. 
(1) As the NEV credit ratio requirement increases, the equilibrium price of fuel vehicles exhibits the following relationship: p 1 F S 1 * η > 0 , p 1 F C 1 * η > 0 , p 1 F S 2 * η > 0 , p 1 F C 2 * η > 0 ; (2) as the NEV credit trading price increases, the equilibrium prices of NEVs exhibit the following relationships: p 1 N S * p N < 0 , p 2 N S * p N < 0 , p 1 N C * p N < 0 , p 2 N C * p N < 0 .
Proof. 
See Appendix D. □
Proposition 5 reveals the impact of the NEV credit ratio requirement η on fuel vehicle pricing. Results show that as the NEV credit ratio increases, fuel vehicle prices rise accordingly. This is because increasing NEV production raises manufacturers’ overall costs, and to maintain profits, they typically pass these additional costs on to fuel vehicle pricing, making up for losses through price hikes. With changes in the NEV credit ratio, manufacturers need to comprehensively consider costs and consumer acceptance in their pricing strategies to ensure product market competitiveness and corporate profitability. When the NEV credit trading price P N rises, NEV manufacturers can obtain more revenue by selling credits, thereby reducing NEV prices to increase sales volume and market share. Meanwhile, to maintain competitiveness in the credit market, manufacturers will further reduce NEV pricing to attract more consumers and increase credit accumulation, which can be used to meet policy requirements or for trading.
Proposition 6. 
As the NEV credit trading price p N increases, the following is true: (1) q 1 N S * p N > 0 ; q 2 N S * p N > 0 ; (2) q 1 N C * p N > 0 ; q 2 N C * p N > 0 ; (3) When A > τ , q 1 F S 1 * p N > 0 ; When A < τ , q 1 F S 1 * p N < 0 ; (4) When B > τ , q 1 F C 1 * p N > 0 ; When B < τ , q 1 F C 1 * p N < 0 . (5) q 1 F S 2 * p N > 0 ; q 1 F C 2 * p N > 0 .
Proof. 
See Appendix E. □
Proposition 6 demonstrates the impact of the NEV credit trading price P N on the demand for fuel vehicles and NEVs under the two policies. The results show that under the single dual-credit policy, as the NEV credit trading price increases, the demand for NEVs by both M1 and M2 will rise. This is because an increase in the NEV credit trading price means that selling each additional NEV yields greater revenue. To compete for the NEV market, the two manufacturers will choose to lower prices. Since the price of NEVs is a key factor influencing their demand, NEV demand increases under both policies. The increase in NEV demand leads to a significant increase in M2’s operating income. Additionally, with the support of the “carbon cap-and-trade mechanism” policy, the demand for NEVs by both M1 and M2 will further increase.
In Scenario 1, the emission reduction effort cost coefficient moderates the relationship between fuel vehicle demand and NEV credit trading prices: When the emission reduction effort cost is low ( A > τ ), M1 tends to reduce the cost of offsetting CAFC negative credits through carbon emission reduction. With a high intensity of emission reduction, fuel vehicle demand is mainly affected by the level of emission reduction. Therefore, when the NEV credit trading price rises, fuel vehicle demand increases. When the emission reduction effort cost is high ( A < τ ), M1 is more inclined to iNEVst in NEV production, resulting in a low level of carbon emission reduction. The lack of fuel vehicle competition prevents significant price cuts, leading to a decline in fuel vehicle demand. Under the carbon cap-and-trade policy, M1 is constrained by carbon cap-and-trade, showing a situation similar to that under the single dual-credit policy. In Scenario 2, M1 focuses more on NEV production, resulting in a low level of emission reduction. The absence of fuel vehicle competitors prevents significant price reductions for fuel vehicles, ultimately leading to a decrease in fuel vehicle demand.
Proposition 7. 
As the NEV credit ratio requirement η increases, the following is true: q 1 F S * η < 0 ; q 1 F C * η < 0 .
Proposition 7 demonstrates that the increase in the NEV credit ratio requirement will affect the demand for fuel vehicles under both policies, and in either case, the demand for fuel vehicles shows a downward trend with the increase of η . This is because, on the one hand, the improvement in the NEV credit ratio requirement will enhance the visibility and availability of new energy vehicles in the market, making consumers more inclined to choose new energy vehicles and thus leading to the decrease in the demand for fuel vehicles; on the other hand, such an increase requires manufacturers to produce and sell more new energy vehicles to meet policy requirements, a fact that will prompt manufacturers to adjust their product portfolios. The relative cost of producing fuel vehicles increases, and manufacturers are more inclined to expand the market share of new energy vehicles, further pushing the demand for fuel vehicles to decline.
Proof. 
See Appendix F. □
(2)
Impact of an increase in the NEV credit ratio requirement on profits:
Proposition 8. 
(1) As the NEV credit ratio requirement increases, the following is true: π 1 S * η < 0 , π 1 C * η < 0 ; (2) as the NEV credit trading price increases, the following is true: π 2 S * p N < 0 , π 2 C * p N < 0 .
Proof. 
See Appendix G. □
Proposition 8 reveals the impact of the NEV credit ratio requirement η on the profit of M1 and the impact of the NEV credit trading price p N on the profit of M2. The study shows that as the NEV credit ratio requirement increases, the profit of M1 presents a downward trend: the increase in leads to the rise of production costs for fuel vehicles, prompting M1 to expand the market share of new energy vehicles and reduce investment in carbon emission reduction for fuel vehicles, resulting in a decline in fuel vehicle demand. Meanwhile, the market capacity for new energy vehicles is limited, and competition with M2 forces the price of new energy vehicles to decrease, further compressing the profit margin of M1.
In contrast, the increase in is beneficial to M2: the rise in trading prices enables M2 to obtain additional income by selling excess credits. To maintain competitiveness in the credit market, it tends to reduce the price of new energy vehicles to attract consumers, increase sales and market share, and simultaneously produce more to obtain more credits, further enhancing profits. In summary, changes in and have different impacts on the profits of M1 and M2, and manufacturers need to flexibly adjust their strategies according to policy changes.
(3)
Impact of dual-credit policy factors on emission reduction investment strategies:
Proposition 9. 
(1)  As the NEV credit ratio requirement increases, the following is true: θ S * η < 0 , θ C * η < 0 ; (2)  as the NEV credit trading price increases, the following is true:
(a)
When   η < η 1 , θ S 1 * p N > 0 ; When   η > η 1 , θ S 1 * p N < 0 ;
(b)
When   η < η 2 , θ C 1 * p N > 0 ; When   η > η 2 , θ C 1 * p N < 0 ;
(c)
θ S 2 * p N < 0 ; θ C 2 * p N < 0 .
Proof. 
See Appendix H. □
Proposition 9 illustrates the impact of the NEV credit ratio requirement on the emission reduction effort level under two policies. The results show that as increases, the emission reduction effort level under both policies exhibits a downward trend. This is because the increase in the requirement raises the production cost of fuel vehicles for M1, prompting it to expand the market share of new energy vehicles and thereby reduce investment in fuel vehicle fuel consumption and carbon emission reduction.
In Scenario 1, the NEV credit ratio requirement has a moderating effect on the relationship between the emission reduction effort level and the credit trading price: When, M1 can moderately increase emission reduction efforts to reduce the actual fuel consumption of fuel vehicles ( η 1 < η ), thereby narrowing the CAFC credit gap. Meanwhile, although the rise in NEV credit trading prices enhances its motivation to produce new energy vehicles for credits, it still needs to balance investment in fuel vehicle emission reduction to optimize profits. Therefore, under the single dual-credit policy, the emission reduction effort level of M1 increases with the rise in credit trading prices. When, M1 needs to increase the production of new energy vehicles to meet policy requirements ( η 1 > η ), leading to a significant increase in production and operation costs. At this time, it prefers to concentrate resources on new energy vehicle production and reduce investment in fuel vehicle emission reduction technologies. Therefore, even if the credit trading price rises, the emission reduction effort level still declines. In addition, under the carbon cap-and-trade policy, M1 is constrained by carbon cap-and-trade, and the situation is similar to that under the single dual-credit policy.
In Scenario 2, the rise in NEV credit trading prices causes M1 to reduce investment in fuel vehicle emission reduction. This is because the increase in credit trading prices significantly enhances the revenue from new energy vehicle credits, while the cost of fuel vehicle emission reduction is high and the revenue cannot match the revenue from new energy vehicle credits. Therefore, M1 is more inclined to increase investment in new energy vehicle production rather than continue to invest resources in fuel vehicle emission reduction.

5.2. Impact Analysis of Carbon Trading Policy Factors

This section mainly examines the impact of key policy factors under the carbon trading policy constraints on equilibrium solutions. The selected key policy factor is the carbon trading price p c .
(1)
Impact of an increase in the unit carbon trading price on optimal pricing:
Proposition 10. 
(1) As the unit carbon trading price increases, and τ < τ 4 , there is p 1 F C 1 * p e < 0 ; when τ > τ 4 , p 1 F C 1 * p c < 0 ; when τ < β 2 , p 1 F C 2 * p c < 0 or τ > β 2 , p 1 F C 2 * p c > 0 ; (2) as the unit carbon trading price increases, the following is true: p 1 N C * p c > 0 , p 2 N C * p e > 0 .
Proof. 
See Appendix I. □
Proposition 10 (1) shows that under dual policy constraints, the change direction of fuel vehicle pricing with the unit carbon trading price is moderated by the emission reduction effort cost coefficient: When the emission reduction effort cost coefficient is small ( τ < τ 4 / τ < β 2 ), manufacturers can control costs through improving production efficiency and emission reduction, and tend to reduce fuel vehicle prices to maintain market competitiveness. When the emission reduction effort cost coefficient is large ( τ > τ 4 / τ > β 2 ), manufacturers’ emission reduction investment and carbon emission costs increase significantly. To make up for the costs, they will increase fuel vehicle prices. Meanwhile, the rise in carbon trading prices drives up NEV demand, further prompting fuel vehicles to maintain profits by raising prices.
Proposition 10 (2) points out that due to the high carbon emissions in the production process of NEVs, the increase in the unit carbon trading price directly pushes up their production costs. Manufacturers transfer the costs to consumers to maintain profits, leading to an increase in NEV pricing.
Proposition 11. 
As the unit carbon trading price p c increases, the following is true: q 1 F C 1 * p c < 0 , p 1 F C 2 * p e < 0 , p 1 N C * p e < 0 , p 2 N C 1 * p e < 0 .
Proof. 
See Appendix J. □
Proposition 11 demonstrates the impact of the unit carbon trading price p c on the demand for fuel vehicles and NEVs under dual policy constraints. The results show that with the increase in the unit carbon trading price, the demand for fuel vehicles and NEVs of M1, as well as the demand for NEVs of M2, all decline. This is because the rise in carbon trading prices increases the carbon emission costs in the production processes of both fuel vehicles and NEVs. Manufacturers transfer these costs to consumers, leading to price increases, which in turn weaken consumers’ purchasing power and suppress market demand. This conclusion indicates that an increase in the unit carbon trading price will have a chain effect on manufacturers’ production costs, pricing, and demand. Therefore, manufacturers need to optimize production processes, enhance the low-carbon attributes of products, and strengthen marketing to maintain market share. The government should also improve carbon market policies and strengthen supervision to guide low-carbon consumption and promote the development of a low-carbon economy.
(2)
Impact of carbon trading policy factors on profits:
Proposition 12. 
As the unit carbon trading price increases, the following is true: π 2 C 1 * p c > 0 , π 2 C 2 * p c > 0 .
Proof. 
See Appendix K. □
Proposition 12 shows that the increase in the unit carbon trading price will lead to the profit growth of M2 under dual policies. This is because when the carbon trading price rises, M2 can obtain additional income by selling excess carbon emission credits. Meanwhile, it will be prompted to increase the production of new energy vehicles to meet policy requirements and expand market share, which can not only increase credit revenue but also enable M2 to maintain competitiveness in the market, thereby enhancing overall profits. This indicates that the carbon trading provides an additional profit source for M2, which may become a key factor for it to gain advantages in market competition. Therefore, M2 should make full use of this policy environment to optimize production and sales strategies so as to maintain market competitiveness.
(3)
Impact of carbon trading policy factors on emission reduction investment strategies
Proposition 13. 
As the unit carbon trading price p c increases, the following is true: θ C 1 * p c < 0 , θ C 2 * p c < 0 .
Proof. 
See Appendix L. □
Proposition 13 explores the impact of the unit carbon trading price p c on the emission reduction effort level of M1 under the “cap-and-trade + dual-credit” policy. The results show that as the unit carbon trading price rises, the emission reduction effort level of M1 decreases. This is because after the carbon trading price increases, if M1 continues to produce a large number of fuel vehicles, it needs to bear both high carbon trading costs and carbon emission reduction investments. Therefore, it tends to reduce fuel vehicle production and expand the production scale of new energy vehicles, thereby leading to a decrease in the emission reduction effort level.

5.3. Comparative Analysis of Two Carbon Policy Combinations

Proposition 14. 
(1) Compare the equilibrium emission reduction effort levels under the single dual-credit policy and the “carbon cap-and-trade + dual-credit” policy: θ C 1 * < θ S 1 * , θ C 2 * < θ S 2 * . (2) Comparative analysis of equilibrium emission reduction effort levels under different carbon emission reduction scenarios:  π 1 C 2 * > π 1 C 1 * , θ C 1 * > θ C 2 * .
Proof. 
See Appendix M. □
Proposition 14 (1) shows that the emission reduction effort level of M1 under the “carbon cap-and-trade + dual-credit” policy is lower than that under the “single dual-credit policy”. This is because the introduction of carbon regulation policies weakens enterprises’ motivation to invest in fuel vehicle emission reduction technologies, and instead incentivizes them to increase investments in new energy vehicles.
Proposition 14 (2) indicates that when the average fuel consumption of M1’s fuel vehicles meets the national specified standards, it will reduce low-carbon emission reduction investments and shift to other market strategies. Especially against the backdrop of growing market demand for new energy vehicles, consumers’ attention to fuel economy declines, prompting manufacturers to focus more on meeting the market demand for new energy vehicles.
This conclusion shows that the single dual-credit policy can more effectively incentivize enterprises to improve emission reduction technologies and reduce fuel consumption, helping to achieve environmental protection goals. The introduction of the carbon cap-and-trade mechanism, while promoting the production of new energy vehicles, increases the cost pressure on fuel vehicle manufacturers, making them increase investments in new energy vehicles to expand profit margins in order to avoid emission reduction costs and NEV ratio requirements. Although the market share of new energy vehicles continues to increase, the demand for fuel vehicles still exists. If fuel vehicle emission reduction technologies are not improved, environmental goals will be difficult to achieve. Therefore, the government needs to regularly improve fuel efficiency and emission standards and encourage manufacturers to continuously maintain emission reduction efforts to address stricter environmental protection requirements.
Proposition 15. 
Compare manufacturers’ pricing under the single dual-credit policy versus the “carbon cap-and-trade + dual-credit” policy, as well as pricing comparisons between manufacturers under these policies: (1) p 1 F S * < p 1 F C * ; (2) p 1 N S * < p 1 N C * ; (3) p 2 N S * < p 2 N C * .
Proof. 
See Appendix N. □
Proposition 15 (1) shows that the price of fuel vehicles under the single dual-credit policy is lower than that under the “carbon cap-and-trade + dual-credit” policy. This is because fuel vehicle manufacturers under the single policy do not need to bear the additional costs of carbon caps, resulting in lower production costs and the ability to maintain competitiveness through pricing strategies. In contrast, the dual policy requires meeting both carbon emission limits and NEV credit requirements, which pushes up overall costs, prompting manufacturers to increase fuel vehicle prices to cover costs.
Propositions 15 (2)–(3) indicate that NEV prices are also lower under the single dual-credit policy. Manufacturers only need to meet NEV credit requirements without facing carbon emission limits and carbon trading fees, resulting in lower cost pressure and more flexible pricing. The dual policy increases manufacturers’ costs, leading to rising NEV prices.
This conclusion demonstrates that the strictness of policies affects manufacturers’ pricing strategies and market price levels, suggesting that policy makers need to balance environmental goals and market burdens to avoid excessive cost transfer to consumers and maintain market stability.
Proposition 16. 
Comparison of market demand among manufacturers under the single dual-credit policy and the ‘”carbon cap-and-trade + dual-credit” policy: q 1 F S 1 * < q 1 F C 1 * ; q 1 F S 2 * > q 1 F C 2 * ; q 1 N S * > q 1 N C * ; q 2 N S * > q 2 N C * .
Proof. 
See Appendix O. □
Proposition 16 compares the demand for NEVs and fuel vehicles under two policies. The results show that the demand for both NEVs and fuel vehicles from M1 and M2 is higher under the single dual-credit policy. This is because under the single policy, manufacturers only need to meet the NEV credit requirements without bearing the costs of carbon emission caps and carbon trading, allowing them to invest more resources in production and sales, reduce costs, and stimulate consumer demand with more competitive prices. In contrast, under the “carbon cap-and-trade + dual-credit” policy, manufacturers need to meet both the dual-credit requirements and bear additional carbon emission costs, which pushes up overall production costs and is passed on to consumers, leading to rising vehicle prices and suppressing market demand. In particular, the increase in NEV prices may cause some consumers to switch to low-price fuel vehicles, resulting in a decline in NEV demand. The result is mainly attributed to price and carbon emission reduction levels, indicating that the single dual-credit policy can more effectively increase the market demand for NEVs and fuel vehicles through price advantages and higher emission reduction effort levels.
Proposition 17. 
Comparison of manufacturers’ profits under the single dual-credit policy and the “carbon cap-and-trade + dual-credit” policy: (1) π 1 S < π 1 C ; (2) When 0 < T 2 < 1 4 ( 2 α c N + 2 p N δ c 2 p c c N ) , π 2 S > π 2 C ; When T 2 > 1 4 ( 2 α c N + 2 p N δ c 2 p c c N ) , π 2 S < π 2 C .
π 2 S * π 2 C * = p c T 2 + 1 2 c N ( α + δ p N ) 1 4 c N 2 p c 2 < 0
Proposition 17 compares the profit levels of the two manufacturers under the two policies. The profit of M1 under the single dual-credit policy is lower than that under the “carbon cap-and-trade + dual-credit” policy. This is because under the single policy, M1 only needs to meet the NEV credit requirements, lacks the flexibility of the carbon trading mechanism, and cannot obtain additional income through carbon emission trading. Moreover, the high production cost of NEVs compresses the profit margin. In contrast, the dual policy provides more profit channels through the carbon trading mechanism, enabling M1 to obtain additional benefits while reducing emissions, resulting in higher overall profits.
Proposition 17 (2) shows that when the total carbon allowance of the manufacturer is small T 2 < 1 4 ( 2 α c N + 2 p N δ c 2 p c c N ) , the profit of M2 under the single dual-credit policy is higher. Under small carbon allowances, it faces fewer carbon emission constraints and can flexibly allocate resources to focus on NEV production, save carbon emission costs, and avoid paying substantial carbon trading fees. When the total carbon allowance of the manufacturer is large T 2 > 1 4 ( 2 α c N + 2 p N δ c 2 p c c N ) , under the “carbon cap-and-trade + dual-credit” policy, M2 can obtain additional income by selling unused carbon allowances to offset the increase in production costs. The single policy lacks this income channel, and the profit of M2 is constrained by the rising production costs of NEVs, so the profit under the dual policy is higher.
In summary, the additional income provided by the carbon cap-and-trade mechanism is crucial to manufacturers’ profitability. Especially when carbon allowances are large, the flexibility and additional income of carbon trading significantly improve profits. Meanwhile, the production cost pressure and market strategy adjustments under different policies will also affect manufacturers’ decisions and profit levels.

6. Numerical Simulations

To better illustrate the impact of different policies on automakers’ decisions, this section uses a numerical analysis method to elaborate on the effects of the NEV credit trading price p N , NEV credit ratio requirement η , and unit carbon trading price p c on equilibrium solutions. Parameter values in the analysis process all comply with the relevant constraints of the theoretical analysis. To better calibrate the model, the values of policy factors related to the dual-credit policy refer to the empirical calibration model of Lu et al. [43,44], and the parameters of the carbon cap-and-trade policy are set according to the research of Narang et al. [45,46,47], while combining the relevant industry data in the fields of fuel vehicles and new energy vehicles. Fixed parameters are as follows: α = 0.4 , δ = 1 , τ = 4 , β = 0.4 , p N = 0.2 , η = 0.2 , e s = 6 , e R = 6.5 , c F = 0.5 , c F = 0.6 and p c = 0.1 , and set p n [ 0 , 0.3 ] , η [ 0 , 1 ] , p c [ 0 , 0.3 ] .

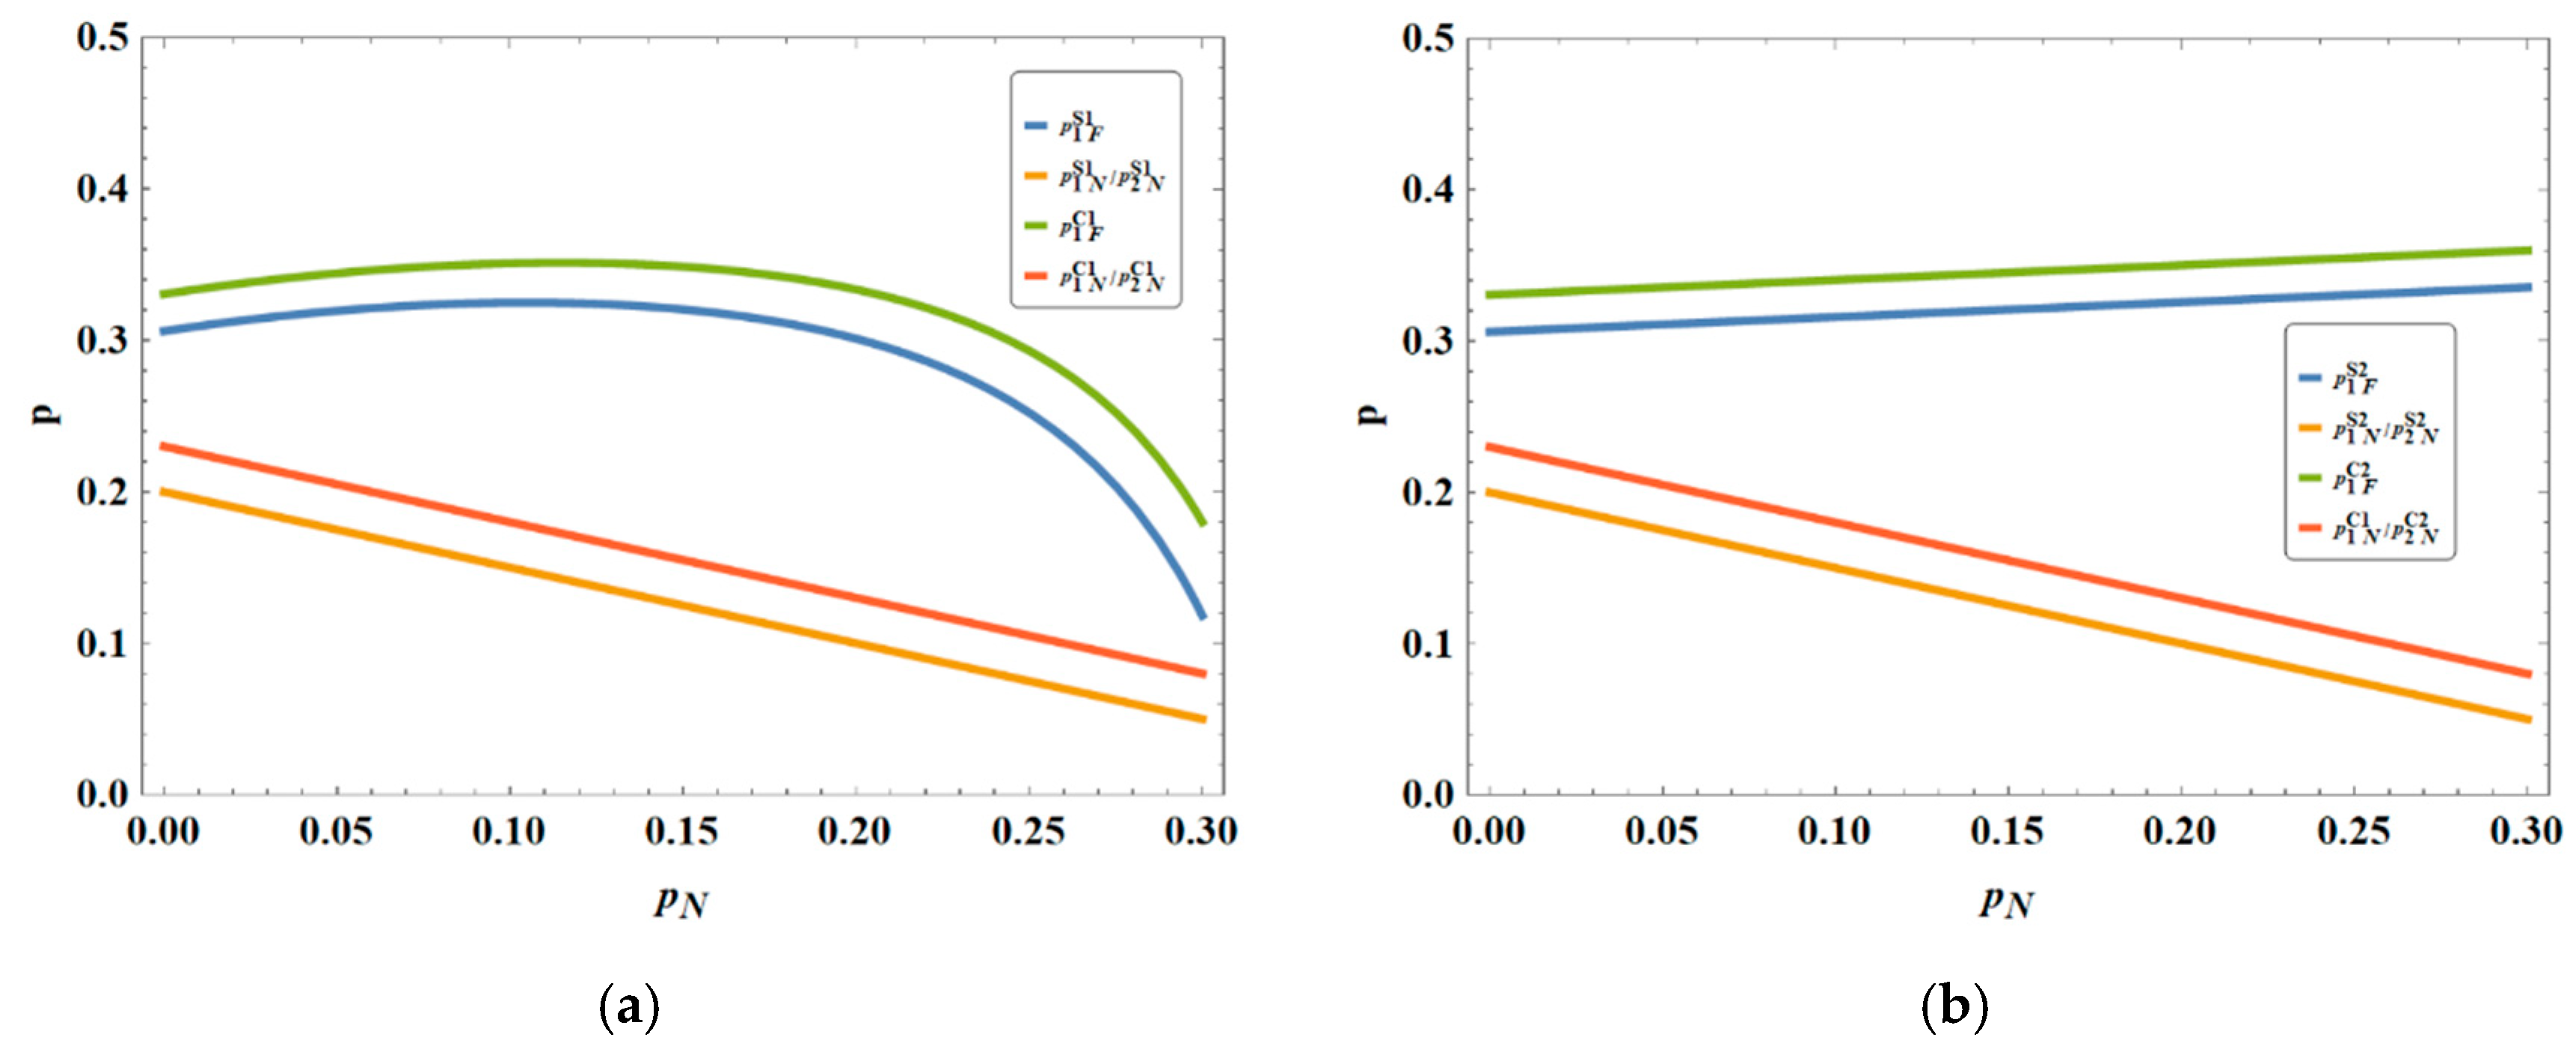
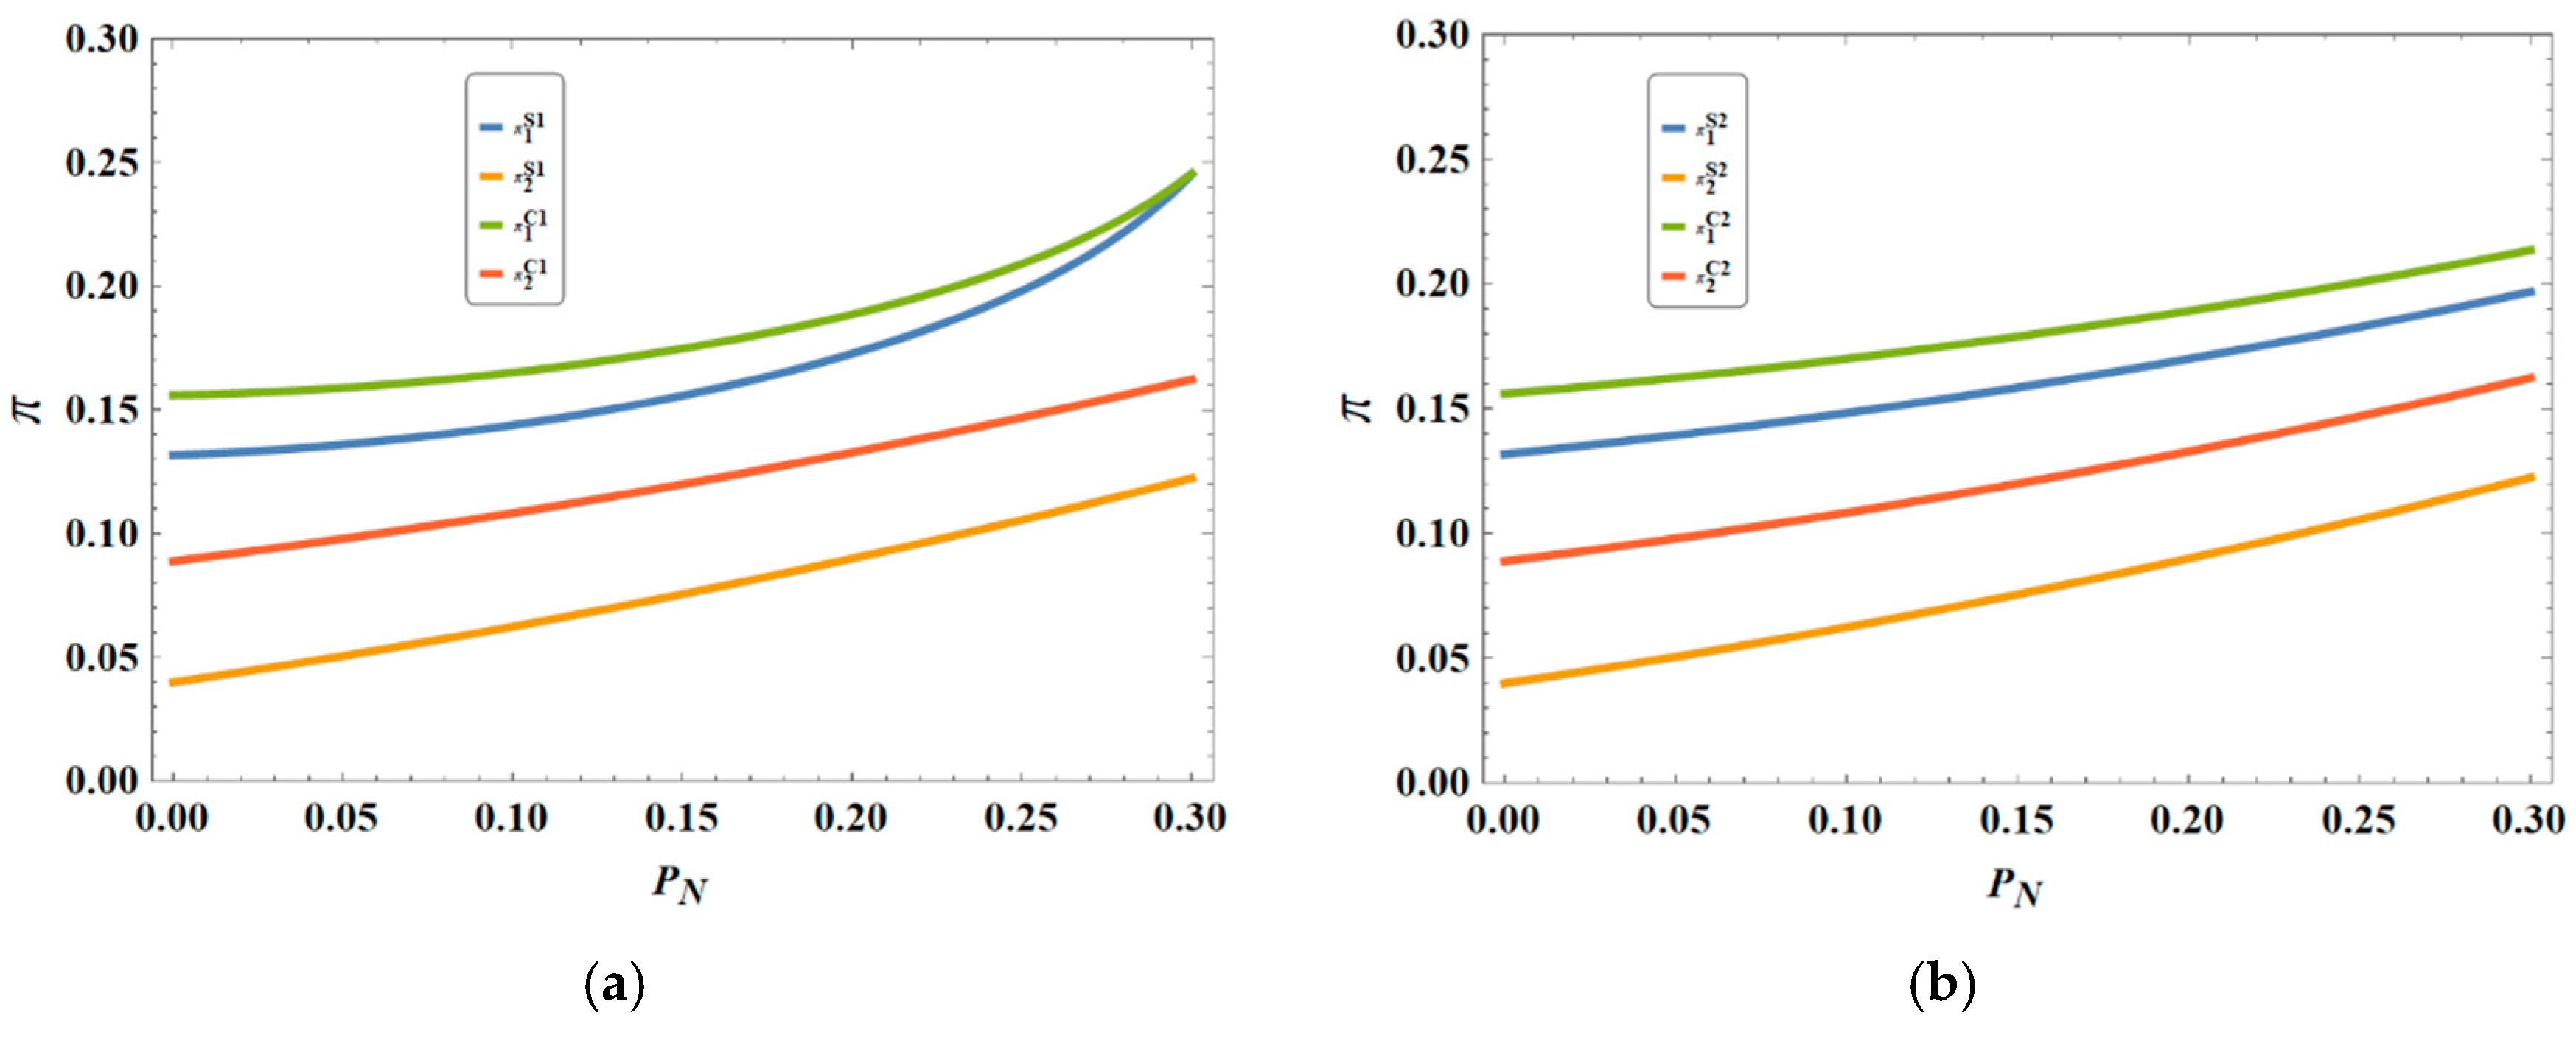
6.1. Impact of NEV Credit Trading Price

Figure 1 shows that as the NEV credit trading price increases, under Scenario 1, the pricing of fuel vehicles under both policies tends to decline. In Scenario 2, however, the pricing of fuel vehicles under both policies rises. The reason is as follows: In Scenario 1, M1 fails to meet the fuel consumption standard, resulting in higher carbon emission costs. To alleviate cost pressures, the manufacturer may choose to lower fuel vehicle prices to stimulate sales and reduce the burden of carbon emission costs. In Scenario 2, M1 has already reduced fuel consumption below the standard through emission reduction, avoiding additional carbon emission costs. With the rise in NEV credit trading prices, the manufacturer gains extra income by selling surplus NEV credits, which incentivizes them to increase fuel vehicle pricing to capture more profits. The core difference between Scenario 1 and Scenario 2 lies in whether additional costs for carbon emissions are required and whether benefits from credit trading can be obtained.
Additionally, in both scenarios, as the NEV credit trading price increases, the equilibrium NEV pricing under both policies decreases. This is because higher NEV credit trading prices provide manufacturers with more credit revenue, alleviating cost pressures to some extent. To further enhance market competitiveness, manufacturers are motivated to attract more consumers by lowering NEV prices, thereby increasing sales and market share.
Figure 2 shows that when the NEV credit trading price increases, the pricing of fuel vehicles under both policies in Scenario 1 decreases, while it increases in Scenario 2. This is because in Scenario 1, M1 fails to meet the fuel consumption standard and needs to pay higher carbon emission fees, so it reduces the price of fuel vehicles to stimulate sales and alleviate cost pressure. In Scenario 2, M1 has reduced fuel consumption below the standard through emission reduction, avoiding additional carbon emission fees. With the rise in NEV credit trading prices, it can obtain additional income by selling excess NEV credits, thereby increasing fuel vehicle pricing to boost profits. The core difference between the two scenarios lies in whether additional carbon emission costs need to be paid and whether profits can be obtained from credit trading. In addition, regardless of the scenario, an increase in the NEV credit trading price will lead to a decline in the equilibrium NEV pricing under both policies, as manufacturers, after gaining more credit revenue, will reduce NEV pricing to attract consumers, increase sales, and expand market share for enhanced competitiveness.
Figure 3 shows that as the NEV credit trading price increases, the profits of both manufacturers under both policies exhibit an upward trend. This is because manufacturers gain more revenue by selling excess NEV credits, which helps offset the increase in NEV production costs and thus improves overall profits. Under the single dual-credit policy, production costs are more controllable, while under the “carbon cap-and-trade + dual-credit” policy, manufacturers can also obtain additional income through carbon allowance trading, further increasing profits. With the growth of NEV sales and the relief of cost pressure, manufacturers not only gain direct credit trading income but also enhance profitability by expanding market share. In short, the increase in NEV credit trading prices brings more profit opportunities to manufacturers, especially in NEV production and sales.

6.2. Impact of NEV Credit Ratio Requirement

Figure 4 shows that with the increase in the NEV credit ratio requirement, the pricing of fuel vehicles under both policies shows an upward trend, while NEV pricing remains unaffected. This is because after the NEV credit ratio requirement increases, manufacturers need to increase NEV production and sales to meet the policy, leading to an increase in fuel vehicle production costs. To offset the additional cost pressure, manufacturers have to raise fuel vehicle prices. Overall, the increase in the NEV credit ratio prompts manufacturers to transform to NEVs, and the cost pressure of fuel vehicles drives their price increase.
Figure 5 shows that as the NEV credit ratio requirement increases, the emission reduction effort levels under both policies show a downward trend. This is because when manufacturers face higher NEV credit ratio requirements, they invest more resources and production capacity in NEV production to meet policy requirements, thereby reducing investment in emission reduction for fuel vehicles. In addition, the increase in the NEV credit ratio requirement prompts manufacturers to adjust their production structure to achieve credit targets, which may lead to a reduction in investment in fuel vehicle emission reduction technologies in the short term. Therefore, the overall emission reduction effort level declines, indicating that manufacturers prefer to rely on NEV production rather than directly reduce fuel vehicle emissions in the process of pursuing policy compliance.
Figure 6 shows that as the NEV credit ratio requirement increases, the profit of Manufacturer 1 under both policies shows a downward trend, while the profit of Manufacturer 2 remains unaffected. This is because after the NEV credit ratio increases, Manufacturer 1 needs to increase NEV production to meet policy requirements, leading to rising production costs. Moreover, NEV production has low profits and requires substantial resource investment, thereby dragging down overall profits. The profit of Manufacturer 2 is not affected by changes in the NEV credit ratio and remains stable throughout, reflecting that Manufacturer 1 faces greater cost pressure, while Manufacturer 2 has stronger profit stability.

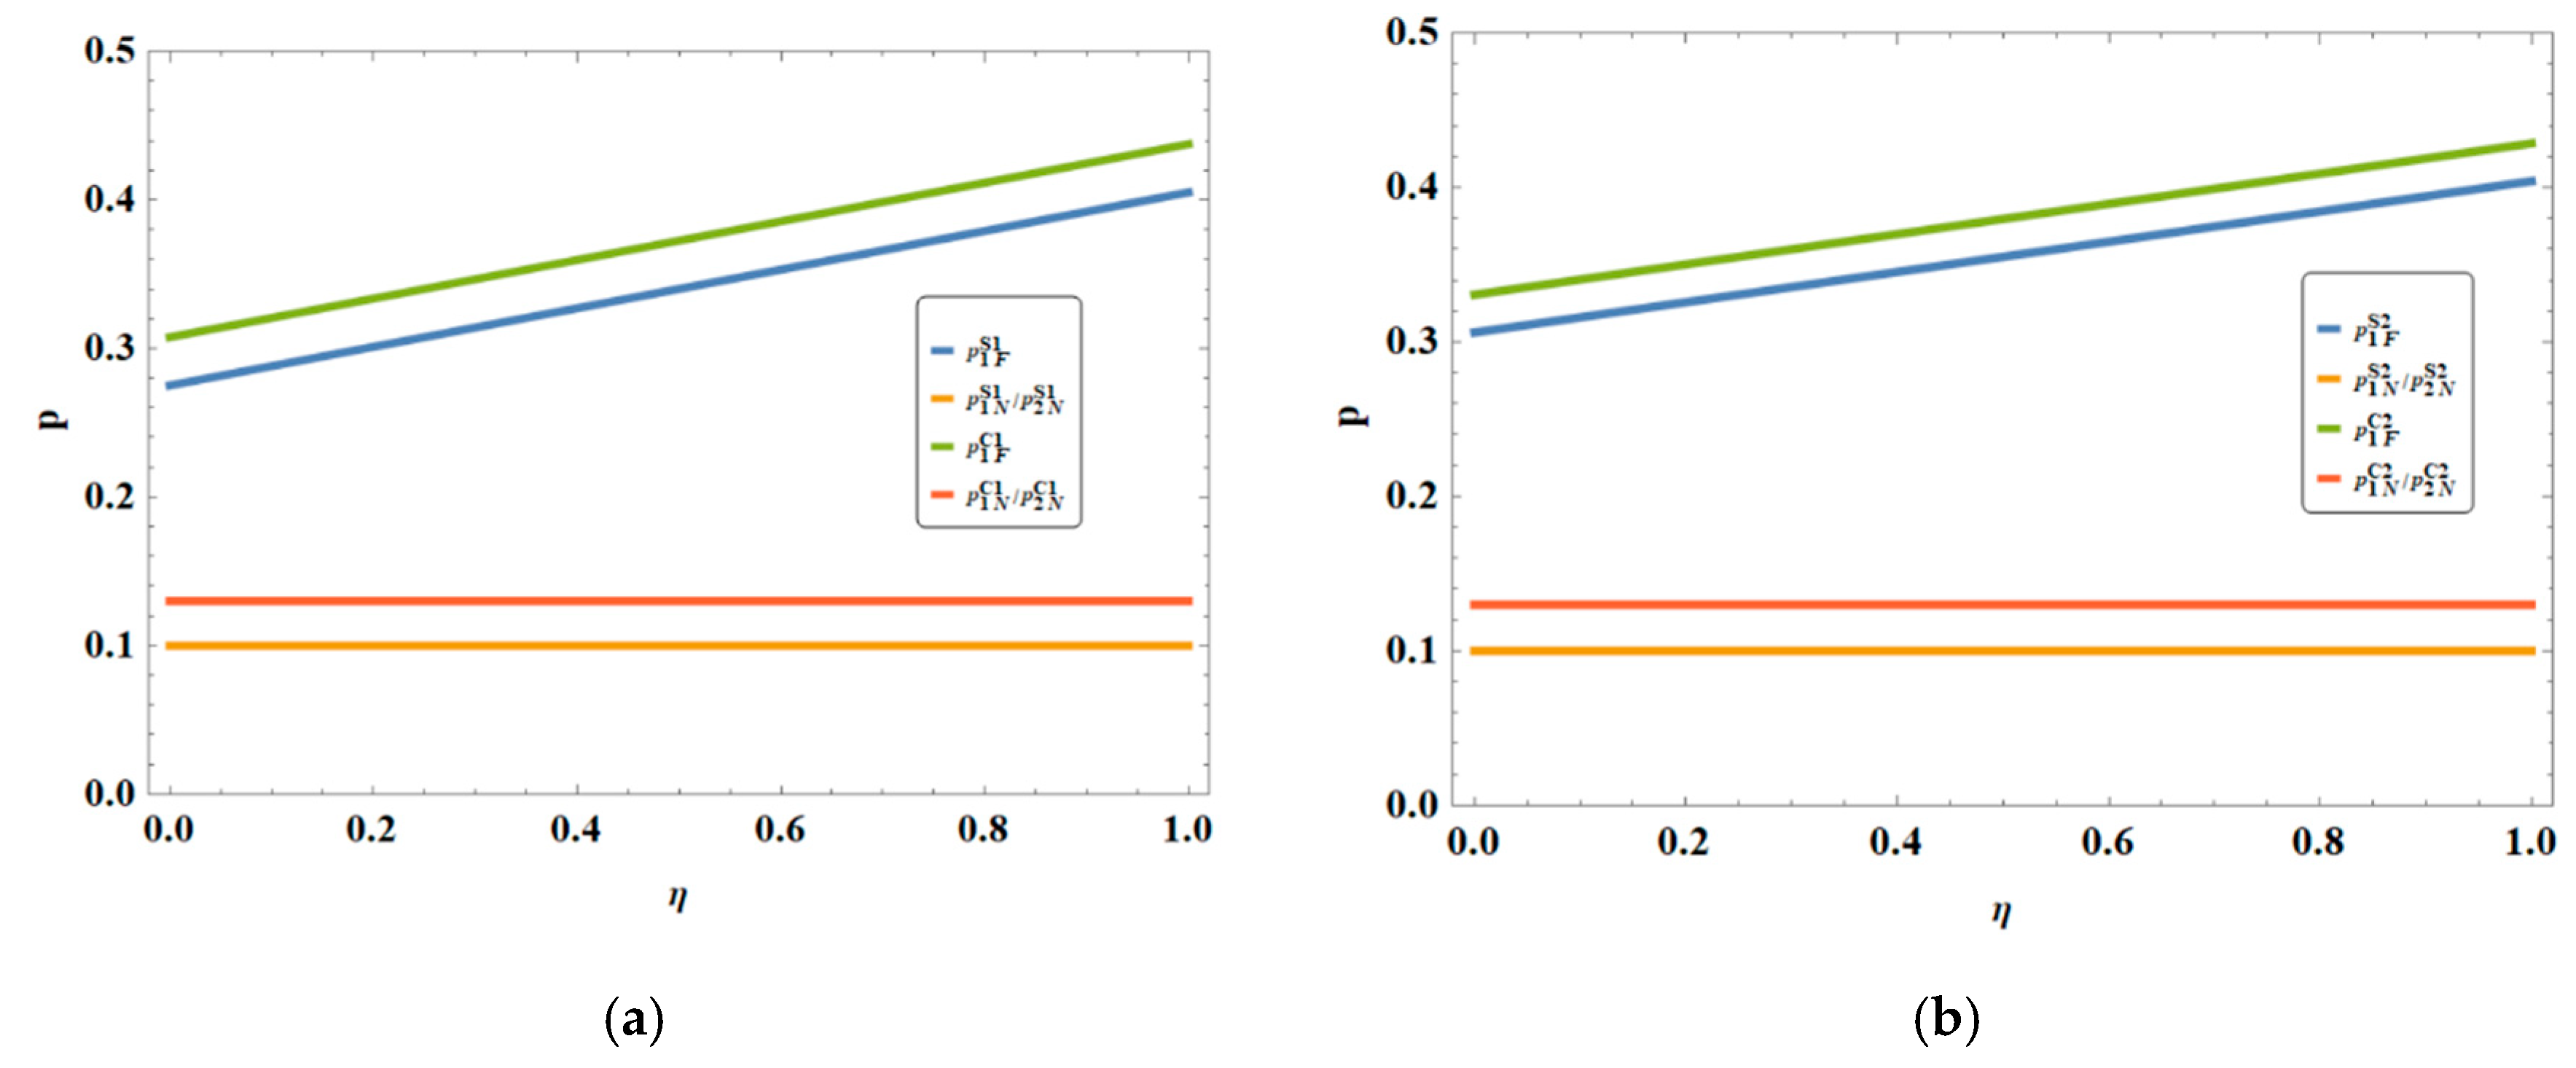
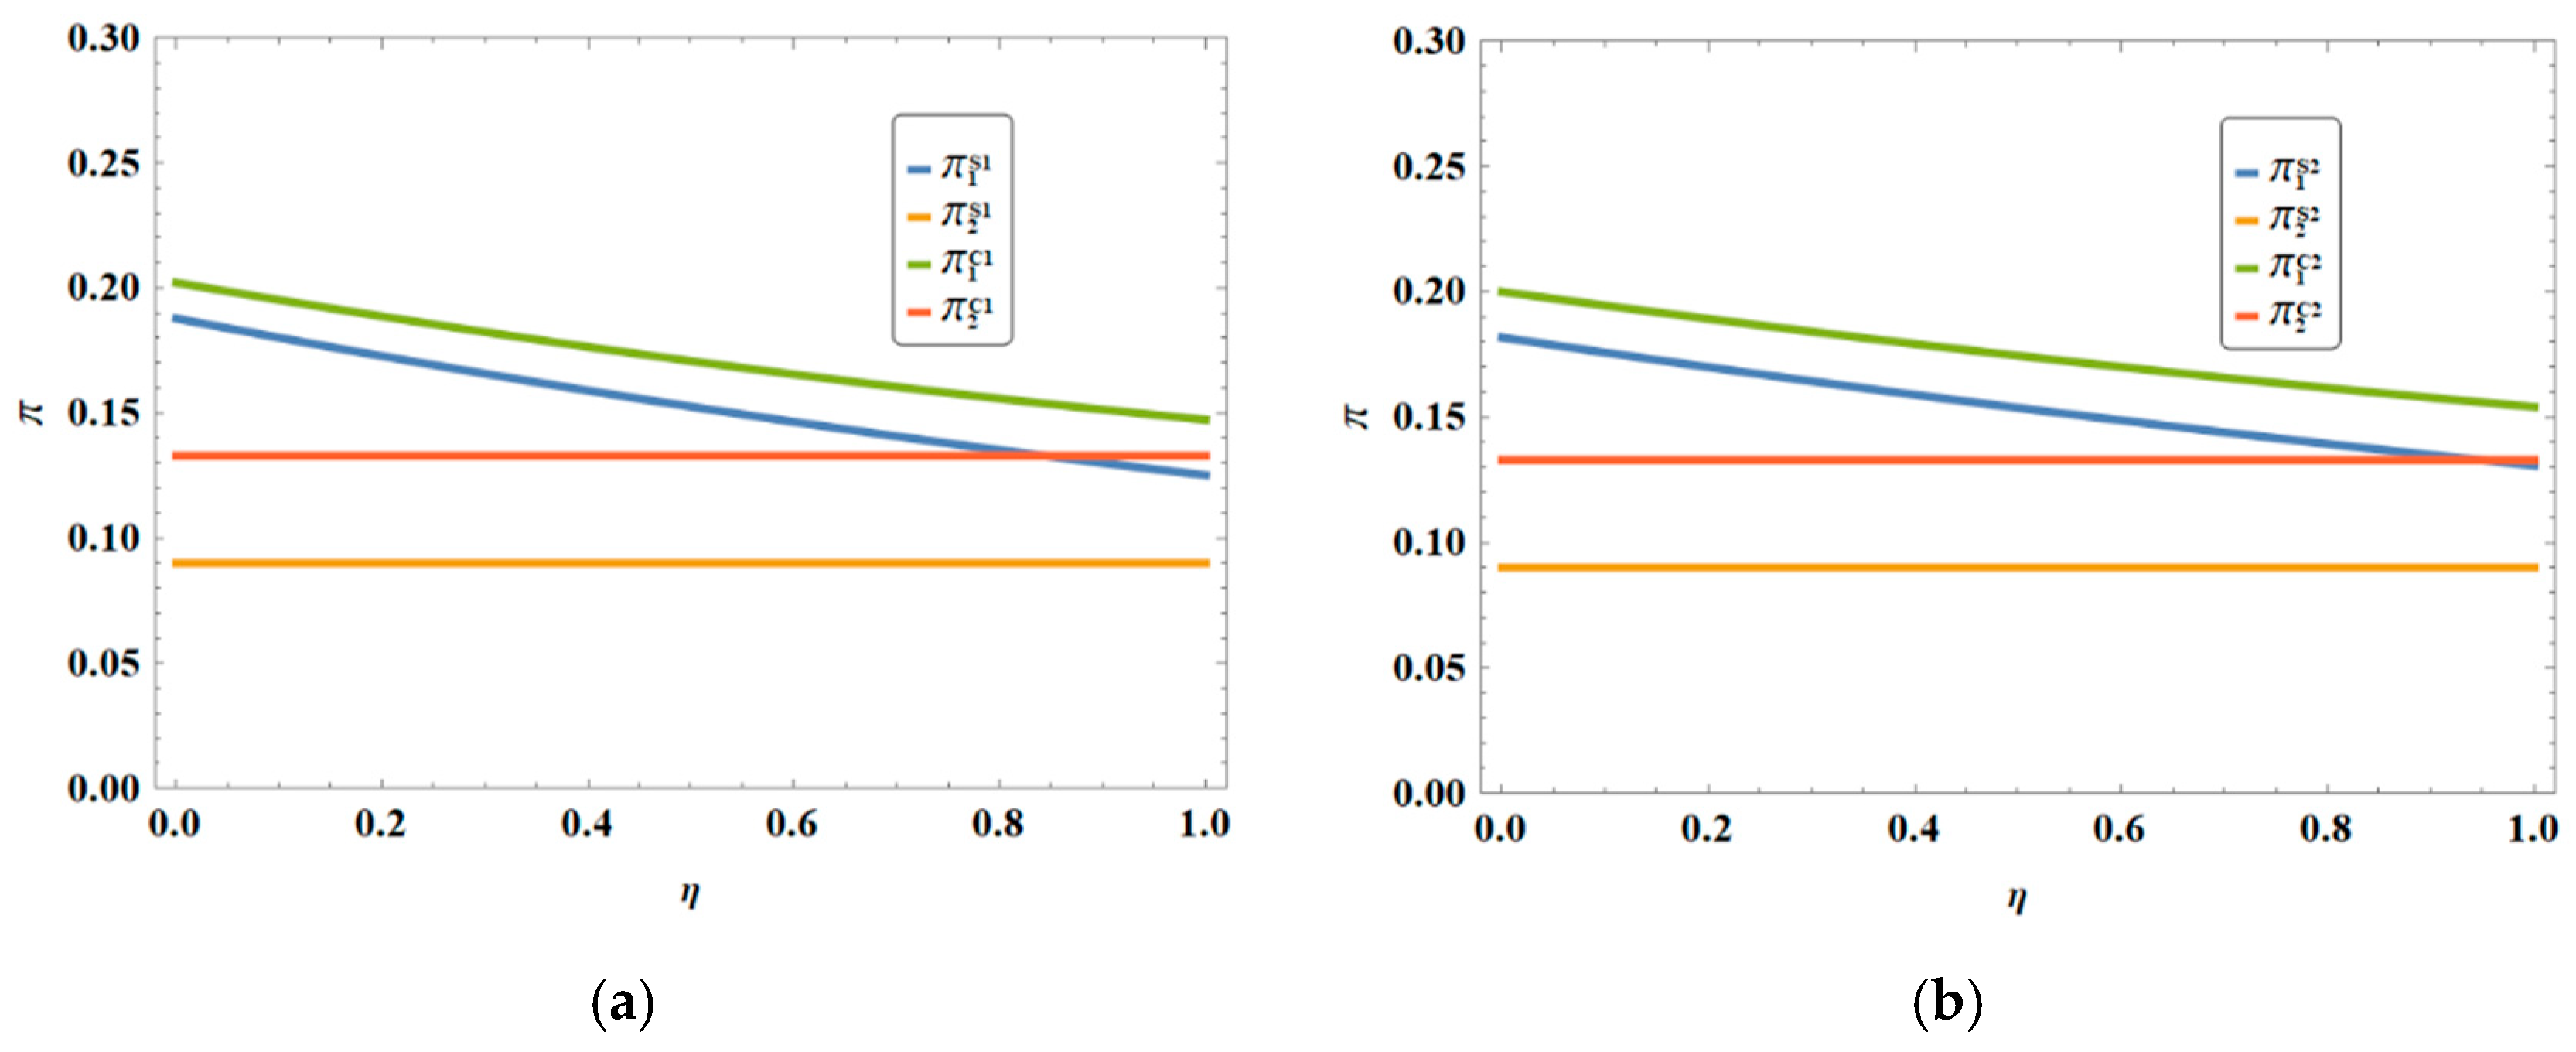
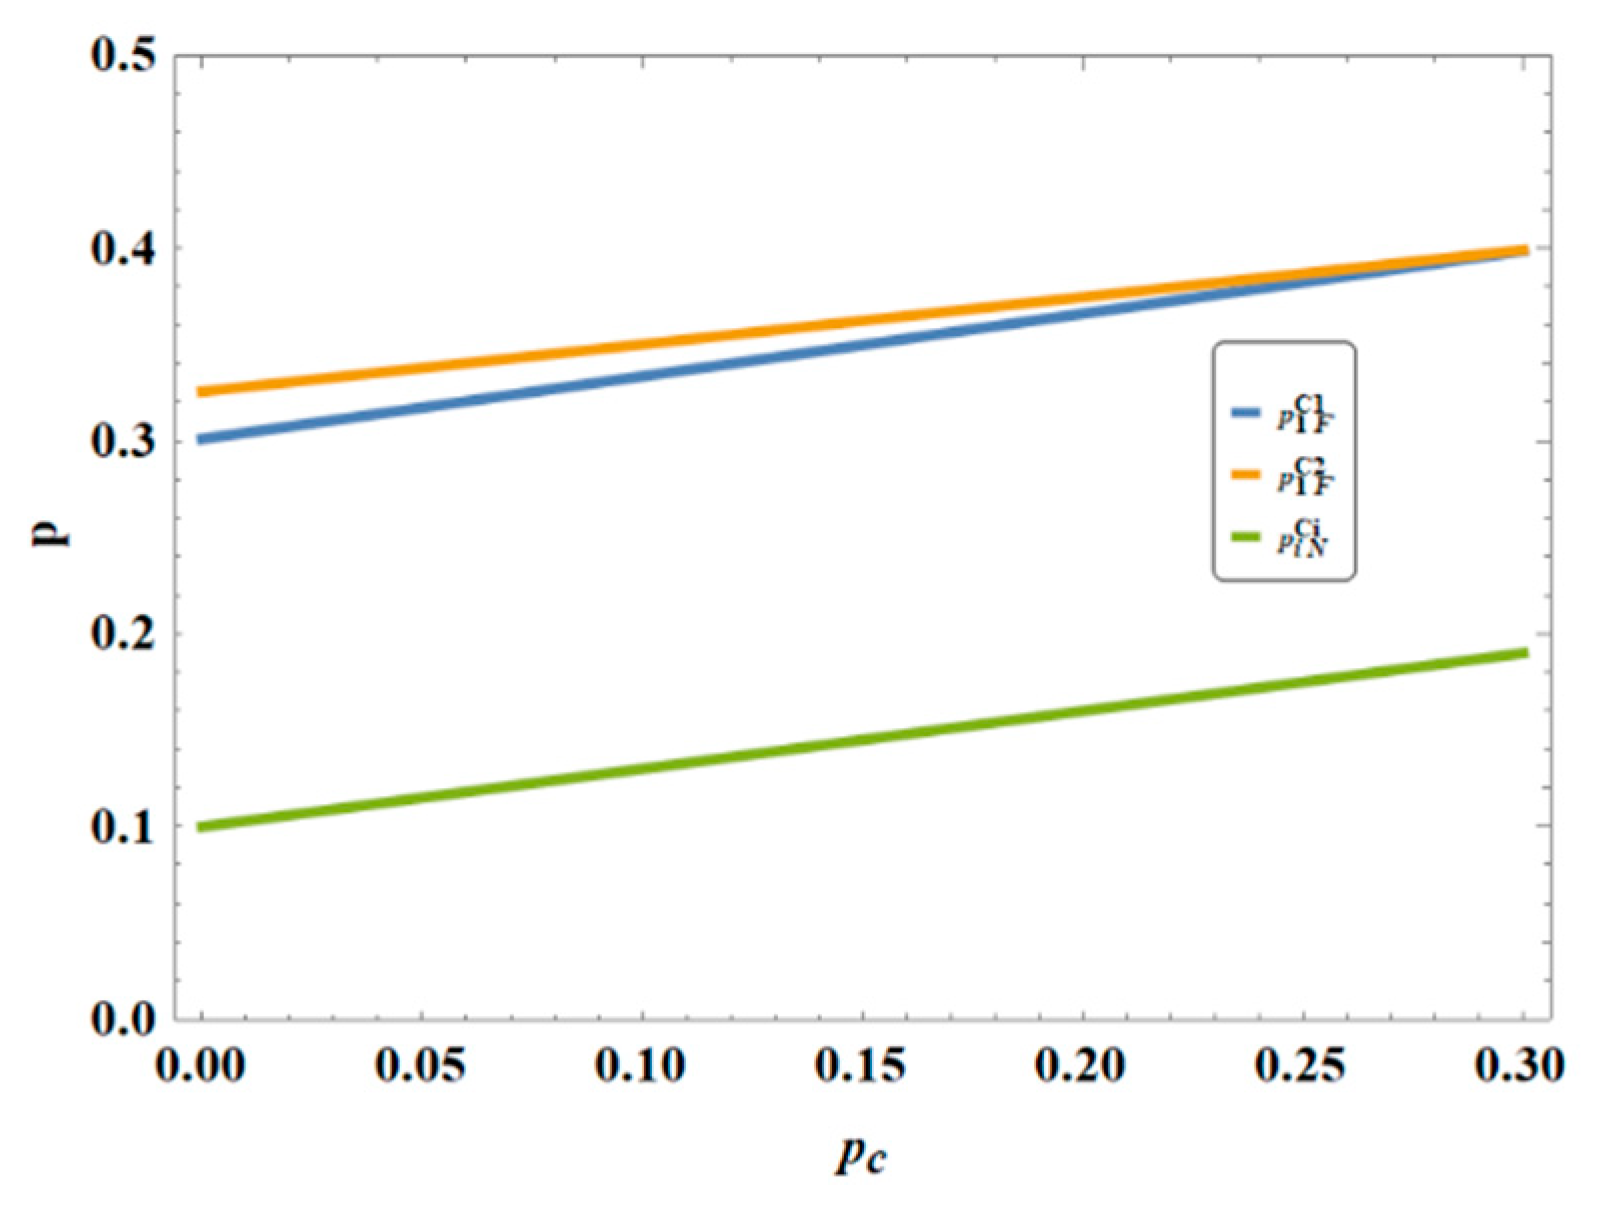
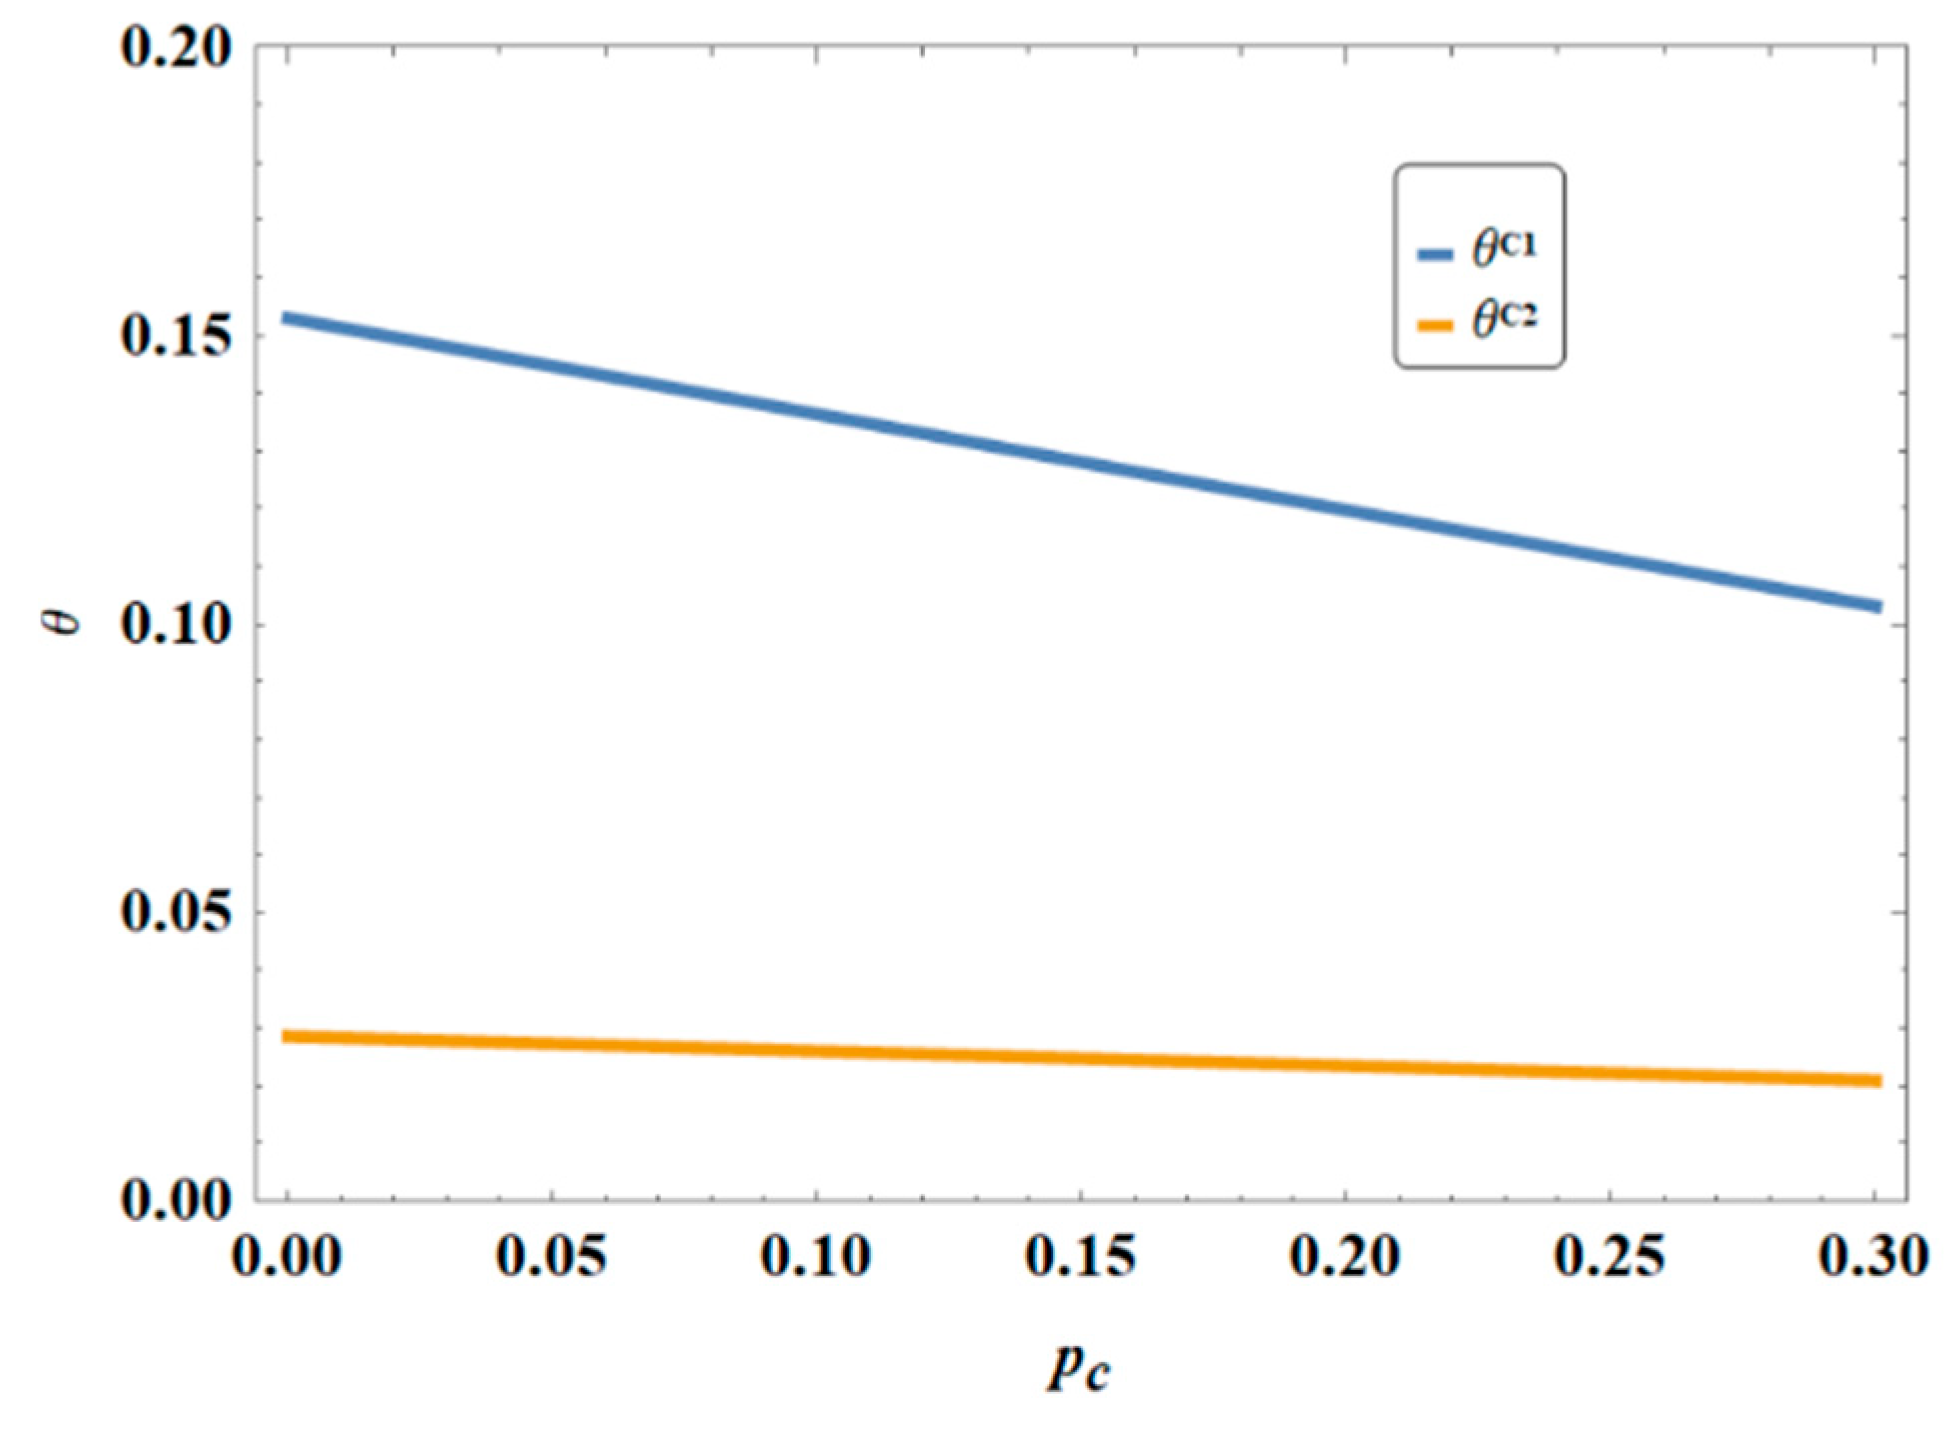
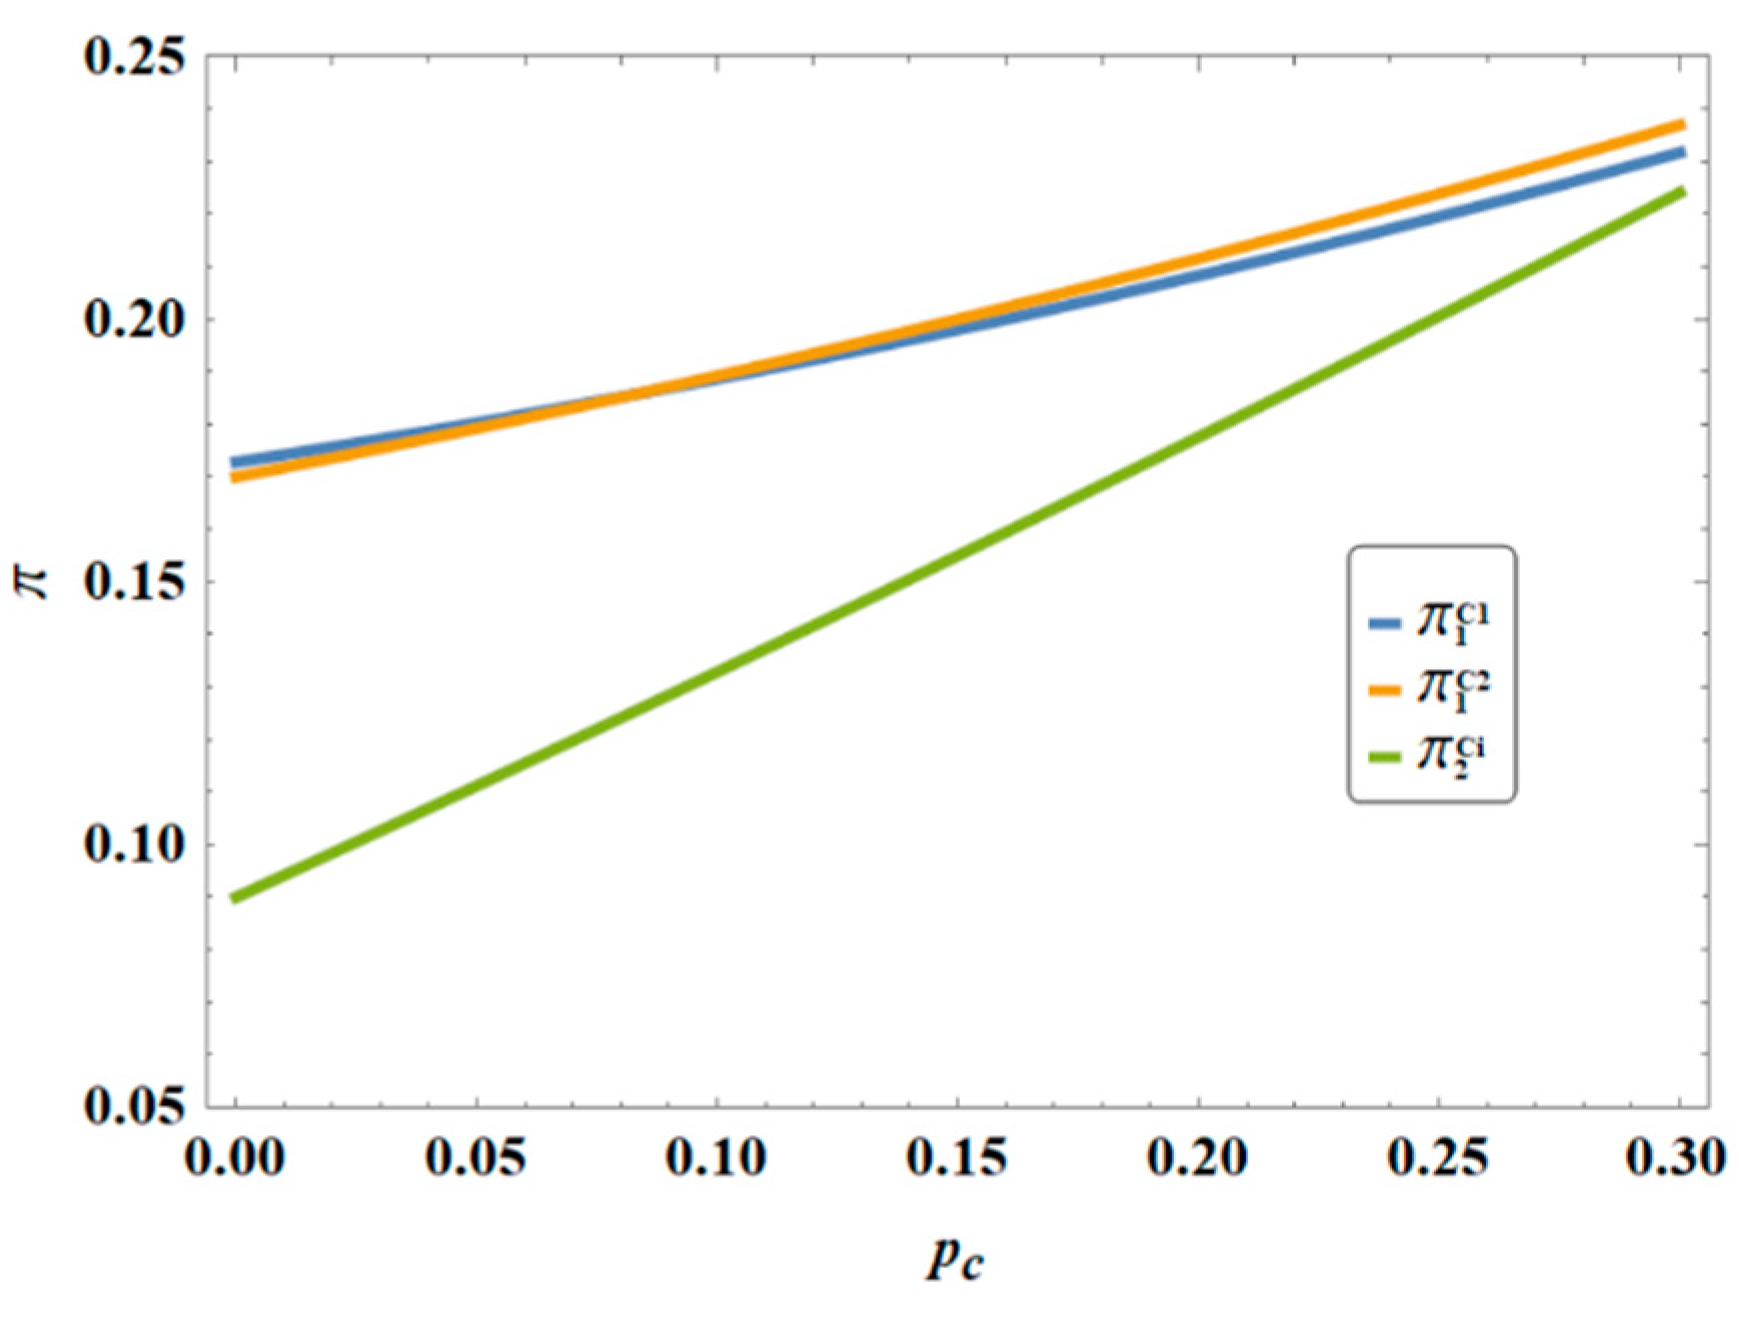
6.3. Impact of Carbon Trading Price

Figure 7 shows that as the carbon trading price increases, the pricing of both fuel vehicles and NEVs under the “carbon cap-and-trade + dual-credit” policy shows an upward trend. This is because the rise in carbon trading prices directly pushes up manufacturers’ carbon emission costs, especially significantly affecting fuel vehicle production. To make up for the increased costs, manufacturers not only raise the prices of both types of vehicles but also may transfer additional costs to consumers to ensure profit levels. It can be seen that the increase in carbon trading prices prompts manufacturers to raise prices to maintain profitability by increasing production costs.
Figure 8 shows that as the carbon trading price increases, the emission reduction effort level under the “carbon cap-and-trade + dual-credit” policy shows a downward trend. This is because after the carbon trading price increases, manufacturers can meet emission limits by purchasing carbon allowances without continuing to invest heavily in emission reduction technologies or production process improvements. The carbon trading market provides a flexible compliance method, allowing enterprises to achieve environmental protection requirements by paying carbon emission fees. Therefore, manufacturers reduce investment in emission reduction technologies and instead rely on purchasing carbon allowances to lower emission reduction costs.
Figure 9 shows that as the carbon trading price increases, the pricing of both fuel vehicles and NEVs under the “carbon cap-and-trade + dual-credit” policy shows an upward trend. This is because the rise in carbon trading prices directly pushes up manufacturers’ carbon emission costs, especially significantly affecting fuel vehicle production. To make up for the increased costs, manufacturers not only raise the prices of both types of vehicles but also may transfer additional costs to consumers to ensure profit levels. It can be seen that the increase in carbon trading prices prompts manufacturers to raise prices to maintain profitability by increasing production cost.

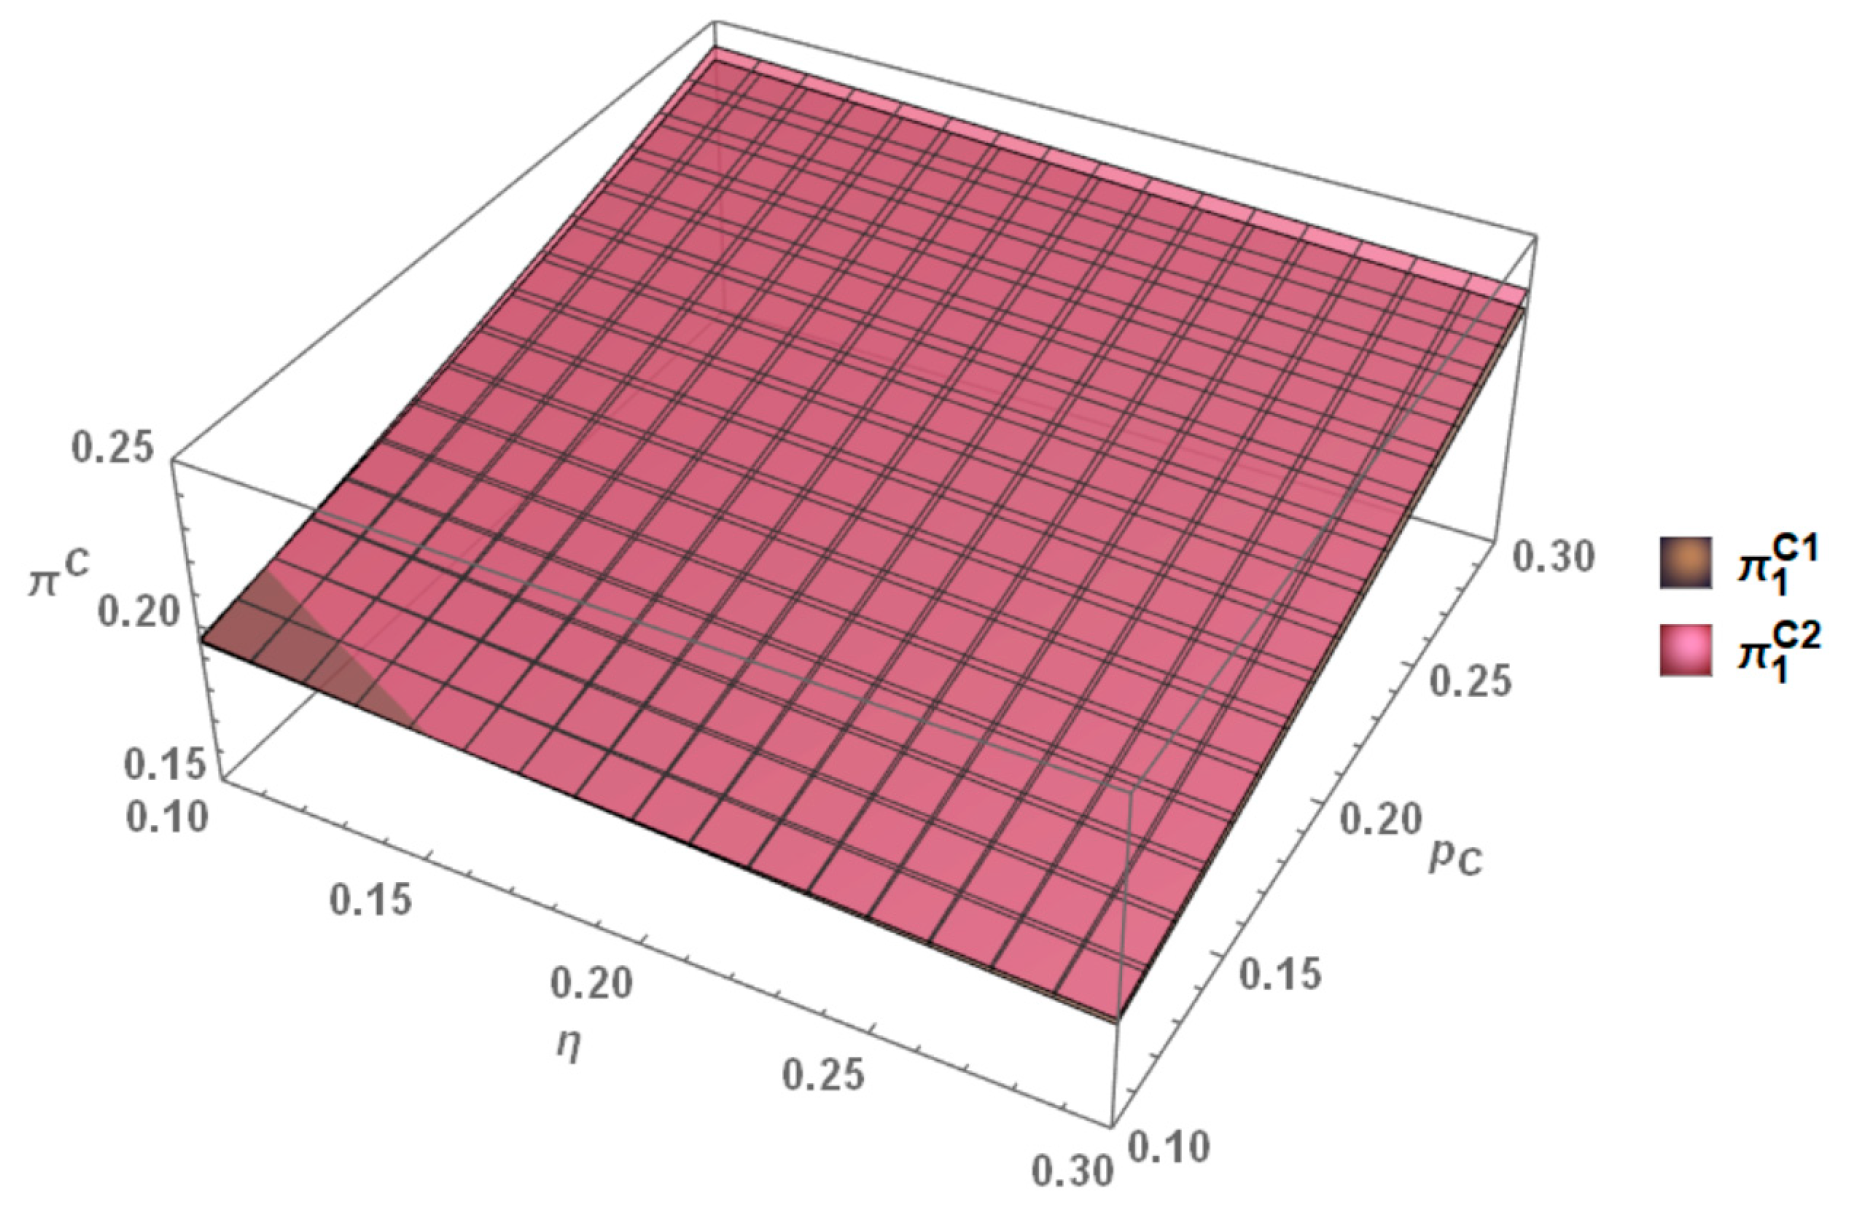
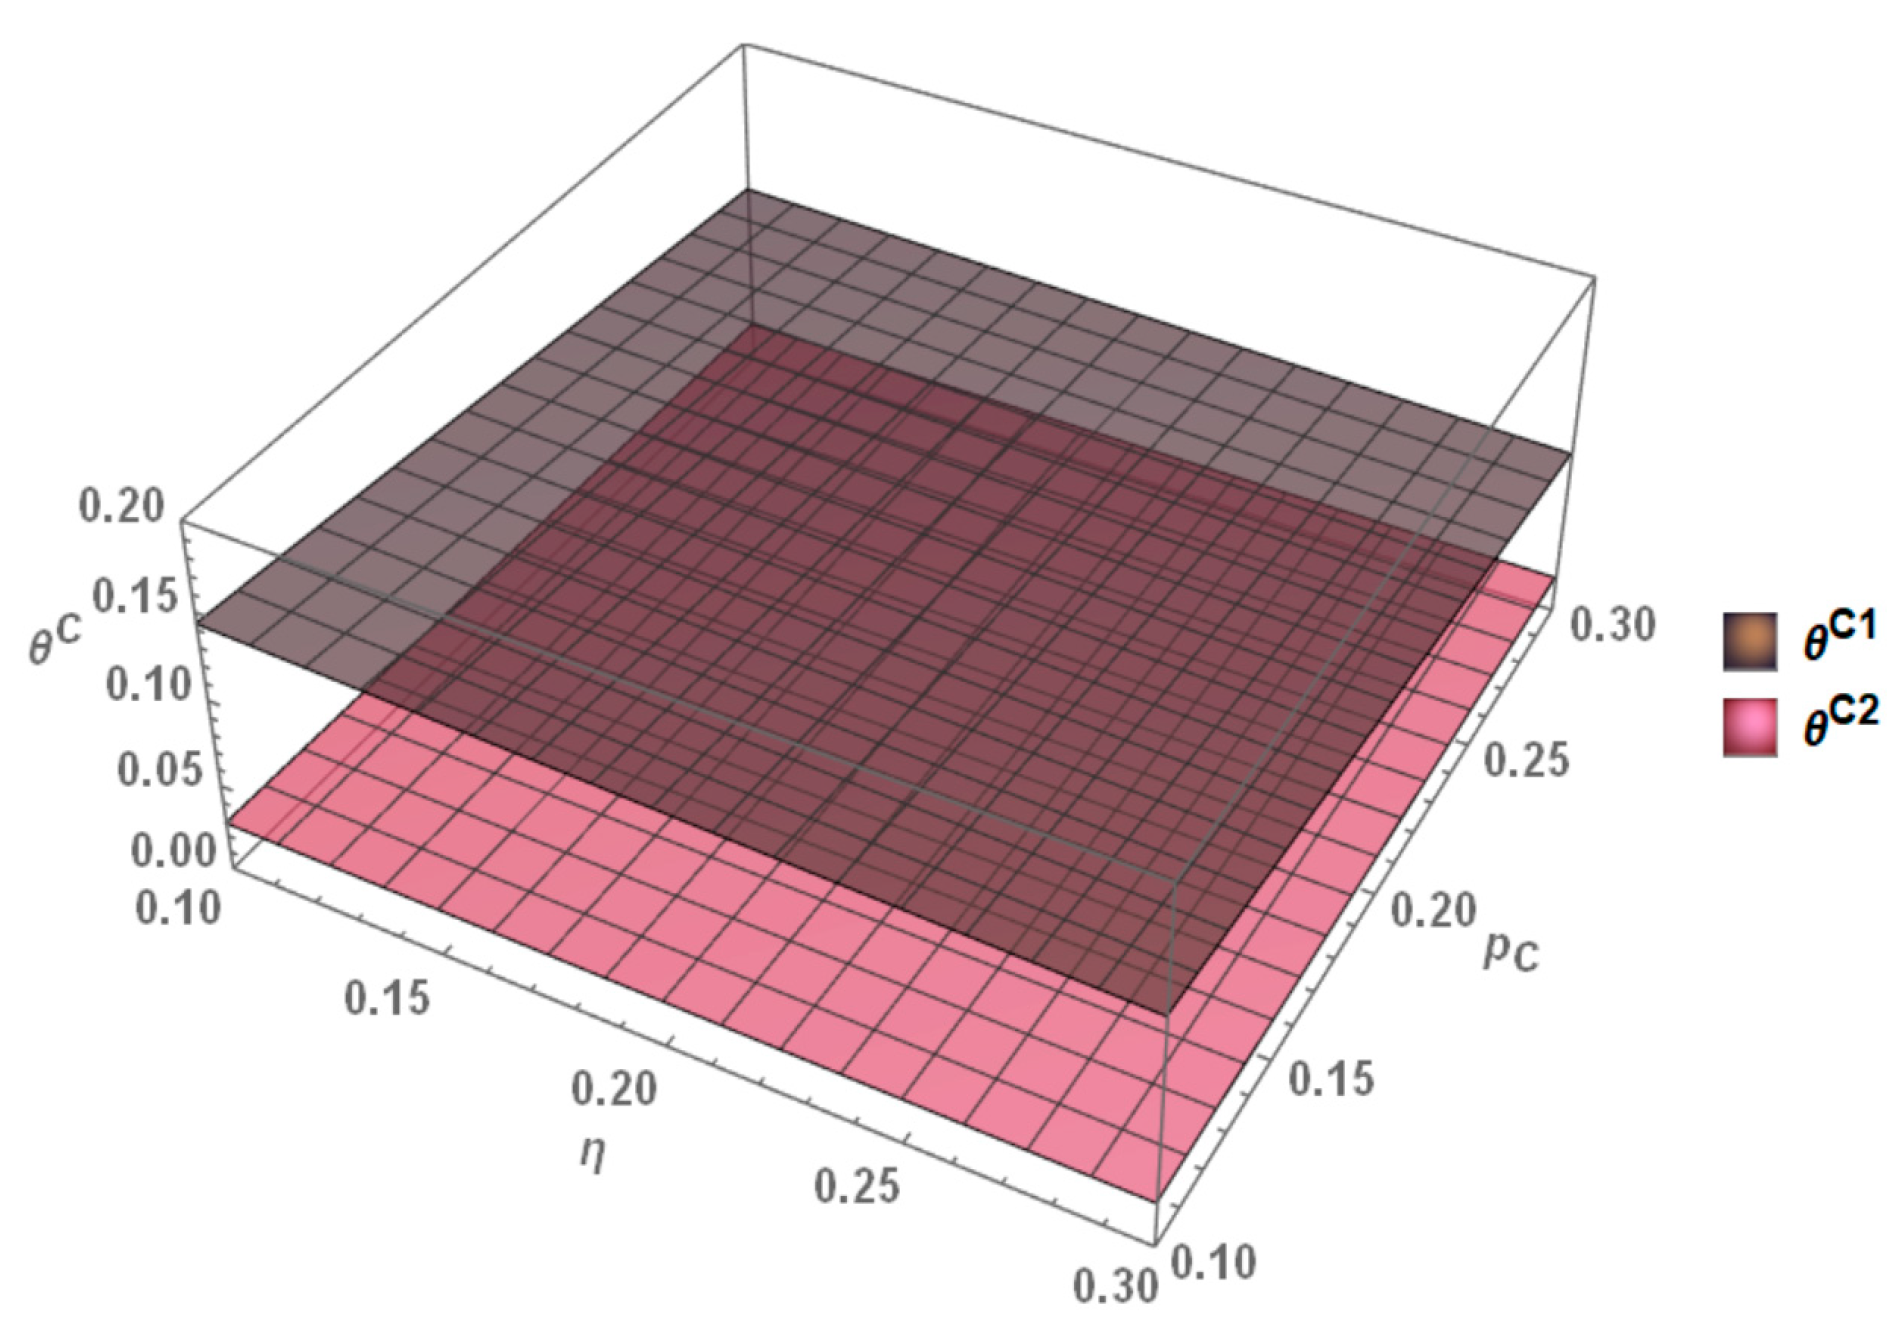
6.4. Interaction Effects of Policy Factors
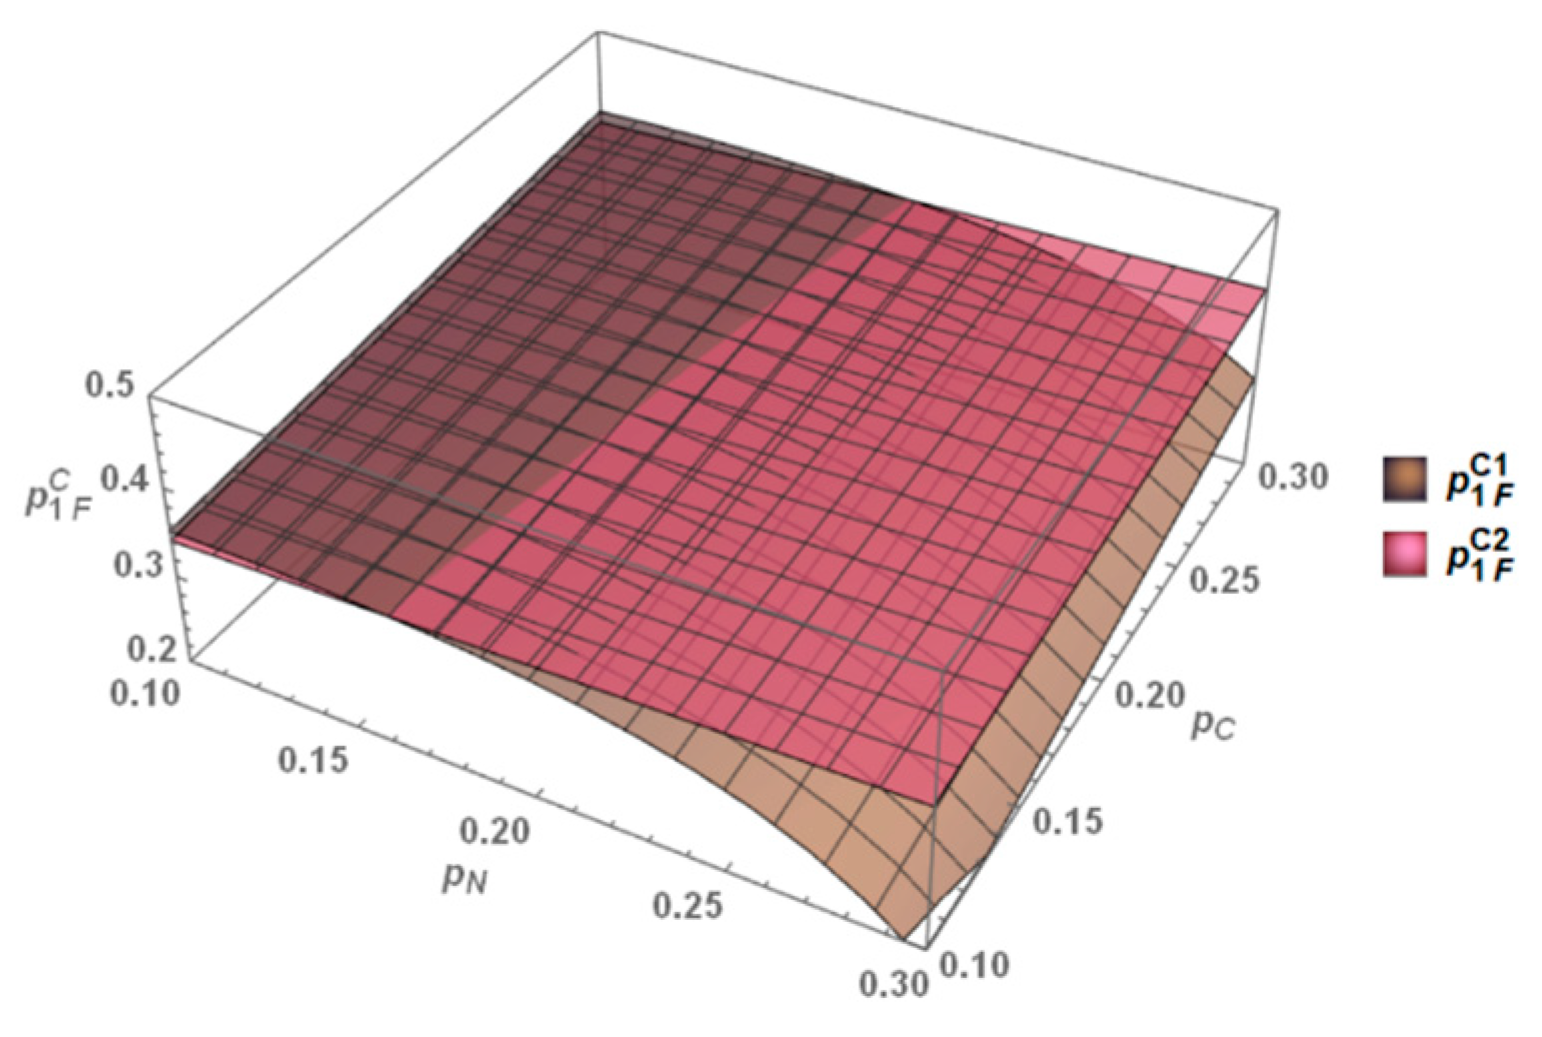
(1)
Interactive Impact of Policy Factors on Pricing
Figure 10 demonstrates the impact of changes in carbon trading prices and credit trading prices on the pricing of M1 under the combined effect of the dual-credit policy and the carbon cap-and-trade mechanism. In Scenario 1, M1 fails to meet the fuel consumption standard and needs to bear high carbon emission costs. At this time, the increase in credit trading prices has a more significant impact on reducing its pricing. This is because the rise in credit trading prices enables M1 to obtain more revenue from selling NEV credits, alleviating cost pressure and prompting it to further reduce fuel vehicle pricing to stimulate demand. In Scenario 2, M1 has achieved low fuel consumption, avoided additional carbon emission costs, and faced less emission reduction pressure. Therefore, the additional revenue brought by the increase in credit trading prices has a milder impact on its pricing strategy, with a relatively small pricing adjustment range, mainly driven by market demand and competition strategies.
Figure 11 demonstrates the impact of changes in carbon trading prices and credit ratio requirements on the pricing of M1 under the combined effect of the dual-credit policy and the carbon cap-and-trade mechanism. In both scenarios, the impact of carbon trading prices on the pricing of M1 is significantly greater than that of credit ratio requirements. This is because carbon trading prices directly affect manufacturers’ carbon emission costs, while credit ratio requirements affect the acquisition and exchange of credits. Since changes in carbon trading prices have a direct and significant impact on manufacturers’ overall cost structure, fluctuations in carbon trading prices play a dominant role in pricing strategies. In contrast, credit ratio requirements have a smaller impact on pricing, mainly reflected in the long-term adjustment of production strategies and emission reduction measures rather than short-term pricing adjustments.
(2)
The Interaction Effects of Policy Factors on Profits
Figure 12 demonstrates the impact of changes in carbon trading prices and credit trading prices on the profit of M1 under the combined effect of the dual-credit policy and the carbon cap-and-trade mechanism. In Scenario 1, the increase in credit trading prices leads to a more significant profit increase for M1. In this scenario, M1 fails to meet the fuel consumption standard and needs to purchase additional credits to meet emission reduction requirements, while the rise in credit trading prices provides it with additional income, driving profit growth. In Scenario 2, M1 has controlled fuel consumption below the standard through emission reduction, with low carbon emission costs. The rise in credit trading prices has a stable impact on its profits, but it can still increase profits by selling excess credits. Overall, changes in credit trading prices have a positive impact on the profit of M1 in both scenarios, and the profit increase in Scenario 1 more reflects the profit growth potential of manufacturers under high carbon emission costs.
Figure 13 demonstrates the impact of changes in carbon trading prices and credit ratio requirements on the profit of M1 under the combined effect of the dual-credit policy and the carbon cap-and-trade, indicating that regardless of the scenario, the impact of carbon trading prices on its profit is significantly greater than that of credit ratio requirements. This is because carbon trading prices directly affect manufacturers’ emission reduction costs. Higher carbon trading prices will increase carbon emission fees, forcing manufacturers to meet regulations by increasing emission reduction investment or purchasing more credits, thereby having a greater impact on profits. Although credit ratio requirements will affect production strategies, their impact on profits is relatively small. M1 prefers to balance emission reduction costs through the carbon trading market and adjust emission reduction effort levels and pricing strategies depending on fluctuations in carbon trading prices, so carbon trading prices have a more prominent impact on its profits.
(3)
The Interaction Effects of Policy Factors on Emission Reduction Effort Level
Figure 14 demonstrates the impact of changes in carbon trading prices and credit trading prices on the emission reduction effort level of M1 under the combined effect of the dual-credit policy and the carbon cap-and-trade mechanism. In Scenario 1, M1 faces high carbon emission costs due to failing to meet the fuel consumption standard. When the credit trading price rises, it tends to purchase additional credits to reduce emission reduction pressure and further increases emission reduction investment, lowering carbon emission costs through technological innovation and process optimization. Therefore, the increase in credit trading prices leads to a significant increase in its emission reduction effort level. In Scenario 2, M1 has reduced fuel consumption below the standard through emission reduction, with low carbon emission costs. When the credit trading price rises, it can sell excess NEV credits for profit, further relieving emission reduction pressure. At this time, it prefers to optimize products through technological innovation and efficiency improvement rather than rely on credit purchases to meet standards, so changes in credit trading prices have a stable impact on its emission reduction effort level. Overall, the change in the emission reduction effort level of M1 is more significant in Scenario 1.
Figure 15 demonstrates the impact of changes in carbon trading prices and credit ratio requirements on the emission reduction effort level of M1 under the combined effect of the dual-credit policy and the carbon cap-and-trade mechanism. In Scenario 1, M1 fails to meet the fuel consumption standard and mainly purchases additional credits to meet emission reduction requirements and reduce pressure. Although carbon trading prices and credit ratio requirements affect the cost structure, they do not significantly change its emission reduction strategy. The increase in credit ratio requirements cannot prompt it to further improve the fuel consumption standard, so the changes in both have little impact on its emission reduction effort level, which remains stable. In addition, the emission reduction effort level of M1 in Scenario 1 is more intense than that in Scenario 2.

7. Discussion and Conclusions

In this study, within a monopolistic market setting, a decision optimization model was developed to analyze the impacts of the sole “dual-credit” policy and the combined “carbon cap-and-trade + dual-credit” policy on automobile manufacturers’ production, pricing, and emission reduction strategies. The research results show that different policy environments have significant differential impacts on manufacturers’ decision-making behaviors and market outcomes. The conclusions are as follows:
(1) First, under the “carbon cap-and-trade + dual-credit” policy, although manufacturers face stricter emission reduction requirements, the dual policies provide greater flexibility for manufacturers. Through the carbon trading market, manufacturers can balance emission reduction costs and new NEV production to achieve profit maximization. Compared with the sole dual-credit policy, emission reduction effort levels of manufacturers may decrease under the dual-policy environment.
(2) Second, the study reveals the significant impacts of NEV credit trading prices and NEV credit ratio requirements on market equilibrium. As credit trading prices rise, manufacturers tend to increase NEV production while reducing fuel-powered vehicle output to adapt to market demand and policy guidance. With the increase in NEV credit ratio requirements, production costs and prices of fuel-powered vehicles may rise, thereby dampening consumer demand. Additionally, a rapid increase in NEV production could lead to market oversupply, triggering price fluctuations and market instability.
(3) Carbon trading prices exert a significant impact on market equilibrium. As carbon trading prices rise, production costs for both fuel-powered vehicles and NEVs increase, thereby reducing market demand. Meanwhile, M1’s emission reduction effort level decreases, while other manufacturers achieve profit growth by passing on part of the costs to consumers through product price increases. Therefore, manufacturers should address carbon trading price fluctuations through technological innovation and long-term investment planning.
(4) In the comparison between Scenario 1 and Scenario 2, M1 faces higher carbon emission costs due to its actual fuel consumption exceeding the compliance value. This pressure instead motivates it to make proactive efforts in low-carbon emission reduction and accelerates its low-carbon technological innovation to meet market demand for eco-friendly vehicles. In Scenario 2, although M1’s fuel consumption is below the compliance value, this compliant status may cause the company to lack further motivation for emission reduction, thereby missing opportunities for continuous innovation and long-term competitiveness improvement. Therefore, although Scenario 1 brings greater short-term pressure, it provides opportunities for transformation, upgrading, and sustainable development for M1 in the long run.
These conclusions provide important management implications for enterprises and governments: For policymakers, this study emphasizes the need to comprehensively consider factors such as NEV credit trading prices, NEV credit ratio requirements, carbon allowances, and carbon trading prices when formulating environmental policies. Policymakers should strive to strike a balance to ensure that manufacturers are incentivized to upgrade emission reduction technologies while maintaining market competitiveness and consumer welfare. For industry practitioners, the study suggests that automakers should flexibly adjust production and emission reduction strategies according to different policy environments and increase investment in R&D of new energy vehicle technologies to enhance enterprises’ adaptability to better respond to market demands and policy changes.
This study still has the following limitations: First, this research primarily focuses on a typical monopolistic market, but in reality, there are other complex market structures, such as oligopolistic markets, differentiated competition markets, and dynamic markets with new entrants. Future research could deeply investigate the impacts of the dual-credit policy and carbon trading on automakers’ pricing and emission reduction strategies under these market structures and explore market equilibrium and policy effects under different conditions of enterprise quantity, scale, and market share distribution. Second, while this study partially considered consumers’ preferences for NEVs and low-carbon awareness, actual consumer groups exhibit more complex heterogeneous preferences, such as differentiated demands for brand, performance, appearance, intelligent configurations, etc. Future research could further segment consumer groups to deeply analyze how heterogeneous consumer preferences influence automakers’ pricing, emission reduction strategies, and market equilibrium, and explore how to meet the needs of different consumer groups through policy guidance and corporate strategies to promote the balanced development of the NEV market.

Author Contributions

Conceptualization, Y.Z.; Methodology, W.C. and J.Z.; Software, C.W. (Chenxu Wu) and J.Z.; Validation, C.W. (Chao Wang); Investigation, C.W. (Chenxu Wu); Data curation, C.W. (Chao Wang); Writing—original draft, C.W. (Chenxu Wu) and C.W. (Chao Wang); Writing—review & editing, Y.Z.; Visualization, J.Z.; Supervision, Y.Z.; Project administration, Y.Z.; Funding acquisition, Y.Z. All authors have read and agreed to the published version of the manuscript.

Funding

This research was funded by Scientific Research Planning Subjects of China Society of Business Economics (20252019), and Yibin Social Science Planning Project grant number (YB25ND043).

Data Availability Statement

The original contributions presented in this study are included in the article. Further inquiries can be directed to the corresponding author(s).

Conflicts of Interest

The authors declare no conflict of interest.

Appendix A. The Value of M 1

π 1 S 1 * = 1 4 α 2 δ 2 p N 2 + 2 δ p N ( α + δ p N ) + ( 1 + α + ( η + e R e S ) p N ) 2 ( 1 + α ) ( β 2 2 τ ) τ + β e R + 2 τ ( β ( 4 + 4 α + β ) + 2 τ ) e R + e R 2 + 2 τ ( β 2 η + 2 η τ + 2 ( β 2 + τ ) e S + 3 β 2 e S 4 τ e S ) 2 τ e R ( ( 3 + 3 α + 4 β ) e R + 2 β ( 2 η + e S 3 e S ) ) p N 2 6 τ e R 2 ( η + e R e S ) p N 3 p N + 6 τ e R 2 ( η + e R e S ) p N 3 ( β 2 2 τ + p N e R ( 2 β + e R p N ) ) 2

Appendix B. The Value of M 2

π 1 C 1 * = 1 4 2 δ p N ( α c N p c + δ p N ) + ( α + c N p c δ p N ) ( α c N p c + δ p N ) 2 τ ( β + e R p N ) 2 ( 1 + α + c F p c + ( η + e R e S ) p N ) 2 ( β 2 2 τ + e R p N ( 2 β + e R p N ) ) 2 + 4 τ p N ( 1 + α + c F p c + ( η + e R e S ) p N ) e R + e S + e R ( β + e R p N ) ( 1 + α + c F p c + ( η + e R e S ) p N ) β 2 2 τ + e R p N ( 2 β + e R p N ) β 2 2 τ + e R p N ( 2 β + e R p N ) 4 p c 1 2 c N ( α c N p c + δ p N ) + τ c F ( 1 + α + c F p c + ( η + e R e S ) p N ) β 2 2 τ + e R p N ( 2 β + e R p N ) T 1 + 4 τ ( 1 + α + c F p c + ( η + e R e S ) p N ) τ ( 1 α + c F p c + ( η + e R e S ) p N ) + ( β + e R p N ) ( β c F p c + p N ( ( 1 α + β ) e R + β ( η e S ) ) ) ( β 2 2 τ + e R p N ( 2 β + e R p N ) ) ( β 2 2 τ + p N e R ( 2 β + e R p N ) ) 4 η p N τ ( 1 + α + c F p c + ( η + e R e S ) p N ) β 2 2 τ + p N e R ( 2 β + e R p N )

Appendix C. The Value of M 3

π 1 C 2 * = 1 4 ( α + δ p N ) 2 c N 2 p c 2 2 τ β ( 1 + α + c F p c + η p N ) 2 ( β 2 2 τ ) 2 4 η p N ( β 2 ( c F + c N ) p c + τ ( 1 + α + c F p c + η p N ) ) β 2 2 τ + 4 ( ( 1 + α ) τ + ( β 2 τ ) ( c F p c + η p N ) ) ( β 2 ( c F + c N ) p c + τ ( 1 + α + c F p c + η p N ) ) ( β 2 2 τ ) 2 + 4 p c 1 2 c N ( α c N p c + δ p N ) T 1 + c F ( β 2 ( c F + c N ) p c + τ ( 1 + α + c F p c + η p N ) ) β 2 2 τ

Appendix D. Proof of Proposition 5

p 1 F S 1 * η = p 1 F C 1 * η = p N ( β 2 τ + β e R p N ) ( β + p N e R ) 2 2 τ > 0
p 1 F S 2 * η = p 1 F C 2 * η = p N ( β 2 τ ) β 2 2 τ > 0
p 1 N S * p N = p 1 N C * p N = p 2 N S * p N = p 2 N C * p N = 1 2 δ < 0

Appendix E. Proof of Proposition 6

q 1 N S * p N = q 2 N S * p N = q 1 N C * p N = q 2 N C * p N = 1 2 δ > 0
q 1 F S 1 * p N = τ ( e R e S + η ) ( ( β + e R p N ) 2 2 τ ) 2 e R ( β + e R p N ) ( α + p N ( e R e S + η ) 1 ) ( ( β + e R p N ) 2 2 τ ) 2
( β + p N e R ) ( β η + e R ( 2 2 α + β p N ( η + e R ) ) + ( p N e R β ) e S ) 2 ( e R e S + η ) = τ 4 > τ , q 1 F S 1 * p N > 0
( β + p N e R ) ( β η + e R ( 2 2 α + β p N ( η + e R ) ) + ( p N e R β ) e S ) 2 ( e R e S + η ) = τ 4 < τ , q 1 F S 1 * p N < 0
q 1 F C 1 * p N = τ ( e R e S + η ) ( ( β + e R p N ) 2 2 τ ) 2 e R ( β + e R p N ) ( α + c F p c + p N ( e R e S + η ) 1 ) ( ( β + e R p N ) 2 2 τ ) 2
( β + e R p N ) ( β ( η e S ) e R 2 p N + e R ( 2 2 α + β 2 c F p c + ( η + e S ) p N ) ) 2 ( η + e R e S ) = τ 5 > τ , q 1 F C 1 * p N > 0
( β + e R p N ) ( β ( η e S ) e R 2 p N + e R ( 2 2 α + β 2 c F p c + ( η + e S ) p N ) ) 2 ( η + e R e S ) = τ 5 < τ , q 1 F C 1 * p N < 0
q 1 F S 2 * p N = q 1 F C 2 * p N = η τ β 2 2 τ < 0

Appendix F. Proof of Proposition 7

q 1 F S 1 * η = q 1 F C 1 * η = τ p N ( β + p N e R ) 2 2 τ < 0
q 1 F S 2 * η = q 1 F C 2 * η = τ p N β 2 2 τ < 0

Appendix G. Proof of Proposition 8

θ S 1 * η = θ C 1 * η = p N ( β + p N e R ) ( β + p N e R ) 2 2 τ < 0
θ S 2 * η = θ C 2 * η = β p N β 2 2 τ < 0
θ S 1 * p N = ( β + e R p N ) 2 ( e R ( α + β + 1 ) + β ( η e S ) ) 2 τ ( 2 e R 2 p N + e R ( α + β 2 e S p N + 2 η p N 1 ) + β ( η e S ) ) ( ( β + e R p N ) 2 2 τ ) 2
e R ( 1 + α β ) β 2 + 2 ( 1 + α + β ) τ + p N e R ( 2 β ( 1 α + β ) + 4 τ + p N ( 1 + α β ) e R ) β 3 2 β τ + p N e R ( 2 β 2 4 τ + p N β e R ) + e S = η 1 > η , θ S 1 * p N > 0
θ C 1 * p N = ( β + e R p N ) 2 ( e R ( α + β c F p c + 1 ) + β ( η e S ) ) 2 τ e R ( α + β + c F p c 2 e S p N + 2 η p N 1 ) + 2 e R 2 p N + β ( η e S ) ( ( β + e R p N ) 2 2 τ ) 2
e R ( 1 + α β ) β 2 + 2 ( 1 + α + β ) τ + p N e R ( 2 β ( 1 α + β ) + 4 τ + p N ( 1 + α β ) e R ) + τ c F ( β 2 + 2 τ + p N e R ( 2 β + p N e R ) ) β 3 2 β τ + p N e R ( 2 β 2 4 τ + p N β e R ) + e S = η 2 > η , θ C 1 * p N > 0
e R ( 1 + α β ) β 2 + 2 ( 1 + α + β ) τ + p N e R ( 2 β ( 1 α + β ) + 4 τ + p N ( 1 + α β ) e R ) + τ c F ( β 2 + 2 τ + p N e R ( 2 β + p N e R ) ) β 3 2 β τ + p N e R ( 2 β 2 4 τ + p N β e R ) + e S = η 2 < η , θ C 1 * p N < 0
θ S 2 * p N = θ C 2 * p N = β η β 2 2 τ < 0

Appendix H. Proof of Proposition 9

π 1 S 1 * η = p N 4 ( 1 + α ) ( β 2 2 τ ) τ + 4 τ ( β 2 2 τ ) ( e S η ) p N 12 τ e R 3 p N 3 + e R ( β 4 τ p N ( β ( 4 + 4 α + β ) 2 τ + β ( 4 η + e S 5 e S ) p N ) ) + e R 2 p N ( 1 + 4 τ p N ( 3 3 α 4 β + 3 ( η + e S ) p N ) ) 4 ( β 2 2 τ + e R p N ( 2 β + e R p N ) ) 2
π 1 S 2 * η = τ p N ( β 2 + 2 τ ) ( 1 + α + η p N ) ( β 2 2 τ ) 2 < 0
π 2 S 1 * p N = π 2 S 2 * p N = 1 2 δ ( α + δ p N ) > 0
π 2 C 1 * p N = π 2 C 2 * p N = 1 2 δ ( α c N p c + δ p N ) > 0

Appendix I. Proof of Proposition 10

p 1 F C 1 * p c = c F ( e R p N + β 2 τ ) ( e R p N + β ) 2 2 τ > 0
p 1 F C 2 * p c = c F ( β 2 τ ) β 2 2 τ > 0
p 1 N C 1 * p c = p 1 N C 2 * p c = p 2 N C 1 * p c = p 2 N C 2 * p c = c N 2 > 0

Appendix J. Proof of Proposition 11

q 1 F C 1 * p c = c F τ ( e R p N + β ) 2 2 τ < 0
q 1 F C 2 * p c = ( c F + c N ) β 2 + τ c F β 2 2 τ < 0
q 1 N C 1 * p c = q 1 N C 2 * p c = q 2 N C 1 * p c = q 2 N C 2 * p c = c N 2 < 0

Appendix K. Proof of Proposition 12

π 2 C 1 * p c = π 2 C 2 * p c = 1 2 c N ( α c N p c + δ p N ) + T 2 > 0

Appendix L. Proof of Proposition 13

θ C 1 * p c = c F ( β + e R p N ) ( β + e R p N ) 2 2 τ < 0
θ C 2 * p c = c F β β 2 2 τ < 0

Appendix M. Proof of Proposition 14

θ C 1 * θ S 1 * = c F p c ( β + e R p N ) ( β + e R p N ) 2 2 τ < 0
θ C 2 * θ S 2 * = β c F p c β 2 2 τ < 0
θ S 1 * θ S 2 * = 2 τ + ( β 2 2 τ ) ( β + e R p N ) ( 1 + α + ( η + e R e S ) p N ) β 3 ( 1 + α + η p N ) + e R p N ( 2 β + e R p N ) ( β 2 2 τ ) ( ( β + e R p N ) 2 2 τ ) < 0
θ C 1 * θ C 2 * = ( β 2 2 τ ) ( β + e R p N ) ( 1 + α + c F p c + ( η + e R e S ) p N ) β ( 1 + α + c F p c + η p N ) ( β 2 2 τ + p N e R ( 2 β + e R p N ) ) ( ( β + e R p N ) 2 2 τ ) ( β 2 2 τ ) < 0
Let F 1 = β + e R p N , F 2 = 1 + α + η + e R e S p N , and F 3 = β 3 ( 1 + α + η p N ) . From the conditions for the existence of equilibrium solutions, there are e R > e S > 0 and 0 < p N < 1 α η . Then, τ > β 2 + p e R ( 2 β + p e R ) 2 , 0 < τ < 1 α η + e R e S . Therefore, by comparing the equilibrium solutions under the two policies, it can be concluded that θ S 1 * θ S 2 * < 0 and θ C 1 * θ C 1 * < 0 .

Appendix N. Proof of Proposition 15

p 1 F S 2 * p 1 F C 2 * = c F p c ( β 2 τ ) β 2 2 τ < 0 p 1 N S 1 * p 1 N C 1 * = p 1 N S 2 * p 1 N C 2 * = 1 2 c N p c < 0 p 2 N S 1 * p 2 N C 1 * = p 2 N S 2 * p 2 N C 2 * = 1 2 c N p c < 0

Appendix O. Proof of Proposition 16

q 1 F S 1 * q 1 F C 1 * = τ c F p c ( β + e R p N ) 2 2 τ > 0 q 1 F S 2 * q 1 F C 2 * = ( ( β 2 τ ) c F β 2 c N ) p c β 2 2 τ > 0 q 1 N S 1 * q 1 N C 1 * = q 1 N S 2 * q 1 N C 2 * = c F p c 2 > 0 q 2 F S 1 * q 2 F C 1 * = q 2 N S 2 * q 2 N C 2 * = c F p c 2 > 0

References

  1. Jia, T.; Li, C.; Wang, H.; Hu, Y.-J.; Wang, S.; Xu, G.; Hoang, A.T. Subsidy policy or dual-credit policy? Evolutionary game analysis of green methanol vehicles promotion. Energy 2024, 293, 130763. [Google Scholar] [CrossRef]
  2. He, H.; Li, S.; Wang, S.; Zhang, C.; Ma, F. Value of dual-credit policy: Evidence from green technology innovation efficiency. Transp. Policy 2023, 139, 182–198. [Google Scholar] [CrossRef]
  3. Yu, H.; Li, Y.; Wang, W. Optimal innovation strategies of automakers with market competition under the dual-credit policy. Energy 2023, 283, 128403. [Google Scholar] [CrossRef]
  4. Shi, L.; Lin, B. The dual-credit policy effectively replaces subsidy from the perspective of R&D intensity. Environ. Impact Assess. Rev. 2023, 102, 107160. [Google Scholar]
  5. Pu, J.; Chun, W.; Yang, H. Low carbon strategy and coordination for a two-echelon automotive supply chain considering dual credit policy. Comput. Ind. Eng. 2024, 192, 110229. [Google Scholar] [CrossRef]
  6. Goulder, L.H.; Schein, A.R. Carbon taxes versus cap and trade: A critical review. Clim. Change Econ. 2013, 4, 1350010. [Google Scholar] [CrossRef]
  7. Li, Y.; Zhang, L.; Liu, J.; Qiao, X. Can the dual-credit policy help china’s new energy vehicle industry achieve corner overtaking? Sustainability 2023, 15, 2406. [Google Scholar] [CrossRef]
  8. Peng, L.; Li, Y. Policy evolution and intensity evaluation of the Chinese new energy vehicle industry policy: The angle of the dual-credit policy. World Electr. Veh. J. 2022, 13, 90. [Google Scholar] [CrossRef]
  9. Ou, S.; Lin, Z.; Qi, L.; Li, J.; He, X.; Przesmitzki, S. The dual-credit policy: Quantifying the policy impact on plug-in electric vehicle sales and industry profits in China. Energy Policy 2018, 121, 597–610. [Google Scholar] [CrossRef]
  10. Cheng, Y.; Mu, D. Optimal production decision of vehicle manufacturer based on double-score system. Syst. Eng. Theory Pract. 2018, 38, 2817–2830. [Google Scholar]
  11. Chen, K.; Zhao, F.; Hao, H.; Liu, Z. Synergistic impacts of China’s subsidy policy and new energy vehicle credit regulation on the technological development of battery electric vehicles. Energies 2018, 11, 3193. [Google Scholar] [CrossRef]
  12. Cheng, L.; Huang, P.; Zhang, M.; Yang, R.; Wang, Y. Optimizing Electricity Markets Through Game-Theoretical Methods: Strategic and Policy Implications for Power Purchasing and Generation Enterprises. Mathematics 2025, 13, 373. [Google Scholar] [CrossRef]
  13. Chaabane, A.; Ramudhin, A.; Paquet, M. Design of sustainable supply chains under the emission trading scheme. Int. J. Prod. Econ. 2012, 135, 37–49. [Google Scholar] [CrossRef]
  14. Drake, D.; Kleindorfer, P.R.; Van Wassenhove, L.N. Technology choice and capacity portfolios under emissions regulation. Prod. Oper. Manag. 2016, 25, 1006–1025. [Google Scholar] [CrossRef]
  15. Song, J.; Leng, M. Analysis of the single-period problem under carbon emissions policies. In Handbook of Newsvendor Problems: Models, Extensions and Applications; Springer: New York, NY, USA, 2012; pp. 297–313. [Google Scholar]
  16. Wang, Z.; Wu, Q. Carbon emission reduction and product collection decisions in the closed-loop supply chain with cap-and-trade regulation. Int. J. Prod. Res. 2021, 59, 4359–4383. [Google Scholar] [CrossRef]
  17. Zhang, T.; Hao, Y.; Zhu, X. Consignment inventory management in a closed-loop supply chain for deteriorating items under a carbon cap-and-trade regulation. Comput. Ind. Eng. 2022, 171, 108410. [Google Scholar] [CrossRef]
  18. Gong, B.; Xia, X.; Cheng, J. Supply-chain pricing and coordination for new energy vehicles considering heterogeneity in consumers’ low carbon preference. Sustainability 2020, 12, 1306. [Google Scholar] [CrossRef]
  19. Yi, Y.; Fu, A.; Zhang, S.; Li, Y. Dynamic pricing and joint carbon reduction strategies at the production and consumption end in a dual-channel fuel vehicle supply chain. Energy Econ. 2024, 131, 107396. [Google Scholar] [CrossRef]
  20. Yi, Y.; Fu, A.; Zhang, M.; Li, Y. Dynamic gaming strategies about fuel consumption reduction and mileage range between two heterogeneous automotive supply chains. Environ. Dev. Sustain. 2025, 1–30. [Google Scholar] [CrossRef]
  21. Cheng, Y.; Fan, T.; Zhou, L. Optimal strategies of automakers with demand and credit price disruptions under the dual-credit policy. J. Manag. Sci. Eng. 2022, 7, 453–472. [Google Scholar] [CrossRef]
  22. Li, Y.; Zhang, Q.; Tang, Y.; Mclellan, B.; Ye, H.; Shimoda, H.; Ishihara, K. Dynamic optimization management of the dual-credit policy for passenger vehicles. J. Clean. Prod. 2020, 249, 119384. [Google Scholar] [CrossRef]
  23. Ma, M.; Meng, W.; Huang, B.; Li, Y. The influence of dual credit policy on new energy vehicle technology innovation under demand forecast information asymmetry. Energy 2023, 271, 127106. [Google Scholar] [CrossRef]
  24. Yi, Y.; Zhang, M.; Zhang, A.; Li, Y. Can “dual credit” replace “subsidies” successfully? -based on analysis of vehicle supply chain decisions under the digital transformation of technology. Energy Econ. 2024, 130, 107303. [Google Scholar] [CrossRef]
  25. Zhang, X.; Sun, H.; Liu, K.Y.; Liu, S. Dual credit policy, product line decisions, and CO2 emission reduction. Ann. Oper. Res. 2023, 1–25. [Google Scholar] [CrossRef]
  26. Xu, X.; He, P.; Xu, H.; Zhang, Q. Supply chain coordination with green technology under cap-and-trade regulation. Int. J. Prod. Econ. 2017, 183, 433–442. [Google Scholar] [CrossRef]
  27. Luo, Z.; Chen, X.; Wang, X. The role of co-opetition in low carbon manufacturing. Eur. J. Oper. Res. 2016, 253, 392–403. [Google Scholar] [CrossRef]
  28. Chen, X.; Wang, X.; Xia, Y. Low-carbon technology transfer between rival firms under cap-and-trade policies. IISE Trans. 2021, 54, 105–121. [Google Scholar] [CrossRef]
  29. Chai, Q.; Li, Y.; Xiao, Z.; Lai, K.-H. Optimal carbon abatement strategy for manufacturers under cap-and-trade. Int. J. Environ. Res. Public Health 2022, 19, 10987. [Google Scholar] [CrossRef]
  30. Tong, W.; Liu, H.; Du, J. Does the carbon trading mechanism affect social and environmental benefits of the retailer-led supply chain: Strategic decisions of emissions reduction and promotion. Front. Environ. Sci. 2022, 10, 971214. [Google Scholar] [CrossRef]
  31. Xu, X.; Zhang, W.; He, P.; Xu, X. Production and pricing problems in make-to-order supply chain with cap-and-trade regulation. Omega 2017, 66, 248–257. [Google Scholar] [CrossRef]
  32. Bai, Q.; Xu, J.; Zhang, Y. Emission reduction decision and coordination of a make-to-order supply chain with two products under cap-and-trade regulation. Comput. Ind. Eng. 2018, 119, 131–145. [Google Scholar] [CrossRef]
  33. Yu, L.; Jiang, X.; He, Y.; Jiao, Y. Promoting the diffusion of new energy vehicles under dual credit policy: Asymmetric competition and cooperation in complex network. Energies 2022, 15, 5361. [Google Scholar] [CrossRef]
  34. Shao, J.; Yang, H.; Zhang, A. Adoption of electric vehicles: Manufacturers’ incentive and government policy. J. Transp. Econ. Policy (JTEP) 2019, 53, 175–198. [Google Scholar]
  35. Yu, M.; Cruz, J.M.; Li, D.; Masoumi, A.H. A multiperiod competitive supply chain framework with environmental policies and investments in sustainable operations. Eur. J. Oper. Res. 2022, 300, 112–123. [Google Scholar] [CrossRef]
  36. Liu, L.; Wang, Z.; Liu, Y.; Zhang, Z. Vehicle product-line strategy under dual-credit and subsidy back-slope policies for conventional/new energy vehicles. Comput. Ind. Eng. 2023, 177, 109020. [Google Scholar] [CrossRef]
  37. Wang, Y.; Zhang, Z.; Zhu, M. Optimal subsidy policy for new energy vehicles based on the influence of multiple factors and consumers’ green preference. Manag. Decis. Econ. 2024, 45, 2868–2891. [Google Scholar] [CrossRef]
  38. Zhou, J.; Li, Y.; Ye, F.; Zhao, X.; Tong, Y.; Guo, H. Single rollover or dual rollover: How a monopoly NEV manufacturer responds to NEV credit policy. Transp. Res. Part E Logist. Transp. Rev. 2024, 191, 103739. [Google Scholar] [CrossRef]
  39. Stepanova, A.; Tesoriere, A. R&D with spillovers: Monopoly versus noncooperative and cooperative duopoly. Manch. Sch. 2011, 79, 125–144. [Google Scholar]
  40. Ishikawa, N.; Shibata, T. R&D competition and cooperation with asymmetric spillovers in an oligopoly market. Int. Rev. Econ. Financ. 2021, 72, 624–642. [Google Scholar]
  41. Cheng, L.; Yu, F.; Huang, P.; Liu, G.; Zhang, M.; Sun, R. Game-theoretic evolution in renewable energy systems: Advancing sustainable energy management and decision optimization in decentralized power markets. Renew. Sustain. Energy Rev. 2025, 217, 115776. [Google Scholar] [CrossRef]
  42. Jiang, Y.; Liu, C. Research on carbon emission reduction and blockchain investment under different dual-channel supply chains. Environ. Sci. Pollut. Res. 2022, 29, 65304–65321. [Google Scholar] [CrossRef] [PubMed]
  43. Xiao, L.; Chen, Z.S.; Hou, R.; Mardani, A.; Skibniewski, M.J. Greenness-based subsidy and dual credit policy to promote new energy vehicles considering consumers’ low-carbon awareness. Comput. Ind. Eng. 2023, 185, 109620. [Google Scholar] [CrossRef]
  44. Zhao, D.; Wang, J.; Li, W.-W.; Tang, J.-H.; Huang, S. Consider payoff or emphasize learning? Exploring the effect of new dual-credit policy on electric vehicle diffusion in complex network. Energy Econ. 2025, 148, 108622. [Google Scholar] [CrossRef]
  45. Pu, J.; Chun, W. How does dual-credit policy regulate competitive fuel vehicle and new energy vehicle manufacturers? based on operational decision analysis under multiple scenarios. Comput. Ind. Eng. 2025, 203, 111076. [Google Scholar] [CrossRef]
  46. Qi, X.; Han, Y. The impact of technological innovation for emission reduction on decision-making for intertemporal carbon trading. Comput. Ind. Eng. 2023, 186, 109739. [Google Scholar] [CrossRef]
  47. Zhu, Z.; Cheng, L.; Shen, T. Spontaneous Formation of Evolutionary Game Strategies for Long-Term Carbon Emission Reduction Based on Low-Carbon Trading Mechanism. Mathematics 2024, 12, 3109. [Google Scholar] [CrossRef]
Figure 1. (a) The impact of NEV credit trading prices on pricing under Scenario 1; (b) The impact of NEV credit trading prices on pricing under Scenario 2.
Mathematics 13 02262 g001
Figure 2. Impact of NEV credit trading price on emission reduction effort levels.
Mathematics 13 02262 g002
Figure 3. (a) The impact of NEV credit trading prices on profits under Scenario 1; (b) The impact of NEV credit trading prices on profits under Scenario 2.
Mathematics 13 02262 g003
Figure 4. (a) The impact of NEV credit ratio requirement prices on pricing under Scenario 1; (b) The impact of NEV credit ratio requirement prices on pricing under Scenario 2.
Mathematics 13 02262 g004
Figure 5. Impact of NEV credit ratio requirement on emission reduction effort levels.
Mathematics 13 02262 g005
Figure 6. (a) The impact of NEV credit ratio requirement prices on profits under Scenario 1; (b) The impact of NEV credit ratio requirement prices on profits under Scenario 2.
Mathematics 13 02262 g006
Figure 7. Impact of carbon trading price on pricing.
Mathematics 13 02262 g007
Figure 8. Impact of carbon trading price on emission reduction effort levels.
Mathematics 13 02262 g008
Figure 9. Impact of carbon trading price on profits.
Mathematics 13 02262 g009
Figure 10. Impact of carbon trading price and credit trading price on pricing.
Mathematics 13 02262 g010
Figure 11. Impact of carbon trading price and credit ratio requirement on pricing.
Mathematics 13 02262 g011
Figure 12. Impact of carbon trading price and credit trading price on profits.
Mathematics 13 02262 g012
Figure 13. Impact of carbon trading price and credit ratio requirement on profits.
Mathematics 13 02262 g013
Figure 14. Impact of carbon trading price and credit trading price on emission reduction effort level.
Mathematics 13 02262 g014
Figure 15. Impact of carbon trading price and credit ratio requirement on emission reduction effort level.
Mathematics 13 02262 g015
Table 1. Comparison between this article and related literature.
LiteratureMarket StructureStrategyDual-CreditCap-and-TradeMixed Carbon Policy
Yu H (2023) [24] Oligopoly manufacturersOptimal innovation
Pu J (2024) [5]Monopoly manufacturersEmission reduction
Wang Z (2021) [16]Duopoly manufacturersEmission reduction and product
Zhang T (2022) [17]/Inventory
Yi Y (2024) [19]A manufacturer and a retailerPricing
Cheng Y (2022) [21]A manufacturer and governmentPricing and production
Li Y (2020) [22]Duopoly manufacturers Production and credit
Wang Y (2024) [38]A manufacturer and governmentSubsidy policy
Zhou J (2024) [39]Monopoly manufacturersPricing and rollover
This paperMonopoly manufacturersPricing and emission reduction
Table 2. Definition of notations in the model.
NotationsDefinition
R = A , B A denotes the single dual-credit policy, and B denotes the “cap-and-trade + dual-credit” policy.
S = S 1 , S 2 , C 1 , C 2 S 1 and S 2 refer to the actual fuel consumption of Manufacturer 1 after emission reduction exceeds and is lower than the standard value under the single dual-credit policy, respectively. C 1 and C 2 denote the actual fuel consumption of Manufacturer 1 after emission reduction exceeds and is lower than the standard value under the “cap-and-trade + dual-credit” policy, respectively.
q 1 F The fuel vehicle production quantity of M1
q i N The NEV production quantity of Manufacturer i , i = 1 , 2
τ M1’s emission reduction effort cost coefficient
e S CAFC compliance value
e R Actual CAFC value for fuel vehicles
δ Positive NEV credit generated by producing one NEV
η NEV credit ratio requirement
p N Trading price of NEV credits
α Proportion of consumers preferring NEVs
β Low-carbon preference awareness of fuel vehicle consumers
p c Unit carbon trading price
T i Total carbon allowance of Manufacturer i , i = 1 , 2
c N Per unit carbon emissions from producing NEVs
c F Per unit carbon emissions from producing fuel vehicles
C i Total carbon emissions of Manufacturer i , i = 1 , 2
π 1 Profit of M1
π 2 Profit of M2
Decision VariableDefinition
p 1 F The price of fuel vehicles by M1
p i N The price of NEVs by Manufacturer, i = 1 , 2
θ M1’s emission reduction effort level
Disclaimer/Publisher’s Note: The statements, opinions and data contained in all publications are solely those of the individual author(s) and contributor(s) and not of MDPI and/or the editor(s). MDPI and/or the editor(s) disclaim responsibility for any injury to people or property resulting from any ideas, methods, instructions or products referred to in the content.

