You are currently viewing a new version of our website. To view the old version click .
Mathematics
  • Article
  • Open Access

5 February 2024

Cluster Size Intelligence Prediction System for Young Women’s Clothing Using 3D Body Scan Data

,
and
1
College of Engineering and Design, Hunan Normal University, Changsha 410081, China
2
Institute of Interdisciplinary Studies, Hunan Normal University, Changsha 410081, China
3
School of Art & Design, Taizhou University, Taizhou 318000, China
*
Author to whom correspondence should be addressed.
This article belongs to the Special Issue Real-Time Predictive and Prescriptive Analytics in Information Systems: Theory and Applications

Abstract

This study adopts a data-driven methodology to address the challenge of garment fitting for individuals with diverse body shapes. Focusing on young Chinese women aged 18–25 from Central China, we utilized the German VITUS SMART LC3 3D body scanning technology to measure 62 body parts pertinent to fashion design on a sample of 220 individuals. We then employed a hybrid approach, integrating the circumference difference classification method with the characteristic value classification method, and applied the K-means clustering algorithm to categorize these individuals into four distinct body shape groups based on cluster center analysis. Building upon these findings, we formulated specific linear regression models for key body parts associated with each body shape category. This led to the development of an intelligent software capable of automatically calculating the dimensions of 28 body parts and accurately determining the body shape type for young Central Chinese women. Our research underscores the significant role of intelligent predictive systems in the realm of fashion design, particularly within a data-driven framework. The system we have developed offers precise body measurements and classification outcomes, empowering businesses to create garments that more accurately conform to the wearer’s body, thus enhancing both the fit and aesthetic value of the clothing.

1. Introduction

In the context of rapid changes in the fashion industry, there has been a significant growth in demand for personalized and customized clothing. This trend poses new challenges for designers and brands in accurately predicting consumers’ diverse body sizes and shapes [1]. Traditional physical measurement methods, such as manual measurement and 3D scanning, can obtain a large amount of body size data for custom clothing design. However, these methods have limitations in terms of efficiency and accuracy, especially in measuring hard-to-measure body sizes such as back width and stride length [2]. Moreover, the lack of extensive body size information limits designers’ and consumers’ intuitive understanding of body shape features composed of these data. These limitations directly affect the aesthetics and fit of clothing design [3]. Therefore, developing methods to accurately predict body size and shape is crucial for designers and clothing companies. It not only helps in creating better-fitting garments but also provides a more accurate shopping experience for consumers during online shopping.
In clothing and product design, human body size data are crucial [4]. The main methods of gathering these data include manual measurement, three-dimensional scanning, and size prediction. Manual measurement is common but has low accuracy, is time-consuming, and poses data storage difficulties [5]. Three-dimensional scanning can quickly obtain multiple accurate body sizes but is limited in its application due to high costs and the need for on-site operation [6]. With the increasing demand for personalization and customization, developing fast, accurate, and low-cost human body data prediction technology becomes particularly important. The goal is to predict more hard-to-measure sizes using a small amount of easily obtainable size data through various algorithms [7].
In the research of body size prediction algorithms, various algorithms have been widely applied, including Linear Regression (LR), Random Forest, Gradient Boosting Trees, and Regression Neural Networks [8]. For example, Galada et al. constructed regression model using height, hip, waist height, knee height, and arm length to predict hard-to-measure female hip length [9]. Wang et al. developed a prediction model based on Radial Basis Function (RBF) Artificial Neural Networks (ANNs), enabling the generation of more detailed size information from basic data inputs like waist and abdomen circumference at the output layer [10]. These studies primarily focus on predicting a single body size, lacking consideration of visual aesthetics in clothing design applications for different body types. Further research combining body shape studies is needed to meet the affective requirements of size prediction in clothing design [11,12].
In ergonomics research, body shape is defined based on the differences, proportions, and contours constituted by body sizes [13]. Scholars often explore body shape categories using methods like Principal Component Analysis, K-means Clustering, Hierarchical Clustering, and Decision Trees, focusing on circumference and length indicators [14,15]. For instance, the FFIT technology defines nine types of American women’s body shapes such as triangular, rectangular, cylindrical, and oval, using differences in bust, waist, and hip circumferences [16]. Special issues related to overweight body shape classification have been explored by Korean scholars through factor analysis and hierarchical cluster analysis of body size data, exploring representative body types and the morphological features of overweight bodies [17].
Summarizing the above research, although significant achievements have been made in body size prediction and classification technology, research still faces three major challenges. Firstly, most studies focus only on single size prediction, neglecting the interactions between sizes and the overall body shape. Secondly, these technologies, although suitable for large markets, often fail to flexibly address the needs of specific niche markets, such as design applications for chain store uniforms. Thirdly, existing research is at a basic scientific stage, making it difficult for designers and users to directly apply these algorithms.
In this study, we propose a new prediction framework that integrates body shape classification with size prediction algorithms to improve the accuracy of size prediction in niche markets of the clothing design field. First, this framework classifies the body shapes of specific populations to accurately define representative body types for the target group, ensuring that the prediction algorithms adapt to the characteristics of different body types. Subsequently, an optimized linear regression model is used to precisely predict hard-to-measure body sizes. After data validation, the accuracy of the prediction results reaches up to 95%, showing a significant improvement in the accuracy of prediction data, the intuitiveness of visual expression, and the convenience of operation.
Our main contributions can be summarized as follows:
(1)
We introduced body shape classification to refine the body size prediction model, enhancing the accuracy of prediction data and offering more intuitive visual expression.
(2)
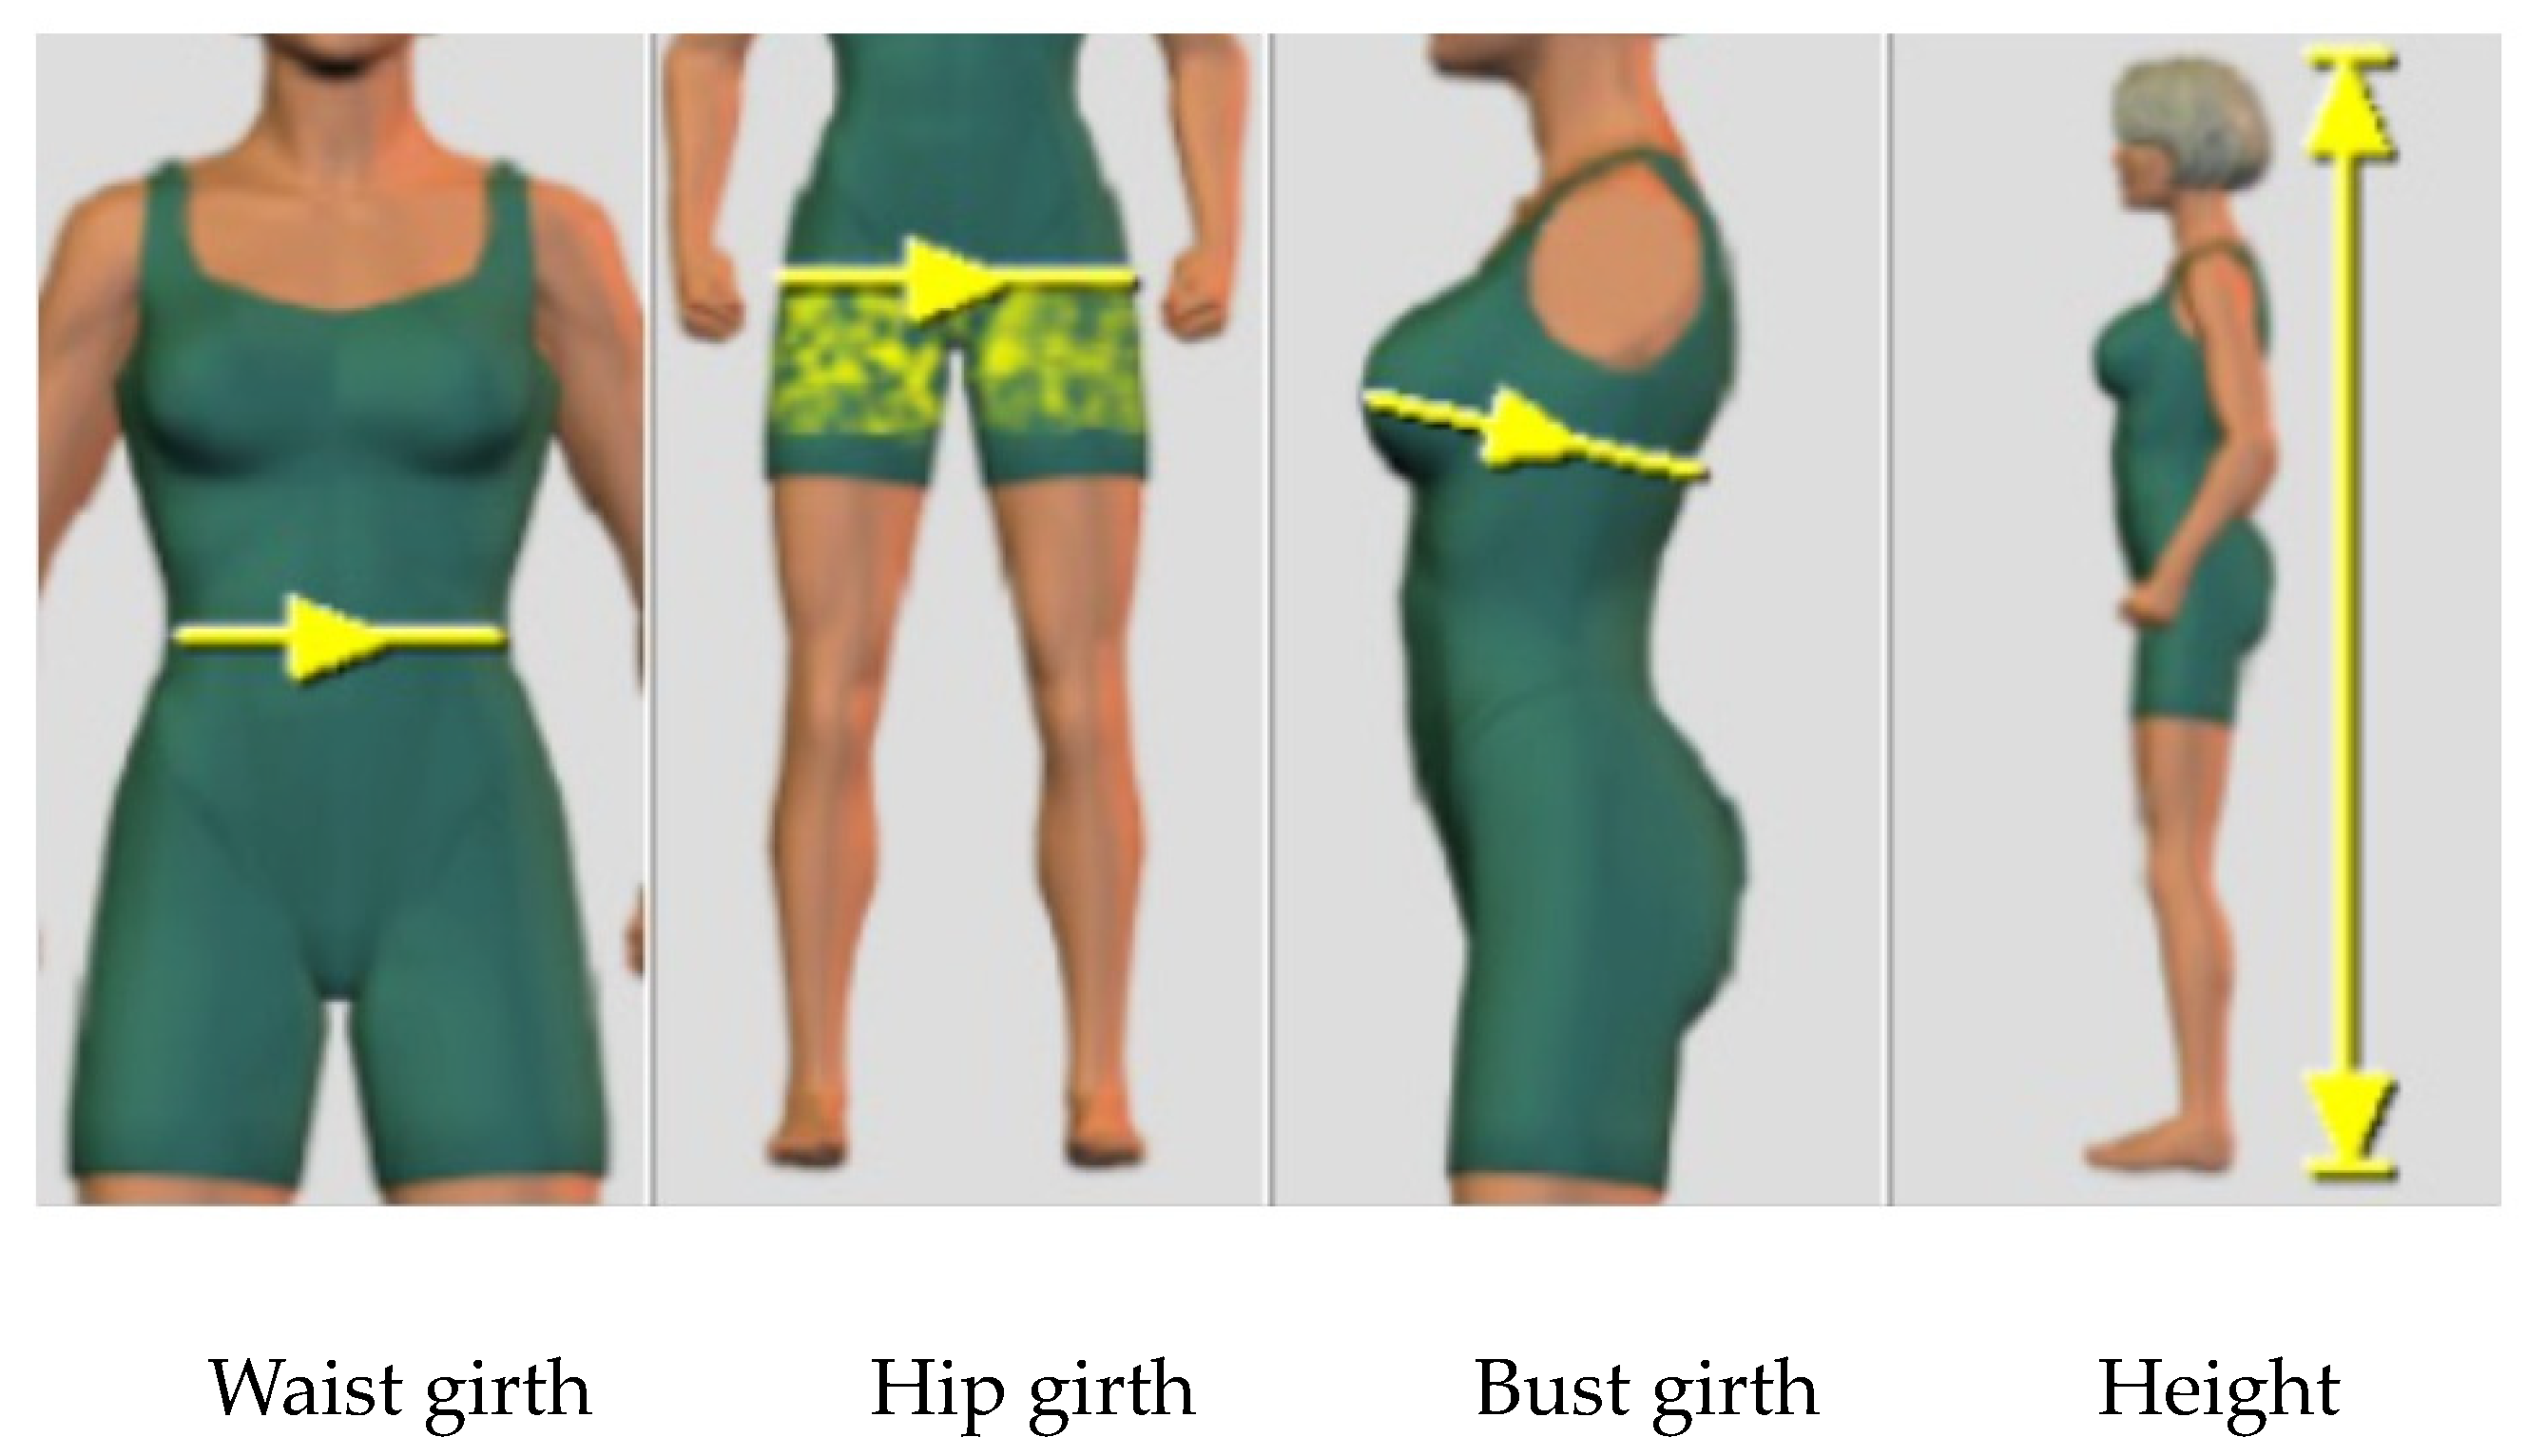
We developed an intelligent prediction system that allows designers or users to measure only four basic body dimensions (waist, hip, bust circumference, and height). With the assistance of the intelligent system, it predicts 28 other body sizes and shape categories. This simplifies the operational complexity for the personnel involved and improves the efficiency of prediction.
  • The other sections of this paper are organized as follows, as illustrated in Figure 1:
  • Section 2 introduces related work. Section 3 describes the methodology.
  • Section 4 analyzes human body size data.
  • Section 5 deduces typical body types based on cluster analysis.
  • Section 6 constructs a body size prediction algorithm combined with linear regression. Following this, we introduce our independently developed intelligent prediction system and the clothing design cases completed using this system.
  • Section 7 is the discussion.
  • Section 8 provides a summary and outlook for this research.
Figure 1. Analysis process of this study.

3. Methods

3.1. 3D Body Measurement

The cohort for this study comprised young women aged 18–25 from Central China. We utilized a 3D body scanner to capture the subjects’ three-dimensional mannequins and body metrics. The data collection spanned from 2019 to 2021, encompassing a total of 220 participants. The scanning sessions were conducted under controlled indoor conditions, with ambient temperatures maintained at 18–25 °C and relative humidity levels of 40%–60%. As depicted in (Figure 2), participants were attired in light-colored undergarments or swimwear and positioned themselves naturally on the platform of the German VITUS SMART LC3 3D scanner. They were instructed to stand with their arms spread and hands clenched into fists, and feet positioned approximately 30 cm apart to facilitate the body scanning process.
Figure 2. Experimental procedure involving 3D body scanning.
In our subsequent analysis, we employed the ScanworX (Version 2.9) software to automatically extract 56 corresponding three-dimensional body size measurements. Thereafter, to obtain more detailed body data, we utilized specialized measurement tools within the ScanworX software to further collect eight width and thickness metrics, such as bust width and bust thickness. Ultimately, these data were organized and recorded in an Excel spreadsheet, resulting in a total of 62 body size measurement points for subsequent analysis.

3.2. Calculation of Minimum Sample Size

To determine the minimum sample size required for our study, we implemented a random sampling strategy targeting female youths between the ages of 18 and 25 within the Hunan region. The sample size was dictated by the variability present within the measurement sites and the maximum permissible error. Under a 95% confidence interval (α = 5%), we utilized the value of 1.96 as the Z-score [32], which corresponds to the critical value of the standard normal distribution at the 95% confidence level. The relative error A is expressed as A = 1.96 σ n μ , leading to the subsequent formula for sample size calculation:
n = 1.96 2 × ( c . v A ) 2
Here, n represents the sample size, c.v stands for the coefficient of variation, σ denotes the standard deviation, n μ is the standard error of the mean, and A signifies the relative error.
Utilizing the control part values from the China national standard GB/T1335.2-2008 [33], we computed the c.v for the measurements pertinent to our experiment. The average waist circumference is 74.512 cm, with a standard deviation of 13.389 cm, resulting in a coefficient of variation of 17.97%, which is much higher than the coefficients of variation for other measurements such as height and bust circumference, suggesting it requires the largest sample size. Hence, the waist circumference’s sample size was adopted as the benchmark for our study. Considering the specifics of our research and setting the relative error A at 3%, we applied the data to the formula,
n = 137.8
The calculated result implies that at least 138 participants are needed to satisfy the sample size criteria. However, to accommodate the unique aspects of our study, we determined the final sample size to be 220 individuals.

3.3. Methods and Processes

  • Step 1:
We used factor analysis to determine the indicators for cluster analysis. Subsequently, we applied the K-means clustering algorithm to categorize the collected data set, identifying specific body types [34] (Figure 3).
Figure 3. Methods and processes.
This is defined by the sum of the squares of the Euclidean distances of each sample point to the center point of its cluster:
J ( c , μ ) = i = 1 M | | x i μ c i | | 2
Here, xi represents the i-th sample, ci is the cluster to which xi belongs, μ c i represents the center point of the cluster, and M is the total number of samples. The specific steps included selecting an appropriate value of K, calculating the sum of squared errors for each, and by comparison, determining the K value that minimizes the sum of squared errors to continue with the cluster analysis.
  • Step 2:
Based on the results of the cluster analysis, we provided a detailed description of the characteristics of each cluster to ensure the typicality and representativeness of the obtained data. On this basis, we selected appropriate clustering indicators and ranges. Subsequently, based on the clustering results, we constructed a regression analysis model. We employed a binary linear regression model to represent the relationship between the independent variables and the dependent variable, using the following mathematical expression:
y = b 0 + b 1 x 1 + b 2 x 2
In this formula, x1 and x2 are the independent variables, b0, b1, and b2 are the model’s constant and regression coefficients, and y is the estimated value of the target control parameter.
  • Step 3:
Based on the clustering range and the prediction model, we developed a prediction system using Unity Version 5.6.1f1.

4. Analysis

4.1. Percentile Analysis

The height of participants in our study varied from 142.6 cm to 179.6 cm, predominantly clustering around 162.4 cm. As depicted in Table 1, the median height was recorded at 161.8 cm, and the average ratio of waist height to overall height was approximately 0.62, suggesting a standard proportionality in body dimensions.
Table 1. Percentiles for body measurements of young women from Hunan (aged 18–25).

4.2. Factor Analysis

Our research employed principal component analysis with Kaiser normalization [35] and the maximum variance method [36]. After seven iterations to convergence, we extracted common factor components, which clustered into six distinct groups. Table 2 displays the refined contents post-analysis. Factor 1, consisting of 17 variables related to human body height and length measures, such as stature, girth height, and hip peak height, coalesces into the height and length factors. This factor group boasts the highest contribution rate of 40.715%, with variable factor loadings all surpassing 0.85. Factor 2 encompasses 16 variables pertaining to body girth and width, including measurements such as bust, belly, and hip girth. Termed as the girth and width factors, this group has a contribution rate of 27.12%, with all the variable factor loadings exceeding 0.5. Factor 3 comprises five variables associated with the shoulder and neck, like neck circumference and shoulder width, which are collectively referred to as the shoulder and neck factor. Its cumulative contribution rate is 14.604%, with variable factor loadings all above 0.5.
Table 2. Factor analysis of body shape.
The visualization of the correlation between variables is illustrated by the dot size and color intensity in Figure 4. A large, dark red dot indicates a strong correlation, as seen with Factor 1′s crotch height and belly circumference height, which are depicted as crimson nodes. In contrast, Factor 3′s low correlation between the width of the left shoulder and the neck’s mid-circumference is represented by a small, light red dot. An examination of the three correlation matrix diagrams reveals that body height and length variables maintain a high correlation (A). The data indicate a robust correlation, generally exceeding 0.8, except for the correlation between left and right arm lengths and some other parts. The interrelation between girth and width factors is weaker, mostly between 0.5–0.8. Yet, specific waist and hip variables such as waist circumference, high waist circumference, waist head circumference, and belly circumference exhibit a strong correlation, above 0.7 (B). The shoulder factor amalgamates the last four common factor groups according to their positions, displaying a lower internal correlation (C).
Figure 4. Factor correlation matrix based on human body size data.

4.3. K-Means Analysis

Based on factor and correlation analyses, we selected prominent and easily measurable variables as the defining characteristics of body shape. Height was chosen to represent the length and height factors. The circumferences of the belly, bust, waist, and hips were selected as representative of the girth and width factors. Shoulder width was identified as the key variable for the shoulder width factor. Incorporating the national standard for body type classification, along with the girth difference method and the height-to-girth ratio classification [14], we established criteria for body type categorization. Key variables, including bust–waist difference, hip–waist difference, and body–bust ratio, were utilized as the definitive characteristics for this classification, as presented in Table 3.
Table 3. Body type classification characteristic index.
From a total sample of 206 young women, we randomly selected the measurement data of 186 participants for K-means clustering, using the three characteristic variables that best represent the primary morphological features of the female form. These indicators, crucial for the accurate identification and classification of various physical traits, enabled us to examine the body type categories and contours of the trunk area of young women in Central China (Table 4).
Table 4. Mean values and ranges of characteristic index variables for each body type.
Comparing our results with the Chinese national standard GB/T1335-2008 for adult women’s body sizes, we observed a significant bust–waist disparity in young women from Central China. Notably, the C body type comprises only 0.538% of the standard, whereas the Y body type, with a bust and waist differential of 19 to 24 cm, is more prevalent, accounting for 41.398% of our sample (Table 5).
Table 5. GB/T1335-2008 classification of adult women’s somatotypes.

5. Cluster Analysis

5.1. Cluster Analysis

In our study, we classified 186 young women from Central China into four distinct body types, based on their body dimensions and three-dimensional models. We utilized a “Hip plot” to graphically represent the breech and lumbar variations, correlating the hip–waist difference and bust–waist difference with the body-to-bust ratio. Figure 5 displays a scatter plot illustrating the relationship between the body-to-bust ratio and the hip–waist difference. In this sample, the body-to-waist ratio ranged from 1.80 to 3.10, indicating that a smaller ratio corresponds to a broader body size. The thoracolumbar difference spanned from 6.40 to 32.0, with a smaller difference denoting a less pronounced curvature from the bust to the waist. Similarly, the hip–waist difference varied between 9.6 and 34.2, echoing the thoraco–waist trend, where a smaller difference implies a less accentuated curve from the waist to the hips. By integrating these findings with the prototypes of the four body type intermediates depicted in Figure 5, we conducted a more nuanced analysis and summary of the specific visual characteristics of each body shape.
Figure 5. Scatterplot based on human classification indicators.

5.2. Cluster Description

As described in this section, we employed cluster analysis and description techniques to explore the typological differences in body morphology. Utilizing a design thinking approach, we ascertained the distinctiveness of these morphological clusters. This not only facilitates a more intuitive understanding of the diverse body shape characteristics for designers and users but also validates the reliability of the clustering factors and the range of categorical dimensions. Consequently, this enhances the efficacy of the clustering analysis outcomes.

5.2.1. Type 1: Rectangular Body Shape

Type 1, illustrated in Figure 6 and represented by a blue square on the scatter plot, constitutes 12.90% of the sample, the smallest proportion among the groups. This body type is characterized by minimal thoracolumbar and hip–lumbar differences, typically positioned in the lower left quadrant of the scatter plot. It exhibits the highest bust-to-hip width ratio across all categories. The mean ratios of height to bust, waist, and hip girth are 0.71, 0.62, and 0.49, respectively, corresponding to 41%, 41%, and 38% of the total sample. Analysis of the three-dimensional models and ratio data (Figure 6) reveals that the curvature from bust to hips in this body shape is not distinctly pronounced, presenting rectangular visual features in both frontal and lateral views. Within this group, there is a variation in waist ratio: a portion exhibits a wider waist relative to height, resulting in a fuller rectangular shape, while another subset demonstrates an average waist ratio, indicative of a standard rectangular body shape.
Figure 6. Types of young female in central China. Type 1—rectangular body Type 2—pear body Type 3—standard inverted trapezoidal body Type 4—thin hourglass body.

5.2.2. Type 2: Pear-Shaped Body

Type 2, depicted in Figure 6 and denoted by a red triangle in the scatter plot, accounts for 24.20% of the sample. This body type shows a small thoracolumbar difference, indicating a subtle bust-to-waist curvature, and the most significant hip–waist difference among the groups, leading to a pronounced waist-to-hip curvature. In the scatter plots of Figure 6, this type is predominantly located in the upper-left for hip–waist difference and to the right in body-to-waist ratio. The average bust width-to-hip width ratio is the lowest among the categories. The proportions of height to bust, waist, and hip ratios are 0.72, 0.62, and 0.48, accounting for 42%, 45%, and 31% of the sample, respectively. An examination of the intermediate three-dimensional models (Figure 6) suggests that this body type features a visually narrow upper and wider lower body, akin to a pear shape. The body-to-waist ratio positions part of this group with a comparatively smaller waist circumference relative to height, representing a standard pear shape. Another subset features a slimmer waist in relation to height, with the flattest side trunk profile among the types, classified as a slim pear shape.

5.2.3. Type 3: Standard Inverted Trapezoid Body

Type 3, depicted in Figure 6 as a green square, constitutes the largest segment of our study, accounting for 33.33% of the total sample. It is distinguished by a substantial thoracolumbar difference, greater than the other body types, indicating a pronounced curvature change from bust to waist. The hip–waist difference lies between that of Types 1 and 2, with a moderate curvature from hip to waist. The bust width-to-hip aspect ratio in this type has the narrowest range, aligning closely with the overall average. The average ratio of bust thickness to hip thickness is slightly above 1, the broadest range among the four categories. The proportions of height to bust, waist, and hip ratios are 0.72, 0.62, and 0.50, respectively, representing 34%, 31%, and 30% of the sample.
When the data are combined with the three-dimensional model, they reveal that the body shape of Type 3, from bust to hip, is akin to an inverted trapezoid in three-dimensional space. This type is centrally located in all three scatterplots, indicating that the body-to-height ratio is moderate within the sample. Further analysis of the bust thickness to hip thickness ratio shows that the bust is thicker than the buttocks in side view morphology. Notably, the ratio of hip height to total height is the largest, at 0.50, making it the highest among the four body types, suggesting a relatively higher hip position. This body type exhibits a more overall and symmetrical visual appearance than the other types, leading to its designation as the “standard inverted trapezoid.”

5.2.4. Type 4: Thin Hourglass Shape Body

Type 4, represented as a blue cross in the scatterplot (Figure 6), comprises 29.57% of the total sample. This body type is characterized by the most pronounced thoracolumbar difference among the four types, indicating a significant curvature change from bust to waist. The hip–waist difference closely resembles that of Type 2, and it is the most substantial among all the types, denoting a marked curvature from waist to hip. In the scatter plot, Type 4 is predominantly located in the upper right quadrant. The bust width-to-hip aspect ratio is exceptionally varied; the mean aligns with the overall average, and the mean bust-to-hip thickness ratio is 1.06, the highest among the categories. The ratios of height to bust, waist, and hips are significant, accounting for 32%, 30%, and 32% of the body type, respectively.
Integrating the analysis with the three-dimensional model (Figure 6) and considering the waist width and thickness ratio, it becomes evident that the body shape of Type 4 undergoes significant changes from bust to hip in three-dimensional space and lateral views, resembling the visual characteristics of a gourd or an hourglass. Notably, the waist height-to-height ratio is as high as 0.63 for 30% of this body type, the highest among all types, indicating an ideal waist-to-body ratio. The body-to-waist ratio is in the middle to upper range within the total sample, suggesting that part of this group has a relatively moderate waist circumference in relation to height. The bust area is the thickest compared to other types, and the upper body’s height-to-thinness index is more standardized, characterizing a standard hourglass shape. Conversely, another subset features a smaller waist relative to height, leading to a flatter upper body and an overall thinner appearance, described as a thinner gourd shape or a thin hourglass type. This justifies the designation of Type 4 as the “thin hourglass” body type.

6. A Data-Driven Cluster Size Intelligence Prediction System

6.1. Development of the Prediction Model

In our research, a novel size prediction framework was developed, integrating body shape categorization with a binomial linear regression model. As depicted in Figure 7, this framework initially selects four pivotal body measurement metrics as input dimensions: height (H), bust girth (B), waist girth (W), and hip girth (G). Their definitions and measurement methodologies are outlined in Table 6.
Figure 7. Measurement of input body dimensions.
Table 6. Definitions and measurement methodologies.
To ascertain body shape types, we employed the following decision formulas:
Diff (B, W) = BW
Diff (G, W) = GW
Q u o t i e n t   ( H ,   W ) = H W  
In these formulas, Diff (B, W) and Diff (G, W) quantify the differences between the bust and waist, and the hip and waist circumferences, respectively. The quotient (H, W) represents the height-to-waist circumference ratio. By comparing these results with the values in Table 4, the body shape type for each participant is determined.
The framework then utilizes binomial linear regression equations to establish relationships between independent variables (body measurements) and dependent variables (predicted sizes). According to the Chinese national standard for clothing sizes, height (H) and bust (B) are identified as the primary, easily measurable dimensions for upper garments. The values of other controlled body parts are treated as functions of these two basic measurements, calculated using the following binomial linear regression equation:
y = b 0 + b 1 H + b 2 B  
Here, H and B represent the measured values of height and bust, respectively, and y is the estimated value of other controlled parts derived from these variables. The constants and regression coefficients b0, b1, and b2 are incorporated into the model. Using IBM SPSS Statistics Version 26 software, the binomial linear regression coefficients for each body type’s control parts were computed, leading to the formulation of respective binomial linear regression equations, as demonstrated in Table 7. Inputting a subject’s height and bust measurements allows for the estimation of other key upper body dimensions.
Table 7. Binomial linear regression equations composed of height and bust.
A similar methodology was applied for predicting lower garment body types, selecting height (H) and waist (W) as input dimensions and utilizing the formula:
y = b 0 + b 1 H + b 2 W
Accordingly, H and W denote the measurements of height and waist. The binomial linear regression equations for lower garments, as shown in Table 8, facilitate the computation of 17 additional key dimensions for lower body garments.
Table 8. Lower body prediction model based on height and waist.
Finally, the model’s accuracy was rigorously tested. A subset of 20 young women’s measurements, remaining from the total sample, was used to validate the regression equations. The results revealed an error margin below 5%, demonstrating the high accuracy and applicability of the binomial linear regression equations as a reliable predictive model for women’s clothing sizes.

6.2. Intelligent Prediction System

We developed an intelligent body size prediction system using Unity, aimed at providing an immersive body measurement experience in a virtual environment based on the four typical body shape types and prediction models for young women. This system integrates the four typical body shapes with corresponding body size prediction models and employs facial blurring technology to ensure privacy protection. After obtaining participant consent, 220 human body models were uploaded to the system’s foundational database.
As illustrated in Figure 8, in the intelligent prediction module, users initially input key body measurements such as height, waist, and bust (Figure 8A). Based on these data inputs, the system applies the prediction model to determine the user’s body type and calculates 28 detailed body dimensions (Figure 8B). To enhance designers’ understanding of visual characteristics of different body types, the system provides typical human templates and three-dimensional body models closest to the prediction results (Figure 8C). This feature aids in designing garments that are more accurately tailored to specific body types (Figure 9).
Figure 8. The intelligent prediction system. (A). Input;(B) Output; (C) Design Application.
Figure 9. The interface of the intelligent prediction system.

6.3. Design Application

To validate the usability of the intelligent prediction system, a design application experiment was conducted. The participant in the experiment had a height of 167 cm, bust of 85 cm, waist of 63 cm, and hips of 90 cm. Through system calculations, we obtained her primary metrics: a bust-to-waist difference of 22 cm, a hip-to-waist difference of 27 cm, and a body-to-waist ratio of 2.65. Based on these, her body type was identified as Type 4, the thin hourglass shape.
Subsequently, using the corresponding binomial linear regression equations, we calculated specific body dimensions for upper and lower garments. The calculated upper body dimensions were output as (141, 120, 104, 55, 30, 63, 10, 38, 27, 23, 10, 22, 16), and the lower body dimensions as (104, 83, 75, 90, 51, 23, 33, 16, 11, 10, 10, 22, 16, 21, 16, 12, 11). The corresponding control parts are referred to in Table 7 and Table 8. With these accurately predicted body shapes and dimensions, we completed virtual pattern-making for a uniform. Finally, the uniform was virtually tried on a model matching the sizes, as shown in the figure, demonstrating a well-fitted and aesthetically pleasing garment post body prediction (Figure 8C).

7. Discussion

(1)
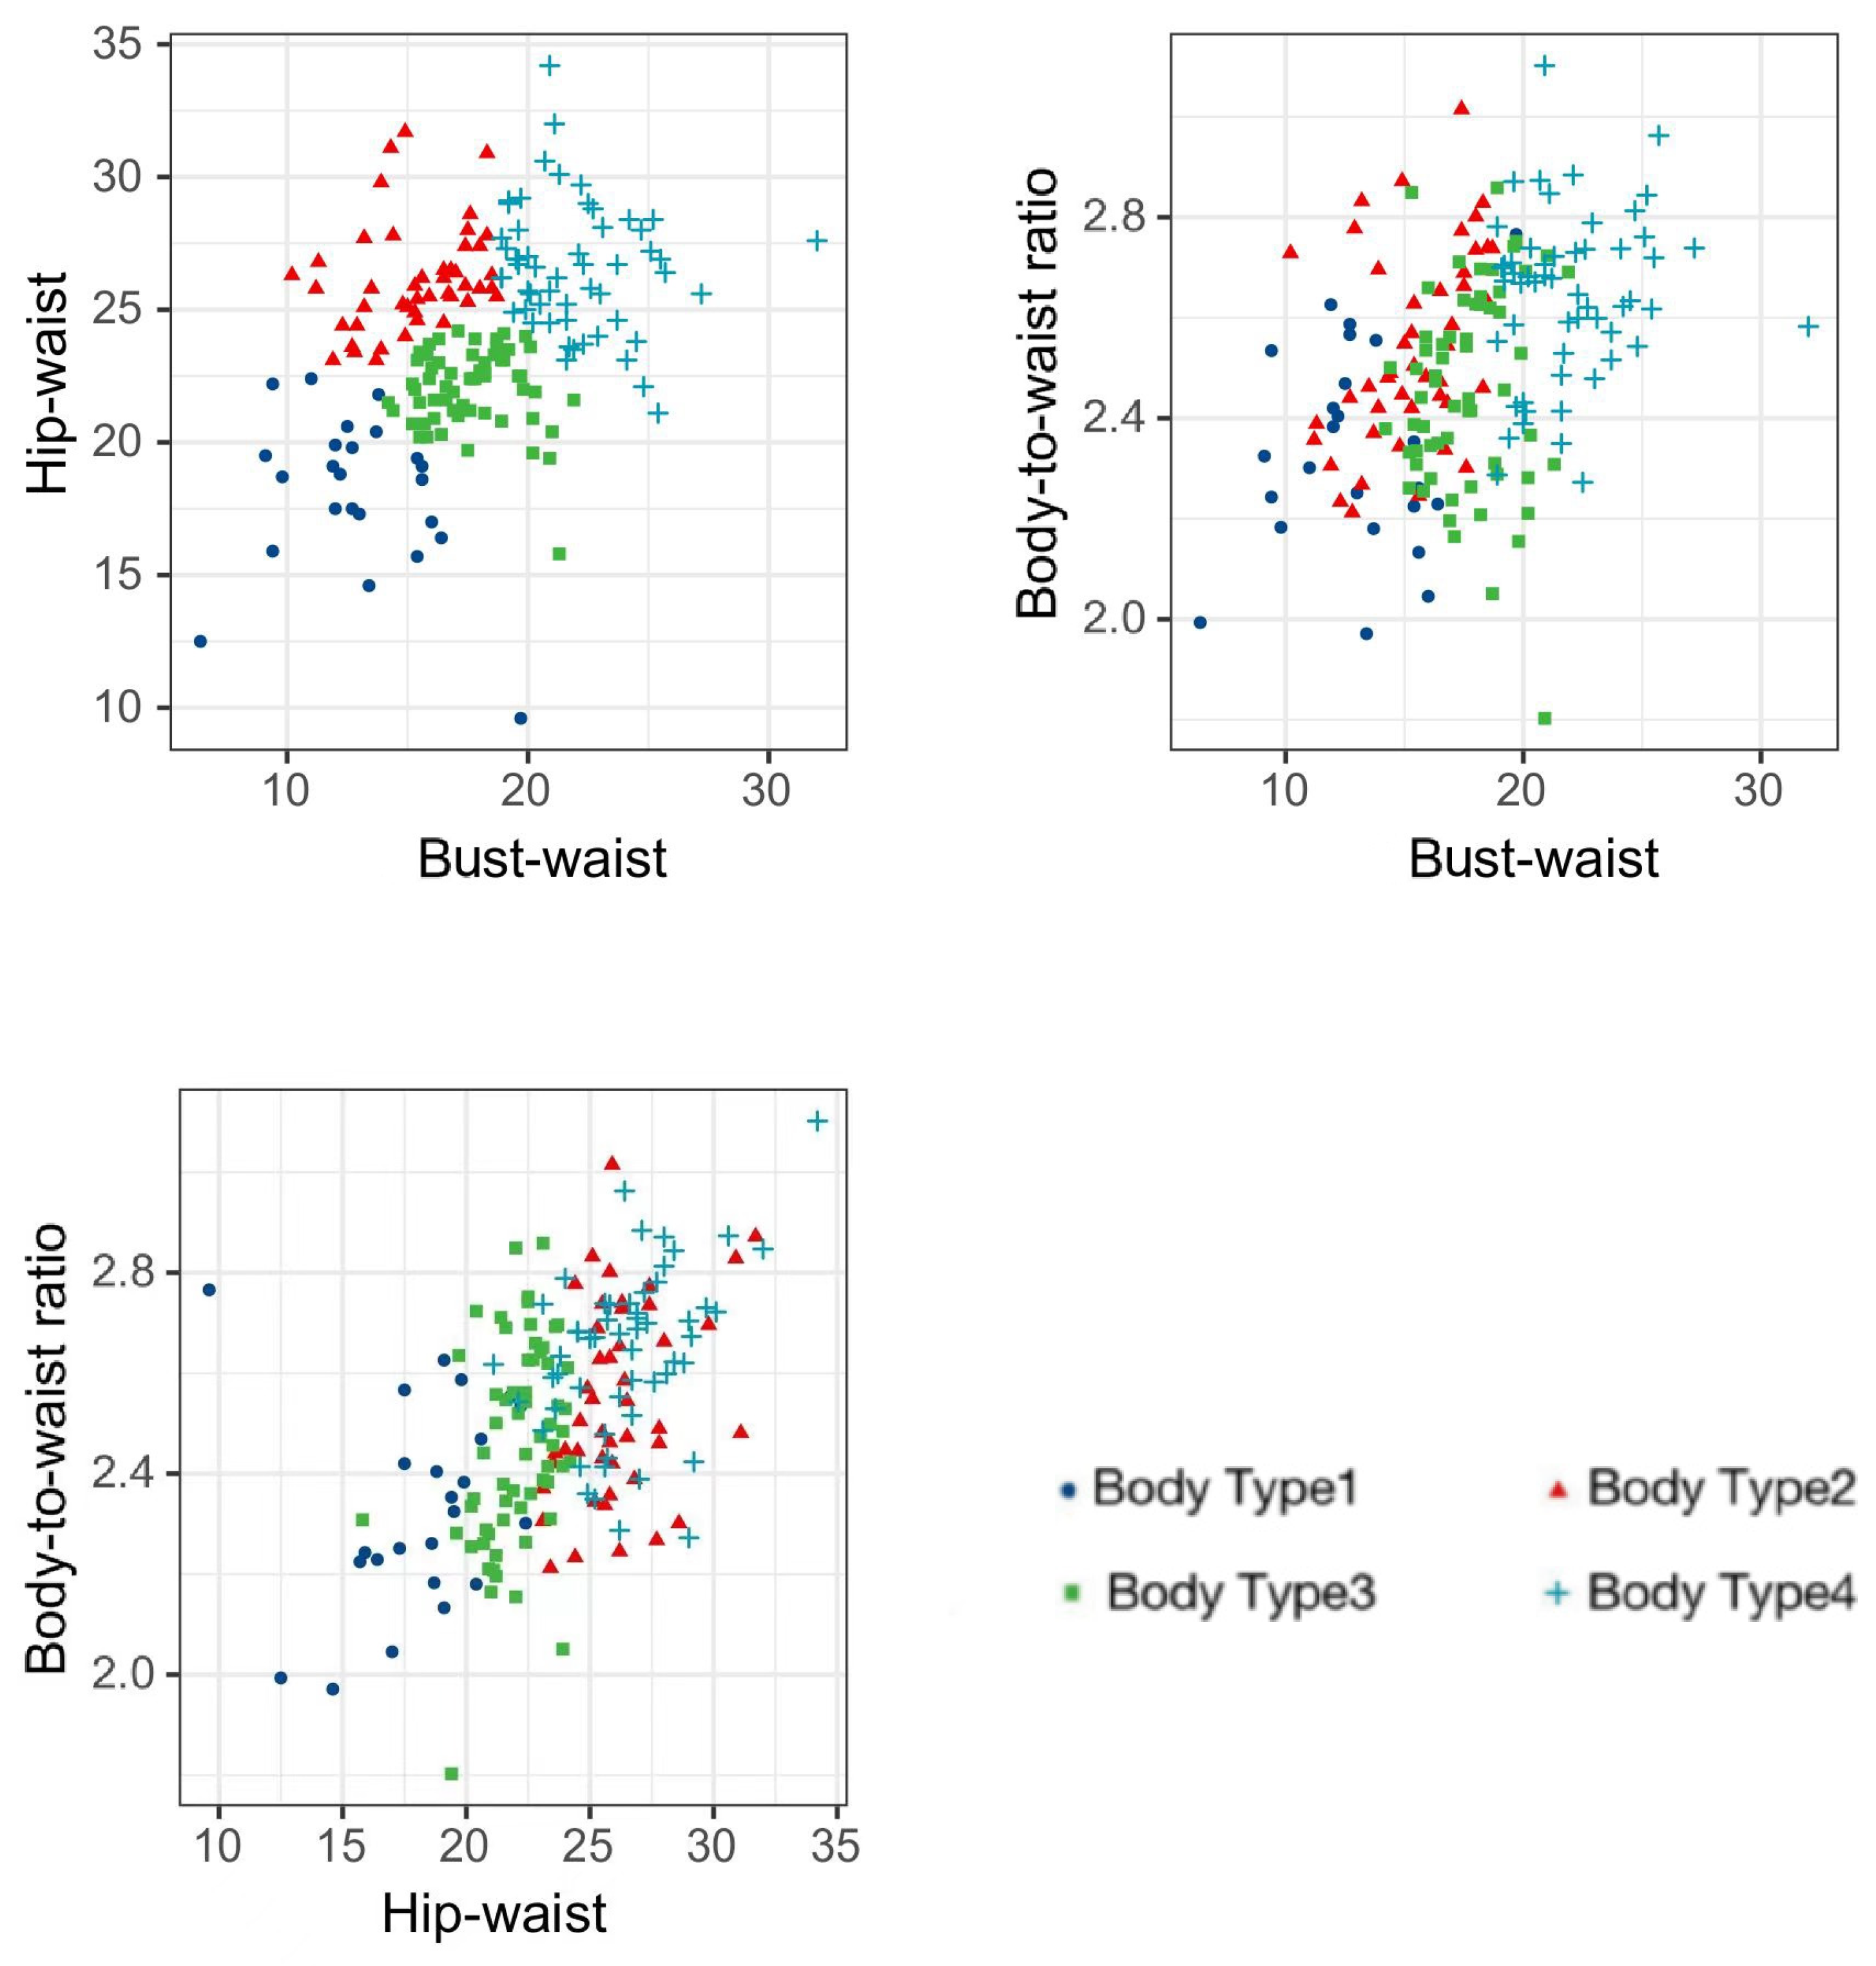
We combined circumference difference classification and trait value classification methods to perform K-means cluster analysis on the 3D human models and 62 key body dimensions of 220 young women from Central China. This led to the identification of four typical body shapes: rectangular, pear-shaped, standard inverted trapezoidal, and thin hourglass. The analysis showed that the pear-shaped body exhibits the thinnest profile in the Bust to waist area from the side, while the thin hourglass shape presents a more pronounced hourglass curve in this region. Additionally, it was found that the thin hourglass shape has a more ideal waist–height ratio. These findings further validate the effectiveness of the chosen clustering indicators and methods.
(2)
By combining body shape classification with size prediction algorithms, we developed a series of size prediction models. These models established specific regression equations for each of the four different body shapes, thereby enhancing the accuracy of the prediction models. In the study, body size data of 20 young women were randomly extracted from the total sample. The validation results showed that the error rate of indicators remained below 5%, proving the effectiveness and accuracy of the model.
(3)
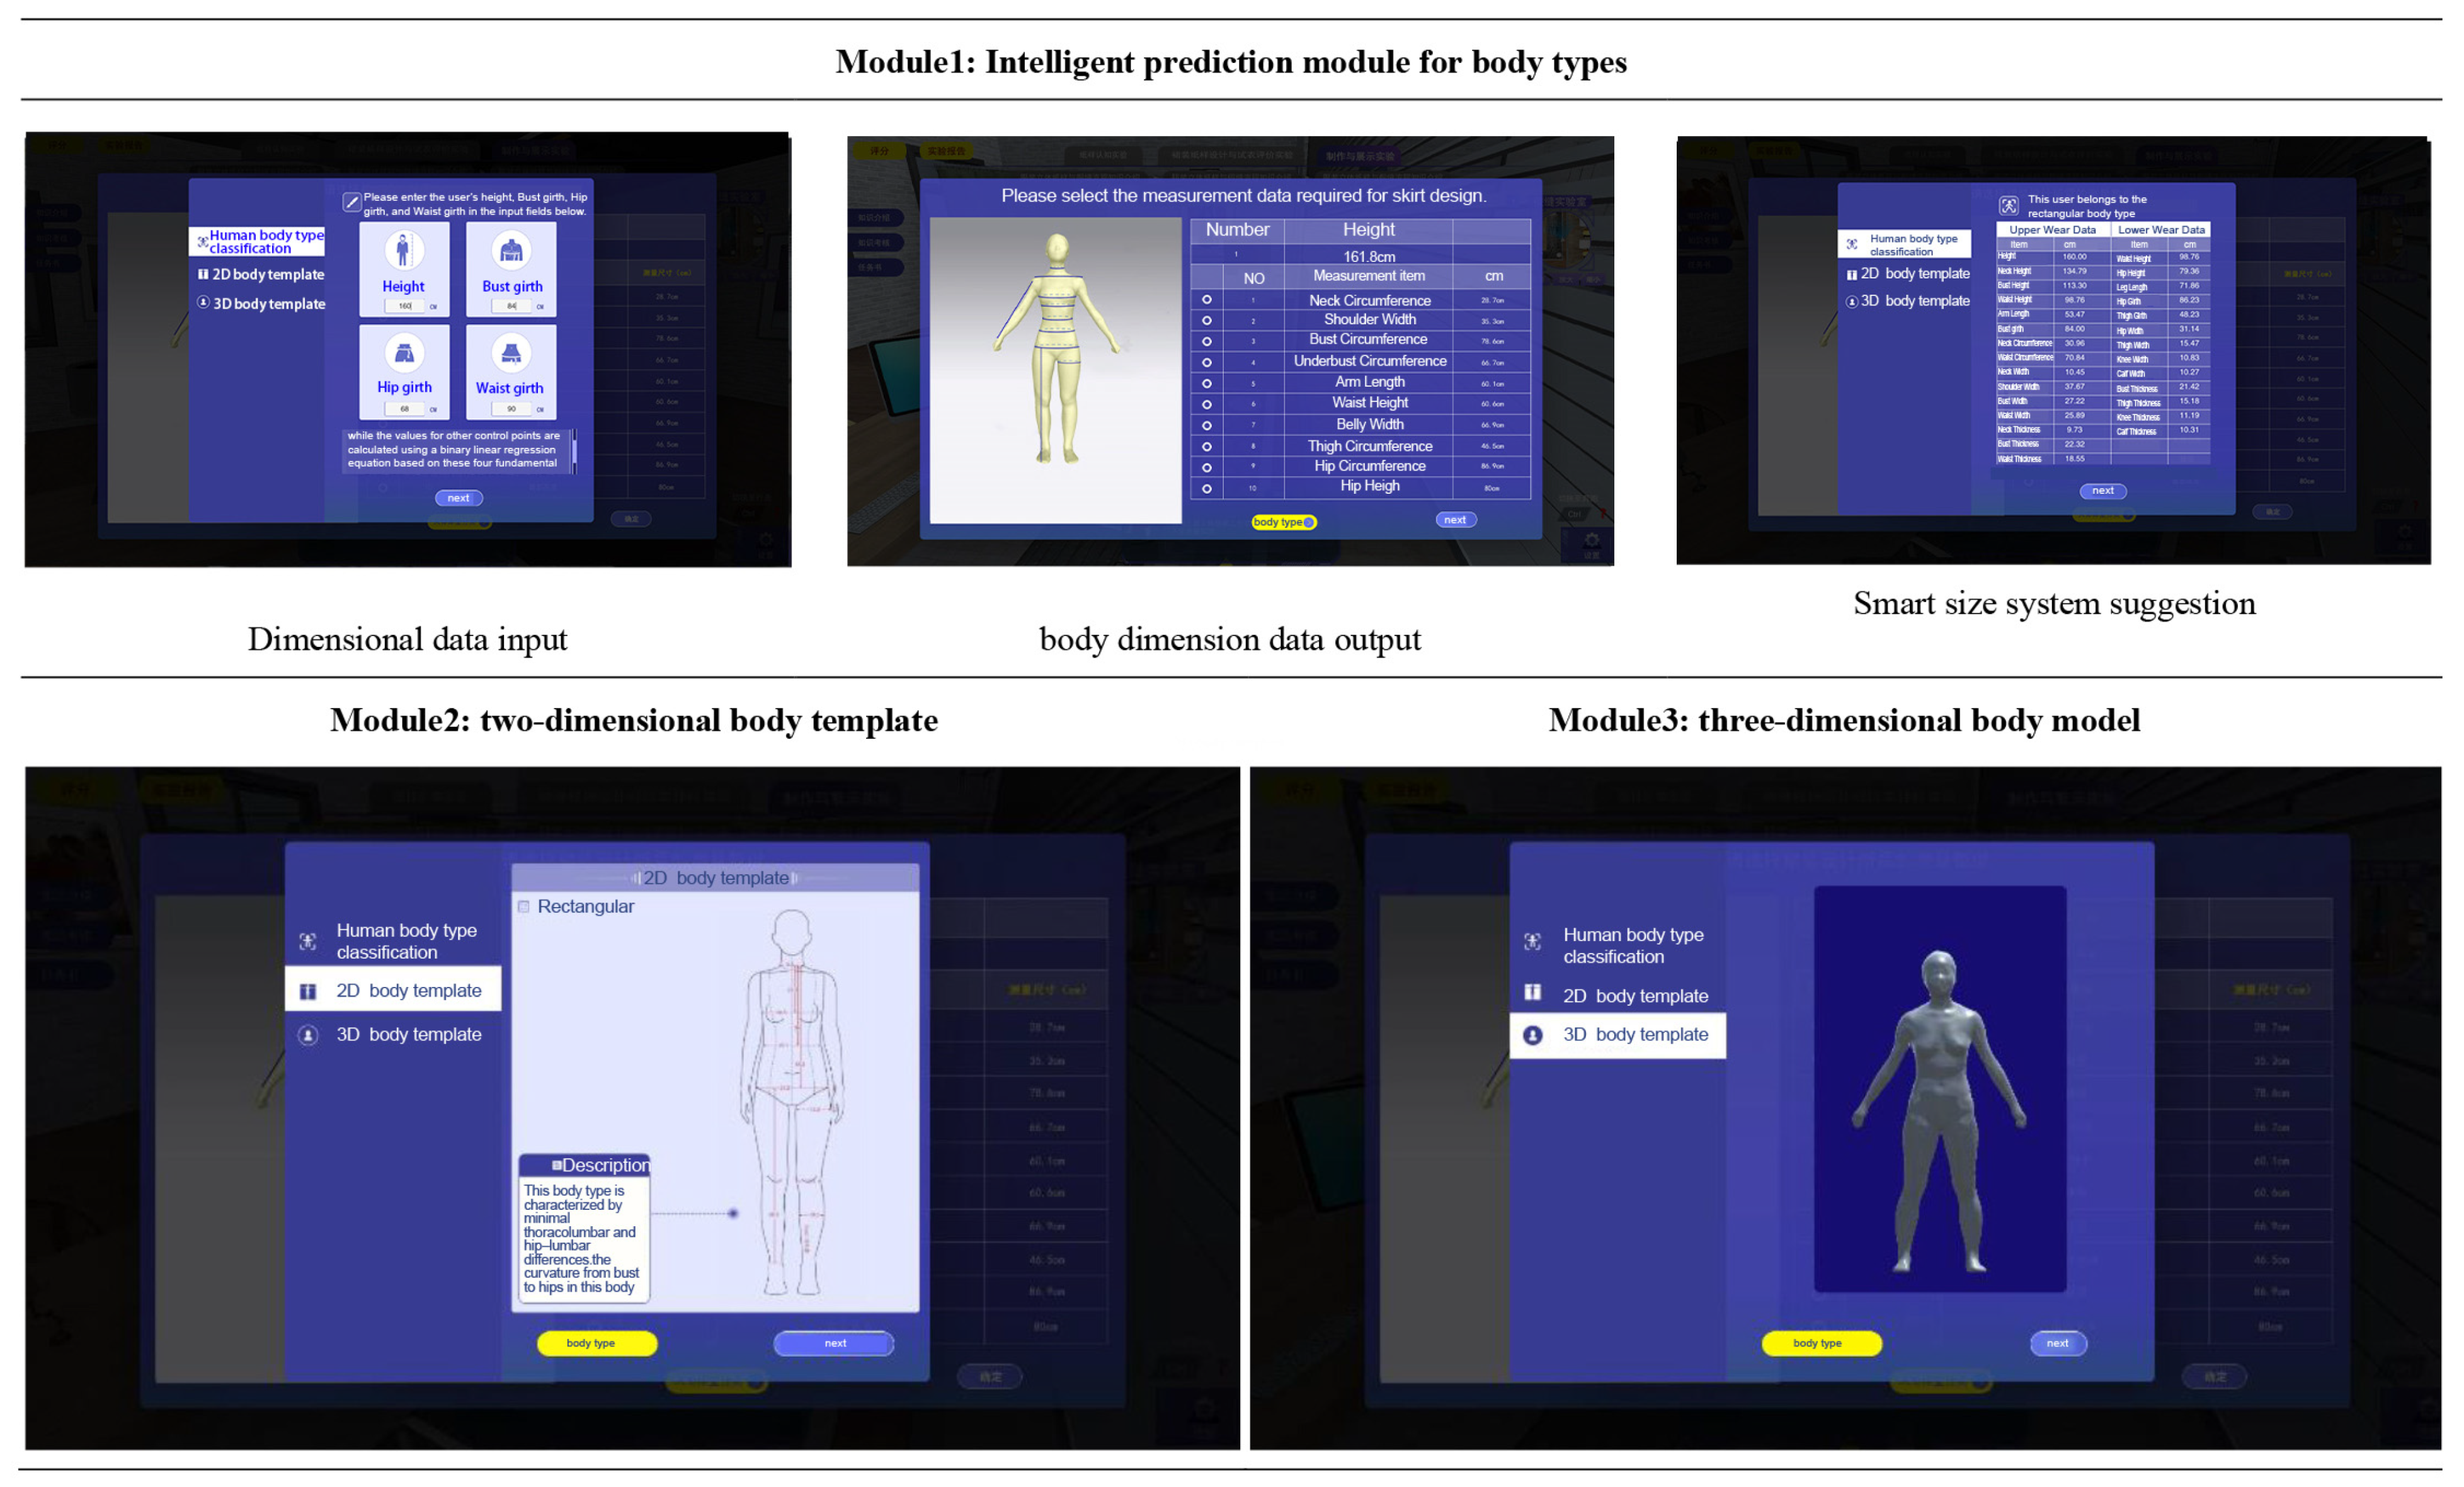
To enhance the practicality and user-friendliness of the method, the research team developed an intelligent body size prediction system. This system simplifies the user input process, requiring users to provide only four key indicators. The system then automatically determines the body type and, based on the determination and prediction model, outputs 28 body size data. This streamlined process reduces the burden on designers and users in size calculation.
(4)
In the validation process for practical application cases, we selected the uniform of the Hunan Provincial Electric Power Company’s business hall in China as the application scenario. This practice demonstrated the significant impact of accurately predicting and determining the body types of different populations in the process of market segmentation on clothing design. With the aid of the system, we applied design thinking to make detailed adjustments to the uniforms for the four body types. One example was enhancing the waistline to optimize the waist proportions for the pear-shaped group, thereby improving the aesthetic appeal of the wearing effect.

8. Conclusions

In this study, we propose a size prediction method based on human body type classification, aimed at enhancing the accuracy of body size prediction in the clothing industry within niche markets. Building on this, we developed an intelligent prediction system where users only need to input four easily measurable body dimensions: height, waist, hip, and bust. This quickly predicts sizes for 28 other key body parts and categorizes body shapes. This system improves the convenience of predicting human body dimensions and the intuitiveness of visual expression.
We employed a dimensional difference classification method and characteristic value classification to determine clustering indices, followed by the use of the K-means clustering algorithm for categorizing body types. Regression models were then used for size prediction. Based on the classification results, we identified four typical body shapes among young female samples from central China: rectangle, pear, standard inverted triangle, and thin hourglass. For each body type, we constructed 28 regression equation prediction models. To enhance the practicality and accessibility of this prediction method, we developed an intelligent body size prediction system based on the four body shapes and corresponding prediction models.
Our prediction model demonstrated an accuracy of up to 95% through the testing of random samples. Additionally, we presented a practical application case for this prediction model in the design of women’s clothing in retail stores. The application research shows that using this prediction system can flexibly meet the needs of specific niche markets, thereby promoting the application of human body size data analysis and prediction technology in the field of clothing design.
Future research will focus on expanding the sample range to cover different ages, regions, and nationalities, to obtain more extensive data on typical body shapes. We will also explore more advanced and intelligent body size prediction models to meet the diversified and networked market demands, further driving the continuous development in the field of clothing design.

Author Contributions

Writing—original draft, Z.T.; Writing—review & editing, S.L. and Z.W. All authors have read and agreed to the published version of the manuscript.

Funding

This research was funded by [Collection and Body Type Analysis of Elderly Women’s Body Data under the Fit Strategy Program] grant number [23CSZ015] And The APC was funded by [College of Engineering and Design, Hunan Normal University].

Data Availability Statement

The data presented in this study are available on request from the corresponding author.

Acknowledgments

The authors would like to express their gratitude to all experts who participated in this study, generously sharing their expertise and contributing to scientific knowledge. We would also like to acknowledge Yan Tian for her vital contributions to data analysis and extend our thanks to Dr. Pan Jiaji, Dr. Zhang Wenquan, and Dr. Zhu Yi for their invaluable guidance throughout the manuscript’s writing process.

Conflicts of Interest

The authors declare no conflict of interest.

References

  1. Cordier, F.; Seo, H.; Magnenat-Thalmann, N. Made-to-measure technologies for an online clothing store. IEEE Comput. Graph. Appl. 2003, 23, 38–48. [Google Scholar] [CrossRef]
  2. Lu, J.M.; Wang, M.J.J. Automated anthropometric data collection using 3D whole body scanners. Expert Syst. Appl. 2008, 35, 407–414. [Google Scholar] [CrossRef]
  3. Makhanya, B.P.; Mabuza, D.C. Body cathexis and fit preferences of young South African women of different body shapes and ethnicity. Int. J. Fash. Des. Technol. Educ. 2020, 13, 173–180. [Google Scholar] [CrossRef]
  4. Wu, G.; Liu, S.; Wu, X.; Ding, X. Research on lower body shape of late pregnant women in Shanghai area of China. Int. J. Ind. Ergon. 2015, 46, 69–75. [Google Scholar] [CrossRef]
  5. Heinz, G.; Peterson, L.J.; Johnson, R.W.; Kerk, C.J. Exploring relationship in body dimensions. J. Stat. Educ. 2003, 11, 1–13. [Google Scholar] [CrossRef]
  6. Xu, B.; Lin, S.; Chen, T. 3D measurement of human body for apparel mass-customization. Videometrics Opt. Methods 3D Shape Meas. 2000, 4309, 26–33. [Google Scholar]
  7. Štěpánek, L.; Dlouhá, J.; Martinková, P. Item Difficulty Prediction Using Item Text Features: Comparison of Predictive Performance across Machine-Learning Algorithms. Mathematics 2023, 11, 4104. [Google Scholar] [CrossRef]
  8. Wang, L.; Lee, T.J.; Bavendiek, J.; Eckstein, L. A data-driven approach towards the full anthropometric measurements prediction via Generalized Regression Neural Networks. Appl. Soft Comput. 2021, 109, 107551. [Google Scholar] [CrossRef]
  9. Galada, A.; Baytar, F. Developing a prediction model for improving bifurcated garment fit for mass customization. Int. J. Cloth. Sci. Technol. 2023, 35, 397–418. [Google Scholar] [CrossRef]
  10. Wang, Z.; Wang, J.; Xing, Y.; Yang, Y.; Liu, K. Estimating human body dimensions using RBF artificial neural networks technology and its application in activewear pattern making. Appl. Sci. 2019, 9, 1140. [Google Scholar] [CrossRef]
  11. Lin, S.; Shen, T.; Guo, W. Evolution and emerging trends of kansei engineering: A visual analysis based on citespace. IEEE Access 2021, 9, 111181–111202. [Google Scholar] [CrossRef]
  12. Id, C.S.; Giacone, L.; Staub, K.; Bender, N.; Siegrist, M. Drawings or 3D models: Do illustration methods matter when assessing perceived body size and body dissatisfaction. PLoS ONE 2021, 16, e0261645. [Google Scholar]
  13. Song, H.K.; Ashdown, S.P. Female Apparel Consumers’ Understanding of Body Size and Shape: Relationship Among Body Measurements, Fit Satisfaction, and Body Cathexis. Cloth. Text. Res. J. 2013, 31, 143–156. [Google Scholar] [CrossRef]
  14. Li, Z.; Su, J.; Wu, Z. Calculating method of characteristics girth of young female body by 3-D scanning data. J. Text. Res. 2017, 38, 110–114. [Google Scholar]
  15. Kolose, S.; Stewart, T.; Hume, P.; Tomkinson, G.R. Prediction of military combat clothing size using decision trees and 3D body scan data. Appl. Ergon. 2021, 95, 103435. [Google Scholar] [CrossRef] [PubMed]
  16. Parker, C.J.; Hayes, S.G.; Brownbridge, K.; Parker, C.J.; Hayes, S.G.; Brownbridge, K. Assessing the female figure identification technique’ s reliability as a body shape classification system. Ergonomics 2021, 68, 1035–1051. [Google Scholar] [CrossRef] [PubMed]
  17. Park, W.; Park, S. Body shape analyses of large persons in South Korea. Ergonomics 2013, 56, 692–706. [Google Scholar] [CrossRef] [PubMed]
  18. Ye, W.; Kuang, H.; Lai, X.; Li, J. A Multi-View Approach for Regional Parking Occupancy Prediction with Attention Mechanisms. Mathematics 2023, 11, 4510. [Google Scholar] [CrossRef]
  19. Chan, A.P.; Fan, J.; Yu, W.M. Prediction of men’s shirt pattern based on 3D body measurements. Int. J. Cloth. Sci. Technol. 2005, 17, 100–108. [Google Scholar] [CrossRef]
  20. Liu, Z.; Li, J.; Chen, G.; Lu, G. Predicting detailed body sizes by feature parameters. Int. J. Cloth. Sci. Technol. 2014, 26, 118–130. [Google Scholar] [CrossRef]
  21. Zanwar, D.R.; Zanwar, H.D.; Shukla, H.M.; Deshpande, A.A. Prediction of Anthropometric Dimensions Using Multiple Linear Regression and Artificial Neural Network Models. J. Inst. Eng. India C 2023, 104, 307–314. [Google Scholar] [CrossRef]
  22. Liu, K.; Zhu, C.; Tao, X.; Bruniaux, P.; Zeng, X. Parametric design of garment pattern based on body dimensions. Int. J. Ind. Ergon. 2019, 72, 212–221. [Google Scholar] [CrossRef]
  23. Meyer, P.; Birregah, B.; Beauseroy, P.; Grall, E.; Lauxerrois, A. Missing body measurements prediction in fashion industry: A comparative approach. Fash. Text. 2023, 10, 37. [Google Scholar] [CrossRef]
  24. Rativa, D.; Fernandes, B.J.T.; Roque, A. Height and Weight Estimation from Anthropometric Measurements Using Machine Learning Regressions. IEEE J. Transl. Eng. Health Med. 2018, 6, 1–9. [Google Scholar] [CrossRef] [PubMed]
  25. Bartol, K.; Bojanić, D.; Petković, T.; Peharec, S.; Pribanić, T. Linear Regression vs. Deep Learning: A Simple Yet Effective Baseline for Human Body Measurement. Sensors 2022, 22, 1885. [Google Scholar] [CrossRef] [PubMed]
  26. Cai, X.G.B.; Zhong, Z. Classification of young women’s waist-abdomen-hip shapesdriven by front and lateral morphological characteristics. J. Silk 2020, 57, 48–53. [Google Scholar]
  27. Anderson-Connell, L.J.; Ulrich, P.V.; Brannon, E.L. A consumer-driven model for mass customization in the apparel market. J. Fash. Mark. Manag. 2002, 6, 240–258. [Google Scholar] [CrossRef]
  28. Shishoo, L.R. International journal of clothing science and technology—Editorial. Int. J. Cloth. Sci. Technol. 2006, 18, 220–224. [Google Scholar]
  29. Wang, J.; Li, X.; Pan, L.; Zhang, C. Parametric 3D modeling of young women’s lower bodies based on shape classification. Int. J. Ind. Ergon. 2021, 84, 103142. [Google Scholar] [CrossRef]
  30. Kolose, S.; Stewart, T.; Hume, P.; Tomkinson, G.R. Cluster size prediction for military clothing using 3D body scan data. Appl. Ergon. 2021, 96, 103487. [Google Scholar] [CrossRef]
  31. Pandarum, R.; Harlock, S.C.; Hunter, L.; Leaf, G.A.V. A normative method for the classification and assessment of women’s 3-D scanned morphotypes. Int. J. Cloth. Sci. Technol. 2021, 33, 421–433. [Google Scholar] [CrossRef]
  32. Tullis, T.; Albert, B. Measuring the User Experience: Collecting, Analyzing, and Presenting Usability Metrics; Machine Press: Beijing, China, 2009; p. 24. [Google Scholar]
  33. GB/T 1335.2-2008; Standard Sizing Systems for Garments-Women. Standardization Administration of China: Beijing, China, 2008.
  34. Deng, M.; Liu, Y.; Chen, L. AI-driven innovation in ethnic clothing design: An intersection of machine learning and cultural heritage. Electron. Res. Arch. 2023, 31, 5793–5814. [Google Scholar] [CrossRef]
  35. Yu, L.; Xin, G.; Gang, W.; Zhang, Q.; Qiong, S.; Guoju, X. Heavy metal contamination and source in arid agricultural soil in central Gansu Province, China. J. Environ. Sci. 2008, 20, 607–612. [Google Scholar]
  36. Veenman, C.J.; Reinders, M.J.T.; Backer, E. A maximum variance cluster algorithm. IEEE Trans. Pattern Anal. Mach. Intell. 2002, 24, 1273–1280. [Google Scholar] [CrossRef]
Disclaimer/Publisher’s Note: The statements, opinions and data contained in all publications are solely those of the individual author(s) and contributor(s) and not of MDPI and/or the editor(s). MDPI and/or the editor(s) disclaim responsibility for any injury to people or property resulting from any ideas, methods, instructions or products referred to in the content.

Article Metrics

Citations

Article Access Statistics

Multiple requests from the same IP address are counted as one view.