Abstract
Inappropriate or unsafe speed is one of the main factors that affects the number of road crashes as well as the severity of the consequences. Research shows that speed is an influential factor in the occurrence of road crashes in more than 30% of road crashes with fatal outcomes and in over 12% of all road crashes. With an increase in speed, the risk of road crashes increases as well as the severity of the consequences. The perception of the vehicle speed in the traffic lane is one of the basic prerequisites for the safe functioning of traffic, that is, for the successful and timely interaction of all road users. Therefore, the challenge of this paper is to examine how the assessment of the speed of a passenger vehicle in different environments affects the prediction of the respondent’s participation in road crashes. Bearing the above in mind, an experimental study was carried out, in real traffic conditions (RTC) as well as in a virtual environment using a driving simulator (DS), at different passenger vehicle speeds (30, 50 and 70 km/h), and at different perspectives of observing the oncoming vehicle (observing the vehicle from the front, from the back, from the side and from the driver’s seat) by the respondents. The respondents had the task of evaluating the passenger vehicle speed, in all tested conditions and at all tested speeds. Standard statistical models and fuzzy logic were used to analyze the obtained results. The results show statistically significant differences for all tested situations and all tested speeds as well as statistically significant differences depending on the gender of the respondents, the driver’s license category, the driver’s experience, frequency of driving and depending on whether respondents wear glasses. Bearing in mind the results of the developed model, by applying fuzzy logic, it can be concluded that the proposed model can be used to assess the propensity of respondents to participate in road crashes, based on perception of vehicle speeds in two tested environments.
MSC:
03B52; 62P30
1. Introduction
Speed is recognized as an important indicator of road safety [1]. Road crashes caused by speeding represent a major road safety problem [2]. Unsafe speed, i.e., inappropriate speed, is one of the main factors that affects the number of road crashes, but also the severity of the consequences of road crashes [3,4,5,6]. Research shows that unsafe or inappropriate speed is an influential factor in the occurrence of road crashes in more than 30% of road crashes with a fatal outcome and in over 12% of all road crashes [7].
It is estimated that around 50% of drivers commit a speeding offense at any time, with a third of road crashes resulting in fatalities occurring as a result of speeding [8]. Research shows that male drivers are more inclined to speeding, i.e., causing dangerous situations. Young drivers (up to two years of driving experience) as well as drivers of commercial vehicles, show a greater tendency to speed [2]. Research shows that as driving experience increases, the likelihood of speeding increases [9].
In the Republic of Serbia, the country where this research was conducted, “reckless action by the driver” is the most dominant group of influencing factors in road crashes with fatalities, while the most common influencing factors in the mentioned group are “speed not adapted to traffic and road conditions” and “driving over the speed limit” [10]. The average speed of passenger vehicles on the roads of the Republic of Serbia, in an inhabited place, during 2021 was 51.4 km/h (85th percentile = 61 km/h), the average speed of freight vehicles was 46.5 km/h (85th percentile = 55 km/h), the average speed of buses was 47.3 km/h (85th percentile = 55 km/h), while the average speed of motorcycles was 57.7 km/h (85th percentile = 70 km/h) [11]. During the attitudes survey of road users, it was observed that respondents consider “aggressive and careless driving” as well as “speeding” as the main factors in the occurrence of road crashes [12]. The survey of drivers’ attitudes about speed indicated the alarming fact that the largest percentage of passenger vehicle drivers (46.7%) do not agree that driving over the speed limit, in an inhabited place, by 20 km/h increases the risk of a road crash. When it comes to motives for speeding, most drivers (32.6%) pointed out that it contributes to their experience of adapting to the driving of other drivers in traffic [13].
Many studies have shown that with an increase in speed, the risk of road crashes also increases. An average increase in average vehicle speed by 1 km/h contributes to an increase in the total number of road crashes by 3%, while when it comes to road crashes with fatalities, the total number of road crashes increases by 5% [14]. Research shows that reducing the average speed by 5 km/h results in a reduction in road crashes with fatalities by 22%, and a reduction in seriously injured by 16% and lightly injured by 10% [15]. Reducing the average speed by 1% contributes to reducing the number of people killed in road crashes by 4% and reducing the number of seriously injured by 3%, while with twice the number of drivers exceeding the speed limit, it leads to an increase in the risk of a road crash by 10% [16].
The perception of the motor vehicle’s speed in traffic is one of the basic prerequisites for the safe functioning of traffic, i.e., for the successful and timely interaction of all road users [17,18]. In order to increase the safety of all road users, it is necessary to implement three measures: observing the oncoming vehicle, spotting the vehicle and correctly estimating the speed of the oncoming vehicle and the time required for the execution maneuver [18,19].
Research suggests that the contrast between the vehicle and the background has an important effect on the visibility of the vehicle (illumination contrast theory) [19]. In the research conducted by Pešić et al. [17], it was determined that respondents more accurately estimate lower speeds (30 km/h and 50 km/h) of passenger vehicles, without daytime running lights on, in contrast to the situation when respondents estimate lower speeds with daytime running lights on. At higher speeds (70 km/h and 90 km/h) of the passenger vehicle, the subjects estimate the speed more accurately with the daytime running lights on, in contrast to the situation when the subjects estimate a higher speed without the daytime running lights on [17]. In research conducted by the authors Ivanišević et al. [18] in which young drivers took part, it was found that the participants underestimated the speed at the analyzed motorcycle speeds of 50, km/h, 70 km/h and 90 km/h, with and without daytime running lights with halogen bulbs as well as when the daytime running lights were on light with LED bulbs, while overestimating the speed of 30 km/h in the situation when the daytime running lights with halogen bulbs are turned off on the motorcycle (M = 30.49; SD = 11.50) and when the daytime running lights with LED bulbs are turned on (M = 36.06; SD = 11.55), and they underestimate the speed of a motorcycle when the daytime running lights with halogen bulbs are on (M = 22.23; SD = 10.85). Bearing in mind the aforementioned research, the authors Ivanišević et al. [18] came to the conclusion that at speeds of 50 km/h, 70 km/h and 90 km/h, observed in all described conditions (with and without daytime running lights with halogen bulbs as well as when daytime running lights with LED bulbs are turned on), the respondents with the smallest error estimate the motorcycle speed when the daytime running lights with LED bulbs are on.
There is a limited number of studies that have dealt with the differences in vehicle speed estimation, taking into account the perspective from which the oncoming vehicle is viewed. Authors Čičević et al. [13] in their research, state that young road users cannot properly estimate the speed of the vehicle in front of them and the oncoming vehicle, which can cause problems when overtaking. The authors came to the conclusion that respondents perceive a speed of 30 km/h mainly as faster, while higher speeds are perceived as slower [13]. Obviously, the process of perceiving vehicle speed is very complex, and the research results have significant implications for the safety of different categories of road users [13].
Fuzzy logic models can be used to predict driver behavior [20,21,22,23,24], but also various aspects of the traffic profession [25,26,27,28,29]. A group of authors [29], in their work, analyzed the influence of the perception of speed and the spatial perception on the occurrence of road crashes and came to the conclusion that the spatial perception by the driver can better explain the tendency of the driver towards the occurrence of road crashes compared to the perception of speed.
Bearing the above in mind, this paper aims to examine the tendency of drivers to participate in road crashes, based on their perception of speed in real and virtual environments. In this study, potential research gaps can be identified, including a consistent stimulus paradigm (such as a single vehicle category, uniform vehicle color, and a specific viewing perspective, etc.), with the analysis limited to three distinct speeds of vehicles. Additionally, there is a limitation in the variety of traffic environments considered for speed assessments, as well as a singular focus on a specific age group (young drivers) of participants.
The paper comprises the “Introduction” section, which delineates the background of the road safety problem, provides a detailed literature review concerning vehicle speed perception, and shows the paper’s objectives. Following this is the “Materials and Methods” section, which meticulously describes the experiment, stimuli, participants, the experimental procedure, and the method of data collection and processing, including the application of fuzzy logic. In the ensuing chapter, detailed results of statistical analyses and fuzzy logic are presented. The subsequent chapter involves a comprehensive discussion and comparison of the obtained results with other studies. The concluding chapter emphasizes the most crucial conclusions drawn from the study, along with guidelines for future research directions. For an easier understanding of the structure of the study, a flow chart diagram is shown in Figure 1.
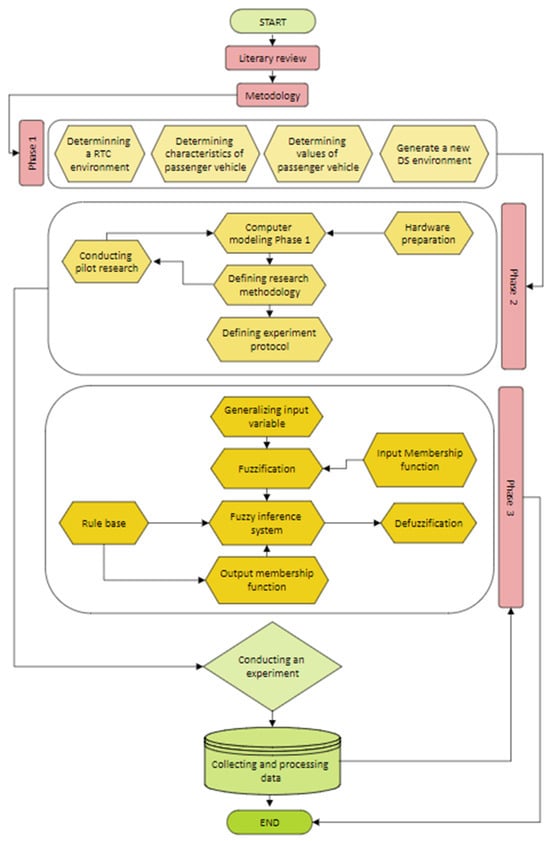
Figure 1.
Overall research methodology flowchart.
2. Materials and Methods
This section is divided into two subsections. The first subsection refers to the description and method of conducting the experiment in order to collect empirical results, while the second subsection refers to the model development for determining the propensity for road crashes using fuzzy logic, and based on the speed perception of the passenger vehicle by the participants in real traffic conditions (RTC) and in a virtual environment (DS).
2.1. Data Collection
In order to collect empirical data for the purposes of this research, an experiment was conducted with the aim of examining differences in the speed perception of an oncoming passenger vehicle, in a situation where the subject observes the vehicle in front in real traffic conditions (RTC) and in a virtual environment using a driving simulator (DS). Respondents task was to estimate the speed of the passenger vehicle in all described conditions, at all tested speeds (30, 50 and 70 km/h). Also, respondents answered questions about demographic characteristics (gender and age), possession of a driver’s license (category and years of possession), frequency of driving, whether respondents wear glasses or not [18,21,22] and participation in road crashes [20].
87 respondents participated in the experiment. One group of respondents consists of young drivers who have a driver’s license, while the second group consists of respondents who are currently attending driver training programs in driving schools. Respondents did not receive any compensation for participation. Also, all ethical measures, rights and discretion of the respondents were respected during the research. Each respondent was tested individually and underwent preliminary trials.
2.1.1. Procedure
For the purposes of this experiment, the participants were presented with six different situations: three different situations of speed estimation in real traffic conditions (RTC environment) and three different situations of speed estimation in a virtual environment using a driving simulator (DS environment).
There was no horizontal or vertical signalization at the testing ground. The environment included common vegetation to avoid influencing participants’ expectations about the motion of the visual targets and to prevent distraction [21]. The same conditions were simulated using a driving simulator. In the research, the participants had the task of estimating the passenger vehicle speed in all described situations, at all tested speeds. The respondents gave their answers orally, while the assistant in the experiment entered the spoken values into the online questionnaire [18,21,22]. The questionnaire also contained questions related to demographic characteristics (gender and age), possession of a driver’s license (category and years of possession), frequency of driving [18,21,22] and data on the respondents’ participation in road crashes [20].
2.1.2. Experimental Protocol
The experiment was conducted during August and September 2022. year. At the beginning of the experiment, each participant received his own combination of experimental stimulus order, which was chosen by using a random number generator. This procedure was carried out in order to neutralize the anchoring effect, by means of counterbalancing. Counterbalancing is accomplished by randomizing the order of presentation of the test stimuli [18,20,21,22].
The respondents estimated the passenger vehicle speed (at tested speeds of 30, 50 and 70 km/h) in real traffic conditions (RTC) and in a virtual environment using a driving simulator (DS), observing the oncoming vehicle from the front.
Each participant had a total of 6 tasks related to the passenger vehicle speed estimation (3 situations in real traffic conditions (RTC) and 3 situations in a virtual environment using a driving simulator (DS). The order of presentation of the situations was different for each participant [21]. The participants were not offered answers, but they estimated the speeds themselves. The estimated speeds were spoken by the subjects after each presented situation, while the assistant in the experiment entered the spoken values into the online questionnaire.
2.1.3. Participants
87 respondents, average age 21.54 (Xmin = 19; Xmax = 25), participated in the research. The share of male respondents in the sample is 50.6%, while the share of female respondents is 49.4%. The highest percentage of respondents, 70.1%, have a driver’s license for a passenger car, while 20.7% of respondents have a driver’s license for a motorcycle, passenger car or truck. More than a third of respondents, 34.5%, have had a driver’s license for more than 5 years, 28.7% of respondents do not have a driver’s license, 18.4% of respondents have a driver’s license for a period of up to 3 years and 18.4% of respondents have a driver’s license for 3 to 5 years. The largest percentage of respondents drive a motor vehicle almost every day (21.8%) as well as between 3 and 5 times a week (21.8%), while 20.7% of respondents participate in traffic less than 3 times a week. In total, 59.8% of respondents indicated that they do not use glasses, while 40.2% of respondents indicated that they use glasses while driving. In total, 82.8% of respondents participated in road crashes, whereby 70.1% of respondents experienced one road crash, 8% of respondents experienced two road crashes, and 4.6% of respondents experienced three road crashes.
Participants were recruited at the Faculty of Traffic and Transport Engineering—University of Belgrade. Potential participants were selected randomly, and they were not obliged to participate in the study. The study adhered to the Code of Ethics and Conduct of the Serbian Psychological Association. The participants did not receive any compensation for participation in the research.
2.1.4. Stimuli
Characteristics of Vehicle
For the purposes of this research, a “Skoda” type “Kamiq” passenger vehicle was used. Its dimensions are 4241 mm in length, 1793 mm in width and 1531 mm in height [21].
Passenger Vehicle Speeds
Three passenger vehicle speeds (30, 50 and 70 km/h) were selected for the research based on the legal regulations of the country where the research was conducted as well as on the basis of available studies that analyzed estimates of passenger vehicle speeds [17].
Characteristics of the Driving Simulator
The driving simulator was used to display the traffic situation in a virtual environment (RTC), and in order to examine the differences in the estimation of the vehicle speed. The driving simulator incorporates three 42″ plasma displays that give the respondents 180° horizontal and 50° vertical fields of view of the simulated environment. Each display has a resolution of 1360 × 768 pixels and a refresh rate of 60 Hz. It has previously been found that for the correct speed perception, a horizontal field of view of at least 120° is needed [22]. The traffic situation, which was defined on the testing ground, was also simulated in a virtual environment by means of a driving simulator. The characteristics of the passenger vehicle in real traffic conditions corresponded to the characteristics of the passenger vehicle in the virtual environment. In addition to the visual information, the respondents were also presented with sound information from the traffic surrounding them. Before starting the test, respondents were instructed about the use of the equipment inside the driving simulation [18].
Collecting and Processing Data
Demographic data of the participants in the experiment were collected through an online questionnaire and then imported into the software package MS Excel 2018 [21]. After importing, the data were examined and validated. Next, the statistical analysis of the obtained data was conducted in the software package IBM SPSS Statistics v.22 [17,18,22]. The normality of distribution was tested by inspection of histograms and the Kolmogorov–Smirnov test. Since the data for all the measured variable distributions were normally distributed, we used parametric methods [17,18,22]. To assess the significance of differences, the Independent Samples t-test, Paired-Samples t-test, One-way ANOVA and Post Hoc (Tukey) test were used [17,18,22].
The null hypothesis (Ho) was: There is no statistically significant difference in the perception of passenger vehicle speeds, for all speed tests and in all tested situations. An alternative hypothesis (Ha) is:
Hypothesis 1 (H1).
There are statistically significant differences in the perception of passenger vehicle speeds, for all tested speeds, in all tested situations;
Hypothesis 2 (H2).
There are statistically significant differences in the perception of passenger vehicle speeds, depending on the gender of the respondents;
Hypothesis 3 (H3).
There are statistically significant differences in the perception of passenger vehicle speeds, depending on the driver’s license category;
Hypothesis 4 (H4).
There are statistically significant differences in the perception of passenger vehicle speeds, depending on the driver’s experience;
Hypothesis 5 (H5).
There are statistically significant differences in the perception of passenger vehicle speeds, depending on the frequency of driving.
The threshold for the statistical significance (a) was set to 5%. Consequently, if probability (p) is smaller or equal to 0.05, H0 is rejected, and Ha is accepted. On the contrary, if p > 0.05, H0 is not rejected. The Bonferroni post hoc test was used for the additional comparison between groups [17,18,22].
2.2. Model Development for Determining Propensity for Road Crashes Using Fuzzy Logic
Because the answers of respondents related to the assessment of speed and space involve a certain level of imprecision and fuzziness, we assumed that the implementation of fuzzy inference systems would be a convenient tool for data processing. Fuzzy logic is widely used for explaining driver behaviour. The previous implementation can be segmented as follows: examination of the interaction between the driver and road infrastructure: examination of the interaction between the driver and in-vehicle systems, testing the psychophysical characteristics of drivers, and determining a driving style. The motivation to use fuzzy logic for modelling the tendency of drivers to participate in road crashes based on speed assessments and spatial abilities of drivers is actually the introduction of a new field of implementation. This new area can be called the perception of road traffic conditions and relations [20].
After collecting the empirical data necessary for this research, a model was developed for determining the tendency to participate in road crashes, using fuzzy logic, based on the speed perception of passenger vehicles by participants in real traffic conditions (RTC) and in a virtual environment (DS).
The input variables of the fuzzy logic system refer to the speed perception of the passenger vehicle in all described conditions (RTC and DS), at all tested speeds (30, 50 and 70 km/h), by each participant in the experiment, while the output variable refers on the number of crashes experienced by the respondent, i.e., determining propensity for road crashes. The minimum, mean, maximum values and standard deviation of each variable on the tested sample of 87 participants are shown in Table 1. Formulas for calculating the mean and standard deviation are as follows:

Table 1.
Descriptive statistics of passenger vehicle speed in RTC and DS environments.
Mean (μ): The mean is calculated by summing up all the values in a dataset and then dividing by the total number of values (Formula (1)):
where:
- μ is the mean,
- N is the total number of data points,
- xi represents each individual data point.
Standard Deviation (σ): The standard deviation is a measure of the amount of variation or dispersion in a set of values. It is calculated as the square root of the variance (Formula (2)):
where:
- σ is the standard deviation,
- N is the total number of data points,
- xi represents each individual data point,
- μ is the mean of the dataset.
When defining the fuzzy sets and the corresponding fuzzy rules, a database was used that consisted of the speed perception by the respondents and the answers to the questions. The software used for the purpose of developing a model for determining the tendency to participate in road crashes using the fuzzy logic system is Matlab R2023b (Figure 2).
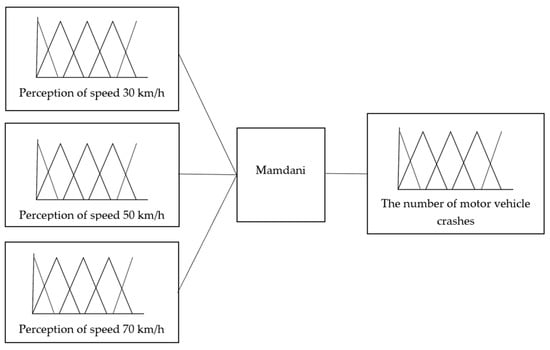
Figure 2.
Fuzzy logic system for determining the tendency to participate in road crashes.
The input variables are represented by five fuzzy sets and their membership functions (Figure 3): VPLSE—very poor (low) speed perception, VLSE—very low-speed perception, GSE—good speed perception, HSE—high-speed perception and VHSE—very high-speed perception.
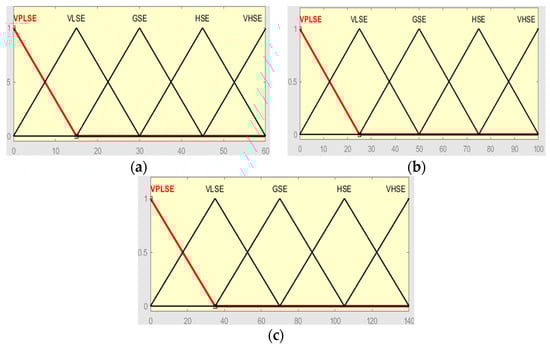
Figure 3.
The input variable for speed perception of the passenger vehicle at speeds of 30 km/h (a), 50 km/h (b) and 70 km/h (c).
The output variable represents the number of crashes experienced by the respondent, i.e., determining the tendency to participate in road crashes. The output variable is displayed using five fuzzy sets and their membership functions (Figure 4): VSNTA—very small number of road crashes, SNTA—small number of road crashes, ANTA—average number of road crashes, LNTA—large number of road crashes and VLNTA—very large number of road crashes. Considering that the sample consists of young drivers, the number of road crashes is relatively small [20], with the possible empirical values of the number of crashes ranging from a minimum value of 0 to a maximum value of 4 (Figure 4).
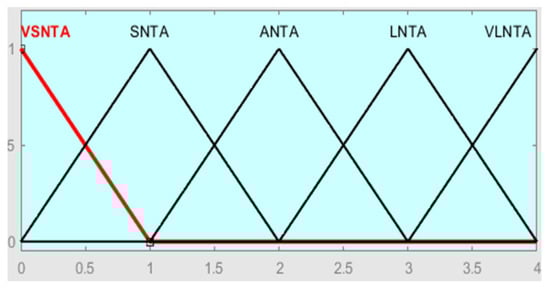
Figure 4.
Output variable for the number of road crashes experienced.
After defining the fuzzy sets and corresponding membership functions, a regular database was generated based on the speed perception of the passenger vehicle by the respondents. When defining the model, an “and” connection was used to define the rules and a value of 1 for the rule weights. In accordance with the proposed model, rules were defined (Figure 5). Based on the created rules, it is possible to obtain the expected number of road crashes in which the participant will participate based on the speed perception of the passenger vehicle in the RTC and DS environment.
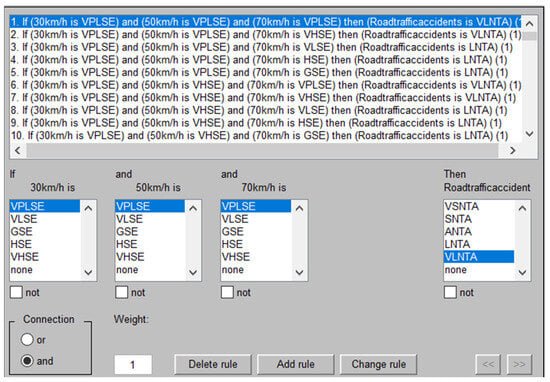
Figure 5.
The rule base of the fuzzy logical system of tendency towards the occurrence of road crashes.
The null hypothesis (Ho) was: There is no statistically significant difference in determining the tendency for road crashes. An alternative hypothesis (Ha) is:
Hypothesis 6 (H6).
There are statistically significant differences between the results related to the determining tendency for road crashes in the RTC environment and the empirical results on the participation of respondents in road crashes;
Hypothesis 7 (H7).
There are statistically significant differences between the results related to the determining tendency for road crashes in the DS environment and the empirical results on the participation of respondents in road crashes;
Hypothesis 8 (H8).
There are statistically significant differences between the results related to the determining tendency for road crashes in the RTC and DS environment.
The threshold for the statistical significance (a) was set to 5%. Consequently, if probability (p) is smaller or equal to 0.05, H0 is rejected, and Ha is accepted. On the contrary, if p > 0.05, H0 is not rejected.
3. Results
In this chapter, the results of the research are presented with the aim of showing potential differences in the estimation of passenger vehicle speed, in situations where the respondents estimate the passenger vehicle speed by looking at the oncoming vehicle in real traffic conditions (RTC) as well as by looking at the oncoming vehicle in a virtual environment (DS), in situations where the examinee estimates the speed of the oncoming vehicle viewed from the front.
3.1. Descriptive Statistics—Estimation of the Passenger Vehicle Speed
Figure 6 shows the descriptive statistics of passenger vehicles’ speed estimation in RTC and DS environments, in situations where the participant observes the oncoming vehicle from the front (Table 2).
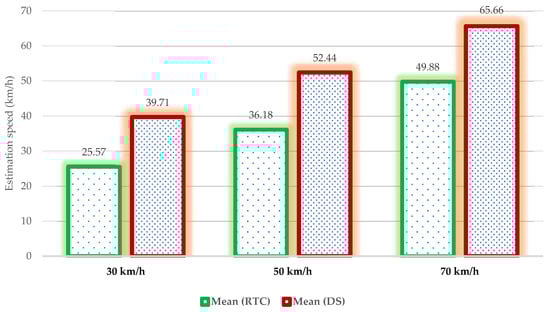
Figure 6.
Descriptive statistics of passenger vehicle speed in RTC and DS environments—mean.
Table 2.
Descriptive statistics of passenger vehicle speed in RTC and DS environments—mean and standard deviation.
The arithmetic mean of the results shows that the respondent’s speed perception of the passenger vehicle with higher values when observing the movement of the vehicle using the DS, compared to the estimation of the speed in the RTC (Figure 7).
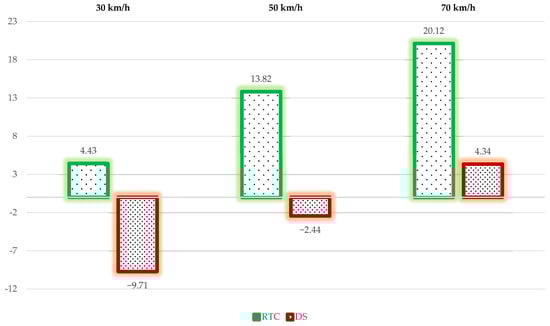
Figure 7.
The mean error of passenger vehicle speed in RTC and DS environments.
Respondents using DS estimated the speed of a passenger vehicle at 50 km/h with the smallest error (M = 52.44; SD = 10.40), while with the highest error, they estimated the speed of 30 km/h (M = 39.71; SD = 8.89) (Figure 6). Respondents with the smallest error estimate the speed of a passenger vehicle at a speed of 30 km/h (M = 25.57; SD = 7.68), while with the largest error, they estimate the speed of 70 km/h (M = 49.88; SD = 9.91), when the vehicle’s movement observed in the RTC (Figure 7).
The results of the One Sample test show a statistically significant difference for all the tested speeds and for all described conditions (RTC and DS). These results are presented in Table 3.
Table 3.
Differences in the passenger vehicle speed estimation at all test speeds.
3.2. The Relationship between Estimation of the Passenger Vehicle Speed
The results of the Paired Sample t-test show a statistically significant difference for all the tested speeds in all tested conditions. These results are presented in Table 4. Eta squares reveal significant differences in the estimation of a passenger vehicle’s speed for all the tested speeds.
Table 4.
Differences in the passenger vehicle speed estimation at all speeds.
3.3. Gender Differences in the Estimation of the Passenger Vehicle Speed
The Independent Samples t-test was used to analyze the speed estimation of the passenger vehicle depending on the gender of the participants. The Independent Samples t-test results show statistically significant differences in men (M = 39.25; SD = 9.72) and women (M = 33.05; SD = 9.74) for speed estimation of a passenger vehicle at a speed of 50 km/h, in a situation where the respondent estimates speed by observing the oncoming vehicle in RTC environments (t = −2.972; p = 0.004). When estimating passenger vehicle speed in DS environments by the respondents, statistically significant differences were observed in men (M = 55.00; SD = 10.00) and women (M = 49.81; SD = 10.26) when estimating a speed of 50 km/h (t = −2.387; p = 0.019).
The vehicle speed of 30 km/h, in DS environments, is estimated by men with a larger error (M = 41.14; SD = 8.36), compared to the speed estimate by women (M = 38.26; SD = 9.28). Women estimate the speed of a passenger vehicle at 50 and 70 km/h with a higher error, compared to men, in RTC (Figure 8).
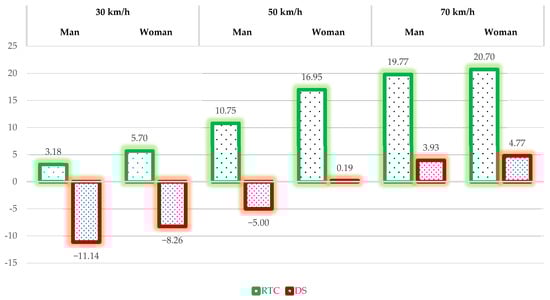
Figure 8.
Mean error of estimation of the passenger vehicle speed, observed by gender.
3.4. Driving License Category and Estimation of the Passenger Vehicle Speed
The results of the one-way ANOVA show a significant statistical difference between drivers with different categories of driver’s licenses in estimating the passenger vehicle speed in a situation where respondents estimate the passenger vehicle speed of 30 km/h, in RTC environments (F = 2.543; p = 0.026).
3.5. The Influence of Driver’s Experience on the Estimation of the Passenger Vehicle Speed
The passenger vehicle speed was estimated by drivers with different driving experience (up to three years, between 3 and 5 years, more than 5 years and participants who do not have a driver’s license).
The results of the one-way ANOVA show a significant statistical difference between drivers with different driving experiences for estimating the passenger vehicle speed at a speed of 30 (F = 5.383; p = 0.002), 50 (F = 7.695; p < 0.001) and 70 (F = 2.909; p = 0.039) km/h in RTC environments as well as when estimating the speed of 30 (F = 5.244; p = 0.002) and 50 (F = 7.140; p < 0.001) km/h in DS environments. Table 5 shows the results of Post Hoc Tests (Tukey) for different driver’s experience on the estimation of the passenger vehicle speed—the influence of driver’s experience.
Table 5.
Results of Post Hoc Tests (Tukey) for different driver’s experience on the estimation of the passenger vehicle speed—The influence of driver’s experience.
3.6. The Influence of the Frequency of Driving and Estimation of the Passenger Vehicle Speed
Frequency of driving (less than 3 times a year, less than 3 times a month, less than 3 times a week, between 3 and 5 times a week, (almost every day, I do not have a driver’s license) and estimation of the passenger vehicle speed was analyzed using a one-factor analysis of variance (one-way ANOVA).
The results show a statistically significant difference between drivers with different frequencies of driving for estimating the passenger vehicle speed at a speed of 30 (F = 4.109; p = 0.002) and 50 (F = 5.394; p < 0.001) km/h in RTC conditions as well as for a speed of 30 (F = 5.019; p < 0.001) and 50 (F = 4.842; p = 0.001) km/h in DS environments. Table 6 shows the results of Post Hoc Tests (Tukey) for different drivers’ experiences on the estimation of the passenger vehicle speed—the influence of the frequency of driving.
Table 6.
Results of Post Hoc Tests (Tukey) for different drivers’ experience on the estimation of the passenger vehicle speed—The influence of the frequency of driving.
3.7. A Model for Determining Propensity for Road Crashes Using Fuzzy Logic
Defined Model Development for determining the tendency for road crashes using fuzzy logic needs to be tested. The deviation between the empirical data on the number of road crashes and the number of road crashes obtained by the application of the defined model is presented using the cumulative deviation (CD) [20].
CD is a cumulative deviation [20]; y(r) is the number of road crashes experienced by the respondent (RTA); y(e) is the result of the number of road crashes of respondents using the model, and based on the assessment of faster vehicle movement.
The CD value for the difference between the empirical results on the number of road crashes experienced by the participants and the results related to determining the tendency for road crashes based on speed estimation in the RTC environment is equal to 45.744, while the CD value for the difference between the empirical results on the number of road crashes experienced by the participants and the results related to determining the tendency for road crashes based on the estimation of speed in the DS environment is equal to 48.123. A comparison of empirical results and results related to determining the tendency for road crashes is shown in Figure 9, Figure 10 and Figure 11.
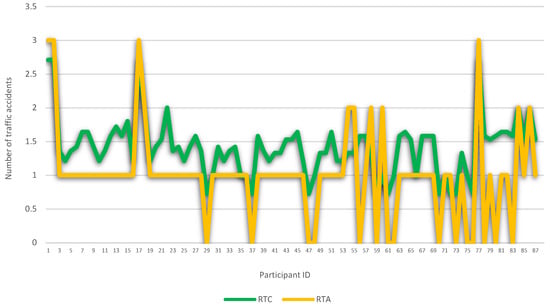
Figure 9.
Comparison of empirical results on the number of road crashes experienced by the participants and results related to determining the tendency for road crashes based on speed estimation in the RTC environment.
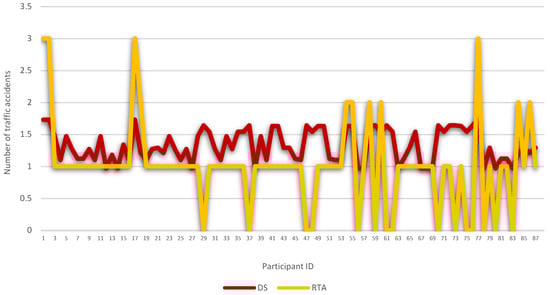
Figure 10.
Comparison of empirical results on the number of road crashes experienced by the participants and results related to determining the tendency for road crashes based on speed estimation in the DS environment.
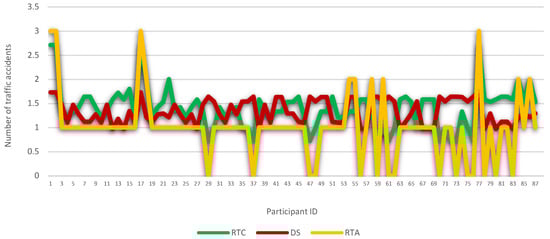
Figure 11.
Comparison of empirical results on the number of road crashes experienced by the participants and results related to determining the tendency for road crashes based on speed estimation in RTC and DS environment.
The relationship between the results of the CD empirical results on the number of road crashes experienced by the participants and the results related to determining the tendency for road crashes based on the estimation of speed in the RTC environment as well as the empirical results on the number of road crashes experienced by the participants and the results related to determining the tendency for road crashes based on the estimation of speed in the DS environment was examined with a paired-samples t-test (Paired-Samples t-test). The results of the t-test of paired samples indicate that there are statistically significant differences (t = 7.643; p < 0.001).
The relationship between the results obtained by the application of the model and the empirical results was examined by the t-test of paired samples (Paired-Samples t-test). The results of the t-test of paired samples indicate that there are no statistically significant differences between the results related to determining the tendency for road crashes in the RTC and DS environment and the empirical results on the participation of respondents in road crashes. Therefore, there are no significant statistical differences between the results related to determining the tendency for road crashes in the RTC environment and the empirical results on the respondents’ participation in road crashes (t = 1.231; p = 1.613) as well as between the results related to determining the tendency for road crashes in the DS environment and empirical results on the respondents’ participation in road crashes (t = 1.183; p = 1.869). The results of the t-test of paired samples indicate that there are statistically significant differences between the results related to determining the tendency for road crashes in the RTC and DS environment (t = 7.643; p < 0.001) (Table 7).
Table 7.
The relationship between the empirical results on the respondents’ participation in road crashes (RTA) and the tendency to participate in road crashes in the RTC and DS environment (paired sample t-test results).
4. Discussion
The World Health Organization states that approximately 1.3 million people die each year as a result of road crashes, with 93% of fatalities occurring in low and middle-income countries [23]. Between 20 and 50 million people are injured in road crashes [23].
Inappropriate or unsafe speed is one of the main factors that affects the number of road crashes as well as the severity of the consequences. [3,4,5,6], where the World Health Organization states that with an increase in average speed, the likelihood of a road crash also increases [23].
Exceeding the speed limit is very common in all road categories [24]. It was determined that 40–50% of drivers drive faster than the defined speed limit [8]. In research conducted by Brake [25] 68% of drivers stated that they exceed the speed limit, while 85% of respondents admitted that they sometimes do not respect the speed limit [24]. Drivers often list exceeding the speed limit as an activity in which they participate [26]. Many studies have pointed to the fact that drivers will drive at the speed dictated by road and traffic conditions, while not paying attention to the defined speed limit [24].
Bearing the above in mind, it can be concluded that vehicle perception and vehicle speed are one of the basic prerequisites for safe traffic functioning. Therefore, the researchers believe that improvements in road safety occur as a result of the perception of the oncoming vehicle, the assessment of the speed and the correct assessment of the time required for the execution of the maneuver by other road users [17,18,19,22,30,31,32].
The number of studies that dealt with vehicle speed estimation is scarce, and it should be noted that in the studies that dealt with speed estimation, the participants conducted the experiments in real traffic conditions or in virtual traffic conditions.
The authors of this research, and bearing in mind the limited number of studies, decided to analyze the vehicle speed estimation by the respondents in real traffic conditions (RTC) and in virtual conditions using a driving simulator (DS), at a passenger vehicle speed of 30, 50 and 70 km/h, and which constitutes the first part of the research, all with the aim of collecting empirical results. In this paper, the authors have developed a model for determining the tendency for road crashes using fuzzy logic, based on the speed perception of the passenger vehicle by participants in real traffic conditions (RTC) and in a virtual environment (DS).
By analyzing the obtained results, it can be concluded that alternative hypotheses H1, H2, H3, H4, H5 and H8 are accepted, while alternative hypotheses were H6 and H7 rejected.
The conducted experiment and the results presented in the paper indicated that there are statistically significant differences in the passenger vehicle speed estimation by the respondents, for all conditions and all tested speeds.
Participants with the largest error estimate the speed of 30 km/h (M = 39.71; SD = 8.89), while with the smallest error, they estimate the passenger vehicle speed of 50 km/h (M = 52.44; SD = 10.40), using DS. When it comes to speed estimation in RTC, the participants with the smallest error estimate the passenger vehicle speed at a speed of 30 km/h (M = 25.57; SD = 7.68), while with the largest error, they estimate the speed of 70 km/h (M = 49.88; SD = 9.91).
The results of the application of the developed model indicate that there are no significant statistical differences between the results related to determining the tendency for road crashes in the RTC environment and the empirical results on the respondents’ participation in road crashes (t = 1.231; p = 1.613) as well as between the results which refer to determining the tendency for road crashes in the DS environment and empirical results on the participation of respondents in road crashes (t = 1.183; p = 1.869), where the results indicate that there are statistically significant differences between the results related to determining the tendency for road crashes in RTC and DS environment (t = 7.643; p < 0.001). Bearing the above results in mind, it can be concluded that the proposed model can be used to assess the respondents’ tendency to participate in road crashes. The above results show another application of fuzzy logic, in addition to its already proven useful application in many areas [33,34,35,36,37,38], ordered recently.
5. Conclusions
Based on the data collected and analyzed in the conducted research, conclusions can be drawn:
- Participants with higher values estimate the speed of the vehicle when observing the vehicle using DS, compared to the speed estimate in the RTC environment;
- Participants using DS with the smallest error estimate the passenger vehicle speed of 50 km/h (M = 52.44; SD = 10.40), while with the largest error, they estimate the speed of 30 km/h (M = 39.71; SD = 8.89);
- Participants with the smallest error estimate the passenger vehicle speed at a speed of 30 km/h (M = 25.57; SD = 7.68), while with the largest error, they estimate the speed of 70 km/h (M = 49.88; SD = 9.91), when the vehicles are observed in the RTC;
- The results of the Paired Sample t-test show a statistically significant difference for all the tested speeds in all tested conditions;
- The vehicle speed of 30 km/h, in DS environments, is estimated by men with a larger error (M = 41.14; SD = 8.36), while women estimate the passenger vehicle speed at 50 and 70 km/h with a larger error;
- There are statistically significant differences in men (M = 39.25; SD = 9.72) and women (M = 33.05; SD = 9.74) for estimating the passenger vehicle speed of 50 km/h, in a situation where the participant estimates the speed by observing the oncoming vehicle in RTC environments (t = −2.972; p = 0.004). When estimating the passenger vehicle speed in DS environments by the participants, statistically significant differences were observed in men (M = 55.00; SD = 10.00) and women (M = 49.81; SD = 10.26) when estimating a speed of 50 km/h (t = −2.387; p = 0.019);
- The results show a significant statistical difference between drivers with different categories of driver’s license in estimating the passenger vehicle speed in a situation where respondents estimate the passenger vehicle speed of 30 km/h, in RTC environments (F = 2.543; p = 0.026);
- There are statistically significant differences between drivers with different driving experience for estimating the passenger vehicle speed at speeds of 30 (F = 5.383; p = 0.002), 50 (F = 7.695; p < 0.001) and 70 (F = 2.909; p = 0.039) km/h in RTC environments as well as when estimating the speed of 30 (F = 5.244; p = 0.002) and 50 (F = 7.140; p < 0.001) km/h in DS environments;
- There are statistically significant differences between drivers with different frequencies of driving for estimating the passenger vehicle speed at a speed of 30 (F = 4.109; p = 0.002) and 50 (F = 5.394; p < 0.001) km/h in RTC conditions as well as for the speed of 30 (F = 5.019; p < 0.001) and 50 (F = 4.842; p = 0.001) km/h in DS environments;
- There are no significant statistical differences between the results related to determining the tendency for road crashes in the RTC environment and the empirical results on the respondents’ participation in road crashes (t = 1.231; p = 1.613);
- There are no statistically significant differences between the results related to determining the tendency for road crashes in the DS environment and the empirical results on the participation of respondents in road crashes (t = 1.183; p = 1.869);
- There are statistically significant differences between the results related to determining the tendency for road crashes in RTC and DS environments (t = 7.643; p < 0.001).
The obtained results indicate significant differences in the estimation of vehicle speed in the driving simulator and the real environment. Subjects in the real environment, for higher speeds, more accurately estimated the vehicle speed in the driving simulator. This result warns of caution when educating young drivers through driving simulators. Also, it is a worrying fact that in real situations, the error increases by increasing the set speed of the vehicle, which should be paid special attention to when educating young drivers. Differences were observed in speed estimates depending on the gender of the subjects, driver’s license category, driving experience, and driving frequency. The above results should be used for practical purposes, primarily for driving education in driving schools. A proposal for the practical application of these results includes improving the design of driving simulations with a focus on situations that cause greater uncertainty, adjusting driver training according to gender, experience, and frequency of driving, and adjusting the training area according to driver’s license categories. This could contribute to improving the accuracy of vehicle speed estimation and increasing road safety.
Future research directions should involve an increase in the number of participants, encompassing a broader range of age groups, and obtaining more comprehensive demographic and psychophysical information about the participants. Additionally, there is a need to explore and assess various speeds and categories of vehicles as well as diverse traffic environments, such as roads with varying numbers of lanes in each direction (roads with one, two, three and more traffic lanes per direction, etc.). It is also necessary to include considerations of different vehicle colours and speeds, taking into account varying weather conditions and times of day, along with multiple perspectives for the perception of vehicle speed. On the analytical front, future investigations could incorporate the application of diverse fuzzy logic models, Artificial Neural Networks and the utilization of advanced statistical tools and analyses. The study’s limitations include the need for further validation of the fuzzy logic model.
Author Contributions
Conceptualization, N.M. and A.T.; methodology, T.I.; software, S.Č.; validation, N.M., T.I. and A.T.; formal analysis, S.Č.; investigation, T.I.; resources, N.M.; data curation, A.T.; writing—original draft preparation, T.I.; writing—review and editing, N.M., T.I. and A.T; visualization, N.M.; supervision, S.Č. All authors have read and agreed to the published version of the manuscript.
Funding
This research received no external funding.
Data Availability Statement
Data sharing not applicable.
Conflicts of Interest
The authors declare no conflict of interest.
References
- Van den Berghe, W.; Silverans, P.; Boudry, E.; Aarts, L.; Bijleveld, F.; Folla, K.; Yannis, G.A. Common Methodology for the Collection of Key Performance Indicators for Road Safety in the EU. In Proceedings of the 8th Technical Committee on Road Safety, Online, 6 October 2021. [Google Scholar]
- Global Road Safety Partnership. Drinking and Driving: A Road Safety Manual for Decision-Makers and Practitioners; World Health Organization: Geneva, Switzerland, 2004. [Google Scholar]
- Wu, Z.; Sharma, A.; Mannering, F.L.; Wang, S. Safety impacts of signal-warning flashers and speed control at high-speed signalized intersections. Accid. Anal. Prev. 2013, 54, 90–98. [Google Scholar] [CrossRef] [PubMed]
- Elvik, R. A before–after study of the effects on safety of environmental speed limits in the city of Oslo, Norway. Saf. Sci. 2013, 55, 10–16. [Google Scholar] [CrossRef]
- De Pauw, E.; Daniels, S.; Thierie, M.; Brijs, T. Safety effects of reducing the speed limit from 90 km/h to 70 km/h. Accid. Anal. Prev. 2013, 62, 426–431. [Google Scholar] [CrossRef] [PubMed]
- Soole, D.W.; Watson, B.C.; Fleiter, J.J. Effects of average speed enforcement on speed compliance and crashes: A review of the literature. Accid. Anal. Prev. 2013, 54, 46–56. [Google Scholar] [CrossRef]
- Hakkert, A.S.; Gitelman, V.; Vis, M.A. Road Safety Performance Indicators: Theory; European Commission: Brussels, Belgium, 2007. [Google Scholar]
- OECD/ECMT. Speed Management; Organization for Economic Co-operation and Development OECD/European Conference of Ministers of Transport ECMT: Paris, France, 2006. [Google Scholar]
- Zhang, G.; Yau, K.K.W.; Gong, X. Traffic violations in Guangdong Province of China: Speeding and drunk driving. Accid. Anal. Prev. 2014, 64, 30–40. [Google Scholar] [CrossRef] [PubMed]
- Road Safety Agency. Statistical Reports on the State of Traffic Safety in the Republic of Serbia in 2021. 2022, Belgrade. Available online: https://www.abs.gov.rs/admin/upload/documents/20220915105252-statisticki_konacno_2021.pdf (accessed on 15 May 2023).
- Road Safety Agency. Values of Traffic Safety Indicators Regarding the Use of Seat Belts, Child Protection Systems, Protective Helmets and Speeding (in the Period 2013–2021). 2022, Belgrade. Available online: https://www.abs.gov.rs/admin/upload/documents/20220324204026-master_tabela_ibs_2021.pdf (accessed on 15 May 2023).
- Road Safety Agency. Attitudes of Traffic Participants about Dangers and Risks in Traffic in Serbia in 2017. 2017, Belgrade. Available online: https://www.abs.gov.rs/admin/upload/documents/20180514140701-brosura_stavovi_2017.pdf (accessed on 15 May 2023).
- Fernandez Llorca, D.; Hernandez Martinez, A.; Garcia Daza, I. Vision-based vehicle speed estimation: A survey. IET Intell. Transp. Syst. 2021, 15, 987–1005. [Google Scholar] [CrossRef]
- Finch, D.; Kompfner, P.; Lockwood, C.; Maycock, G. Speed, Speed Limits and Accidents; Transport Research Laboratory: Wokingham, UK, 1994. [Google Scholar]
- ETSC. Towards Safe and Sustainable Road Transport; European Transport Safety Council: Brussels, Belgium, 1994. [Google Scholar]
- Taylor, M.C.; Lynam, D.A.; Baruya, A. The Effects of Drivers’ Speed on the Frequency of Road Accidents; Transport Research Laboratory: Wokingham, UK, 2000; p. 421. [Google Scholar]
- McCartt, A.T.; Hu, W. Effects of vehicle power on passenger vehicle speeds. Traffic Inj. Prev. 2017, 18, 500–507. [Google Scholar] [CrossRef] [PubMed]
- Ivanišević, T.; Ivković, I.; Čičević, S.; Trifunović, A.; Pešić, D.; Vukšić, V.; Simović, S. The impact of daytime running (LED) lights on motorcycles speed estimation: A driving simulator study. Transp. Res. F Traffic Psychol. 2022, 90, 47–57. [Google Scholar] [CrossRef]
- Lee, Y.M.; Sheppard, E. The effect of lighting conditions and use of headlights on drivers’ perception and appraisal of approaching vehicles at junctions. Ergonomics 2018, 61, 444–455. [Google Scholar] [CrossRef]
- Mazandarani, M.; Xiu, L. Interval type-2 fractional fuzzy inference systems: Towards an evolution in fuzzy inference systems. Expert Syst. Appl. 2022, 189, 115947. [Google Scholar] [CrossRef]
- Trifunović, A.; Ivanišević, T.; Čičević, S.; Simović, S.; Vukšić, V.; Slović, Ž. Do Statistics Show Differences between Distance Estimations of RTC Objects in the Traffic Environment Using Glances, Side View Mirrors, and Camera Display? Mathematics 2023, 11, 1258. [Google Scholar] [CrossRef]
- Simović, S.; Ivanišević, T.; Trifunović, A.; Čičević, S.; Taranović, D. What affects the e-bicycle speed perception in the era of eco-sustainable mobility: A driving simulator study. Sustainability 2021, 13, 5252. [Google Scholar] [CrossRef]
- World Health Organization. Available online: https://www.who.int/news-room/fact-sheets/detail/road-traffic-injuries (accessed on 12 May 2023).
- Tubić, V.; Glavić, D.; Stepanović, N.; Milenković, M.; Vidas, M. Analysis of operating and exceeded speeds on state roads in municipality of Kraljevo. In Proceedings of the 13th International Conference Road Safety in Local Community, Kopaonik, Serbia, 18–21 April 2018; Available online: https://www.bslz-rs.org/Zbornici/2018.pdf (accessed on 15 May 2023).
- Brake Road Safety Charity. The Green Flag Report on Safe Driving 2004 Part Two: Speed. Brake, 2004. [Google Scholar]
- Department for Transport. Understanding Public Attitudes to Road user Safety—Literature Review: Final Report. Road Saf. Annu. Rep. 2010, 112. [Google Scholar]
- Bakhtari Aghdam, F.; Sadeghi-Bazargani, H.; Azami-Aghdash, S.; Esmaeili, A.; Panahi, H.; Khazaee-Pool, M.; Golestani, M. Developing a national road traffic safety education program in Iran. BMC Public Health 2020, 20, 1064. [Google Scholar] [CrossRef] [PubMed]
- Kononen, D.W.; Flannagan, C.A.; Wang, S.C. Identification and validation of a logistic regression model for predicting serious injuries associated with motor vehicle crashes. Accid. Anal. Prev. 2011, 43, 112–122. [Google Scholar] [CrossRef] [PubMed]
- Čubranić-Dobrodolac, M.; Švadlenka, L.; Čičević, S.; Trifunović, A.; Dobrodolac, M. A bee colony optimization (BCO) and type-2 fuzzy approach to measuring the impact of speed perception on motor vehicle crash involvement. Soft. Comput. 2022, 26, 4463–4486. [Google Scholar] [CrossRef]
- Tang, X.; Li, B.; Du, H. A Study on Dynamic Motion Planning for Autonomous Vehicles Based on Nonlinear Vehicle Model. Sensors 2022, 23, 443. [Google Scholar] [CrossRef]
- Wu, X.; Fu, S.; Guo, L. Study on Highway Alignment Optimization Considering Rollover Stability Based on Two-Dimensional Point Collision Dynamics. Appl. Sci. 2022, 13, 509. [Google Scholar] [CrossRef]
- Zandi, K.; Tavakoli Kashani, A.; Okabe, A. Influence of traffic parameters on the spatial distribution of crashes on a freeway to increase safety. Sustainability 2022, 15, 493. [Google Scholar] [CrossRef]
- Ghasemi, P.; Hemmaty, H.; Pourghader Chobar, A.; Heidari, M.R.; Keramati, M. A multi-objective and multi-level model for location-routing problem in the supply chain based on the customer’s time window. J. Appl. Res. Ind. Eng. 2023, 10, 412–426. [Google Scholar]
- Barreno, F.; Romana, M.G.; Santos, M. Fuzzy expert system for road type identification and risk assessment of conventional two-lane roads. Expert Syst. 2022, 39, e12837. [Google Scholar] [CrossRef]
- Belay, G.F. Energy wastage on an automobile due to speed breakers: A case study on Woldia town. Int. J. Res. Ind. Eng. 2020, 9, 202–208. [Google Scholar]
- Fu, X.; Meng, H.; Yang, H.; Wang, J. A hybrid deep learning method for distracted driving risk prediction based on spatio-temporal driving behavior data. Transp. B Transp. Dyn. 2024, 12, 2297144. [Google Scholar] [CrossRef]
- Moslem, S.; Farooq, D.; Ghorbanzadeh, O.; Blaschke, T. Application of the AHP-BWM model for evaluating driver behavior factors related to road safety: A case study for Budapest. Symmetry 2020, 12, 243. [Google Scholar] [CrossRef]
- Shaer, A.; Talebian, A.; Mishra, S. Informing the Work Zone Safety Policy Analysis: Reconciling Multivariate Prediction and Artificial Neural Network Modeling. J. Transp. Eng. Part A Syst. 2024, 150, 04023137. [Google Scholar] [CrossRef]
Disclaimer/Publisher’s Note: The statements, opinions and data contained in all publications are solely those of the individual author(s) and contributor(s) and not of MDPI and/or the editor(s). MDPI and/or the editor(s) disclaim responsibility for any injury to people or property resulting from any ideas, methods, instructions or products referred to in the content. |
© 2024 by the authors. Licensee MDPI, Basel, Switzerland. This article is an open access article distributed under the terms and conditions of the Creative Commons Attribution (CC BY) license (https://creativecommons.org/licenses/by/4.0/).