Abstract
One of the most common diseases afflicting humans is knee osteoarthritis (KOA). KOA occurs when the knee joint cartilage breaks down, and knee bones start rubbing together. The diagnosis of KOA is a lengthy process, and missed diagnosis can have serious consequences. Therefore, the diagnosis of KOA at an initial stage is crucial which prevents the patients from Severe complications. KOA identification using deep learning (DL) algorithms has gained popularity during the past few years. By applying knee X-ray images and the Kellgren–Lawrence (KL) grading system, the objective of this study was to develop a DL model for detecting KOA. This study proposes a novel model based on CNN called knee osteoarthritis classification network (KOC_Net). The KOC_Net model contains 05 convolutional blocks, and each convolutional block has three components such as Convlotuioanl2D, ReLU, and MaxPooling 2D. The KOC_Net model is evaluated on two publicly available benchmark datasets which consist of X-ray images of KOA based on the KL grading system. Additionally, we applied contrast-limited adaptive histogram equalization (CLAHE) methods to enhance the contrast of the images and utilized SMOTE Tomek to deal with the problem of minority classes. For the diagnosis of KOA, the classification performance of the proposed KOC_Net model is compared with baseline deep networks, namely Dense Net-169, Vgg-19, Xception, and Inception-V3. The proposed KOC_Net was able to classify KOA into 5 distinct groups (including Moderate, Minimal, Severe, Doubtful, and Healthy), with an AUC of 96.71%, accuracy of 96.51%, recall of 91.95%, precision of 90.25%, and F1-Score of 96.70%. Dense Net-169, Vgg-19, Xception, and Inception-V3 have relative accuracy rates of 84.97%, 81.08%, 87.06%, and 83.62%. As demonstrated by the results, the KOC_Net model provides great assistance to orthopedics in making diagnoses of KOA.
MSC:
68T07
1. Introduction
According to the World Health Organization (WHO), knee osteoarthritis (KOA) will affect one out of every three people in their lives [1,2]. Over half of those over the age of 65 show symptoms of KOA, and it is not just in that one joint. By 2030, nearly one in four Americans will be at least 65 years old, putting them at increased risk of getting KOA [3]. The existence of KOA impacts the quality of life of older people. No medication has yet developed that can slow or prevent the progression of the degenerative structural changes that define KOA.
KOA early detection and treatment carry some risks, but it also can improve patients’ quality of life and delay the disease’s growth. The main symptoms of KOA are joint space narrowing (JSN), subchondral sclerosis, and osteophyte formation. The MRI scans show the 3D structure of the knee joint. WHO standards eventually resulted in the development of the Kellgren and Lawrence (KL) severity grading system in 1961 [4]. According to the KL system, the degree of KOA is ranked from 0 to 4.
It is impossible to make an accurate diagnosis without the experience and care of a trained medical professional [5]. In addition to this, the KL grading system leaves a lot of space for individual interpretation. Osteophyte lipping and minimal risk of JSN are two of the criteria for KL Grade 1. The same doctor can assign multiple grades of knee flexibility to the same knee joint at different times. According to the findings of the study [5], the inter-rater reliability for KL falls somewhere in the range of 0.67 and 0.73. According to [6], the KL grade standard introduces a lack of clarity, which makes physicians’ evaluations of the knee joint less accurate than they could be.
There is a potential for deliberately increasing the grade of a knee joint in four levels (Grade 1 to Grade 4). Mean absolute error (MAE) was used in evaluating the accuracy of age predictions and was an additional measure that can be used to categorize the degree of knee KL [7]. The growing incidence of KOA makes accurate diagnosis and assessment of its severity all the more important.
Automatic knee severity assessment maintains accuracy over time and may provide more objective and trustworthy estimates than human experts. The severity of KOA can be predicted using knee joint X-rays alone, but only if the knee joint is first recognized and then classified into one of five KL groups. KL grade classification and knee joint recognition algorithms have been developed in recent years. For the most accurate identification of knee joints, the study [8] utilizes a sliding window strategy in conjunction with a template-matching technique. After being overlaid on the existing X-ray image, a total of 20 images of the knee joint, each consisting of 15 × 15 pixels, are measured for their Euclidean distances from one another. When one looks out the window, the Euclidean distance to the knee joint that is the shortest that is possible found [9,10] uses a linear support vector machine (SVM) to identify knee joints by looking at features found in Sobel vertical image gradients. These gradients are made by the horizontal edges in images of knee joints [11].
First, the identification of the knee joint region is offered in a study [12]. They experience a peak intensity at the patella, followed by a sharp drop down at the femur and tibia. A linear SVM classifier employing a Histogram of Oriented Gradients (HOG) features [13] is given the knee joint predictions. An innovative deep neural network (DNN)-based method for knee joint identification is described by [14]. The method achieves state-of-the-art standards in terms of performance [8,15]. According to the findings presented in [15], the assignment of KL grades is observed as a challenging regression task. The BVLC_Net has been optimized for knee KL grade categorization using the mean squared loss. Moreover, a novel CNN model with improved accuracy by including cross-entropy and mean-squared losses [16], they designed a CNN technique known as deep siamese. This tool was designed to isolate certain areas around the knee and combine their predictions.
Deep learning (DL) algorithms are capable of obtaining a wide variety of visual tasks, including object detection, segmentation, and classification [17]. DL models have been utilized for a wide range of medical image analysis. These tasks include cell detection and segmentation [18], mitosis detection [19], white matter lesion detection [17,18,19], and retinal blood vessel recognition and segmentation [20].
The Severe complications of KOA are on the rise, patients have an approx. 95% chance of recovering if they are recognized and treated quickly. This motivates us to develop an automatic KOA identification model at an initial stage. Therefore, this study introduces a novel CNN model for the classification of KOA using a knee severity grading system named the knee osteoarthritis classification network (KOC_Net). This KOC_Net classifies cases of KOA according to the KL severity grading system, which includes five grades (ranging from Healthy, Doubtful, Minimal, Moderate, and Severe): 0, 1, 2, 3, and 4. Several studies [8,15] used artificial intelligence approaches for the identification of KOA. However, no study has been found that identifies the subtypes of KOA based on the X-rays of the KL severity grading system. Four baseline classifiers, including Vgg-19, Dens-Net 169, Xception, and Inception-V3, were also compared to KOC_Net. The primary contributions of this study are given below:
- The novel KOC_Net model is developed to classify the five different types of KOA, i.e., Healthy, Doubtful, Minimal, Moderate, and Severe using X-rays of the KL severity grading system. Additionally, the KOC_Net extracts the dominant features from the X-rays of KOA which makes the model significant in classifying the KOA based on knee severity.
- The proposed KOC_Net model reduces the complexity of the model by limiting the number of trainable parameters.
- For this work, the SMOTE Tomek method is used to resolve the problem of the imbalance number of KOA images.
- The proposed model also highlights the part of the knee affected by KOA using Grad-CAM heat-map methodology.
- The performance of the KOC_Net model was compared with four baseline classifiers such as Vgg-19, DenseNet 169, Xception, and Inception-V3. The proposed model achieves the highest classification accuracy of 96.51% which is superior to the other four baseline models.
- In addition, the outcomes of the KOC_Net model surpassed modern state-of-the-art classifiers.
This study is broken down into the following sections: The literature review is presented in Section 2. In Section 3, we discuss the dataset description, SMOTE Tomek, proposed model, and performance evaluation metrics. The results obtained by using the proposed model and four baseline models are comprehensively discussed in Section 4. The conclusion and future work of the study is presented in Section 5.
2. Related Work
The goal of the significant study on KOA diagnosis help doctors in the early identification of the disease [21,22]. Meanwhile, current research is focused on improving the diagnosis procedure for multiple stages of KOA through the use of intelligent algorithms [23,24]. Table 1 provides an overview of the recent literature on KOA diagnosis using DL models.
Jiang et al. [25] designed a CNN-based model for the classification of KOA using X-rays. They compared the classification performance of their proposed CNN model with musculoskeletal radiologists. They used data augmentation methods before training the proposed CNN model. The Osteoarthritis Initiative (OAI) dataset was used in their work, which contains a total of 40,000 images. Their proposed model achieved an F1 score and accuracy of 70.00% and 71.00%, respectively.
Thomas et al. [11] proposed an ordinal regression module (ORM) with neural networks, to classify the KOA by using the KL grading system. They compared the outcomes of their proposed model with neural network approaches. The OAI dataset used included 8260 knee radiographs total, with this number being split evenly between validation, test, and training sets. It was stated that DenseNet-161 had an accuracy of 88.09% after being trained on ORM, with a Quadratic Weighted Kappa of 0.8609. Despite the positive results of their method, the model occasionally failed to correctly label KOA images with KL ratings of 0 and 1.
Overfitting has been a problem in the KOA datasets. This issue was resolved by Yong et al. [26] by combining the GCN with the concept of decreasing intrinsic dimension, which was driven by the non-Euclidean structure of form space. They compared the output of the classifier to the results obtained from an additional extrinsic technique. The OAI was responsible for the construction of the dataset that was utilized, which consisted of 201 general representations. Images received a score of 0 if they did not contain any osteophytes, 1 if they contained some osteophytes, and 2 if they contained numerous osteophytes. When contrasted with the result obtained by the Euclidean technique, which had an accuracy of 58.62%, the accuracy that was achieved using their internal model was 64.64%.
Von et al. [27] developed a model with the combination of InceptionNet-v2 with SVM for the categorization of KOA. In their study, 728 knee scans in total, including images of 364 distinct patients, were taken from a Seoul hospital’s database with permission from the Institutional Review Board (IRB) of the university. The outcome of this attempt was an F1 score of 0.71, along with sensitivity and accuracy values of 0.70 and 0.76. The gait characteristics that were recovered in this investigation were shown to be substantially correlated with the severity of the radiological KOA photos. The study’s findings suggest that the restored features have been related to the degree of radiological KOA images.
Kwon et al. [28] were able to detect knee osteoarthritis (KOA) in its early stages by analyzing the geometric anomalies found in knee X-rays and applying Hu’s invariant moments to the analysis. The suggested approach started with gathering images for classification, which were subsequently classified using K-NN and decision tree models after superimposing irrelevant sections, isolating the cartilage area, and computing Hu’s invariant moments. To create their dataset, two medical professionals assessed two thousand images manually using the KL grading method. All of these experts’ predictions were almost exactly right—99.23% of the time.
Gornale et al. [29] used ML techniques for KOA diagnosis and prognosis. Numerous specialized domains were examined, including segmentation, best practices for post-treatment planning, classification, regression analysis, and predictions. Based on the data, most diagnostic algorithms that attempted to predict KOA had an accuracy between 76.1% and 92.2%.
A technique for determining if a patient has osteoarthritis based on the joint space width (JSW) was provided by Kokkotis et al. [30]. They preprocessed the KOA images, selected areas of interest (ROIs), computed edges, and assessed the joint space width as part of their methodology. Two radiologists and two orthopedic surgeons collaborated to determine the extent of the damage seen in the 140 images that were taken into consideration. The suggested method achieved an accuracy rate of 97.14% and a score of 98.4% on the F1 scale, successfully classifying KOA.
Saleem et al. [31], used an ML-based computer-aided design (CAD) system. Before applying a multivariate linear regression-based normalization approach, the X-ray images underwent preprocessing. The aim was to achieve maximum uniformity in the appearance of osteoarthritic and Healthy knees. First, the features are extracted using an independent component analysis. Next, they are classified using a random forest (RF) in conjunction with a Naive Bayes (NB) model. The researchers’ methodology was based on 1024 distinct OAI knee X-ray images. Their method has an 82.98% accuracy rate, an 80.65% specificity rate, and an 87.15% sensitivity rate.
Roth et al. [17] use a discriminative regularized autoencoder to elucidate the crucial and discriminative components that improve the detection process. To guarantee that the final model has all of the required discriminative data, the training conditions were changed to include discriminative loss. In total, 3900 knee X-rays that were taken from the OAI’s open-access database were analyzed by the researchers. By contrasting their results with those of other DL approaches, they were able to demonstrate an accuracy of 82.53%. Their results are fascinating, especially considering that their technique outperformed other sophisticated DL techniques in terms of accuracy.
Nasser et al. [32] used a DCNN for the identification of KOA. The Korean National Health and Nutrition Examination Survey (KNHANES) was conducted in 2015 and 2016 to gather the data for this study. The proposed method used DCNNs and scaled principal component analysis (PCA) to automatically obtain key features for assessing risk factors associated with KOA. They concluded that their classification model had an accuracy of 71.97% and a sensitivity level of 66.67%.
Brahim et al. [33] used YOLOv2 for the identification of KOA using KL severity grading. The suggested approach begins by identifying knee joints in the X-rays by employing a customized YOLOv2 network. The KL system was used to grade knee images, and the results were reliably classified into severity levels. This was accomplished via fine-tuning variants of DenseNet, VGG, ResNet, and InceptionV3. With a mean Jaccard index of 0.858 and recall of 92.2%, their knee joint recognition approach performed well, but the calibrated VGG-19 [13] model was only 69.7% effective in predicting the severity of knee osteoarthritis [34,35].
The procedure for obtaining LBP features from 3D images of radiographs is described in [36]. Through the use of deep feature extraction, Dark-net-53, and Alex-Net, 90.6% accuracy in the KOA image classification was found. In the proposed localization method, an open exchange neural network (ONNX) is combined with YOLOv2 to achieve a mean absolute precision of 0.98. These images were taken from the OAI dataset and divided in half, one for training and the other for testing.
Yunus et al. [37] proposed automatic image classification for KOA. Preprocessing is the initial stage of the two-part classification process that KOA images go through. A first extraction from the VGG network concentrates on the knee joint center. Subsequently, the images are provided to the ResNet-50 network for classification. To rebalance the data, the authors employed a SMOTE method and they were able to achieve a classification accuracy of 81.41%. Wang et al. [38] proposed a DL classification method based on contrast knee images from patients who underwent total knee replacement. The KL-based grading categories were divided using a cross-validation method trained on ResNet34. 4796 OAI X-rays in total were included in the dataset utilized for this investigation. Their suggested model’s accuracy was 72.7%. Given the tiny size of their dataset and their use of transfer learning, it is plausible that their model’s performance was not as good.
Leung et al. [39] proposed a hybrid model that combines elements of a deep and traditional model to increase the accuracy of early KOA detection. The traditional model made use of logistic regression, ANNs, and RF. The deep learning model used CNNs to classify KOA images. The subjects for the OAI dataset comprised 3285 individuals without KOA and 1389 individuals with KOA. Their proposed hybrid model yielded an AUC of 0.807, sensitivities of 72.3%, and specificities of 80.9%.
Gaun et al. [40] proposed a CNN model for the classification of KOA using the KL grading system. They achieve remarkable results by employing a deep Siamese CNN. After using data from the multicenter osteoarthritis research to train their model, they used 5960 OAI knee images for validation to ensure their work was accurate. Their model’s overall classification accuracy was 66.71%, and in the quadratic range, its Kappa value was 0.83. Furthermore, they focus on emphasizing the significant visual elements related to the proposed model’s conclusion. The study [41] used ML methods to identify the fundamental features of KOA. The researchers used a combination of distance-weighted discrimination and k-means clustering to identify patterns of similarity among patient phenotypes. The dataset was obtained by researchers at the National Institutes of Health from the Osteoarthritis Biomarkers Consortium Foundation. The collected dataset contains 600 patients with 76 distinct variables. The difference between those who had improved and those who had not across all assessments was indicated by a z-score of 10.1.
A feature extraction method was devised by Nelson et al. [42] to help radiologists diagnose KOA. Furthermore, a method based on ML was introduced to identify KOA automatically from the gathered data. They used the SVM and KNN algorithms to categorize knee X-rays. Based on the OAI data, knee radiographs were categorized as KOA-progressors or non-progressors. By using the SVM technique, they were able to achieve a classification accuracy of 74.07%.

Table 1.
Recent studies that use artificial intelligence (AI) models for the classification of KOA using different medical images.
Table 1.
Recent studies that use artificial intelligence (AI) models for the classification of KOA using different medical images.
| Ref | Year | Models | Image Type | Dataset | Accuracy | |
|---|---|---|---|---|---|---|
| X-Rays | KL Severity | |||||
| Touahema et al. [43] | 2024 | DCNN | ✓ | × | Medical Expert-II | 94.94% |
| Ahmed et al. [44] | 2023 | CNN | ✓ | × | OAI 2022 | 99.10% |
| Messaoudene et al. [45] | 2024 | DCNN | ✓ | × | OAI | 77.24% |
| Kumar et al. [46] | 2023 | CNN | ✓ | × | OAI | 91.03% |
| Feng et al. [47] | 2020 | CBAM | ✓ | × | OAI | 70.23% |
| Chan et al. [48] | 2022 | Vgg-19 | ✓ | × | Knee Joint space | 91.70% |
| Tayyaba et al. [49] | 2023 | ResNet-34 | ✓ | × | OAI | 98.00% |
| Mononen et al. [50] | 2024 | CNN | ✓ | × | GLCM | 72.00% |
| Chen et al. [13] | 2019 | InceptionV3 | ✓ | × | OAI | 69.70% |
| Thomas et al. [11] | 2020 | CNN | × | × | OAI | 66.00% |
| Zhang et al. [51] | 2020 | CBAM | ✓ | × | OAI | 78.41% |
| Yong et al. [26] | 2021 | ORM | ✓ | × | OAI | 88.09% |
| Von et al. [27] | 2020 | Graph CNN | ✓ | × | OAI | 64.66% |
| Abedin et al. [52] | 2019 | CNN | ✓ | × | OAI | 69.70% |
| Patil et al. [53] | 2023 | CNN | ✓ | ✓ | OAI 2021 | 81.00% |
Several limitations have been observed in the majority of recent research studies [43,44,45,46,49,54,55]; (1) no data preprocessing techniques were applied; (2) the images in KOA datasets contain low contrast. No image enhancement method was used by prior studies; thus, it might affect the performance of the model; (3) imbalance classes; and (4) no study works on the KOA classification based on the knee severity grading. Therefore, this study fulfills this gap by addressing these aforementioned problems.
3. Materials and Methods
This section presents a comprehensive description of the datasets, image enhancement, data generative methods, and the proposed KOC_Net model. KOA, the main cause of which is the increase in articular cartilage degeneration, often appears in old age [47,48,49]. To detect the KOA, the researchers use an X-ray image widely. Applying DL algorithms to improve the diagnostic accuracy of the grading of KOA in each of the 0–4 categories: Minimal, Doubtful, Moderate, Severe, and Healthy [13,56,57]. Moreover, early diagnosis of KOA provides doctors with a greater chance to prevent the progression of the disease and to initiate treatment [58]. Advances in technology related to image processing and AI have greatly involved the medical domain such as skin cancer [59], genetic disorders [60], lung cancer [61], etc. Smart automated systems depend largely on the research community for their improvements to ensure the evaluation process is even quicker and with even more accuracy. We have designed a novel KOC_Net model in this study, which aims to identify five different types of KOA using KOA Grading images. The KOC_Net model is trained and tested on two publicly available KOA datasets. The KOA images are resized to 150 × 150 pixels before training the proposed model. After this, we improved the contrast of the KOA images by applying the Contrast-Limited Adaptive histogram equalization (CLAHE) technique. The Synthetic Minority Over-Sampling Technique (SMOTE) Tomek method was adopted to resolve the unbalanced dataset problem and keep the size of samples in each class balanced [62,63]. The KOC_Net model and four baseline classifiers such as Vgg-19 [64], DenseNet 169 [65], Xception [14], and Inception-V3 were executed up to 30 epochs. The Grad-CAM heat-map technique has been applied to visualize the discriminating properties of KOA and to highlight the input features that affect the classification of KOA. These features were employed to highlight the determinants of KOA diagnosis. Figure 1 depicts the workflow of the proposed KOC_Net model.
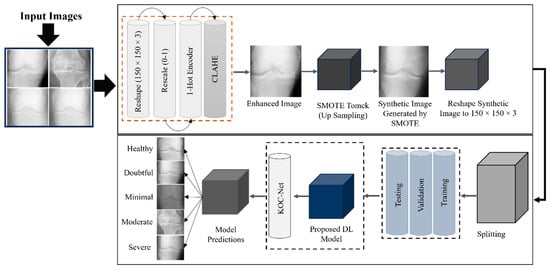
Figure 1.
Proposed study framework for the identification of KOA using KL grading system.
3.1. Description of Datasets
For this study, two publicly available benchmark datasets such as KOA datasets with severity grading [14] and Digital Knee X-ray Images [66] are used. Two medical experts discuss each radiographic knee X-ray using the KL grading system. Based on KL grading, the dataset is divided into five different grades such as Grade 0 (Healthy), Grade 1 (Doubtful), Grade 2 (Minimal), Grade 3 (Moderate), and Grade 4 (Severe). The dataset-1 [14] contains a total of 1629 KOA images including 693 images of Grade 0, 296 images of Grade 1, 447 images of Grade 2, 223 images of Grade 3, and 51 images of Grade 4. The dataset-2 [66] contains a total of 1650 of which 514 images are of Grade 0, 477 images of Grade 1, 232 images of Grade 2, 221 images of Grade 3, and 206 images of Grade 4. A detailed description of the KOA dataset is presented in Table 2. Additionally, Figure 2 presents a few original samples of KOA.
Table 2.
A detailed summary of the KOA dataset.
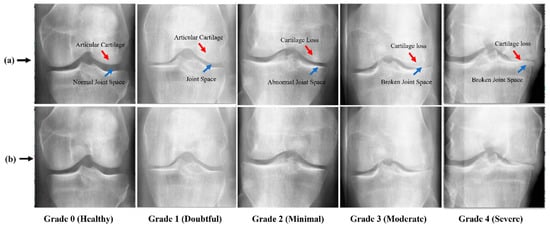
Figure 2.
Image Samples of KOA; (a) KOA images with marked abnormalities, while, (b) show raw samples of KOA.
3.2. KOA Image Data Preprocessing
As discussed in the above section, this study uses two KOA datasets. The KOA images of the datasets are further separated into five different grades. For better training of the proposed model, several data-preprocessing methods are used to enhance the KOA dataset. The steps for conducting data processing are depicted in Figure 3.
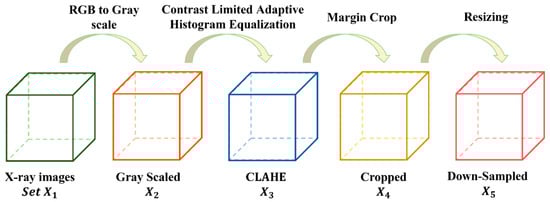
Figure 3.
Steps of conducting pre-processing to enhance the KOA dataset.
The dataset is symbolized as , each KOA image is symbolized as . We have The size of each KOA image is . Here, . The raw KOA images are not appropriate for training CNN due to several issues, including (i) having duplicate data in three color channels, (ii) uneven contrast, (iii) including background and text information, and (iv) high-resolution KOA images. The first step was to transform the color images into grayscale as shown in Equation (1).
where G means the grayscale operation. After converting the images into grayscale images, the dataset becomes which represents the . Now, the contrast-limited adaptive histogram equalization (CLAHE) method was used to enhance the contrast of KOA images. CLAHE is used to enhance the contrast of digital images. For vth image , we first calculate their minimum grayscale value and maximum grayscale value by using Equations (2) and (3).
Here, (a, b) means the coordinates of the pixel of the image. The new CLAHE image is obtained by using Equation (4).
In all, we obtain the CLAHE image set = The image produced by using CLAHE is graphically represented in Figure 4.
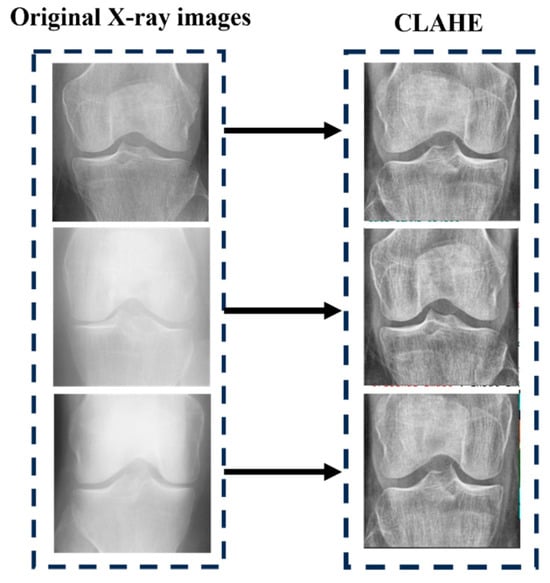
Figure 4.
After applying CLAHE on KOA images.
Third, we cropped the KOA images to remove the text at the margin areas and reduce the size of the KOA images. Thus, we obtain the cropped dataset ( by using Equation (5).
where C represents crop operation. Parameter means the crop values in units of pixels from the top, bottom, left, and right. We set . Now the size of each image size We can have . Fourth, we down-sampled each image to the size of , and now obtain the resized image set as mentioned in Equation (6).
The represents the down-sampling (DS), where b is the down-sampled version of the original image a, and denotes this fact original image. In this study, . There are two aspects to DS’s benefit: (i) it can reduce storage needs and (ii) it avoids overfitting with a smaller dataset as demonstrated in Table 3. The reason why we set is based on the trial-and-error method. We found that larger size will bring in overfitting which impairs the performance, and meanwhile, the smaller size will make the images blurry which also decreases the classifier’s performance.
Table 3.
Image storage and size per preprocessing step.
We compare the size and storage of each KOA image | at every preprocessing step. Here, following the preprocessing step, we can observe that the storage or size requirements for each image have been reduced to approximately 2.08%. Visual representations of the final state’s compression ratios (CRs) to original stage were calculated as and = 31,256/2,034,617. Hence, we can obtain .
3.3. Implementation of SMOTE Tomek
From Table 2, it has been observed that the KOA dataset has an uneven distribution of knee images in each class. The imbalance number of knee images affects the performance of the model. Therefore, the SMOTE Tomek [67] method is used to synthetically balance the knee images in each class of the KOA dataset. SMOTE is the technique for oversampling which balances class distribution in a KOA dataset. Tomek links are selected pairs of instances from the same class and in SMOTE new instances may be created at random [68]. Therefore, this study combines SMOTE and Tomek to lower the chance of overlap. The pseudocode of SMOTE Tomek is outlined in Algorithm 1.
| Algorithm 1: Balancing knee images of the KOA dataset using the SMOTE Tomek algorithm |
| Input: = Set for training, instances of minority set, No of nearest neighbors, The number of synthetic examples required to compensate for the number of original KOA images in the specified class. |
| Output: A group of synthetic samples from the minority: |
| 1. is a collection of samples that are considered as Smote Tomek |
| 2. for all in do |
| 3. ← nearest neighbors of in |
| 4. ← The number of samples in and not in O |
| 5. if then is a borderline sample |
| 6. add |
| 7. end if |
| 8. end for |
| 9. is a set containing synthetic samples |
| 10. for all in do |
| 11. ← nearest neighbors of in |
| 12. do |
| 13. ← choose a random sample from |
| 14. ← + j * ( // is a random number in (0, 1), is a synthetic sample |
| 15. add to |
| 16. end for |
| 17. end for |
| 18. is the union of minority samples and synthetic samples |
| 19. return |
Figure 5 presents the synthetic images generated by the SMOTE Tomek up-sampling method. Additionally, the detailed description of the KOA dataset after using SMOTE Tomek and pre-processing methods such as X1 to X5 are presented in Table 4.
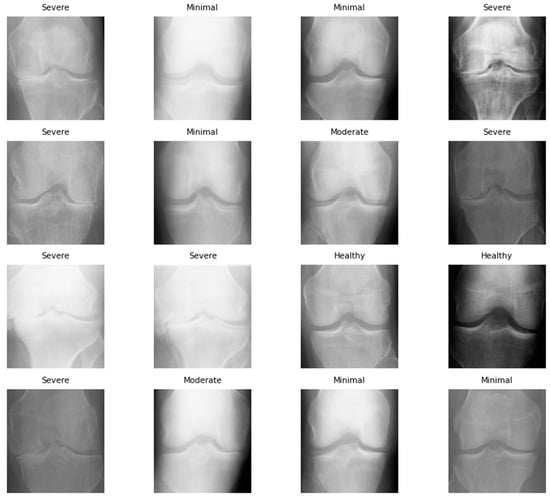
Figure 5.
Synthetic image sample of KOA dataset after using SMOTE Tomek.
Table 4.
Summary of the enhanced KOA dataset after applying the up-sampling method of SMOTE Tomek.
3.4. Proposed KOC_Net Model
Disease classification, image segmentation, and face detection are computer vision applications that benefit greatly from the CNN architecture, which incorporates the anatomy of the human brain as its primary source of inspiration. Translation invariance, also referred to as geographical invariance [67,68,69,70], signifies the ability of a CNN to recognize the identical feature in multiple images independently of its visual location. For this study, we designed a novel KOC_Net model based on CNN for the classification of KOA using KL severity grading X-rays. The architecture of the KOC_Net is illustrated in Figure 6, which includes five convolutional (ConvL) blocks, one dropout layer, two dense layers, and a SoftMax classification layer.
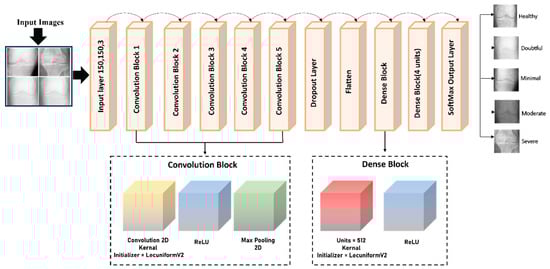
Figure 6.
Proposed KOC_Net architecture for KOA classification.
3.4.1. Convolutional Blocks of KOC_Net
The ConvL block of the proposed KOC_Net model contains a convolutional2D (ConvL_2D) and a pooling2D (Pool_2D). To allocate weights to the various kernel layers, the LecunUniformV2 kernel initializer is designed. Through the utilization of the activation function of ReLU, we prevent the model from the issue of gradient-vanishing. In KOC_Net, the initial ConvL_2D layers apply the filter to extract the information from the knee X-ray images. This layer, sometimes called the kernel, initiates the process by activating filters. The filter size of the proposed KOC_Net model is demonstrated in Equation (7).
where and represent the filter width and height, respectively. For this study, we used the filter size of 3 × 3. Equation (8) presents the ConvL_2D operation of the KOC_Net. Suppose, I is the input image, is the kernel size, and O is the output feature map.
where O (x,y) is the value at position (x,y) in the output feature map, I (x + a, y + b) is the value at position (x + a, y + b) in the input image. is the value at position (a,b) in the kernel. An output feature map was produced through the use of a ConvL_2D. Equation (9) for the ConvLs reveals the input feature maps are combined to produce each output feature map.
where, is the output of the present layer, (Xv − 1) × (k − 1) is the previous layer’s output, is the current layer’s kernel, are the current layer’s biases, and M represents a collection of input maps. After that, the ConvL results are processed by a ReLU function.
3.4.2. Flatten Layer
The utilization of the flatten layer (FTL) allowed for the transformation of the 2D visual representation into a 1D input as presented in Equation (10). The image produced by using FTL is graphically represented in Figure 7.
where T represents the input tensor. This reshaping essentially flattens the spatial dimensions of the input tensor, transforming it into a vector that fed into a fully connected layer (FCL) for the final stages of a KOC_Net to classify the knee image into their respective classes.
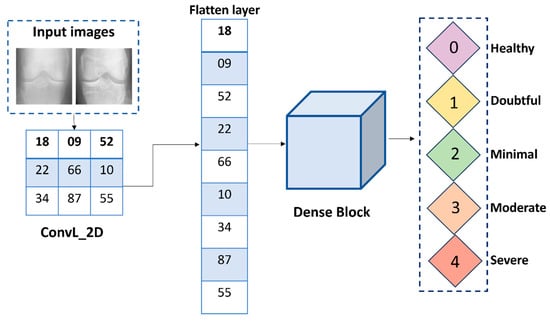
Figure 7.
Structure of the flatten layer for KOC_Net.
3.4.3. Dropout Layer of KOC_Net Model
For this study, the incorporation of the dropout layer into the KOC_Net model to lessen the possibility of overfitting [71]. The dropout value of 0.5 is used for the KOC_Net model. This layer aimed to alleviate training time constraints and model complexity. Equation (11) is used for employing the dropout process in the proposed model.
Here, Y is the output of the dropout layer. Each element of Y is computed by using Equation (12).
where is the corresponding element in the input X, and p is the dropout probability. During training, each neuron’s output is set to zero with probability p and scaled by (1 − p) to account for the dropped-out neurons. During inference, the dropout layer is deactivated, and the output is scaled by 1 − p to ensure that the expected output remains the same.
3.4.4. Dense Block of the KOC_Net
The proposed KOC_Net model contains two dense blocks, with an activation function comprising each block. The detailed description of these blocks is stated below:
- ReLU Function
The ReLU activation function determines the movement of KOC_Net output from one layer to another. ReLU activation is achieved through the substitution of every negative outcome with a value of zero and leaves positive values unchanged. It introduces non-linearity to the network, allowing it to learn complex patterns and relationships in the KOC image data during the training process of the KOC_Net. The following Equation (12) is used to perform the ReLU operations.
- Dense Layer
The dense layer generates output that is consistent with the characteristics of the input matrix, which is a singular matrix. This output is produced by the dense layer. The final output of the KOC_Net model is generated by a dense layer comprising five neurons, which employs the SoftMax activation function [11]. SoftMax is an activation function that operates based on probability, where the quantity of neurons is equivalent to the total number of classes. The 1,150,037 parameters make up the total amount of parameters, with 1,150,037 of them being trainable and zero of them being non-trainable.
3.5. Model Evaluations
The confusion matrix is generated for evaluating the performance of the proposed KOC_Net model and other baseline models. The initial phase in the process of training the proposed model and baseline models consisted of dividing the dataset into two distinct sets: a training set and a test set [72,73]. Using the test set, the performance of the model was evaluated in terms of several parameters such as accuracy (ACC), precision (PRE), recall (REC), and F1-Score. Equations (14)–(17) are used to measure these parameters.
3.5.1. Accuracy (ACC)
The ACC is used to calculate the proportion of correct prediction of the KOA made by the KOC_Net model. Equation (14) is used to calculate the ACC.
3.5.2. Precision (PRE)
The PRE is used to evaluate the accuracy of positive prediction carried out by the proposed KOC_Net and other baseline models. Equation (15) is used to measure the PRE.
3.5.3. Recall (REC)
REC is TPR, which measures the ability of a KOC_Net model and baseline models used in this work to identify all relevant positive instances. Equation (16) is applied to calculate the REC.
3.5.4. F1-Score
The harmonic mean of REC and PRE is called F1-Score. The following Equation (17) is used to measure the F1-Score.
3.6. Proposed Algorithm
Algorithm 2 presents the pseudocode of the proposed KOC_Net model. Algorithm 2 consists of input, output, and five sections such as . demonstrates the pre-processing of knee X-rays. The steps for synthetically balancing the size of the KOA dataset are presented in . The structure of the proposed KOC_Net model is discussed in . The training and validation of the proposed KOC_Net on the enhanced dataset are described in . The last section computes the performance of the model.
| Algorithm 2: Classification of KOA diseases using KL severity grading X-rays | |
| Input: | = X-Rays |
| Output: | KOA Diseases Classification |
| Pre-Processing: H1 | |
| 1 | |
| 2 | See Equation (1) |
| 3 | See Equations (2)–(4) |
| 4 | See Equation (5) |
| 5 | See Equation (6) |
| Generating Synthetic Images Using Smote Tomek: H2 | |
| 6 | S1 See Algorithm (1) |
| Proposed KOC_Net Model: H3 | |
| 7 | See Equations (7)–(9) |
| 8 | See Equation (10) See Equations (11) and (12) See Equation (13) |
| Training & Validation Split of Models: H4 | |
| 9 | Training set: , Validation set: |
| 10 | For i = 1: | on S1 //S1 represents enhanced data obtained in H2 |
| 11 | Training Image: |
| 12 | : training image in epoch (e) |
| 13 | |
| 14 | End |
| 15 | |
| Performance Evaluation of KOC_NET: H5 | |
| 16 | For V = 1: 4% V is the performance evaluation indicator of KOC_Net See Equations (14)–(17) End |
| 17 | Select Best Model V(c) in terms of V |
| 18 | End |
4. Experimental Results and Discussions
This section presents the experimental results obtained by using the KOC_Net model. Additionally, the results of the proposed KOC_Net are also compared with baseline models.
4.1. Experimental Setup and Hyperparameters
Tensor flow (TF) and Keras library were used to implement the proposed KOC_Net model and other baseline models used in this work. Additionally, the Python programming language is used to implement the operations that are not linked with CNN. The proposed KOC_Net model and baseline models are executed up to 30 epochs with a batch size of 16. The momentum and learning rate of the KOC_Net is 0.9 and 0.0001, respectively. The experiment is performed on a Windows 10 operating system having 32 GB of RAM and an 11 GB NVIDIA GPU.
4.2. Results Analysis
This section presents the detailed results of the KOC_Net and other baseline models in terms of many performance evaluation metrics.
4.2.1. Results of KOC_Net Model in Terms of Accuracy
After enhancing the dataset by using SMOTE Tomek, we compared the proposed KOC_Net model and baseline models such as Vgg-19, XceptionNet, DenseNet-169, and Inception-V3. We also observed the outcomes obtained by using the proposed KOC_Net model without applying SMOTE Tomek. Table 5 presents the detailed results obtained by using the KOC_Net model with and without using SMOTE Tomek, and the other four baseline models.
Table 5.
Results obtained by the proposed model and other baseline models in terms of many performance metrics.
From Table 5, it has been observed that the proposed KOC_Net model with SMOTE Tomek achieved the highest classification accuracy of 96.51% as compared to other baseline approaches. The Vgg-19 achieved a classification ACC of 81.08%, PRE of 88.91%, REC of 89.93%, F1-Score of 81.46%, and AUC of 84.24%. The DenseNet-169 model attained an ACC of 84.97%, PRE of 89.17%, REC of 82.66%, and F1-Score of 88.73%. The XceptionNet model achieved an ACC of 87.06%, PRE of 88.73%, REC of 85.41%, AUC of 85.58%, and F1-Score of 81.11%. Additionally, the Inception-V3 attained an ACC of 83.62%, PRE of 89.60%, REC 81.96%, and F1-Score of 83.37%. The proposed KOC_Net model without SMOTE Tomek achieved the outcomes of 79.89% ACC, 77.85% PRE, 79.47% REC, 72.28% F1-Score, and 77.99% AUC. However, the proposed KOC_Net model with SMOTE Tomek attained the highest results of 96.51% ACC, 90.25% PRE, 91.95% REC, 96.70% F1-Score, and 95.71% AUC. Figure 8 shows the graphical representation of the proposed model with and without SMOTE Tomek, and other baseline models.
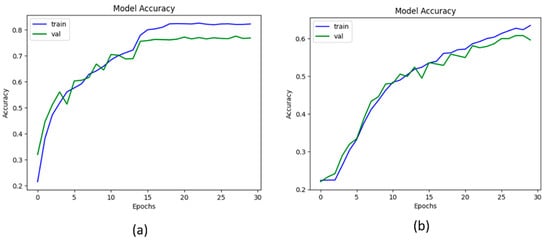
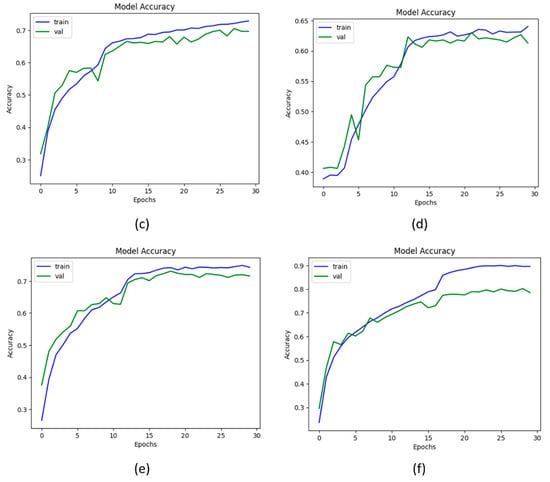
Figure 8.
Representation of results in terms of accuracy; (a) Vgg-19, (b) XceptionNet, (c) DenseNet-169, (d) Inception-V3, (e) KOC_Net model without SMOTE Tomek, and (f) KOC_Net model with SMOTE Tomek.
4.2.2. Results of the KOC_Net Model in Terms of AUC
For this study, the AUC is used to measure the ability of the model to distinguish between the KOA classes. The high value of AUC shows that the model is performing significantly while distinguishing the positive and negative classes. Thus, to determine the efficacy of the proposed KOC_Net model, a comparison has been performed. The Vgg-19, XceptionNet, DenseNet-169, and Inception-V3 attain the AUC of 84.24%, 85.21%, 85.58%, and 80.53%, respectively. The proposed KOC_Net model without SMOTE Tomek achieves the AUCH of 77.99%. The highest AUC of 95.71% was achieved by the proposed KOC_Net with SMOTE Tomek. The results reveal that the proposed KOC_Net model with SMOTE Tomek performs better than other approaches discussed in this study. The detailed results of the AUC of these models are presented in Figure 9.
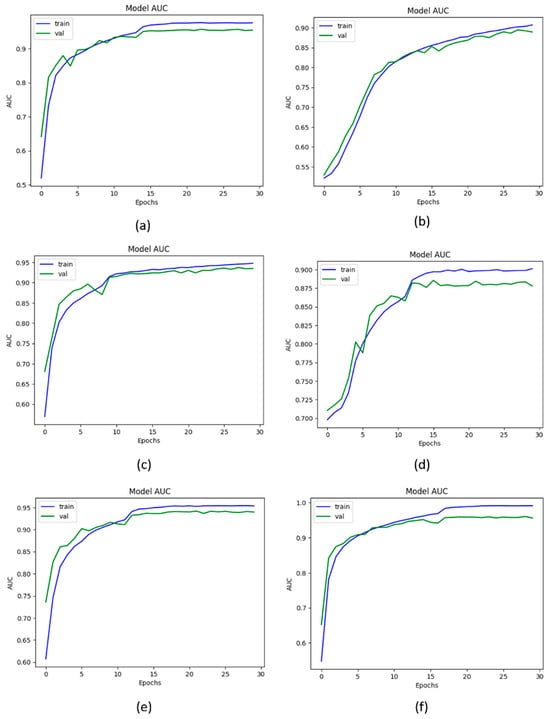
Figure 9.
Representation of results in terms of AUC; (a) Vgg-19, (b) XceptionNet, (c) DenseNet-169, (d) Inception-V3, (e) KOC_Net model without SMOTE Tomek, and (f) KOC_Net model with SMOTE Tomek.
4.2.3. Results of the KOC_Net Model in Terms of Precision
The parameter precision is used to calculate positive predictions made by the model. The higher the value of precision shows that the model makes fewer false positive predictions. Figure 10 shows the graphical representation of the precision value obtained by the proposed KOC_Net model and other baseline models. The results show that Vgg-19 attains a precision of 88.91%. The DenseNet-169 and XceptionNet achieved a precision of 89.17% and 88.73%, respectively. The inception-V3 attains 89.60% precision. Additionally, the result obtained by the KOC_Net model without SMOTE Tomek is 77.85%. The higher precision value of 90.25% was attained by the proposed KOC_Net model with SMOTE Tomek.
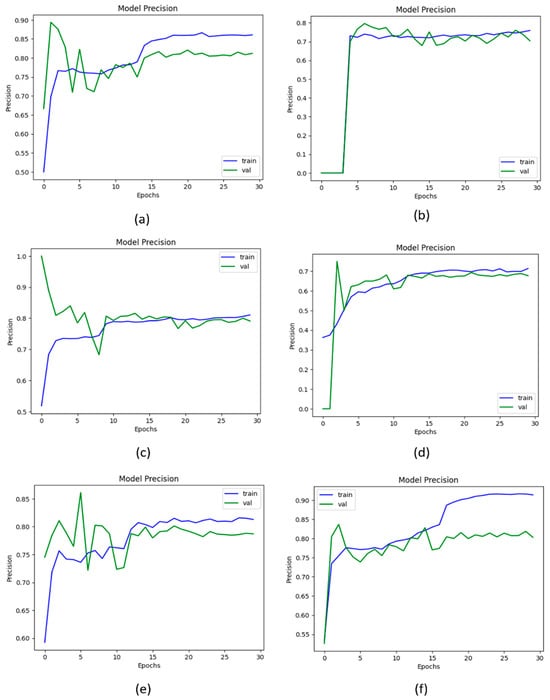
Figure 10.
Representation of results in terms of precision; (a) Vgg-19, (b) XceptionNet, (c) DenseNet-169, (d) Inception-V3, (e) Proposed KOC_Net model without SMOTE Tomek, and (f) Proposed KOC_Net model with SMOTE Tomek.
4.2.4. Results of the KOC_Net Model in Terms of Recall
The metric recall is used to measure the correct identification of true positives from all the actual positive knee image samples of the KOA dataset. Figure 11 illustrates the recall curve data that were employed in the process of evaluating the proposed KOC_Net model in comparison to Vgg-19, Inception-V3, XceptionNet, and DenseNet-169. The proposed KOC_Net model without SMOTE achieves a recall of 79.47%. The Vgg-19, DenseNet-169, XceptionNet, and Inception-V3 attains the recall of 82.66%, 89.93%, 85.41%, and 81.96%, respectively. The highest recall of 91.95% was attained by the proposed KOC_Net model with SMOTE Tomek.
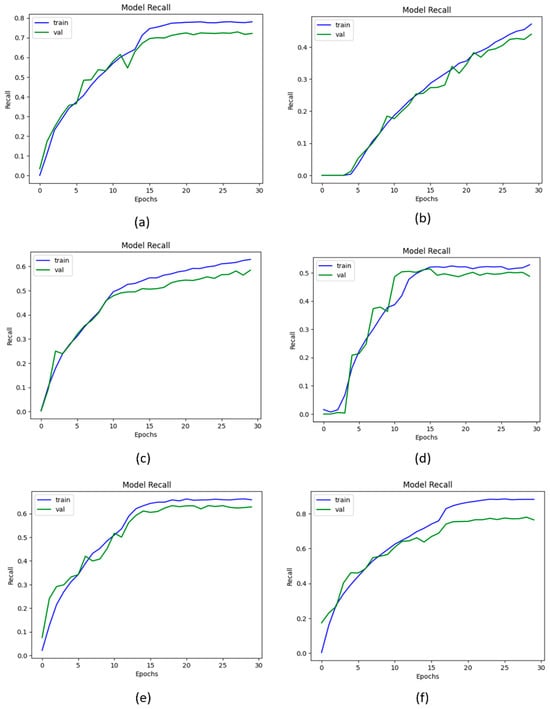
Figure 11.
Outcomes of recall; (a) Vgg-19, (b) XceptionNet, (c) DenseNet-169, (d) Inception-V3, (e) Proposed KOC_Net model without SMOTE Tomek, and (f) Proposed KOC_Net model with SMOTE Tomek.
4.2.5. Results of the KOC_Net Model in Terms of F1-Score
The metric F1-Score is used to measure the harmonic means of precision and recall. The high F1-Score represents that the model performs significantly in classifying five classes of KOA. The highest F1-Score of 96.70% was achieved by the proposed KOC_Net model with SMOTE Tomek. The other models Vgg-19, DenseNet-169, XceptionNet, and Inception-V3 attains the F1-Score of 81.46%, 88.73%, 81.11%, and 83.37%, respectively. The lowest 72.28% F1-Score was achieved by the KOC_Net model without SMOTE Tomek. The results obtained by these models in terms of F1-Score are depicted in Figure 12.
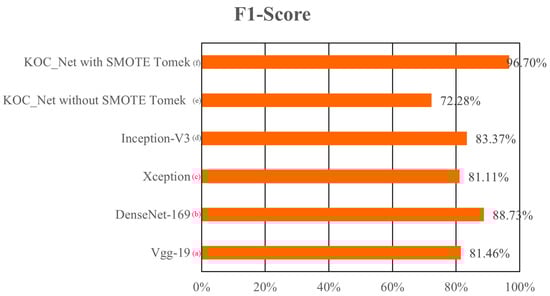
Figure 12.
Comparison of the F1-Score of the proposed model with baseline models; (a) Vgg-19, (b) XceptionNet, (c) DenseNet-169, (d) Inception-V3, (e) KOC_Net model without SMOTE Tomek, and (f) KOC_Net model with SMOTE Tomek.
4.2.6. Results of the KOC_Net Model in Terms of Loss
The loss function represents the numerical difference between the actual and predicted values. The categorial cross-entropy loss function is used in this study to calculate the loss. The Vgg-19, DenseNet-169, XceptionNet, and Inception-V3, produced the loss values of 0.6321%, 0.6501%, 0.6155%, and 0.8537%, respectively. The proposed KOC_Net model with SMOTE Tomek produces a loss of 0.5885%. The graphical representation of the loss curve obtained by these models is presented in Figure 13.
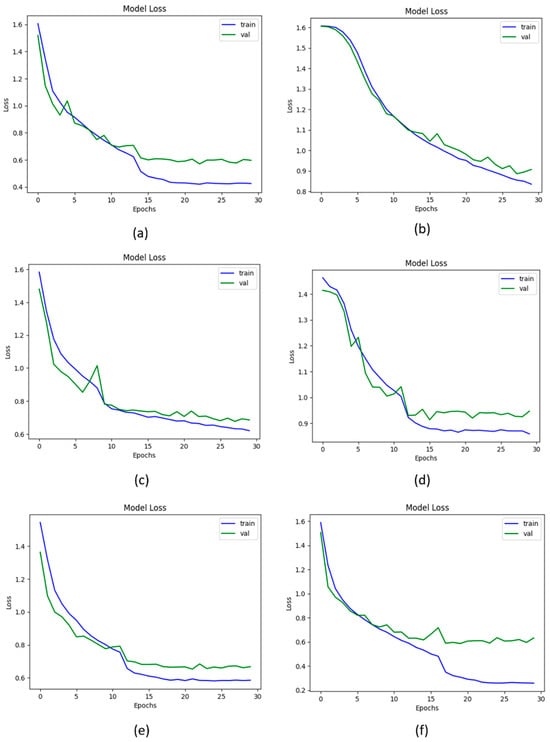
Figure 13.
Loss of proposed and baseline models; (a) Vgg-19, (b) XceptionNet, (c) DenseNet-169, (d) Inception-V3, (e) KOC_Net model without SMOTE Tomek, and (f) KOC_Net model with SMOTE Tomek.
4.2.7. Results of the KOC_Net Model in Terms of ROC
ROC curves are graphs showing the performance of the proposed KOC_Net model and baseline models by plotting the TP rate and FP rate. The ROC values for the proposed KOC_Net with and without SMOTE Tomek were 1.00 and 0.7105, respectively. The Vgg-19, DenseNet-169, XceptionNet, and Inception-V3 were 0.7587, 0.7365, 0.7423, and 0.6817, respectively. The ROC curve in Figure 14 demonstrates that the suggested KOC_Net model performs much better than other competitive approaches used in this study.
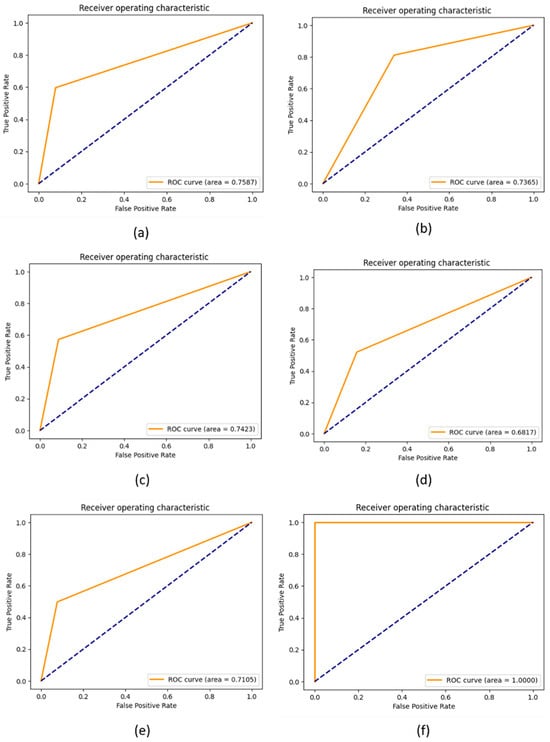
Figure 14.
Representation of results in terms of ROC; (a) Vgg-19, (b) XceptionNet, (c) DenseNet-169, (d) Inception-V3, (e) Proposed KOC_Net model without SMOTE Tomek, and (f) Proposed KOC_Net model with SMOTE Tomek.
4.2.8. AU(ROC) for Multi-Class Evaluation Using Proposed KOC_Net Model
A comparison between the proposed KOC_Net model and four baseline deep models is illustrated in Figure 15 through the extension of the ROC curve. As shown in Figure 15 demonstrated a significant enhancement when the dataset was balanced utilizing the SMOTE Tomek method. The proposed KOC_Net model demonstrated a significant effect on the AUC for all classes. When there is an increase in AUC, it indicates that the feature selection that was carried out by KOC_Net has reached a high level of accuracy.
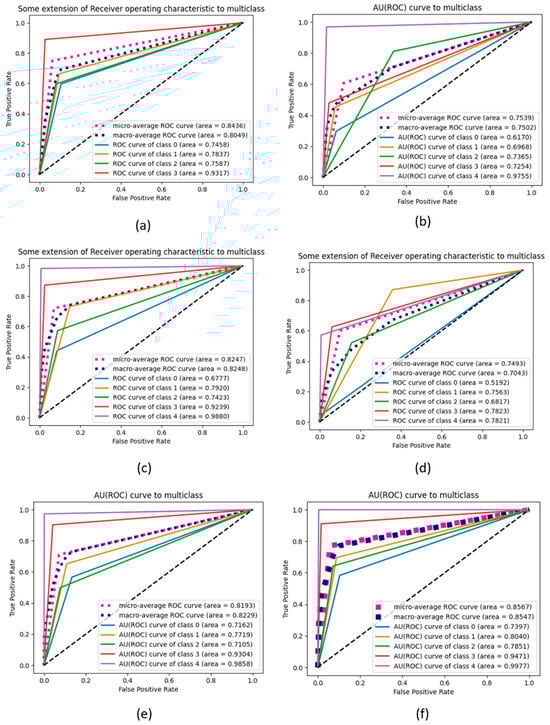
Figure 15.
Representation of results in terms of AU (ROC); (a) Vgg-19, (b) XceptionNet, (c) DenseNet-169, (d) Inception-V3, (e) Proposed KOC_Net model without SMOTE Tomek, and (f) Proposed KOC_Net model with SMOTE Tomek.
To validate our proposed KOC_Net model, we conducted a comparison with four other models utilizing a confusion matrix. The KOC_Net model is significantly improved through the integration of SMOTE Tomek, as depicted in Figure 16.
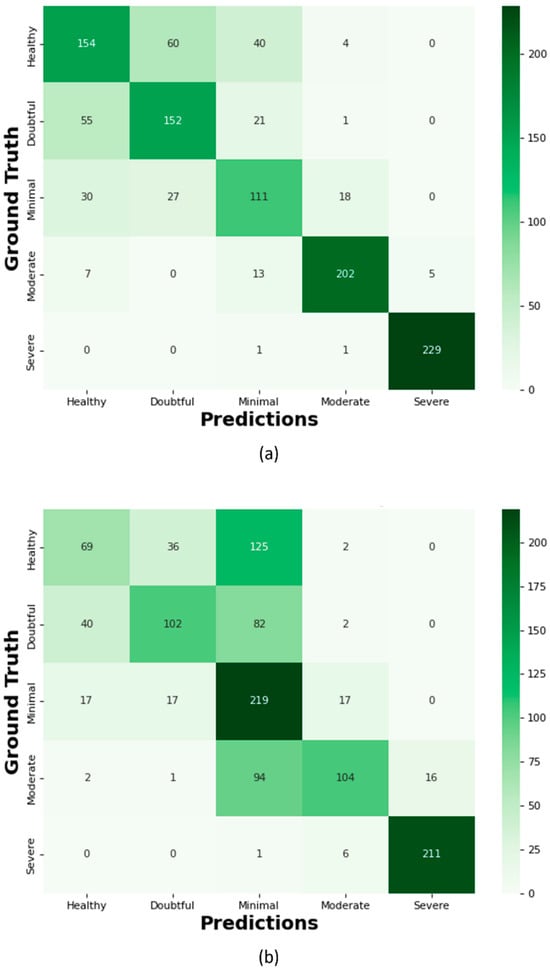
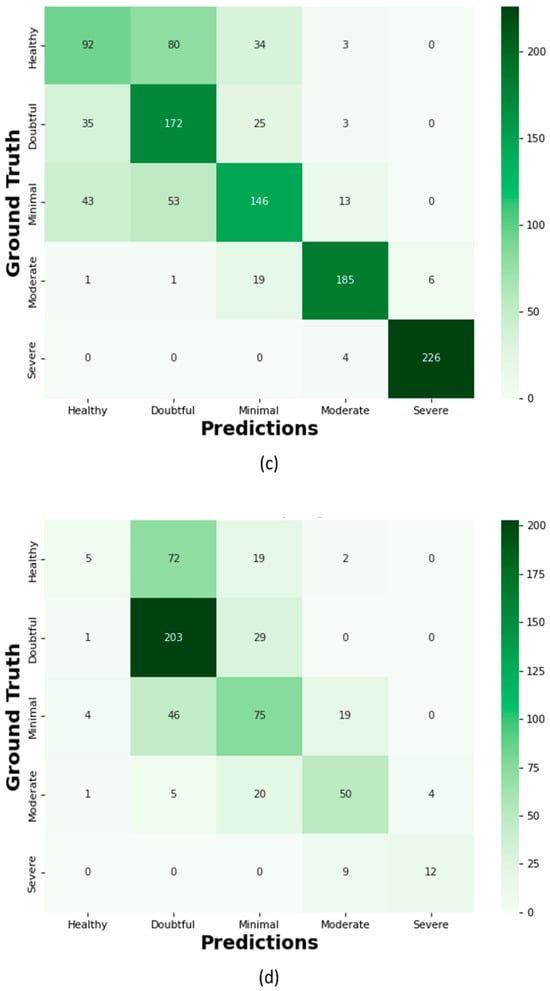
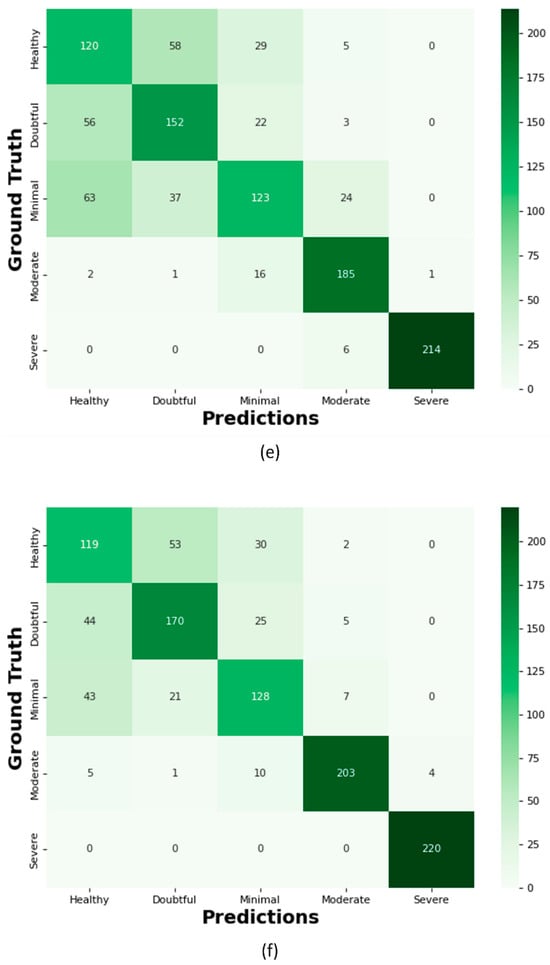
Figure 16.
Confusion Matrix; (a) Proposed KOC_Net model with SMOTE Tomek, (b) Vgg-19, (c) XceptionNet, (d) KOC_Net model without SMOTE Tomek, (e) Inception-V3, and (f) DenseNet-169.
The proposed KOC_Net model correctly classifies the 154 images as Healthy, 152 cases as Doubtful, 111 images as Minimal, 202 cases as Moderate, and 229 cases are Severe. Out of a total of 209 images, the XceptionNet correctly categorizes 92 images as Healthy cases, misclassifying 80 images as Doubtful, 34 images as Minimal, and 3 images as Moderate. Additionally, 172 Doubtful images out of 235 total images were correctly classified as Doubtful, while 35 were incorrectly identified as Healthy, 25 as Minimal, and 3 as Moderate. As presented in Figure 16d, the proposed KOC_Net model without SMOTE Tomek correctly classifies 5 cases as Healthy and inaccurate classifying 72 cases as Doubtful and 19 cases as Minimal. Additionally, 203 cases of Doubtful were accurately classified, and 29 and 01 cases as Minimal and Healthy, respectively were misclassified. However, the proposed KOC_Net model without SMOTE Tomek correctly classifies the 50 cases as Moderate and 12 cases as Severe. Next, we visualize the output of the proposed KOC_Net model with SMOTE Tomek using the Grad-CAM heatmap technique. The goal of the heatmap is to highlight the KOA area based on KL severity grading. Figure 17 demonstrates the heatmap of the proposed KOC_Net.
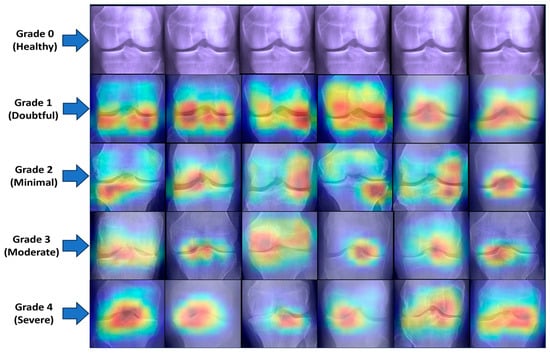
Figure 17.
Visualization of the infected region of KOA using GRAD-CAM. The first rows represent the Healthy images and the remaining rows from Grade 1 to Grade 4 highlight the infected region of KOA by using the proposed KOC_net model.
4.3. Comparison of Proposed KOC_Net Model with State-of-the-Arts
This section presents a comprehensive comparison of the proposed KOC_Net model with recent studies [14,43,44,45,46,64,65,66]. The comparison of the proposed model has been performed in terms of several metrics as presented in Table 6.
Table 6.
Performance comparison of the proposed KOC_Net model with prior studies.
4.4. Discussions
X-ray images are commonly used in the detection and categorization of an extensive range of KOAs. Several studies [11,13,14,33,62,65,66,74,75,76] use knee X-rays for the identification of KOA severity. Due to KOA severity grading, the diagnosis of KOA is a time-consuming process. If KOA is not diagnosed in its initial grading, a patient may face Severe complications. Therefore, this study proposed a KOC_Net model that automatically classifies the KOA into their respective grades by using the KL grading severity system. For this work, two publicly benchmark KOA datasets were used for training the proposed KOC_Net model. The imbalance classes of the dataset were balanced by the SMOTE Tomek method. The pseudocode of the SMOTE Tomek was presented in Algorithm 1. Several pre-processing methods were employed to enhance the KOA dataset as shown in Figure 3. The CLAHE method was also applied to increase the contrast of the image. The proposed KOC_Net model was trained on the enhanced dataset generated after pre-processing and the SMOTE Tomek method. The steps for executing the proposed KOC_Net model are presented in Algorithm 2.
The performance of the proposed KOC_Net model with and without using SMOTE Tomek was compared with four baseline models, i.e., Vgg-19, DenseNet-169, XceptionNet, and Inception-V3. The proposed KOC_Net model with SMOTE Tomek achieved the highest classification accuracy of 96.51%, while other models, Vgg-19, DenseNet-169, XceptionNet, and Inception-V3, attained accuracy of 81.08%, 84.97%, 87.06%, and 83.62%. A detailed comparison of the proposed model and baseline model is presented in Table 5. The results of Table 5 show that the proposed KOC_Net with SMOTE Tomek is more capable of identifying the KOA and extracting dominant discriminative patterns from knee X-rays, with the highest classification accuracy of 96.51%. Additionally, the results of the four baseline models were also presented in Table 4, and we also provide a detailed description of why recent studies show less performance in classifying the KOA-based KL grading severity. The reason is that the classification performance of four baseline pre-trained model has been restricted by their final ConvL due to their deep network [14,66]. The filter size in these baseline classifiers is inadequate because neurons connected to the input are so large it ignores the major elements from the KOA image. Additionally, the vanishing gradient problem occurred while training these four-baseline model due to their large number of layers. All these issues are resolved by using the KOC_Net model with SMOTE Tomek. A simplified structure of CNN layers is introduced in the KOC_Net model which prevents the model from gradient vanishing. Moreover, fewer training parameters are generated by the proposed KOC_Net model which also reduces the complexity of the model.
Table 6 presents the comprehensive comparison of the proposed KOC_Net model with state-of-the-art classifiers. Cueva et al. [65] designed a CNN model for the classification of KOA and they achieved the classification accuracy of 61.00%. The study [14] developed a CNN model for the diagnosis of KOA. Their model achieved a classification accuracy of 95.12% in identifying the KOA of three grades. It is also observed that recall attained in this work is lower compared to the findings [14]. The reason for this is the study [14] focused on 03 classes, while we increased the number of classes to 05. Recall measures the ability to identify positive instances, and as we expanded the number of classes, the recall value decreased in our case. Additionally, Kumar et al. [46] and Touahema et al. [43] designed a CNN model and achieved an accuracy of 91.03% and 94.94%, respectively. The proposed KOC_Net model with SMOTE Tomek attains a classification accuracy of 96.51%, which is superior to state-of-the-art classifiers.
5. Conclusions and Future Work
KOA is rated by a grading system according to the extent of joint degeneration. The KL grading scale is used to identify the stage of KOA. Therefore, this study proposed the KOC_Net model for the classification of KOA using KL grading X-rays. For this work, each convolutional block of the KOC_Net model contained multiple layers to classify the KOA. Several pre-processing steps such as were applied to enhance the KOA dataset. Moreover, the imbalance distribution of the images in the KOA dataset was resolved by using SMOTE Tomek. Grad-CAM shows a heat map of class activation to demonstrate the operation of the proposed KOC_Net model with SMOTE Tomek. The proposed KOC_Net model with SMOTE Tomek achieved 96.51% ACC, 96.51% REC, 96.70% F1-Score, 90.25% PRE, and 95.71% AUC. Thus, it is concluded that the proposed model with SMOTE Tomek provides great assistance to orthopedics in making diagnoses of KOA. A limitation of the study is that the KOC_Net model is not suitable for other medical imaging such as CT, MRI, sonography, etc. Therefore, in the future, we will train and test the KOC_Net on CT scans and MRI images. Additionally, we would also use a federated learning method to preserve patient data privacy while performing the classification of KOA.
Author Contributions
Conceptualization, S.N.H. and M.K.; methodology, M.K., H.S. and R.A.N.; validation, R.A.N., D.J. and S.-W.L.; formal analysis, S.N.H. and H.S.; investigation, S.N.H. and R.A.N.; resources, R.A.N., D.J. and S.-W.L.; data curation, S.N.H.; writing—original draft preparation, S.N.H., M.K. and H.S.; writing—review and editing, R.A.N., D.J. and S.-W.L.; visualization, M.K. and H.S.; supervision, D.J., R.A.N. and S.-W.L.; funding acquisition, S.-W.L. All authors have read and agreed to the published version of the manuscript.
Funding
This work was supported by a National Research Foundation (NRF) grant funded by the Ministry of Science and ICT (MSIT), Republic of Korea, through the Development Research Program NRF[2022-R1-G1A1(010226)]; NRF[2021-R1-I1A2(059735)]; RS[2024-0040(5650)]; RS[2024-0044(0881)]; and RS[2019-II19(0421)].
Data Availability Statement
The original contributions presented in the study are included in the article, further inquiries can be directed to the corresponding authors.
Conflicts of Interest
Authors declare no conflict of interest.
References
- Conaghan, P.G.; Porcheret, M.; Kingsbury, S.R.; Gammon, A.; Soni, A.; Hurley, M.; Rayman, M.P.; Barlow, J.; Hull, R.G.; Cumming, J.; et al. Impact and therapy of osteoarthritis: The Arthritis Care OA Nation 2012 survey. Clin. Rheumatol. 2015, 34, 1581–1588. [Google Scholar] [CrossRef] [PubMed]
- Vriezekolk, J.; Peters, Y.A.S.; Steegers, M.A.H.; Davidson, E.N.B.; Ende, C.H.M.V.D. Pain descriptors and determinants of pain sensitivity in knee osteoarthritis: A community-based cross-sectional study. Rheumatol. Adv. Pract. 2022, 6, rkac016. [Google Scholar] [CrossRef] [PubMed]
- Ortman, J.M.; Velkoff, V.A.; Hogan, H. An Aging Nation: The Older Population in the United States; P25-1140; United States Census Bureau: Suitland, MD, USA, 2014. [Google Scholar]
- Kellgren, J.H.; Lawrence, J.S. Radiological assessment of osteo-arthrosis. Ann. Rheum. Dis. 1957, 16, 494–502. [Google Scholar] [CrossRef]
- Culvenor, A.G.; Engen, C.N.; Øiestad, B.E.; Engebretsen, L.; Risberg, M.A. Defining the presence of radiographic knee osteoarthritis: A comparison between the Kellgren and Lawrence system and OARSI atlas criteria. Knee Surg. Sports Traumatol. Arthrosc. 2015, 23, 3532–3539. [Google Scholar] [CrossRef]
- Ilahi, O.A. International Knee Documentation Committee Radiographic Knee Joint Grading More Reliable Than Kellgren-Lawrence Grading and Other Grading Systems. Arthroscopy: J. Arthrosc. Relat. Surg. 2024, 40, 1716–1719. [Google Scholar] [CrossRef]
- Niu, Z.; Zhou, M.; Wang, L.; Gao, X.; Hua, G. Ordinal regression with multiple output CNN for age estimation. In Proceedings of the 2016 IEEE Conference on Computer Vision and Pattern Recognition (CVPR), Las Vegas, NV, USA, 27–30 June 2016; pp. 4920–4928. [Google Scholar]
- Shamir, L.; Ling, S.M.; Scott, W.W.; Bos, A.; Orlov, N.; Macura, T.J.; Eckley, D.M.; Ferrucci, L.; Goldberg, I.G. Knee X-Ray Image Analysis Method for Automated Detection of Osteoarthritis. IEEE Trans. Biomed. Eng. 2009, 56, 407–415. [Google Scholar] [CrossRef]
- Liu, W.; Ge, T.; Luo, L.; Peng, H.; Xu, X.; Chen, Y.; Zhuang, Z. A Novel Focal Ordinal Loss for Assessment of Knee Osteoarthritis Severity. Neural Process. Lett. 2022, 54, 5199–5224. [Google Scholar] [CrossRef]
- Antony, J.; McGuinness, K.; O’Connor, N.E.; Moran, K. Quantifying radiographic knee osteoarthritis severity using deep convolutional neural networks. In Proceedings of the 2016 23rd International Conference on Pattern Recognition (ICPR), Cancun, Mexico, 4–8 December 2016; pp. 1195–1200. [Google Scholar]
- Thomas, K.A.; Kidzin’ski, L.; Halilaj, E.; Fleming, S.L.; Venkataraman, G.R.; Oei, E.H.G.; Gold, G.E.; Delp, S.L. Automated Classification of Radiographic Knee Osteoarthritis Severity Using Deep Neural Networks. Radiol. Artif. Intell. 2020, 2, e190065. [Google Scholar] [CrossRef] [PubMed]
- Messaoudene, K.; Harrar, K. A Hybrid LBP-HOG Model and Naive Bayes Classifier for Knee Osteoarthritis Detection: Data from the Osteoarthritis Initiative. In International Conference on Artificial Intelligence and Its Applications; Springer International Publishing: Cham, Switzerland, 2021; pp. 458–467. [Google Scholar]
- Chen, P.; Gao, L.; Shi, X.; Allen, K.; Yang, L. Fully Automatic Knee Osteoarthritis Severity Grading Using Deep Neural Networks with a Novel Ordinal Loss. Comput. Med. Imaging Graph. 2019, 75, 84. [Google Scholar] [CrossRef]
- Abdullah, S.S.; Rajasekaran, M.P. Automatic detection and classification of knee osteoarthritis using deep learning approach. Radiol. Med. 2022, 127, 398–406. [Google Scholar] [CrossRef]
- Antony, J.; McGuinness, K.; Moran, K.; O’Connor, N.E. Automatic Detection of Knee Joints and Quantification of Knee Osteoarthritis Severity using Convolutional Neural Networks. In Machine Learning and Data Mining in Pattern Recognition; Lecture Notes in Computer Science; Springer: Cham, Switzerland, 2017; Volume 10358, pp. 376–390. [Google Scholar]
- Mori, Y.; Oichi, T.; Enomoto-Iwamoto, M.; Saito, T. Automatic detection of medial and lateral compartments from histological sections of mouse knee joints using the single-shot multibox detector algorithm. Cartilage 2022, 13, 19476035221074009. [Google Scholar] [CrossRef] [PubMed]
- Roth, H.R.; Oda, H.; Zhou, X.; Shimizu, N.; Yang, Y.; Hayashi, Y.; Oda, M.; Fujiwara, M.; Misawa, K.; Mori, K. An application of cascaded 3D fully convolutional networks for medical image segmentation. Comput. Med. Imaging Graph. 2018, 66, 90–99. [Google Scholar] [CrossRef] [PubMed]
- Zhang, Y.; Kortylewski, A.; Liu, Q.; Park, S.; Green, B.; Engle, E.; Yuille, A. A Light-weight Interpretable Compositional Network for Nuclei Detection and Weakly-supervised Segmentation. arXiv 2021, arXiv:2110.13846. [Google Scholar]
- Tiulpin, A.; Thevenot, J.; Rahtu, E.; Saarakkala, S. A novel method for automatic localization of joint area on knee plain radiographs. In Image Analysis; Lecture Notes in Computer Science; Springer: Cham, Switzerland, 2017; Volume 10270, pp. 290–301. [Google Scholar]
- Lakshmanan, B.; Priyadharsini, S.; Selvakumar, B. Computer assisted mitotic figure detection in histopathology images based on DenseNetPCA framework. Mater. Today Proc. 2022, 62, 4936–4939. [Google Scholar] [CrossRef]
- Xie, Y.; Zhan, N.; Zhu, J.; Xu, B.; Chen, H.; Mao, W.; Luo, X.; Hu, Y. Landslide extraction from aerial imagery considering context association characteristics. Int. J. Appl. Earth Obs. Geoinf. 2024, 131, 103950. [Google Scholar] [CrossRef]
- Xu, W.; Feng, Z.; Wan, Q.; Xie, Y.; Feng, D.; Zhu, J.; Liu, Y. Building Height Extraction From High-Resolution Single-View Remote Sensing Images Using Shadow and Side Information. IEEE J. Sel. Top. Appl. Earth Obs. Remote Sens. 2024, 17, 6514–6528. [Google Scholar] [CrossRef]
- Cao, S.; Feng, D.; Liu, S.; Xu, W.; Chen, H.; Xie, Y.; Zhang, H.; Pirasteh, S.; Zhu, J. BEMRF-Net: Boundary enhancement and multiscale refinement fusion for building extraction from remote sensing imagery. IEEE J. Sel. Top. Appl. Earth Obs. Remote Sens. 2024, 17, 16342–16358. [Google Scholar] [CrossRef]
- Zhu, J.; Zhang, J.; Chen, H.; Xie, Y.; Gu, H.; Lian, H. A cross-view intelligent person search method based on multi-feature constraints. Int. J. Digit. Earth 2024, 17, 2346259. [Google Scholar] [CrossRef]
- Jiang, Z.; Zhang, H.; Wang, Y.; Ko, S.B. Retinal blood vessel segmentation using fully convolutional network with transfer learning. Comput. Med. Imaging Graph. 2018, 68, 1–15. [Google Scholar] [CrossRef]
- Yong, C.W.; Teo, K.; Murphy, B.P.; Hum, Y.C.; Tee, Y.K.; Xia, K.; Lai, K.W. Knee osteoarthritis severity classification with ordinal regression module. Multimed. Tools Appl. 2021, 81, 41497–41509. [Google Scholar] [CrossRef]
- Von Tycowicz, C. Towards shape-based knee osteoarthritis classification using graph convolutional networks. In Proceedings of the 2020 IEEE 17th International Symposium on Biomedical Imaging (ISBI), Iowa City, IA, USA, 3–7 April 2020; pp. 750–753. [Google Scholar]
- Kwon, S.B.; Han, H.S.; Lee, M.C.; Kim, H.C.; Ku, Y. Machine learning-based automatic classification of knee osteoarthritis severity using gait data and radiographic images. IEEE Access 2020, 8, 120597–120603. [Google Scholar] [CrossRef]
- Gornale, S.S.; Patravali, P.U.; Hiremath, P.S. Automatic Detection and Classification of Knee Osteoarthritis Using Hu’s Invariant Moments. Front. Robot. AI 2020, 7, 591827. [Google Scholar] [CrossRef] [PubMed]
- Kokkotis, C.; Moustakidis, S.; Papageorgiou, E.; Giakas, G.; Tsaopoulos, D.E. Machine learning in knee osteoarthritis: A review. Osteoarthr. Cartil. Open 2020, 2, 100069. [Google Scholar] [CrossRef] [PubMed]
- Saleem, M.; Farid, M.S.; Saleem, S.; Khan, M.H. X-ray image analysis for automated knee osteoarthritis detection. Signal Image Video Process. 2020, 14, 1079–1087. [Google Scholar] [CrossRef]
- Nasser, Y.; Jennane, R.; Chetouani, A.; Lespessailles, E.; El Hassouni, M. Discriminative Regularized Auto-Encoder for early detection of knee osteoarthritis: Data from the osteoarthritis initiative. IEEE Trans. Med. Imaging 2020, 39, 2976–2984. [Google Scholar] [CrossRef]
- Brahim, A.; Jennane, R.; Riad, R.; Janvier, T.; Khedher, L.; Toumi, H.; Lespessailles, E. A decision support tool for early detection of knee OsteoArthritis using X-ray imaging and machine learning: Data from the OsteoArthritis Initiative. Comput. Med. Imaging Graph. 2019, 73, 11–18. [Google Scholar] [CrossRef]
- Jakaite, L.; Schetinin, V.; Hladůvka, J.; Minaev, S.; Ambia, A.; Krzanowski, W. Deep learning for early detection of pathological changes in X-ray bone microstructures: Case of osteoarthritis. Sci. Rep. 2021, 11, 2294. [Google Scholar] [CrossRef] [PubMed]
- Lim, J.; Kim, J.; Cheon, S. A deep neural network-based method for early detection of osteoarthritis using statistical data. Int. J. Environ. Res. Public Health 2019, 16, 1281. [Google Scholar] [CrossRef]
- Kundu, S.; Ashinsky, B.G.; Bouhrara, M.; Dam, E.B.; Demehri, S.; Shifat-E-Rabbi, M.; Rohde, G.K. Enabling early detection of osteoarthritis from presymptomatic cartilage texture maps via transport-based learning. Proc. Natl. Acad. Sci. USA 2020, 117, 24709–24719. [Google Scholar] [CrossRef]
- Yunus, U.; Amin, J.; Sharif, M.; Yasmin, M.; Kadry, S.; Krishnamoorthy, S. Recognition of Knee Osteoarthritis (KOA) Using YOLOv2 and Classification Based on Convolutional Neural Network. Life 2022, 12, 1126. [Google Scholar] [CrossRef]
- Wang, Y.; Li, S.; Zhao, B.; Zhang, J.; Yang, Y.; Li, B. A ResNet-based approach for accurate radiographic diagnosis of knee osteoarthritis. CAAI Trans. Intell. Technol. 2022, 7, 512–521. [Google Scholar] [CrossRef]
- Leung, K.; Zhang, B.; Tan, J.; Shen, Y.; Geras, K.J.; Babb, J.S.; Deniz, C.M. Prediction of total knee replacement and diagnosis of osteoarthritis by using deep learning on knee radiographs: Data from the osteoarthritis initiative. Radiology 2020, 296, 584. [Google Scholar] [CrossRef] [PubMed]
- Guan, B.; Liu, F.; Mizaian, A.H.; Demehri, S.; Samsonov, A.; Guermazi, A.; Kijowski, R. Deep learning approach to predict pain progression in knee osteoarthritis. Skelet. Radiol. 2022, 51, 363–373. [Google Scholar] [CrossRef]
- Tiulpin, A.; Thevenot, J.; Rahtu, E.; Lehenkari, P.; Saarakkala, S. Automatic knee osteoarthritis diagnosis from plain radiographs: A deep learning-based approach. Sci. Rep. 2018, 8, 1727. [Google Scholar] [CrossRef]
- Nelson, A.E.; Fang, F.; Arbeeva, L.; Cleveland, R.J.; Schwartz, T.A.; Callahan, L.F.; Loeser, R.F. A machine learning approach to knee osteoarthritis phenotyping: Data from the FNIH Biomarkers Consortium. Osteoarthr. Cartil. 2019, 27, 994–1001. [Google Scholar] [CrossRef]
- Touahema, S.; Zaimi, I.; Zrira, N.; Ngote, M.N.; Doulhousne, H.; Aouial, M. MedKnee: A New Deep Learning-Based Software for Automated Prediction of Radiographic Knee Osteoarthritis. Diagnostics 2024, 14, 993. [Google Scholar] [CrossRef]
- Khalid, A.; Senan, E.M.; Al-Wagih, K.; Ali Al-Azzam, M.M.; Alkhraisha, Z.M. Hybrid Techniques of X-ray Analysis to Predict Knee Osteoarthritis Grades Based on Fusion Features of CNN and Handcrafted. Diagnostics 2023, 13, 1609. [Google Scholar] [CrossRef] [PubMed]
- Messaoudene, K.; Harrar, K. Computerized diagnosis of knee osteoarthritis from X-ray images using combined texture features: Data from the osteoarthritis initiative. Int. J. Imaging Syst. Technol. 2024, 34, e23063. [Google Scholar] [CrossRef]
- Goswami, A.D. Automatic classification of the severity of knee osteoarthritis using enhanced image sharpening and CNN. Appl. Sci. 2023, 13, 1658. [Google Scholar] [CrossRef]
- Feng, Y.; Liu, J.; Zhang, H.; Qiu, D. Automated grading of knee osteoarthritis X-ray images based on attention mechanism. In Proceedings of the 2021 IEEE International Conference on Bioinformatics and Biomedicine (BIBM), Houston, TX, USA, 9–12 December 2021; pp. 1927–1932. [Google Scholar]
- Chan, S.; Dittakan, K.; El Salhi, S. Osteoarthritis detection by applying quadtree analysis to human joint knee X-ray imagery. Int. J. Comput. Appl. 2022, 44, 571–578. [Google Scholar] [CrossRef]
- Tariq, T.; Suhail, Z.; Nawaz, Z. Knee Osteoarthritis Detection and Classification using X-rays. IEEE Access 2023, 11, 48292–48303. [Google Scholar] [CrossRef]
- Mononen, M.E.; Liukkonen, M.K.; Turunen, M.J. X-ray with finite element analysis is a viable alternative for MRI to predict knee osteoarthritis: Data from the Osteoarthritis Initiative. J. Orthop. Res.® 2024, 42, 1964–1973. [Google Scholar] [CrossRef] [PubMed]
- Zhang, B.; Tan, J.; Cho, K.; Chang, G.; Deniz, C.M. Attention-based cnn for kl grade classification: Data from the osteoarthritis initiative. In Proceedings of the 2020 IEEE 17th International Symposium on Biomedical Imaging (ISBI), Iowa City, IA, USA, 3–7 April 2020; pp. 731–735. [Google Scholar]
- Abedin, J.; Antony, J.; McGuinness, K.; Moran, K.; O’Connor, N.E.; Rebholz-Schuhmann, D.; Newell, J. Predicting knee osteoarthritis severity: Comparative modeling based on patient’s data and plain X-ray images. Sci. Rep. 2019, 9, 5761. [Google Scholar] [CrossRef] [PubMed]
- Patil, P.; Gala, R.; Shah, M.; Salvi, P. ARTHRO—Knee Osteoarthritis Detection Using Deep Learning. In International Conference on Data Science and Applications; Springer Nature: Singapore, 2023; pp. 183–194. [Google Scholar]
- Bayramoglu, N.; Nieminen, M.T.; Saarakkala, S. Machine learning based texture analysis of patella from X-rays for detecting patellofemoral osteoarthritis. Int. J. Med. Inform. 2022, 157, 104627. [Google Scholar] [CrossRef]
- Tri Wahyuningrum, R.; Yasid, A.; Jacob Verkerke, G. Deep neural networks for automatic classification of knee osteoarthritis severity based on X-ray images. In Proceedings of the 2020 8th International Conference on Information Technology: IoT and Smart City, Xi’an, China, 25–27 December 2020; pp. 110–114. [Google Scholar]
- Anifah, L.; Purnama, I.K.E.; Hariadi, M.; Purnomo, M.H. Osteoarthritis classification using self organizing map based on gabor kernel and contrast-limited adaptive histogram equalization. Open Biomed. Eng. J. 2013, 7, 18. [Google Scholar] [CrossRef]
- Awan, M.J.; Rahim, M.S.M.; Salim, N.; Rehman, A.; Nobanee, H.; Shabir, H. Improved deep convolutional neural network to classify osteoarthritis from anterior cruciate ligament tear using magnetic resonance imaging. J. Pers. Med. 2021, 11, 1163. [Google Scholar] [CrossRef]
- Sen, W.; Xing, Y.; Zhang, L.; Gao, H.; Zhang, H. Deep convolutional neural network for ulcer recognition in wireless capsule endoscopy: Experimental feasibility and optimization. Comput. Math. Methods Med. 2019, 2019, 7546215. [Google Scholar]
- Naeem, A.; Anees, T.; Khalil, M.; Zahra, K.; Naqvi, R.A.; Lee, S.W. SNC_Net: Skin Cancer Detection by Integrating Handcrafted and Deep Learning-Based Features Using Dermoscopy Images. Mathematics 2024, 12, 1030. [Google Scholar] [CrossRef]
- Wen, F.; David, A.K. A genetic algorithm based method for bidding strategy coordination in energy and spinning reserve markets. Artif. Intell. Eng. 2001, 15, 71–79. [Google Scholar] [CrossRef]
- Malik, H.; Naeem, A.; Naqvi, R.A.; Loh, W.K. DMFL_Net: A federated learning-based framework for the classification of COVID-19 from multiple chest diseases using X-rays. Sensors 2023, 23, 743. [Google Scholar] [CrossRef]
- Felson, D.T.; Naimark, A.; Anderson, J.; Kazis, L.; Castelli, W.; Meenan, R.F. The prevalence of knee osteoarthritis in the elderly. The Framingham Osteoarthritis Study. Arthritis Rheum. 1987, 30, 914–918. [Google Scholar] [CrossRef] [PubMed]
- Li, W.; Xiao, Z.; Liu, J.; Feng, J.; Zhu, D.; Liao, J.; Yu, W.; Qian, B.; Chen, X.; Fang, Y.; et al. Deep learning-assisted knee osteoarthritis automatic grading on plain radiographs: The value of multiview X-ray images and prior knowledge. Quant. Imaging Med. Surg. 2023, 13, 3587. [Google Scholar] [CrossRef] [PubMed]
- Mohammed, A.S.; Hasanaath, A.A.; Latif, G.; Bashar, A. Knee Osteoarthritis Detection and Severity Classification Using Residual Neural Networks on Preprocessed X-ray Images. Diagnostics 2023, 13, 1380. [Google Scholar] [CrossRef]
- Cueva, J.H.; Castillo, D.; Espinós-Morató, H.; Durán, D.; Díaz, P.; Lakshminarayanan, V. Detection and classification of knee osteoarthritis. Diagnostics 2022, 12, 2362. [Google Scholar] [CrossRef] [PubMed]
- Hengaju, U. Classification of Knee Osteoarthritis using CNN. Adv. Image Process. Pattern Recognit. 2022, 5, 25–38. [Google Scholar]
- Chawla, N.V.; Bowyer, K.W.; Hall, L.O.; Kegelmeyer, W.P. SMOTE: Synthetic minority over-sampling technique. J. Artif. Intell. Res. 2002, 16, 321–357. [Google Scholar] [CrossRef]
- Naeem, A.; Anees, T. DVFNet: A deep feature fusion-based model for the multiclassification of skin cancer utilizing dermoscopy images. PLoS ONE 2024, 19, e0297667. [Google Scholar] [CrossRef]
- Hui, H.; Wang, W.-Y.; Mao, B.-H. Borderline-SMOTE: A new over-sampling method in imbalanced data sets learning. In Proceedings of the Advances in Intelligent Computing: International Conference on Intelligent Computing, ICIC 2005, Hefei, China, 23–26 August 2005; pp. 878–887. [Google Scholar]
- Malik, H.; Bashir, U.; Ahmad, A. Multi-classification neural network model for detection of abnormal heartbeat audio signals. Biomed. Eng. Adv. 2022, 4, 100048. [Google Scholar] [CrossRef]
- Tahir, M.; Naeem, A.; Malik, H.; Tanveer, J.; Naqvi, R.A.; Lee, S.W. DSCC_Net: Multi-Classification Deep Learning Models for Diagnosing of Skin Cancer Using Dermoscopic Images. Cancers 2023, 15, 2179. [Google Scholar] [CrossRef]
- Hassaan, M.; Farooq, M.S.; Khelifi, A.; Abid, A.; Qureshi, J.N.; Hussain, M. A comparison of transfer learning performance versus health experts in disease diagnosis from medical imaging. IEEE Access 2020, 8, 139367–139386. [Google Scholar]
- Riaz, S.; Naeem, A.; Malik, H.; Naqvi, R.A.; Loh, W.K. Federated and Transfer Learning Methods for the Classification of Melanoma and Nonmelanoma Skin Cancers: A Prospective Study. Sensors 2023, 23, 8457. [Google Scholar] [CrossRef] [PubMed]
- Moustakidis, S.; Papandrianos, N.I.; Christodolou, E.; Papageorgiou, E.; Tsaopoulos, D. Dense Neural Networks in Knee Osteoarthritis Classification: A Study on Accuracy and Fairness. Neural Comput. Appl. 2020, 5, 21–33. [Google Scholar] [CrossRef]
- Lee, L.S.; Chan, P.K.; Wen, C.; Fung, W.C.; Cheung, A.; Chan, V.W.K.; Chiu, K.Y. Artificial intelligence in diagnosis of knee osteoarthritis and prediction of arthroplasty outcomes: A review. Arthroplasty 2022, 4, 16. [Google Scholar] [CrossRef] [PubMed]
- Wang, Y.; Wang, X.; Gao, T.; Du, L.; Liu, W. An Automatic Knee Osteoarthritis Diagnosis Method Based on Deep Learning: Data from the Osteoarthritis Initiative. J. Healthc. Eng. 2021, 2021, 5586529. [Google Scholar] [CrossRef]
Disclaimer/Publisher’s Note: The statements, opinions and data contained in all publications are solely those of the individual author(s) and contributor(s) and not of MDPI and/or the editor(s). MDPI and/or the editor(s) disclaim responsibility for any injury to people or property resulting from any ideas, methods, instructions or products referred to in the content. |
© 2024 by the authors. Licensee MDPI, Basel, Switzerland. This article is an open access article distributed under the terms and conditions of the Creative Commons Attribution (CC BY) license (https://creativecommons.org/licenses/by/4.0/).