Abstract
Human behaviour was tipped as the mainstay in the control of further SARS-CoV-2 (COVID-19) spread, especially after the lifting of restrictions by many countries. Countries in which restrictions were lifted soon after the first wave had subsequent waves of COVID-19 infections. In this study, we develop a deterministic model for COVID-19 that includes dynamic non-pharmaceutical interventions known as social dynamics with the goal of simulating the effects of dynamic social processes. The model steady states are determined and their stabilities analysed. The model has a disease-free equilibrium point that is locally asymptotically stable if The model exhibits a backward bifurcation, implying that reducing the reproduction number below one is not sufficient for the elimination of the disease. To ascertain the range of parameters that affect social dynamics, numerical simulations are conducted. The only wave in South Africa in which interventions were purely based on human behavior was the first wave. The model is thus fitted to COVID-19 data on the first wave in South Africa, and the findings given in this research have implications for the trajectory of the pandemic in the presence of evolving societal processes. The model presented has the potential to impact how social processes can be modelled in other infectious disease models.
Keywords:
COVID-19; mathematical modelling; stability; dynamic social processes; backward bifurcation; simulations MSC:
93A30; 93C15; 70G60
1. Introduction
COVID-19 has infected nearly 500 million people, and 6.2 million people have died as a result of the pandemic as of 8 April 2022 [1]. The COVID-19 outbreak is likely to be the largest pandemic of the 21st century, in terms of human lives lost [2]. While vaccines have resulted in some notable disease control, with declines in infected cases globally, there are currently very few specific medical interventions, and these are only in developed countries; see, for instance, [3]. For developing countries such as South Africa, classes of drugs that are mainly used include antiviral agents, inflammation inhibitors, low-molecular-weight heparins, plasma, and hyperimmune immunoglobulins [4]. In the absence of effective infection prevention and control measures, human behaviour that reduces or prevents exposure to the virus is key [5]. The challenges of COVID-19 to the global population are detailed in [6].
It is impossible to undervalue the part that mathematical models played in the dynamics of the COVID-19 infection. In order to control the global COVID-19 epidemic, many public health measures have been guided by mathematical models that, to a considerable degree, were regional or country-specific; see, for instance, [7,8] for Wuhan, China; [9] for Italy; [10,11] for Spain; [12,13] for the United Kingdom; [14] for Scotland; and [15,16] for the United States of America, to mention a few. Several scholars have also looked at the difficulties in modeling the worldwide pandemic; see, for instance, [17,18,19,20,21,22]. One of the biggest problems in modelling infectious diseases is the inclusion of human behaviour in the models. The role of human behaviour in modulating the spread and prevalence of COVID-19 was presented in [23] using the imitation dynamic approach of evolutionary game theory. Human behavior is a major factor in the spread of infectious illnesses, and creating and enhancing control methods requires an understanding of how behavior affects disease transmission [18,24,25]. Mathematical models that involve the determination of optimal control measures were considered in [26,27,28]. Environmental transmission and cost-effectiveness analysis for the epidemic in Ghana was considered in [29].
The interaction of community psycho-social processes and infection dynamics has been linked to the formation of multiple waves of COVID-19 [30,31]. The first waves of COVID-19, often referred to as the “herald waves”, see [32], have been followed by the second and third waves of the viral infection months after the initial episodes. As seen in earlier pandemics such as the influenza pandemics of 1918, 1957, 1968, and 2009, the succeeding waves have been more severe than the initial one [30].
In this paper, we explore the role of two important aspects in the dynamics of the pandemic that have evolved over time, i.e., information and non-pharmaceutical interventions (NPIs). NPIs that have involved aspects such as social distancing, the wearing of masks, and restrictions, generally known as "lockdowns", have been touted as the best measures to reduce the spread of COVID-19 during the start of the epidemic. The possible resurgence of other respiratory endemic infections due to the NPIs has been predicted in [33]. The aim of this paper is to investigate how time-dependent information translates into the growth or decline of NPIs that in turn impact the transmission of COVID-19. Many mathematical models have considered NPIs modelled by constant parameters; see, for instance, [34]. The work presented in this paper follows the research in [35], but unlike in [35] we focus on the long-term dynamics of the infection, the role of information, and its potential impact in influencing NPIs. The results presented in this paper have the potential to influence how dynamic social processes can be included in other epidemic models.
2. Mathematical Model
We consider a classical human model, coupled with behavioural state variables of susceptible individuals exposed individuals who are not yet infectious , infectious individuals who are either detected or undetected , and recovered individuals who are either recorded or unrecorded . The total human population is given by
The social processes at any time t are modelled by two state variables, and where models the information on the disease, mainly driven by the number of detected cases that are then reported in the media, and models the NPIs (personal hygiene, travel bans, mass gatherings bans, social distancing, curfews, and lockdowns) that are used to reduce transmission and are driven by the changes in the information on COVID-19. We assume that
The human population increases through births at a rate with recruits assumed susceptible and being the birth/death rate. Those that are susceptible are infected through interaction with the infected in the compartments and at a rate defined by
where is the effective contact rate and is the relative infectivity rate of those in the compartment when compared to those in compartment A value of corresponds to a higher infectivity rate for individuals in the class than for individuals in the class, whereas the case corresponds to a higher infectivity rate for individuals in the than for individuals in the class. Once infected, susceptible individuals move to the exposed class where they progress to become infectious after 5 to 6 days [36] at a rate A proportion q will be undetected infectives, while the remaining proportion becomes detected. The detected/undetected infectives recover at rates and die due to COVID-19 at rates
The information growth rate is driven by the number of detected cases at a rate , and the information decreases at a rate , with being the constant rate of information inflow into the population. The NPIs grow at a rate and decrease at a rate , and the constant rate at which NPIs are practiced within the population is modeled by The model flow diagram is presented in Figure 1 below.
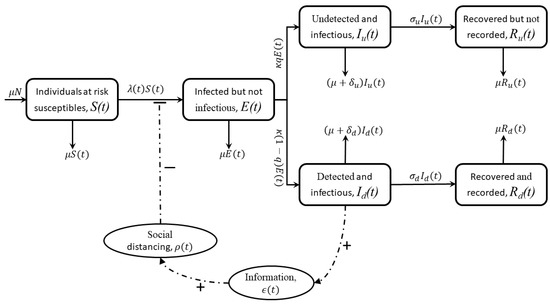
Figure 1.
Model diagram.
The model formulation summary above, together with the model flow diagram (Figure 1), leads to the following system of equations:
Given that the human population and the social process have different dimensions, we re-scale the human population by setting
and obtain the following system of differential equations:
with the initial conditions , , , , , , and
3. Model Analysis
3.1. Positivity of the Solutions
Proof.
Let be the solution of system (2) and (3). From the first equation of system (2) and (3), we have that
Thus,
Integrating both sides and applying the initial conditions leads to
at any value of Since then
Additionally, from the second equation of system (2) and (3) we have that
Integrating both sides and applying the initial conditions gives
at any value of . Since , then .
Similarly, it can be shown that , , , , and . □
3.2. Feasible Region
Consider the biological feasible region given by
where
Lemma 2.
3.3. Disease-Free Equilibrium and Model Reproduction Number
The model system (2) and (3) has a disease-free equilibrium given by
Following the next-generation matrix approach in van den Driesche and Watmough [37], we have that
and
Thus, the basic reproduction number denoted by and defined as the spectral radius of the matrix is given by
where and . We fix in order for to be biologically meaningful. Here, and represent the contribution of individuals in classes and respectively.
The following theorem follows from van den Driesche and Watmough: [37].
Theorem 1.
The disease-free equilibrium is locally asymptotically stable when and is unstable when .
Proof.
The Jacobian matrix of system (2) and (3) at is given by
where , , and are defined as before. The local stability of the disease-free equilibrium is determined by the following submatrix of ,
Note that all the off-diagonal elements of are positive. We claim that is an matrix. Define two positive matrices Y and Z, respectively, as follows:
where
Multiplying matrix by Y gives
Thus, employing the theory for matrices, it follows that all the eigenvalues of have negative real parts. Therefore, the disease-free equilibrium is locally asymptotically stable for . On the other hand, we compute the determinant of to obtain
Thus, if , then matrix has eigenvalues with negative real parts, which implies the stability of the disease-free equilibrium . This completes the proof. □
3.4. Endemic Equilibrium
The long-term dynamics of the model can be determined by considering the steady states of the model. Solving the fourth equation of system (2) for , we obtain
Solving the third equation of system (2) for , we obtain
Likewise, solving the first, fifth, and sixth equations of system (2), respectively, for , and together with system (3), respectively, for and in terms of gives
Substituting the expressions (15)–(17) into the second equation of system (2) leads to the following third order polynomial equation in terms of :
where
Thus, we summarise the results on the existence of the endemic equilibrium of systems (2) and (3) in Theorem 2.
Theorem 2.
Proof.

Solving (18) gives , which corresponds to the disease-free equilibrium or
We solve the quadratic Equation (20). Note that
Various possibilities for the existence of the endemic equilibrium are shown in Table 1 below. Here, denotes the number of roots of (20).
Table 1.
Shows the number of possible positive solutions for .
□
3.5. Local Stability of the Endemic Equilibrium Point
In this section, we study the local stability of the endemic equilibrium of system (2) and (3). We employ Theorem proven in the work by Castillo–Chavez and Song [38]. We focus on the application of the theorem and refer readers to [38] for more details on the theorem.
Theorem 3.
Proof.
We introduce the following change of variables for the easy application of Theorem in [38]:
, so that . We now use the vector notation Then, the model system (2) and (3) can be written in the form
where
Let be the bifurcation parameter, and corresponds to
The Jacobian matrix of system (2) and (3) at when is given by
where and are defined as before.
It can be noted that for , systems (2) and (3) have a simple eigenvalue. Thus, the center manifold theory can be applied to analyse the dynamics of system (2) and (3) near . The right eigenvector for is given by , where
The left eigenvector of , associated with the zero eigenvalue at , is given by , where
Now, we compute a and b as defined in Castillo–Chavez and Song [38] and apply Theorem in Castillo–Chavez and Song [38]. For system (22), the associated non-zero partial derivatives of F at are given below in (24).
It thus follows that
where
Now, we fix . Note that if , then and if . Lastly,
This completes the proof. □
4. Numerical Simulations and Model Validation
The population of South Africa in 2020 was estimated to be 59.54 million [39]. We take the initial time of the epidemic to be the time when the first lockdown measures took effect, i.e., on the 27 March 2020. The choice of the initial time is driven by the fact that there were no non-pharmaceutical interventions before then. Additionally, the waves following the first wave had additional interventions that included vaccination, which was not captured in our model. It is thus apparent that we use data from the first wave. We chose the end time of the first wave to be 15 October 2020. It is important that there was no clear time set for the end of the first wave and the start of the second wave. We hypothetically chose a value at the mid-point of the trough between the first and second waves. The initial conditions are given by
While some of the parameters such as the birth/death rates can be obtained from [39], the majority of the parameters are generated by the curve fitting algorithm, the fminsearch, which uses the Nelder–Mead simplex algorithm described in detail in [40]. The birth/death rate in this case is assumed to be related to the life expectancy in the year 2020. The life expectancy in South Africa was 65.5 years in the year 2020, translating to The number of undetected cases is estimated to be seven times higher than the reported figures [41]. So, q is chosen in such a way that the proportion of undetected cases is seven times that of the detected. We thus have Our fitting suggests a value three times the one reported in [41] for South Africa. The remaining parameters are determined from the fitting that is depicted in Figure 2.
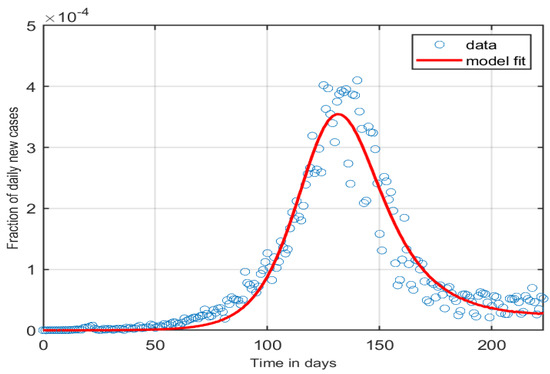
Figure 2.
A figure showing the model fitted to the first wave of the epidemic in South Africa for the following parameter values:
4.1. Impact of Varying NPIs
NPIs were impacted greatly due changes in the lockdown levels as the COVID-19 pandemic progressed. Relaxations and the tightening of NPIs have been the norm in many countries depending on the number of cases and changes in hospitalisation levels over time. We consider the relaxation of interventions that are impacted by fear. As the numbers of cases decrease, the fear of COVID-19 decreases, consequently leading to a relaxation of the NPIs. The impact of NPIs is modelled by the parameter We note here that while the changes seem to be minimal, at a scale of this is significant, and an increase in the variations of the parameters being varied can increase the observations.
Figure 3 and Figure 4 show that the number of cases increases with any increase in the reduction in NPIs. It is thus important to note that such results are key in the quantification of the effects of NPIs. The results presented are thus for illustrative purposes as the changes in parameters such as are difficult to observe in real life.
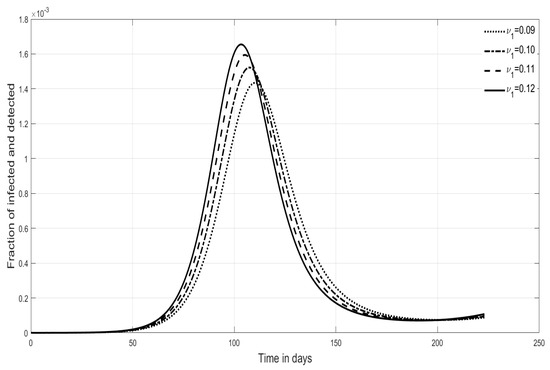
Figure 3.
Shows the effects of varying of the fraction of detected cases.
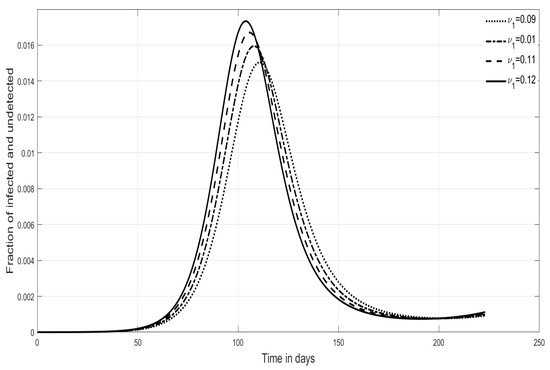
Figure 4.
Shows the effects of varying of the fraction of undetected cases.
4.2. Impact of Varying Fear Levels
The structure of our model is such that fear resulting from increased numbers of detected cases can give rise to increased NPIs. The removal in the levels of fear is modeled by the parameter We vary from 0.1 to 0.7, and the fraction of undetected infectives follows the dynamics in Figure 5. Clearly, the direct impact of fear does not translate into significant changes in the fraction of infectives. We had to zoom in to determine the influence of varying The insert on Figure 5 shows that increasing the levels of fear results in an increased number of infected cases.
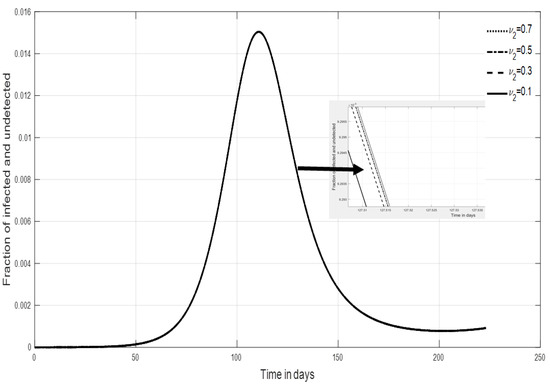
Figure 5.
Shows the effects of varying on the fraction of infectious undetected cases.
4.3. Impact of Varying Parameters and on
The reduction in NPIs, modelled by , and the progression to infectiousness, modelled by is of interest in this paper. We determine the effects of both parameters by a contour plot and the two parameters. Figure 6 shows that an increase in the two parameters leads to an increase in the value of We add a surface of to establish the parameter values of and for which the value of This is key in determining the persistence of the infection when all other parameters are assumed to be constant.
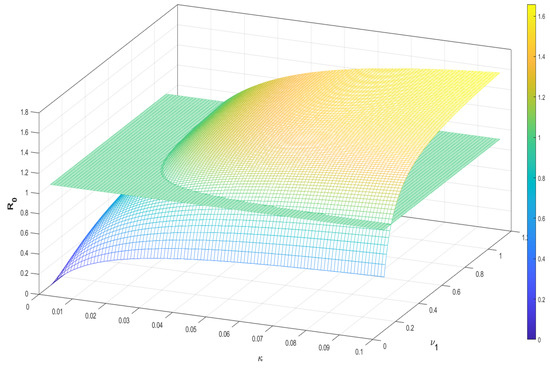
Figure 6.
Shows a contour plot for the parameters and .
4.4. Impact Varying Parameters and on
Also of interest are the parameters ; the growth rate of NPIs; and the effective contact rate. We investigate the effects of the two parameters on a contour plot and the two parameters. Figure 7 shows that an increase in has a more significant effect on the values of than We also added a surface of to establish the parameter values of and for which the value of
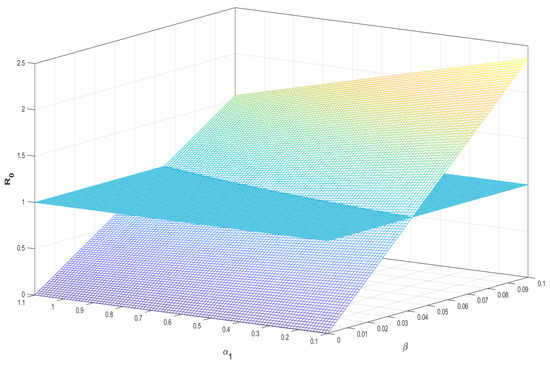
Figure 7.
Shows a contour plot for the parameters and .
5. Discussion and Conclusions
The work considered in this study captures the role of human behaviour on the spread of COVID-19 in South Africa influenced by the spread of information. An eight-state system of ODEs split into two sub-systems capturing human dynamics and social dynamics is formulated. As can be observed in the social dynamics sub-system, information on COVID-19 is considered to depend on data for COVID-19 detected cases that in turn influence changes in human behavior. The baseline values for information availability and human behaviour are included to add realism to the system of equations. It is important to note that, due to differences in scales between the two sub-systems, it was important to non-dimensionalise the system of equations. The non-dimensionalised system was then analysed. The model steady states were determined and their stabilities analysed. The model analysis of the endemic equilibrium shows the existence of multiple steady states. The model exhibits a backward bifurcation. The backward bifurcation is established using the center manifold theory.
Given that at the start of the pandemic, the only control measures involved NPIs, and the first wave, in South Africa and in many other countries, passed without the use of vaccines and therapeutics, we consider data on the first wave of COVID-19 in South Africa to calibrate our model. The fminsearch algorithm is used to find the parameters that best fit the model to data.
Mathematical models that include human behaviour are key to the management of diseases. At the beginning of the pandemic, COVID-19 treatment remained part of a bigger global research drive to find therapeutics for the disease. However, the management and control of the disease relied on human behaviour influenced by government policies. The policies also evolved as more information on the pandemic emerged. In South Africa, restrictions to human movement, personal hygiene, the cleaning of surfaces, sanitising, and social distancing were key to minimising transmission before the advent of the vaccines on the market. In particular, regulations on restrictions varied as lockdown levels changed depending on the number of cases and hospitalisation rates.
The work presented in this article can certainly be improved to capture a holistic view of social processes. It is important to note that the modelling of social processes is complex, and the biggest complexity arises from the choice of mathematical functions used to model the processes. In this paper, the growth and decline of NPIs are modelled through mathematical functions. While the functions presented in this paper were chosen for their simplicity, other functions for and can be used to model the growth of NPIs and fear. The choice of the functions has the propensity to influence the quality of the model outputs. One of the weaknesses of this article is the non-inclusion of the hospitalised compartment, which can influence the information that impacts the dynamics of the NPIs. The paper can also be extended to incorporate vaccination as many countries to date have considered this as the main preventive form of control for COVID-19. These aspects and some other observed characteristics that influence the trends of the spread of COVID-19 can be considered as possible extensions to this work.
Despite the shortcomings given above, the modelling framework presented here has the potential to influence the modelling of other infections that are significantly influenced by human behaviour. The advent of COVID-19 shows that new emerging infections are a reality, and models such as the one presented in this paper are useful in managing new infections as human behaviour is essential in influencing the course of an emerging infection.
Author Contributions
Conceptualization, F.N.; Methodology, R.M.; Formal analysis, J.M.; Writing—review & editing, G.M. All authors have read and agreed to the published version of the manuscript.
Funding
The authors received no funding for this research work.
Data Availability Statement
Not applicable.
Acknowledgments
The authors are very grateful to the anonymous reviewers for their careful reading and constructive comments. The authors are also grateful for the support rendered by their respective institutions towards the production of the manuscript.
Conflicts of Interest
The authors declare that there is no conflict of interest regarding the publication of this article.
References
- Worldometer. COVID-19 Coronavirus Pandemic. 2022. Available online: https://www.worldometers.info/coronavirus/ (accessed on 8 April 2022).
- Schröder, M.; Bossert, A.; Kersting, M.; Aeffner, S.; Coetzee, J.; Timme, M.; Schlüter, J. COVID-19 in South Africa: Outbreak despite interventions. Sci. Rep. 2021, 11, 956. [Google Scholar] [CrossRef] [PubMed]
- U.S. Department of Health & Human Services. COVID-19 Treatments and Therapeutics. 2022. Available online: https://www.hhs.gov/coronavirus/covid-19-treatments-therapeutics/index.html (accessed on 8 April 2022).
- Fallani, S.; Voller, F.; Stasi, C.; Silvestri, C. Treatment for COVID-19: An overview. Eur. J. Pharmacol. 2020, 889, 173644. [Google Scholar]
- Olu, O.O.; Waya, J.L.L.; Maleghemi, S.; Rumunu, J.; Ameh, D.; Wamala, J.F. Moving from rhetoric to action: How Africa can use scientific evidence to halt the COVID-19 pandemic. Infect. Dis. Poverty 2020, 9, 150. [Google Scholar] [CrossRef] [PubMed]
- Haleem, A.; Javaid, M.; Vaishya, R. Effects of COVID-19 pandemic in daily life. Curr. Med. Res. Pract. 2020, 10, 78–79. [Google Scholar] [CrossRef] [PubMed]
- Liu, M.; Ning, J.; Du, Y.; Cao, J.; Zhang, D.; Wang, J.; Chen, M. Modelling the evolution trajectory of COVID-19 in Wuhan, China: Experience and suggestions. Public Health 2020, 183, 76–80. [Google Scholar] [CrossRef] [PubMed]
- Wu, J.T.; Leung, K.; Leung, G.M. Nowcasting and forecasting the potential domestic and international spread of the 2019-nCoV outbreak originating in Wuhan, China: A modelling study. Lancet 2020, 395, 689–697. [Google Scholar] [CrossRef]
- Giordano, G.; Blanchini, F.; Bruno, R.; Colaneri, P.; Di Filippo, A.; Di Matteo, A.; Colaneri, M. Modelling the COVID-19 epidemic and implementation of population-wide interventions in Italy. Nat. Med. 2020, 26, 855–860. [Google Scholar] [CrossRef]
- Siqueira, C.A.D.S.; Freitas, Y.N.L.D.; Cancela, M.D.C.; Carvalho, M.; Oliveras-Fabregas, A.; de Souza, D.L.B. The effect of lockdown on the outcomes of COVID-19 in Spain: An ecological study. PLoS ONE 2020, 15, e0236779. [Google Scholar] [CrossRef]
- Guirao, A. The Covid-19 outbreak in Spain. a simple dynamics model, some lessons, and a theoretical framework for control response. Infect. Dis. Model. 2020, 5, 652–669. [Google Scholar] [CrossRef]
- Goscé, L.; Phillips, A.; Spinola, P.; Gupta, R.K.; Abubakar, I. Modelling SARS-COV2 spread in London: Approaches to lift the lockdown. J. Infect. 2020, 82, 260–265. [Google Scholar] [CrossRef]
- Nadler, P.; Wang, S.; Arcucci, R.; Yang, X.; Guo, Y. An epidemiological modelling approach for COVID-19 via data assimilation. Eur. J. Epidemiol. 2020, 35, 749–761. [Google Scholar] [CrossRef] [PubMed]
- Stutt, R.O.; Retkute, R.; Bradley, M.; Gilligan, C.A.; Colvin, J. A modelling framework to assess the likely effectiveness of facemasks in combination with ‘lock-down’ in managing the COVID-19 pandemic. Proc. R. Soc. A Math. Phys. Eng. Sci. 2020, 476, 20200376. [Google Scholar] [CrossRef]
- Cooper, I.; Mondal, A.; Antonopoulos, C.G. A SIR model assumption for the spread of COVID-19 in different communities. Chaos Solitons Fractals 2020, 139, 110057. [Google Scholar] [CrossRef]
- Tang, Y.; Wang, S. Mathematic modeling of COVID-19 in the United States. Emerg. Microbes Infect. 2020, 9, 827–829. [Google Scholar] [CrossRef] [PubMed]
- Bertozzi, A.L.; Franco, E.; Mohler, G.; Short, M.B.; Sledge, D. The challenges of modeling and forecasting the spread of COVID-19. Proc. Natl. Acad. Sci. USA 2020, 117, 16732–16738. [Google Scholar] [CrossRef] [PubMed]
- Mbogo, R.W.; Odhiambo, J.W. COVID-19 outbreak, social distancing and mass testing in Kenya—Insights from a mathematical model. Afr. Mat. 2021, 32, 757–772. [Google Scholar] [CrossRef]
- Mbogo, R.W.; Orwa, T.O. SARS-COV-2 outbreak and control in Kenya: Insights from a mathematical model. Infect. Dis. Model. 2021, 6, 370–380. [Google Scholar]
- Rhodes, T.; Lancaster, K.; Lees, S.; Parker, M. Modelling the pandemic: Attuning models to their contexts. BMJ Glob. Health 2020, 5, e002914. [Google Scholar] [CrossRef]
- Sintunavarat, W.; Turab, A. Mathematical analysis of an extended SEIR model of COVID-19 using the ABC-fractional operator. Math. Comput. Simul. 2022, 198, 65–84. [Google Scholar] [CrossRef]
- Walters, C.E.; Meslé, M.M.; Hall, I.M. Modelling the global spread of diseases: A review of current practice and capability. Epidemics 2018, 25, 1–8. [Google Scholar] [CrossRef]
- Agusto, F.B.; Erovenko, I.V.; Fulk, A.; Abu-Saymeh, Q.; Romero-Alvarez, D.; Ponce, J.; Sindi, S.; Ortega, O.; Saint Onge, J.M.; Peterson, A.T. To isolate or not to isolate: The impact of changing behavior on COVID-19 transmission. BMC Public Health 2022, 22, 138. [Google Scholar]
- Ashour, M.; Bekiroglu, K.; Yang, C.H.; Lagoa, C.; Conroy, D.; Smyth, J.; Lanza, S. On the mathematical modeling of the effect of treatment on human physical activity. In Proceedings of the 2016 IEEE Conference on Control Applications (CCA), Buenos Aires, Argentina, 19–22 September 2016; pp. 1084–1091. [Google Scholar]
- Funk, S.; Salathé, M.; Jansen, V.A. Modelling the influence of human behaviour on the spread of infectious diseases: A review. J. R. Soc. Interface 2020, 7, 1247–1256. [Google Scholar] [CrossRef] [PubMed]
- Asamoah, J.K.K.; Jin, Z.; Sun, G.Q.; Seidu, B.; Yankson, E.; Abidemi, A.; Oduro, F.T.; Moore, S.E.; Okyere, E. Sensitivity assessment and optimal economic evaluation of a new COVID-19 compartmental epidemic model with control interventions. Chaos Solitons Fractals 2021, 146, 110885. [Google Scholar] [CrossRef] [PubMed]
- Asamoah, J.K.K.; Okyere, E.; Abidemi, A.; Moore, S.E.; Sun, G.Q.; Jin, Z.; Acheampong, E.; Gordon, J.F. Optimal control and comprehensive cost-effectiveness analysis for COVID-19. Results Phys. 2022, 33, 105177. [Google Scholar] [CrossRef]
- Asamoah, J.K.K.; Bornaa, C.S.; Seidu, B.; Jin, Z. Mathematical analysis of the effects of controls on transmission dynamics of SARS-CoV-2. Alex. Eng. J. 2020, 59, 5069–5078. [Google Scholar] [CrossRef]
- Asamoah, J.K.K.; Owusu, M.A.; Jin, Z.; Oduro, F.T.; Abidemi, A.; Gyasi, E.O. Global stability and cost-effectiveness analysis of COVID-19 considering the impact of the environment: Using data from ghana. Chaos Solitons Fractals 2020, 140, 110103. [Google Scholar] [CrossRef]
- Friston, K.J.; Parr, T.; Zeidman, P.; Razi, A.; Flandin, G.; Daunizeau, J.; Hulme, O.J.; Billig, A.J.; Litvak, V.; Price, C.J.; et al. Second waves, social distancing, and the spread of COVID-19 across America. Wellcome Open Res. 2021, 5, 103. [Google Scholar] [CrossRef]
- Pedro, S.A.; Ndjomatchoua, F.T.; Jentsch, P.; Tchuenche, J.M.; Anand, M.; Bauch, C.T. Conditions for a second wave of COVID-19 due to interactions between disease dynamics and social processes. Front. Phys. 2020, 8, 574514. [Google Scholar] [CrossRef]
- Simonsen, L.; Chowell, G.; Andreasen, V.; Gaffey, R.; Barry, J.; Olson, D.; Viboud, C. A review of the 1918 herald pandemic wave: Importance for contemporary pandemic response strategies. Ann. Epidemiol. 2018, 28, 281–288. [Google Scholar] [CrossRef]
- Baker, R.E.; Park, S.W.; Yang, W.; Vecchi, G.A.; Metcalf, C.J.E.; Grenfell, B.T. The impact of COVID-19 nonpharmaceutical interventions on the future dynamics of endemic infections. Proc. Natl. Acad. Sci. USA 2020, 117, 30547–30553. [Google Scholar] [CrossRef]
- Nyabadza, F.; Chirove, F.; Chukwu, C.W.; Visaya, M.V. Modelling the potential impact of social distancing on the COVID-19 epidemic in South Africa. Comput. Math. Methods Med. 2020, 2020, 5379278. [Google Scholar] [CrossRef] [PubMed]
- Johnston, M.D.; Pell, B. A dynamical framework for modeling fear of infection and frustration with social distancing in COVID-19 spread. Math. Biosci. Eng. 2020, 17, 7892–7915. [Google Scholar] [CrossRef] [PubMed]
- Liu, Z.; Magal, P.; Seydi, O.; Webb, G. A COVID-19 epidemic model with latency period. Infect. Dis. Model. 2020, 28, 323–337. [Google Scholar] [CrossRef] [PubMed]
- Van den Driessche, P.; Watmough, J. Reproduction numbers and sub-threshold endemic equilibria for compartmental models of disease transmission. Math. Biosci. 2002, 180, 29–48. [Google Scholar] [CrossRef]
- Castillo–Chavez, C.; Song, B. Dynamical models of tuberculosis and their applications. Math. Biosci. Eng. 2004, 1, 361. [Google Scholar] [CrossRef]
- Maluleke, R. Mid-Year Population Estimates 2021-Statistics South Africa. 2022. Available online: http://www.statssa.gov.za/publications/P0302/Mid%20year%20estimates%202021_presentation.pdf (accessed on 4 February 2022).
- Lagarias, J.C.; Reeds, J.A.; Wright, M.H.; Wright, P.E. Convergence properties of the Nelder–Mead simplex method in low dimensions. SIAM J. Optim. 1998, 9, 112–147. [Google Scholar] [CrossRef]
- Burki, T.K. Undetected COVID-19 cases in Africa. Lancet Respir. Med. 2021, 9, e121. [Google Scholar] [CrossRef]
Disclaimer/Publisher’s Note: The statements, opinions and data contained in all publications are solely those of the individual author(s) and contributor(s) and not of MDPI and/or the editor(s). MDPI and/or the editor(s) disclaim responsibility for any injury to people or property resulting from any ideas, methods, instructions or products referred to in the content. |
© 2023 by the authors. Licensee MDPI, Basel, Switzerland. This article is an open access article distributed under the terms and conditions of the Creative Commons Attribution (CC BY) license (https://creativecommons.org/licenses/by/4.0/).