Article

Effects of Strain Rate and Temperature on Physical Mechanical Properties and Energy Dissipation Features of Granite

School of Resources and Safety Engineering, Central South University, Changsha 410083, China
*
Author to whom correspondence should be addressed.
Mathematics 2022, 10(9), 1521; https://doi.org/10.3390/math10091521
Submission received: 29 March 2022 / Revised: 22 April 2022 / Accepted: 28 April 2022 / Published: 2 May 2022

Abstract

:
Dynamic compression tests of granite after thermal shock were performed using the split Hopkinson pressure bar system, to determine the effects of strain rate and temperature on the dynamic mechanical parameters, energy dissipation features and failure modes of granite. The results indicate that the dynamic compressive strength increased exponentially with strain rate and decreased with increasing temperature. Temperature and incident energy can equivalently transform for the same dynamic compressive strength. Dynamic elastic modulus of granite decreased obviously with increasing temperature but did not have a clear correlation with strain rate. As the impact gas pressure increased, the stress-strain curves changed from Class II to Class I behavior, and the failure modes of specimens transformed from slightly split to completely pulverized. The critical temperature at which the stress-strain curves changed from Class II to Class I was determined to be 300 °C, when the impact gas pressure is 0.6 MPa. As the applied temperature increased, density, wave velocity and wave impedance all decreased, meanwhile, the degree of granite specimen crushing was aggravated. Under the same incident energy, as the temperature increased, the reflected energy increased notably and the absorbed energy increased slightly, but the transmitted energy decreased. For the same temperature, the reflected and absorbed energies increased linearly as the incident energy increased, whereas the transmitted energy increased logarithmically. The SEM images of the thermal crack distribution on the granite specimen surface at different temperatures can well explain the essence of mechanical parameters deterioration of granite after thermal shock. This work can provide guidance for impact crushing design of high temperature rocks during excavations.

1. Introduction

The crushing mechanism and stability control of a rock mass after thermal shock have a widespread application in the engineering of geothermal drilling [1], nuclear waste disposal [2], and tunnel repairs after a fire [3]. Therefore, the study of the dynamic mechanical behavior and energy dissipation features of rocks after thermal shock is critical to the solution of the engineering problems of high temperature rock mechanics.
Facilitating the exploitation of mineral resources deep within the earth, underground engineering construction in high temperature and pressure conditions face many challenges. For example, efficient drilling and wellbore stability control under high temperature and pressure are the main challenges in geothermal drilling engineering. Given these challenges, the effects of temperature and external loads on rock have been extensively studied. Results have shown that the mechanical properties of high temperature rocks are different from those of normal temperature rocks [4,5,6,7]. However, the mechanical responses of high temperature rock are not only related to temperature [8] but also heating method [9,10], cooling method [11,12], heating rate [13,14] and loading method [15]. The influence of heating rate on the mechanical properties of granite was studied by conducting uniaxial compression tests [13] and the results indicated that 5 °C/min was the critical heating rate for producing thermal cracking in Beishan granite. Therefore, the heat treatment applied in this study was carried out at a heating rate of 2 °C/min. The physical mechanical parameters (Cs, Es and UCS) of sandstone decreased when temperature increased, but the mechanical parameters of sandstone cooling in liquid nitrogen were lower than that of cooling in water [16].
Previous literature has classified three types of high-temperature rock mechanic behaviors [10]: real-time high temperature, high temperature thermal shock cooling (rapid cooling in a liquid such as water or liquid nitrogen), and high temperature slow cooling (air cooling). Under real-time high temperature and pressure, granite permeability was observed to increase rapidly above the critical temperature (350 °C), but the critical temperature of permeability decreased with increasing confining pressure [17]. And thermal cracks have been found to appear in inter-granular and grow with the increasing of temperature [18], especially above 500 °C, thermal cracks appeared in intra-granular [17,19]. Under slow cooling, the UCS and Cs of marble [20] and limestone [21] decreased with increasing temperature. The mechanical properties deterioration of granite after rapid cooling were observed to accelerate as the applied temperature increased [22], and UCS decreases significantly with the cooling cycles increased [23]. The order of UCS and Es of granite at the same temperature from high to low was real-time high temperature, slow cooling, and rapid cooling [10,24,25].
As mechanical rock breaking devices typically use water to cool the frictional heat generated by rock breaking, it is critical to study the mechanical behaviors of rock after thermal shock. Indeed, as the dynamic mechanical properties of rock must be considered during any engineering rock excavation, researchers have widely studied the dynamic mechanical properties of rock using the SHPB system. Post-peak behaviors of stress strain curves determine the macroscopic failure modes of the rock, so post-peak behavior is of great significance for estimating engineering instability [26]. According to the value of the post-peak elastic modulus, the dynamic stress-strain curves can be divided into Class I (with a post-peak elastic modulus less than zero) and Class II (with a post-peak elastic modulus greater than zero) [26,27]. Under the former behavior, stability failure occurs under rigid conditions, whereas under the latter behavior, unavoidable spontaneous failure occurs under rigid conditions. The dynamic mechanical behaviors and energy dissipation features have been widely studied in terms of temperature [9], moisture content [28], pre-existing cracks [29,30] and cyclic impact [31]. The dynamic compressive strength of shale with different bedding dips after heat treatment was studied, the result found that dynamic compressive strength of shale at 0°and 30° bedding dips increased with the temperature increasing, but the strength at 45°, 60° and 90° bedding dips are opposite [32]. Both the dynamic strength and dissipated energy density of rock specimens have been found to increase significantly with increasing strain rate [29], but the relationship between the elastic modulus and strain rate has not been determined [28,33,34]. Furthermore, though the selection of a reasonable impact frequency can effectively reduce energy dissipation and improve rock drilling efficiency [35], the corresponding strain rate response of rock after thermal shock has been rarely studied. The mechanical properties and damage constitutive model of granite under coupling of temperature and dynamic loading were studied [33], and the damage model was found to accurately reflect the effects of the strain rate and temperature on the dynamic strength. However, the relationships between reflected, transmitted, absorbed and incident energies have been neglected to date. Furthermore, all previous results were obtained under real-time high temperature conditions, though some engineering excavations have instead been constructed in rock subjected to thermal shock. Therefore, it is critical to study the strain rate effect and energy dissipation features of rock after thermal shock.
Dynamic compression tests of granite specimens after thermal shock were performed using the SHPB system in this study. Firstly, the effects of strain rate and temperature on strength, elastic modulus, energy dissipation, and failure modes of specimens were analyzed. Secondly, effects of temperature and incident energy on the reflected, transmitted, and absorbed energies were explained using the theory of elastic wave propagation at the interface between different media. Finally, the essential reasons for the observed deterioration of the physical and mechanical properties of granite were revealed by SEM images of the surface cracks on the specimens after thermal shock. This work can provide guidance for the design of high-temperature impact rock drilling procedures.

2. Experimental Methods

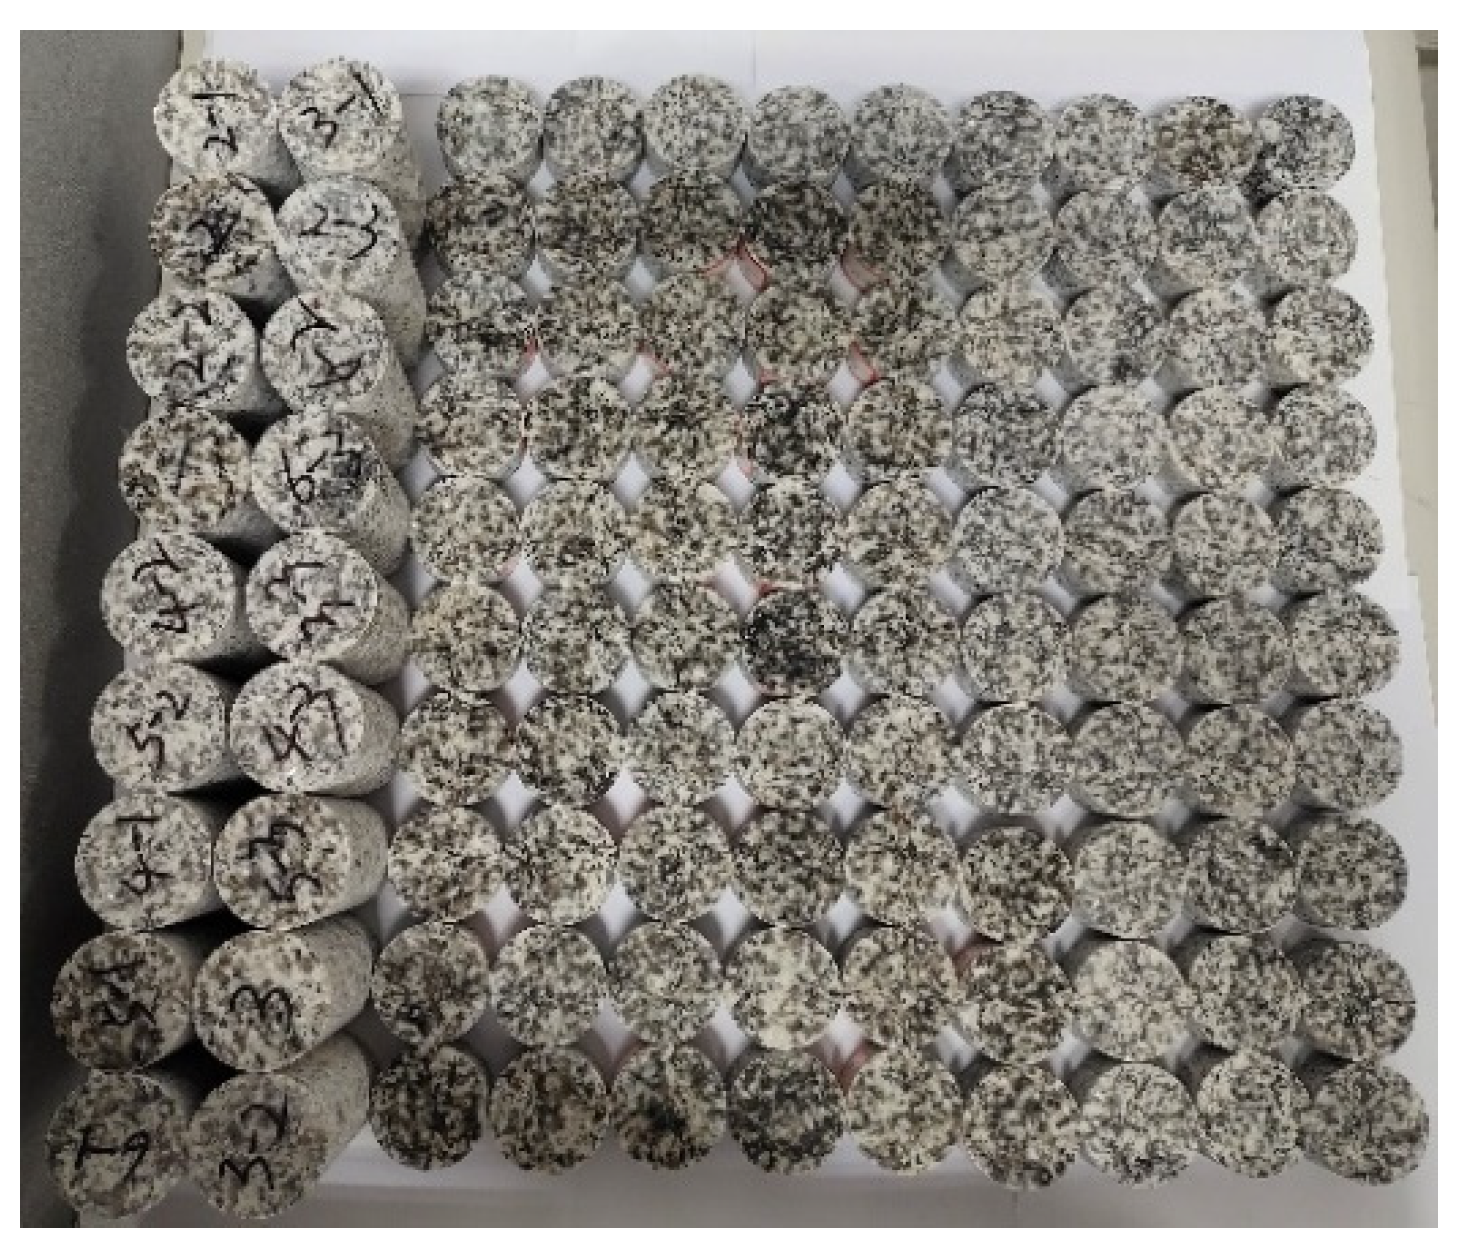
2.1. Specimen Preparation

The rock employed in this study was a gray–white, medium–coarse–grained biotite granite block obtained from a quarry in Changsha, China. This block was processed into two types of specimens (Figure 1)—a series of Φ 50 × 100 mm cylinders for the uniaxial compression tests and a series of Φ 50 × 25 mm discs for the dynamic compression tests—that met the ISRM requirements for processing accuracy [36]. Each of these tests was conducted three times under the same conditions. The ρs of the specimen is about 2.64 to 2.65 g/cm3. The XRD spectrum (Figure 2) shows that the granite was mainly composed of quartz (28.6%), feldspar (55.1%), mica (11.5%), and chlorite (4.8%) minerals.

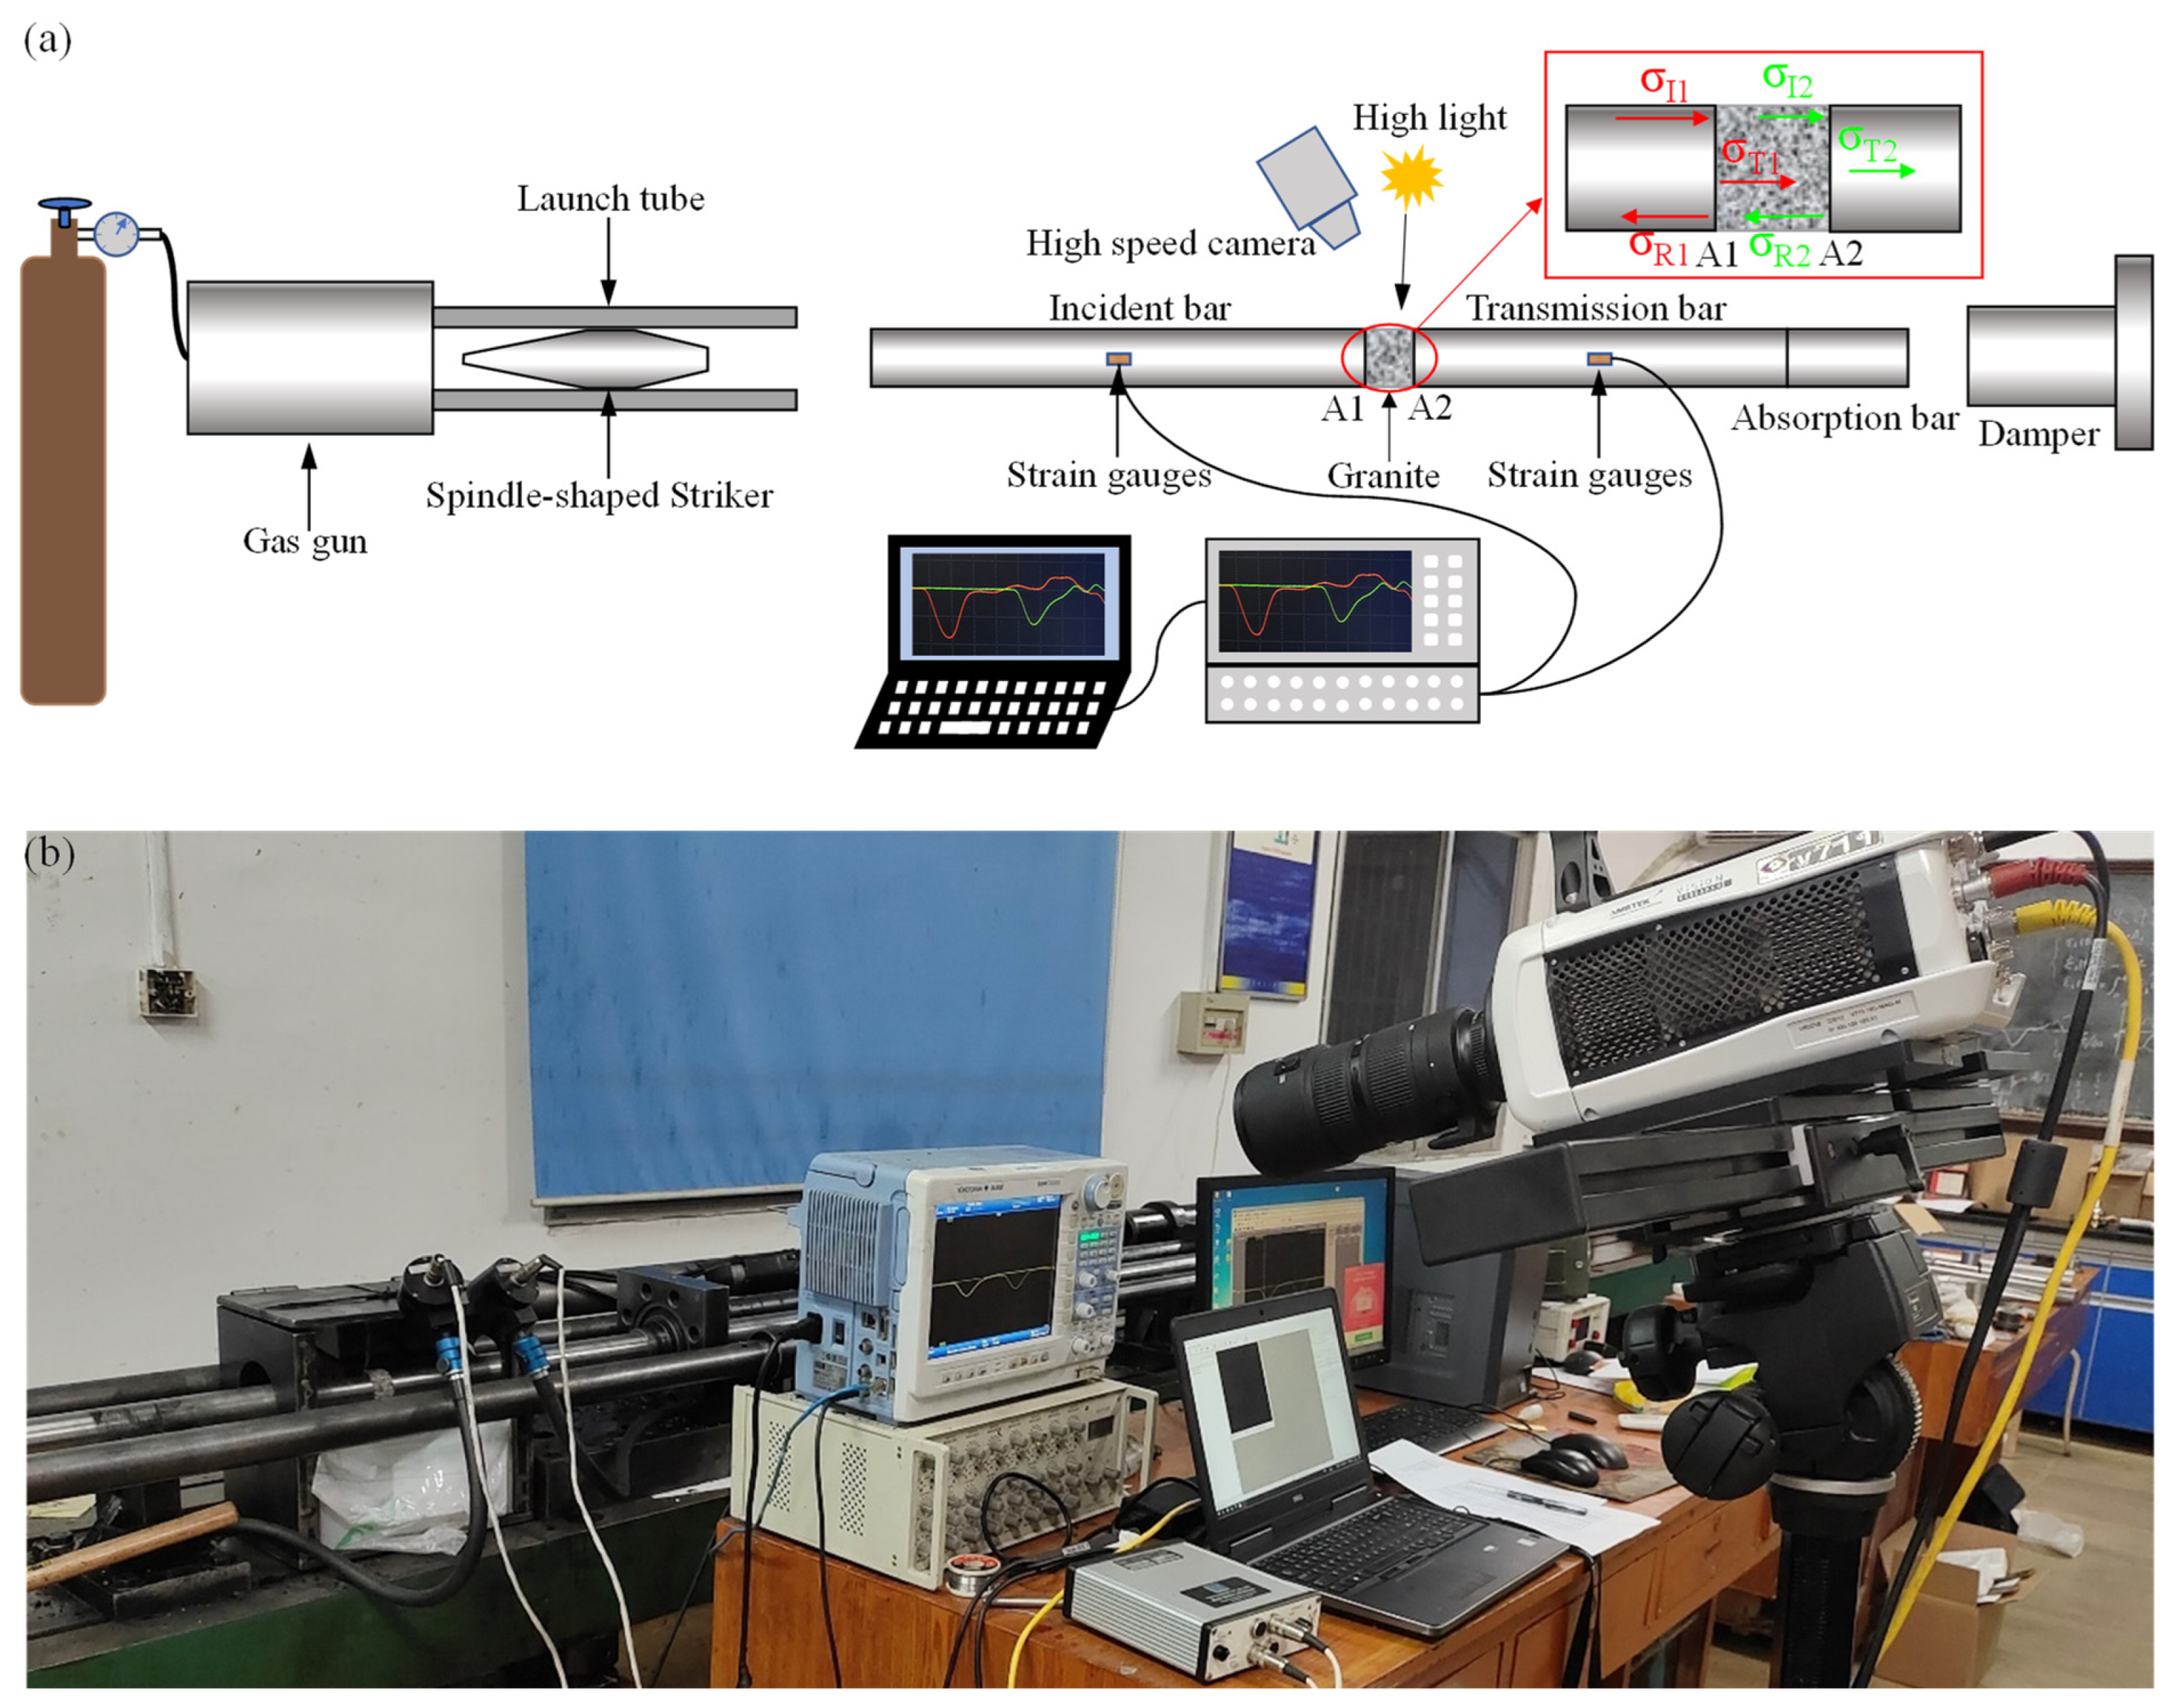
2.2. Experiment Device

The dynamic compression test was performed using the SHPB system (Figure 3) comprising a gas gun, a spindle-shaped striker, elastic bars (an incident, transmission, and absorption bar) and a damper [37]. The elastic bars and spindle-shaped striker were both made of 40 Cr steel with a ρe and Ce of 7.810 g/cm3 and 5410 m/s, respectively. For other technical parameters, please refer to the previous research from our group [38,39]. The spindle-shaped striker produced a stable half-sine waveform to eliminate Pochhammer-Chree (P-C) oscillations and reduce the wave dispersion effect [35,40].

2.3. Experiment Principle

When the target system satisfies the three basic assumptions (one-dimensional stress wave propagation, stress balance, and ignoring friction), the stress, strain rate and strain of the specimen can be calculated using the incident, reflected and transmitted wave signals as follows [41]:
{ σ ( t ) = A e E e 2 A s [ ε I ( t ) + ε R ( t ) + ε T ( t ) ] ε ( t ) = C e L s 0 τ [ ε I ( t ) ε R ( t ) ε T ( t ) ] d t ε ˙ ( t ) = C e L s [ ε I ( t ) ε R ( t ) ε T ( t ) ]
where σ, ε ˙ , ε are respectively the stress, strain rate and strain. Ae and As are respectively the cross-section areas of the elastic bars and specimens. Ce is the wave velocity of the elastic bars, Ls is the length of the specimen, and τ is the stress wave duration.

2.4. Testing Procedure

The mass, volume, and Cs of the granite specimens were measured before and after thermal treatment, and mass divided by volume equals density. The specimen mass was weighed by an electronic balance with an accuracy of 0.01 g, and the specimen volume was measured using a vernier caliper. It is important to note that a suitable quantity of petroleum jelly was applied to the contact surfaces between the transducer and specimens to reduce error when using the HS-YS4A rock ultrasonic testing analyzer measure the Cs. The specimens were divided equally into six groups, each of which included fifteen discs specimens and three cylinders specimens. Five specimen groups were heated to target temperatures of 200 °C, 300 °C, 400 °C, 500 °C and 600 °C at a heating rate of 2 °C/min using a muffle furnace. The target temperature was then held steady for 3 h to ensure an even distribution of specimen temperature. Next, the specimen was quickly removed from the muffle furnace and cooled in a water tank with a sufficient amount of water at 20 °C to ensure that the water temperature did not change significantly during the 20 min cooling process, so that the specimen completely cooled. The post-thermal shock specimens were kept in a cool and dry place until the mass of the sample tend to be stable. Static and dynamic compression tests of granite specimens after thermal shock were then conducted on a mechanical testing machine and SHPB device, respectively. In order to maintain a constant incident energy under the same impact gas pressure, it was necessary to ensure that the distance between the incident bar and the spindle-shaped striker remained equal in each test. The impact gas pressure was also changed from 0.5 MPa to 0.9 MPa in 0.1 MPa increasements to study the effect of strain rate on the behaviors of granite after thermal shock.

3. Static Physical and Mechanical Test Results

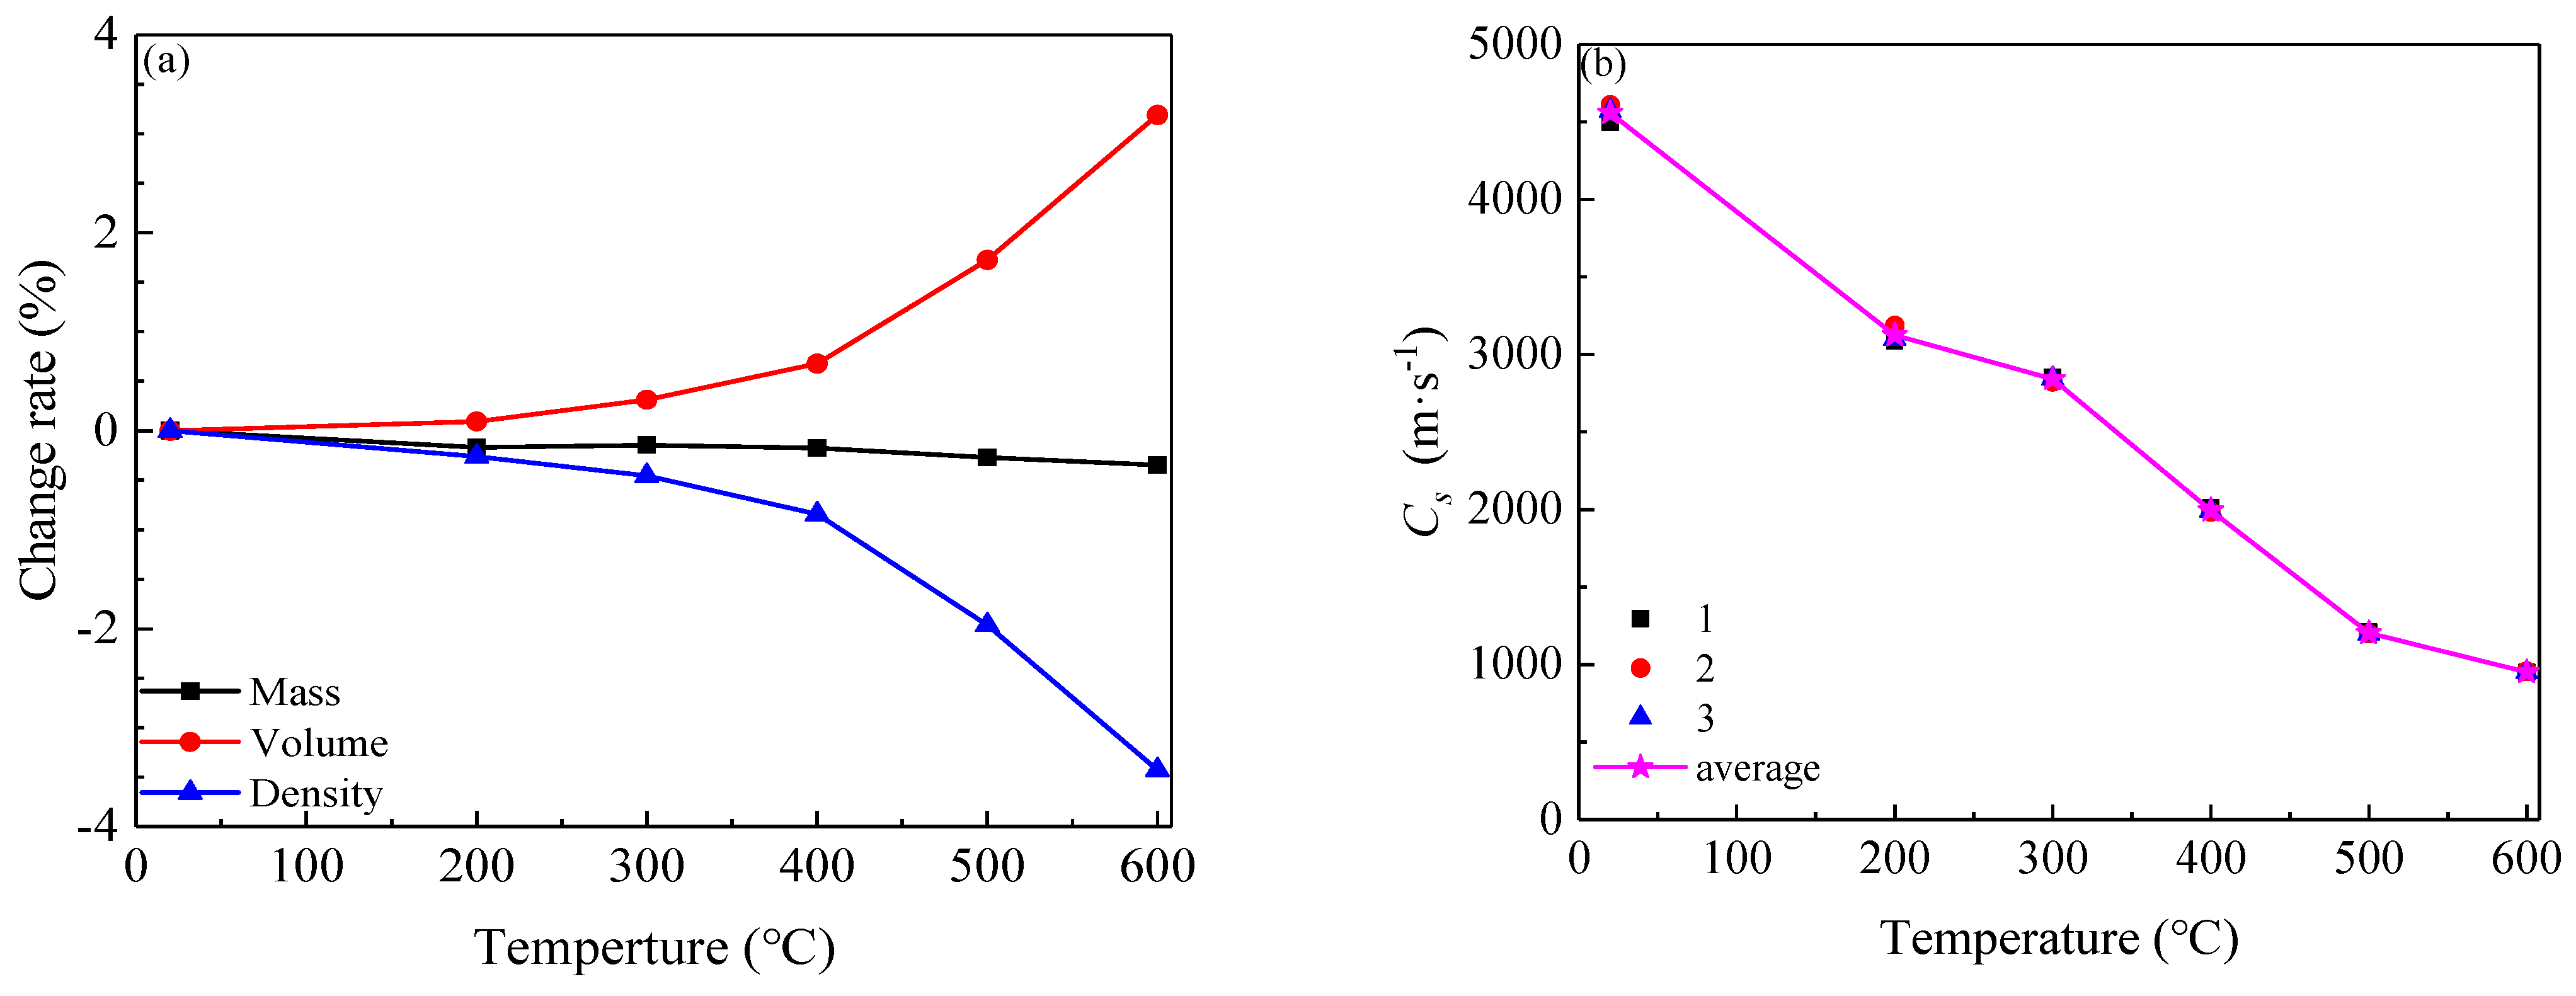
3.1. Physical Properties of Granite

Thermal shocking can induce many defects inside a rock specimen, and change its physical and mechanical properties. The initial mass and volume of each specimen are different due to the processing accuracy and heterogeneity, so the change rate of physical parameters (mass, volume and density) at different temperatures can better quantify the effect of heat treatment on physical parameters of the specimen. The change rate of physical parameters of the specimen can be calculated as follow:
δ = P 2 P 1 P 1 × 100
where P1 and P2 are respectively the physical parameters (such as mass, volume and density) of the specimen before and after heat treatment. δ is the change rate.
It can be observed in Figure 4a that an increase in temperature resulted in negative increases in the mass and density change rates, whereas the volume change rate exhibited the opposite trend. This indicated that the specimen mass loss gradually increased, the volume expanded, and the density decreased with increasing applied temperature. These phenomena are consistent with the other people’s findings [42,43]. According to previous literature [44], the reduction in specimen mass can be divided into two components: the escape and evaporation of the attached water and strongly bound water below 400 °C and the escape of internal weakly bound water and structural water above 400 °C. The volume change rate was observed to increase significantly with increasing applied temperature. Particularly at 573 °C, the angle of any two Si-O tetrahedron changed from 150° (α phase) to 180° (β phase) in the quartz crystal [45]. Because the mass decreased and volume increased with increasing temperature, the granite density gradually decreased. Furthermore, Figure 4b shows that Cs gradually decreased from 4558.4 m/s at 20 °C to 950.9 m/s at 600 °C, a loss of 79.1%. The full results are reported in Table 1. A strong correlation was noted between ρs and Cs indicating that both can reflect the degree of thermal damage to the specimen to some extent [46].

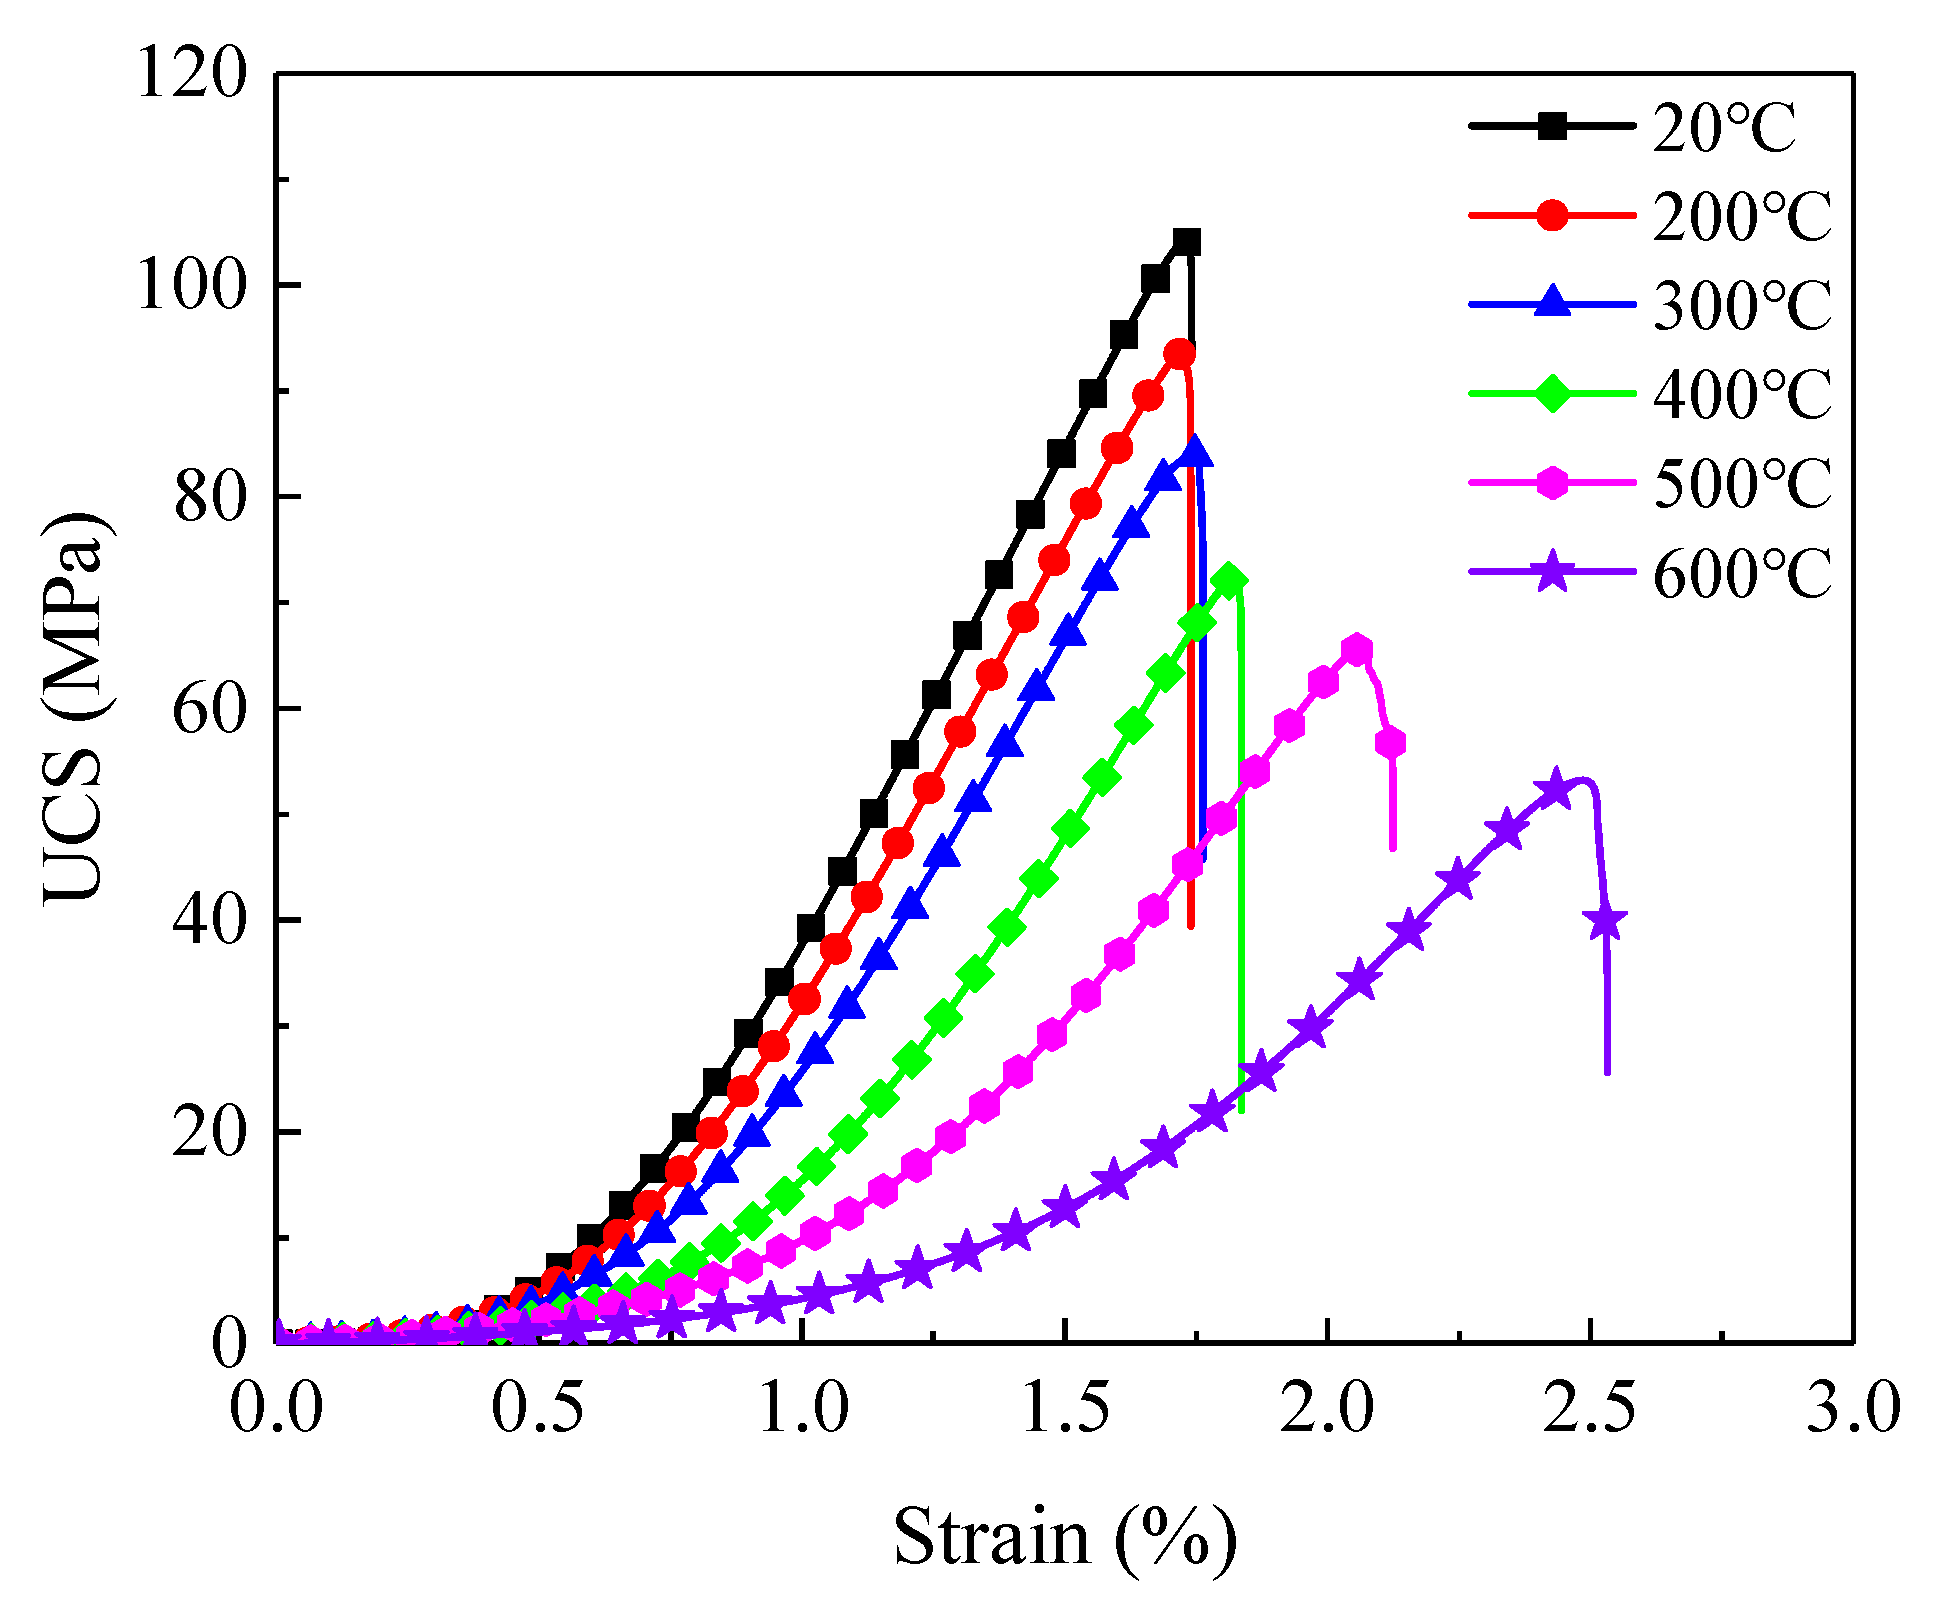
3.2. Static Mechanical Properties of Granite

Figure 5 shows that the stress-strain curves of specimen exhibited obvious stages of compaction, elastic and yield failure. The UCS of specimens gradually changed from 103.5 MPa at 20 °C to 55.1 MPa at 600 °C, a 46.8% decrease. Meanwhile, the peak strain increased from 1.73% at 20 °C to 2.49% at 600 °C, a 43.9% increase. Notably, as the peak strain increased sharply above 300 °C, the critical temperature at which granite transforms from brittle to ductile behavior was determined to be 300 °C. Furthermore, the Es of granite gradually decreased with increasing applied temperature. These phenomena indicate that mechanical properties of granite will obviously deteriorate after thermal shock. The full uniaxial compression test results are shown in Table 1.

4. Dynamic Compression Test Results and Analysis

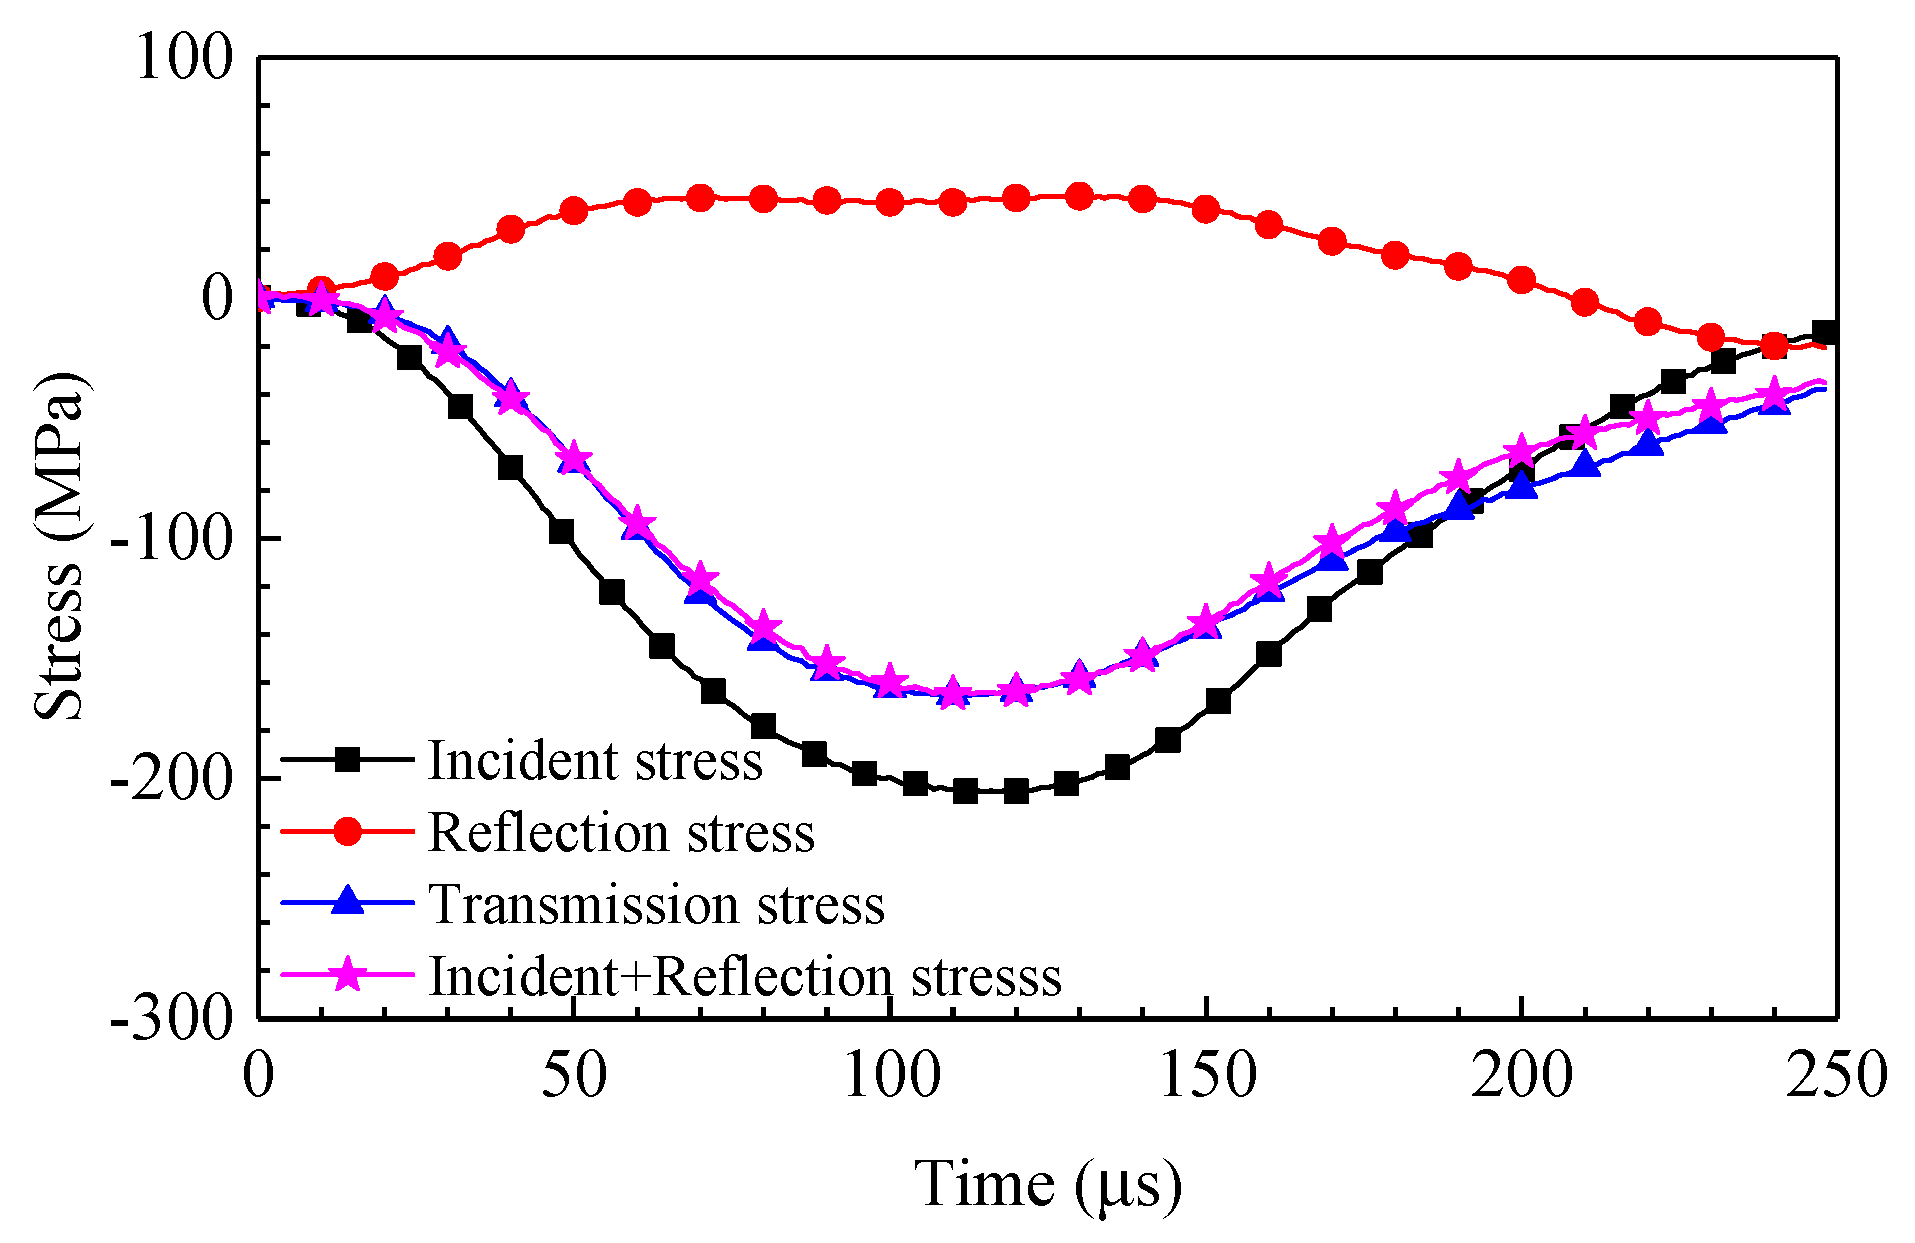
4.1. Investigation of Dynamic Stress Balance

The dynamic compression test cannot be initiated until the incident waveform is completely transmitted (no reflected waveform) in the pre-impact test when the incident bar and transmission bar are fully concentrically aligned. During the test, specimens were clamped between incident and transmission bars, and a suitable quantity of petroleum jelly was symmetrically applied to interfaces between the specimen and elastic bars to ensure effective contact. Figure 6 shows that the sum of reflection stress and incident stress at the incident interface was equal to the transmission stress at the transmitted interface, so the stress was balanced at both ends of the specimen, and the test results were considered effective. The reflected wave primarily reflects the strain rate history of the specimen, and has a very long plateau that represents the constant strain rate loading, and the transmitted wave primarily reflects the stress variation in the specimen. Note that all data that did not meet the assumed stress balance were eliminated to ensure reliable results.

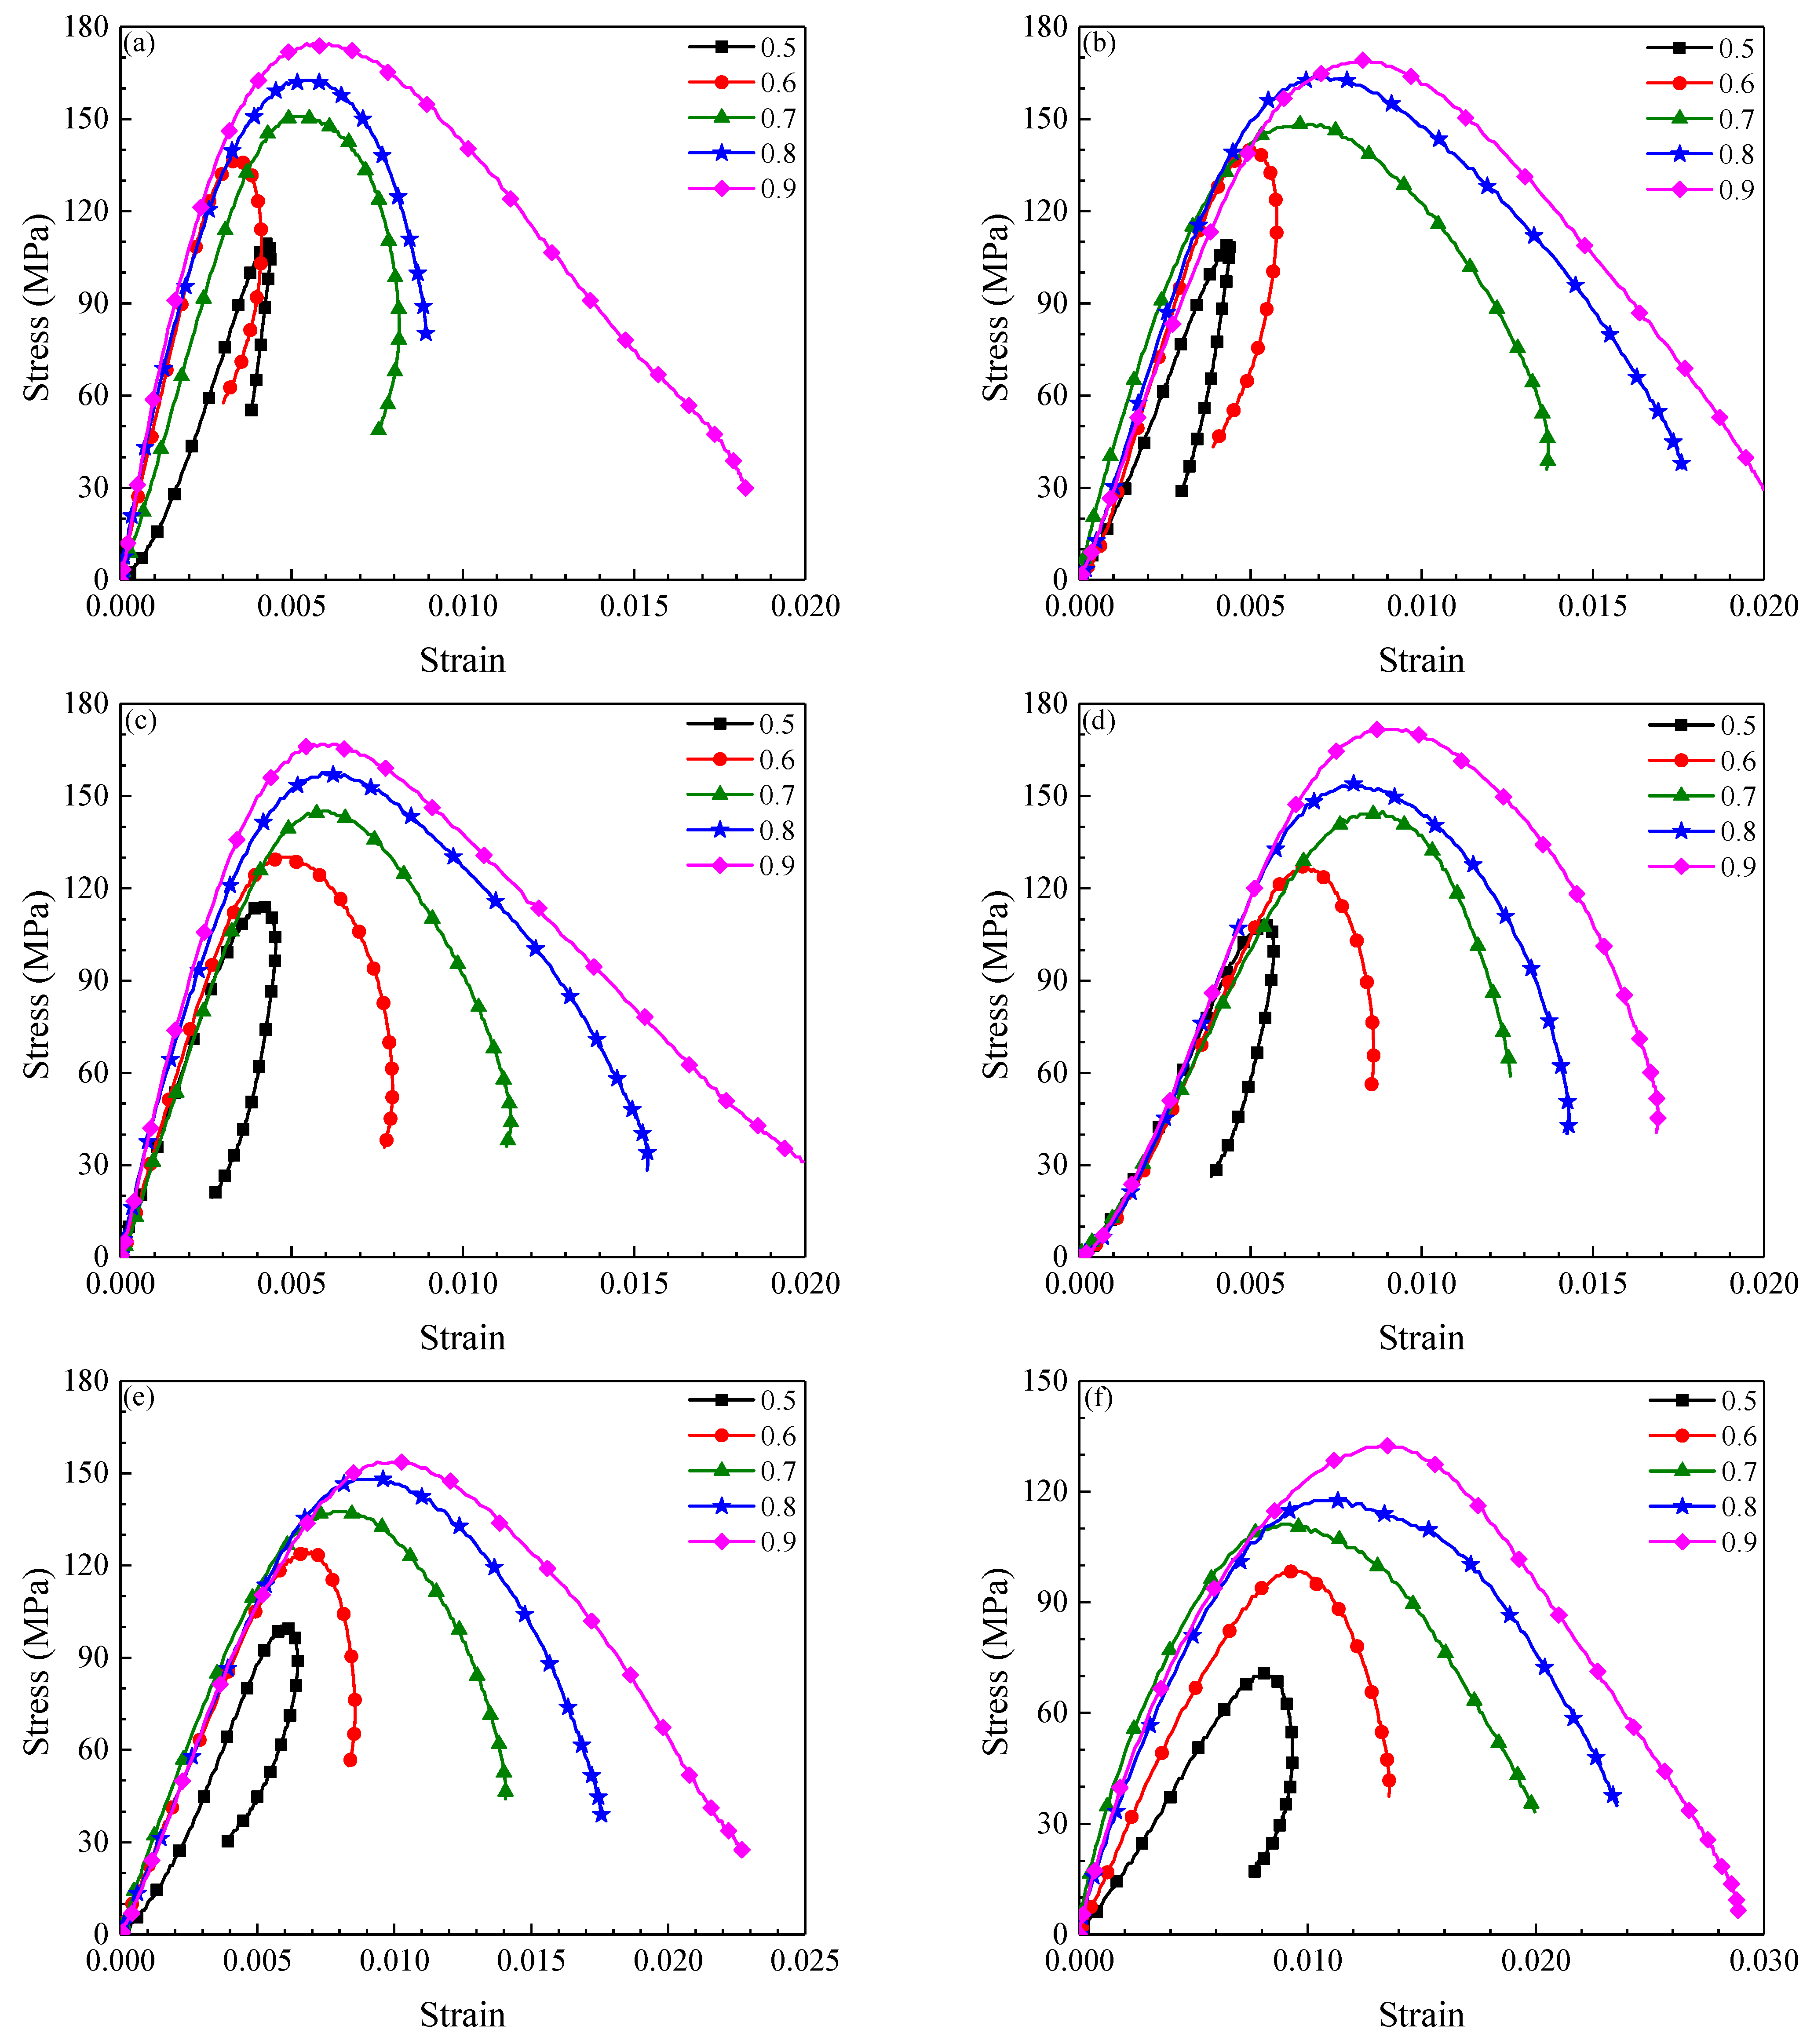
4.2. Dynamic Stress-Strain Curves

According to the theory of stress wave propagation, the dynamic mechanical parameters (σd, Ed and ε ˙ ) of the specimens were calculated with the results listed in Table 2. Because the speed with which the internal micro-cracks closed was much lower than the loading rate, the dynamic stress-strain curves exhibited no obvious compaction stage compared with the static stress-strain curves (Figure 7). On the one hand, the dynamic strain exhibited a rebound phenomenon at the lower impact gas pressure, when the stress-strain curves are defined as Class II (indicating that unloading occurred in the post-peak stage), and the specimen exhibited a spontaneous failure. On the other hand, the strain increased monotonically at higher impact gas pressure, and the stress-strain curves were defined as Class I (indicating a strain softening process in the post-peak stage). Thus, at the same temperature, the stress strain curves gradually transformed from Class II to Class I with increasing impact gas pressure. When the impact gas pressure was 0.6 MPa, the post-peak modulus of the stress-strain curve was greater than zero below 300 °C (Class II), but the post-peak modulus was less than zero above 300 °C (Class I) [26]. Therefore, 300 °C can be considered as the critical temperature at which stress-strain curves of granite transition from Class II to Class I behavior at a 0.6 MPa impact gas pressure (Figure 7). Furthermore, for the same applied temperature, the peak stress and peak strain of specimens have a tendency to increase with increasing impact gas pressure.

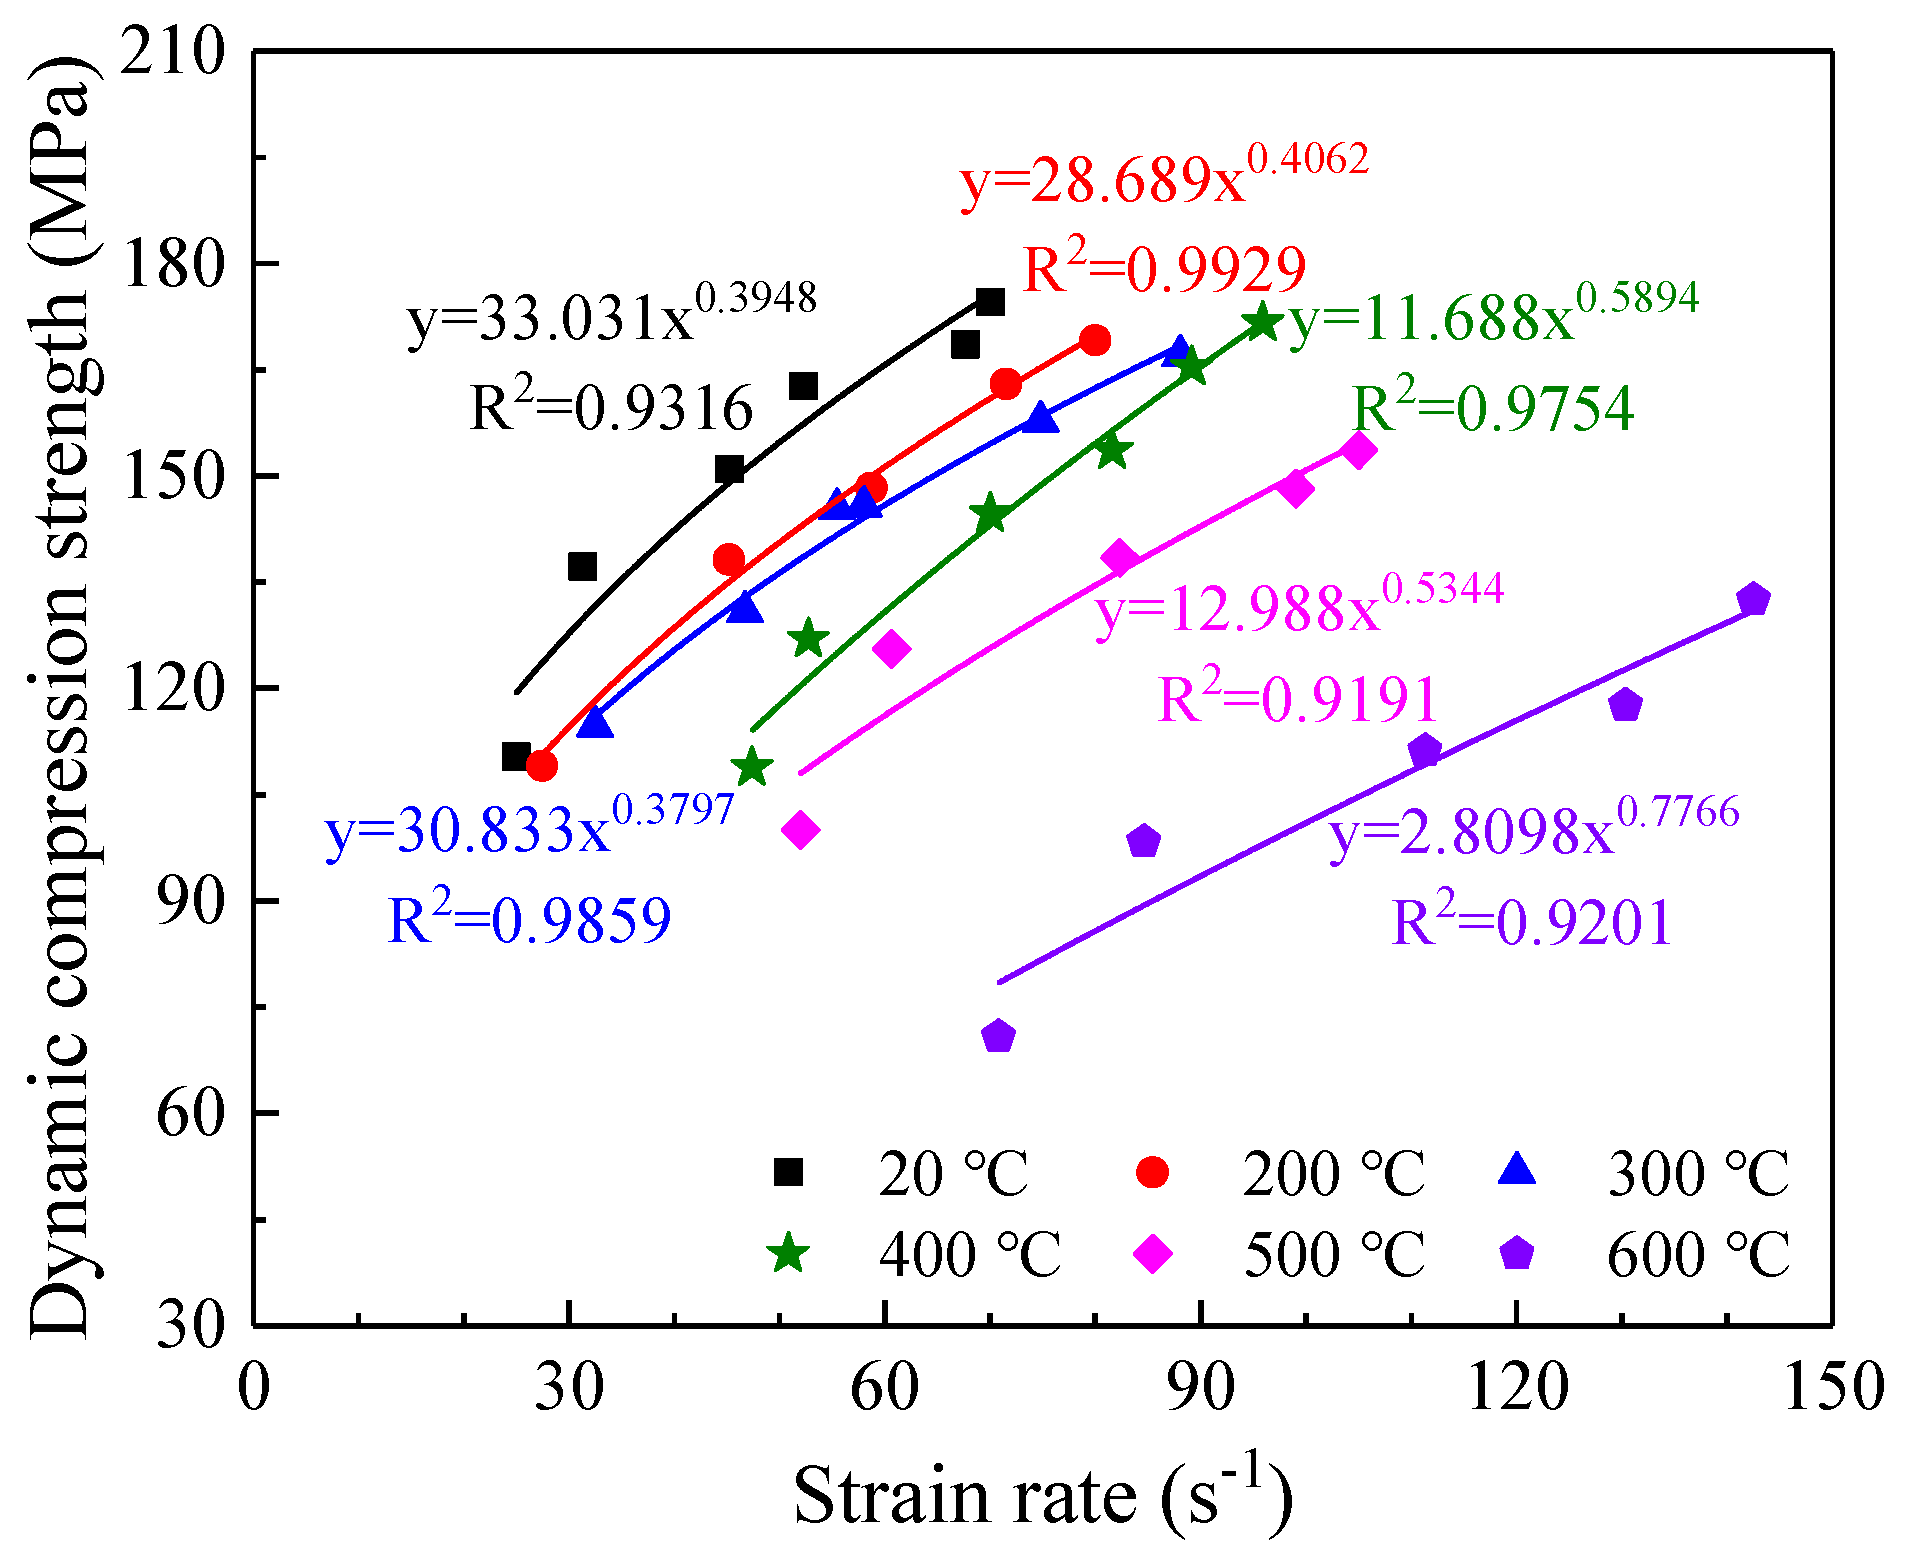
4.3. Strain Rate Effect on Granite after Thermal Shock

At the same temperature, the σd of the specimens exhibited an obvious strain rate response as the impact gas pressure increased (Figure 8). Temperature was also observed to play an important role in the σd under similar strain rates. For example, when the strain rate was around 70 s−1, the σd decreased from 174.6 MPa at 20 °C to 70.8 MPa at 600 °C, a 103.8 MPa reduction. Therefore, the relationship between σd and strain rate must consider the effect of temperature. The σd and strain rate can be great fitted into an exponential form as follows:
{ σ T 1 = 33.031 ε ˙ T 1 0.3948 R 2 = 0.9316 σ T 2 = 28.689 ε ˙ T 2 0.4062 R 2 = 0.9929 σ T 3 = 30.833 ε ˙ T 3 0.3797 R 2 = 0.9859 σ T 4 = 11.688 ε ˙ T 4 0.5894 R 2 = 0.9754 σ T 5 = 12.988 ε ˙ T 5 0.5344 R 2 = 0.9191 σ T 6 = 2.8098 ε ˙ T 6 0.7766 R 2 = 0.9201
where T1, T2, T3, T4, T5 and T6 are 20 °C, 200 °C, 300 °C, 400 °C, 500 °C and 600 °C, respectively.
The DIF is generally used as an index for the evaluation of the relationship between σd and strain rate, and is defined as follows [33]:
D I F = σ d / σ s
where σs is static compressive strength and is equal to UCS, and σd is dynamic compressive strength.
Figure 9 shows that the DIF exhibited a clear linear relation with the lg ( ε ˙ ) at the same temperature. Similarly, this result was found by Wang [33]. However, the curves slopes clearly differ according to temperatures. On the one hand, thermally induced cracks were not visible below 300 °C [19], so the slopes of the corresponding curves can be observed to be approximately equal. On the other hand, the slopes of the curves are significantly different above 300 °C. Because the thermally induced cracks on the surface of the specimen grow rapidly above 300 °C [17], the deformation resistance capacity of the specimen decreased. Therefore, lg ( ε ˙ ) increased significantly with increasing temperature under the same incident energy. The distribution of thermally induced surface cracks observed in the granite specimens will be discussed in Section 5.
To characterize the relationship between the DIF and lg ( ε ˙ ) , most scholars have used piecewise functions to fit the strain rate [47,48], and only a few consider the temperature effect [33]. The relationships between the DIF and the lg ( ε ˙ ) at different temperatures were given:
{ D I F T = 20 ° C = 1.3213 lg ( ε ˙ ) 0.7224 R 2 = 0.9554 D I F T = 200 ° C = 1.3229 lg ( ε ˙ ) 0.7738 R 2 = 0.9947 D I F T = 300 ° C = 1.4257 lg ( ε ˙ ) 0.8129 R 2 = 0.9913 D I F T = 400 ° C = 2.4966 lg ( ε ˙ ) 2.6745 R 2 = 0.9742 D I F T = 500 ° C = 2.3362 lg ( ε ˙ ) 2.4034 R 2 = 0.9344 D I F T = 600 ° C = 3.2006 lg ( ε ˙ ) 4.5351 R 2 = 0.9366

4.4. Temperature Sensitivity of Granite Behaviors

Figure 10 shows that temperature had an obvious effect on dynamic stress-strain curves of the granite specimens. Taking an impact gas pressure of 0.5 MPa as an example (Figure 10a), as the temperature increased, the starting point of strain recovery gradually moved away from the peak strain, causing the curves to exhibit Class II behavior. The strain rates of specimens increased from 25.1 s−1 at 20 °C to 70.8 s−1 at 600 °C, rising 182.1%, but σd decreased gradually from 109.0 MPa at 20 °C to 70.8 MPa at 600 °C, falling 35.0%. This result indicates that under the same impact gas pressure, the strain rate increased with increasing temperature, whereas the σd decreased.
Figure 10b shows that the dynamic stress-strain curves all exhibited Class I behavior for an impact gas pressure of 0.9 MPa. The strain rate and σd exhibited similar laws to those for an impact gas pressure of 0.5 MPa, but the plastic failure of rock was more obvious. Meanwhile, the slopes of the elastic segment of the curves can be observed to decrease as the temperature increases, this result is consistent with that of the static compression test.

4.5. Dynamic Elastic Modulus of Granite under Thermal Shocking

The dynamic elastic modulus equation is given as follows [49].
E d = σ b σ a ε b ε a
where σb and σa are 60% and 40% of peak stress, respectively. εb and εa are strains corresponding to σb and σa, respectively.
Figure 11 and Table 2 show that under the same applied temperature, the Ed changed slightly with increasing impact gas pressure. Wang [33] et al. also found that strain rate has no significant effect on elastic modulus. Under the same impact gas pressure, the Ed exhibited an obviously decreasing trend with increasing temperature. Indeed, the Ed decreased from 32.7 GPa at 20 °C to 10.7 GPa at 600 °C when impact gas pressure was 0.5 MPa, a 67.3% reduction. Meanwhile, when impact gas pressure was 0.9 MPa, the Ed decreased from 46.4 GPa at 20 °C to 13.5 GPa at 600 °C, a 70.9% reduction. These results indicate that the attenuation of Ed value as the applied temperature increased from 20 °C to 600 °C increased slightly with increasing impact gas pressure (Figure 11b).

4.6. Energy Dissipation Features of Specimens under Thermal Shock

According to the elastic stress wave transmission theory, the expressions of the incident energy EI, reflected energy ER and transmitted energy ET are as follows [31]:
{ E I = A e ρ e C e 0 τ σ I 2 ( t ) d t E R = A e ρ e C e 0 τ σ R 2 ( t ) d t E T = A e ρ e C e 0 τ σ T 2 ( t ) d t
where ρe is the density of the elastic bars.
According to the law of energy conservation, the absorbed energy EA can be calculated as follows:
E A = E I E R E T
At the same temperature, the ER will increase linearly with EI (Figure 12); under the same EI, the higher the temperature, the greater the ER. These phenomena can be explained by the laws of reflection and transmission of elastic waves at the interface between different media (Figure 3a). The corresponding reflection (R) coefficient and transmission (T) coefficient are presented as follows [50]:
{ σ R = R σ I σ T = T σ I R = 1 n 1 + n T = 2 1 + n
where n is the ratio of the wave impedance of two materials, n = ρ 1 C 1 / ρ 2 C 2 .
The following conclusions can be drawn according to the ratios of wave impedances between the specimen and elastic bars at interfaces A1 and A2 shown in Figure 3a:
At interface A1, n = ρeCesCs > 1, R < 0, T < 1; At interface A2, n = ρsCseCe < 1, R > 0, T > 1.
At the same temperature, the Cs and ρs of the samples can be considered to be constant according to Table 1, so the wave impedance of granite was nearly the same regardless of applied impact gas pressure. The R at the incident end was invariable, combining Equations (7) and (9), it can well explain that the ER increased linearly with increasing EI. Meanwhile, the Cs and ρs gradually decreased with increasing temperature, leading to wave impedance of the specimen decrease. Therefore, n increased at the interface A1 (n > 1), and the corresponding |R| increased, essentially explaining that ER increased with increasing temperature under the same EI.
A part of the ET at the interface A1 is consumed by the energy dissipation of the rock fracture, and the other part of ET is transmitted and reflected as EI at the interface A2 (Figure 3a). Figure 13 shows that the ET logarithmically increased with increasing EI, indicating that the growth rate of ET slowed. Meanwhile, the ET decreased with increasing temperature under the same EI. In a word, the magnitude of ET was related to transmission coefficient of interface and energy absorption capacity of the specimen.
Figure 14 shows that the EA exhibited a linear increase with the EI for the same applied temperature. The greater the value of the EI, the more broken the specimen owing to the quantity of the energy absorbed. The curves slopes were all determined to be around 0.5, indicating that nearly half of the impact incident energy was reflected and harmlessly transmitted in the form of elastic waves.

5. Discussion

5.1. Dynamic Failure Modes of Specimens after Thermal Shock

Macroscopic spontaneous destruction occurs in the post-peak failure stage, so any stability analysis should pay careful attention to the post-peak failure properties of the rock. As discussed in Section 4.2, the stress–strain curves obtained in this study were divided into Class I and Class II behaviors according to previous literature [26,27]. Figure 15a shows that for an impact gas pressure of 0.9 MPa, the strain rate reached a stable state before achieving the peak stress, and there was an obvious plateau reflecting the constant strain rate loading. The strain rate still increased for some time after the peak stress was achieved, and the residual strain continued to increase until becoming stable. At this time, the specimen broke rapidly and pulverized, and the stress-strain curve exhibited Class I behavior. Figure 15b shows that the strain initially increased to a peak value before gradually decreasing, and the strain recovery led to the post-peak unloading, indicating stored energy was not high enough to fracture the sample in such a case. When the loading peak strain rate was 40.0 s−1, the stress was about one-third of the peak stress. The unloading process enabled the elastic recovery of the specimen, the unloading peak strain rate was −25.8 s−1, rapidly releasing the stored elastic energy and leading to a small split in the specimen. This stress-strain curve exhibited Class II behavior as it showed an obvious rebound.
Figure 16 shows that the specimens exhibited increasingly severe destruction as the impact gas pressure increased; the distribution ratios of small pieces and powder increased while the average size of the fragment decreased. The specimens were slightly broken with some debris for an impact gas pressure less than 0.7 MPa, but clearly absorbed more energy for an impact gas pressure greater than 0.7 MPa, when the specimen fragments were mostly debris and powder as the unit energy consumption increased. When the strain rate was about 45.1 s−1 (for an impact gas pressure of 0.7 MPa), the average size of the specimen fragment exhibited an obvious variation corresponding to the transition of the stress-strain curve from Class II to Class I in Figure 7a. The spontaneous failure at a low strain rate belongs to tensile spalling, and the fragments are comparatively intact. The specimen was crushed by excessive incident energy at a high strain rate, causing the smaller fragments to increase.
Under the same impact gas pressure, the failure modes of the specimen (Figure 17) changed significantly with increasing temperature, which transformed from a slight split at 20 °C to pulverization at 600 °C. The failure modes of the specimens were in complete agreement with the dynamic stress-strain curve transition from Class II to Class I behavior, as shown in Figure 7. This indicates that the increase of temperature reduced the critical impact gas pressure describing the stress-strain curves transition. Indeed, the rock failure modes are very sensitive to temperature, so the temperature effect must be considered in the design of structures to be constructed in rock mass. Furthermore, in addition to controlling the stability of the surrounding rock, heat treatment can be considered to reduce rock strength and thereby more effectively crush the rock. For example, the strain rate effect of high temperature rocks can be considered to improve the geothermal drilling effect.
The degree of specimen crushing was found to be aggravated by increases in incident energy and temperature, but the σd decreased as temperature increased or EI decreased (Figure 18). The relationship among the σd, temperature and EI are fitted as follows:
σ ( T , E I ) = 84.47 + 0.039 T + 0.617 E I 0.000155 T 2 0.00098 E I 2 0.000083 T E I R 2 = 0.937
Figure 18 and Equation (10) show that the same σd corresponded to multiple temperature and EI composite states. In a sense, the temperature and EI could equivalently transform for the same σd, but the degree of granite fragmentation in these states varied considerably. Therefore, the EI can be appropriately adjusted to account for the large differences among the ground temperatures of the different strata encountered in the process of rock drilling for deep excavations, thereby reducing the energy consumption required for rock crushing and improving rock drilling efficiency.

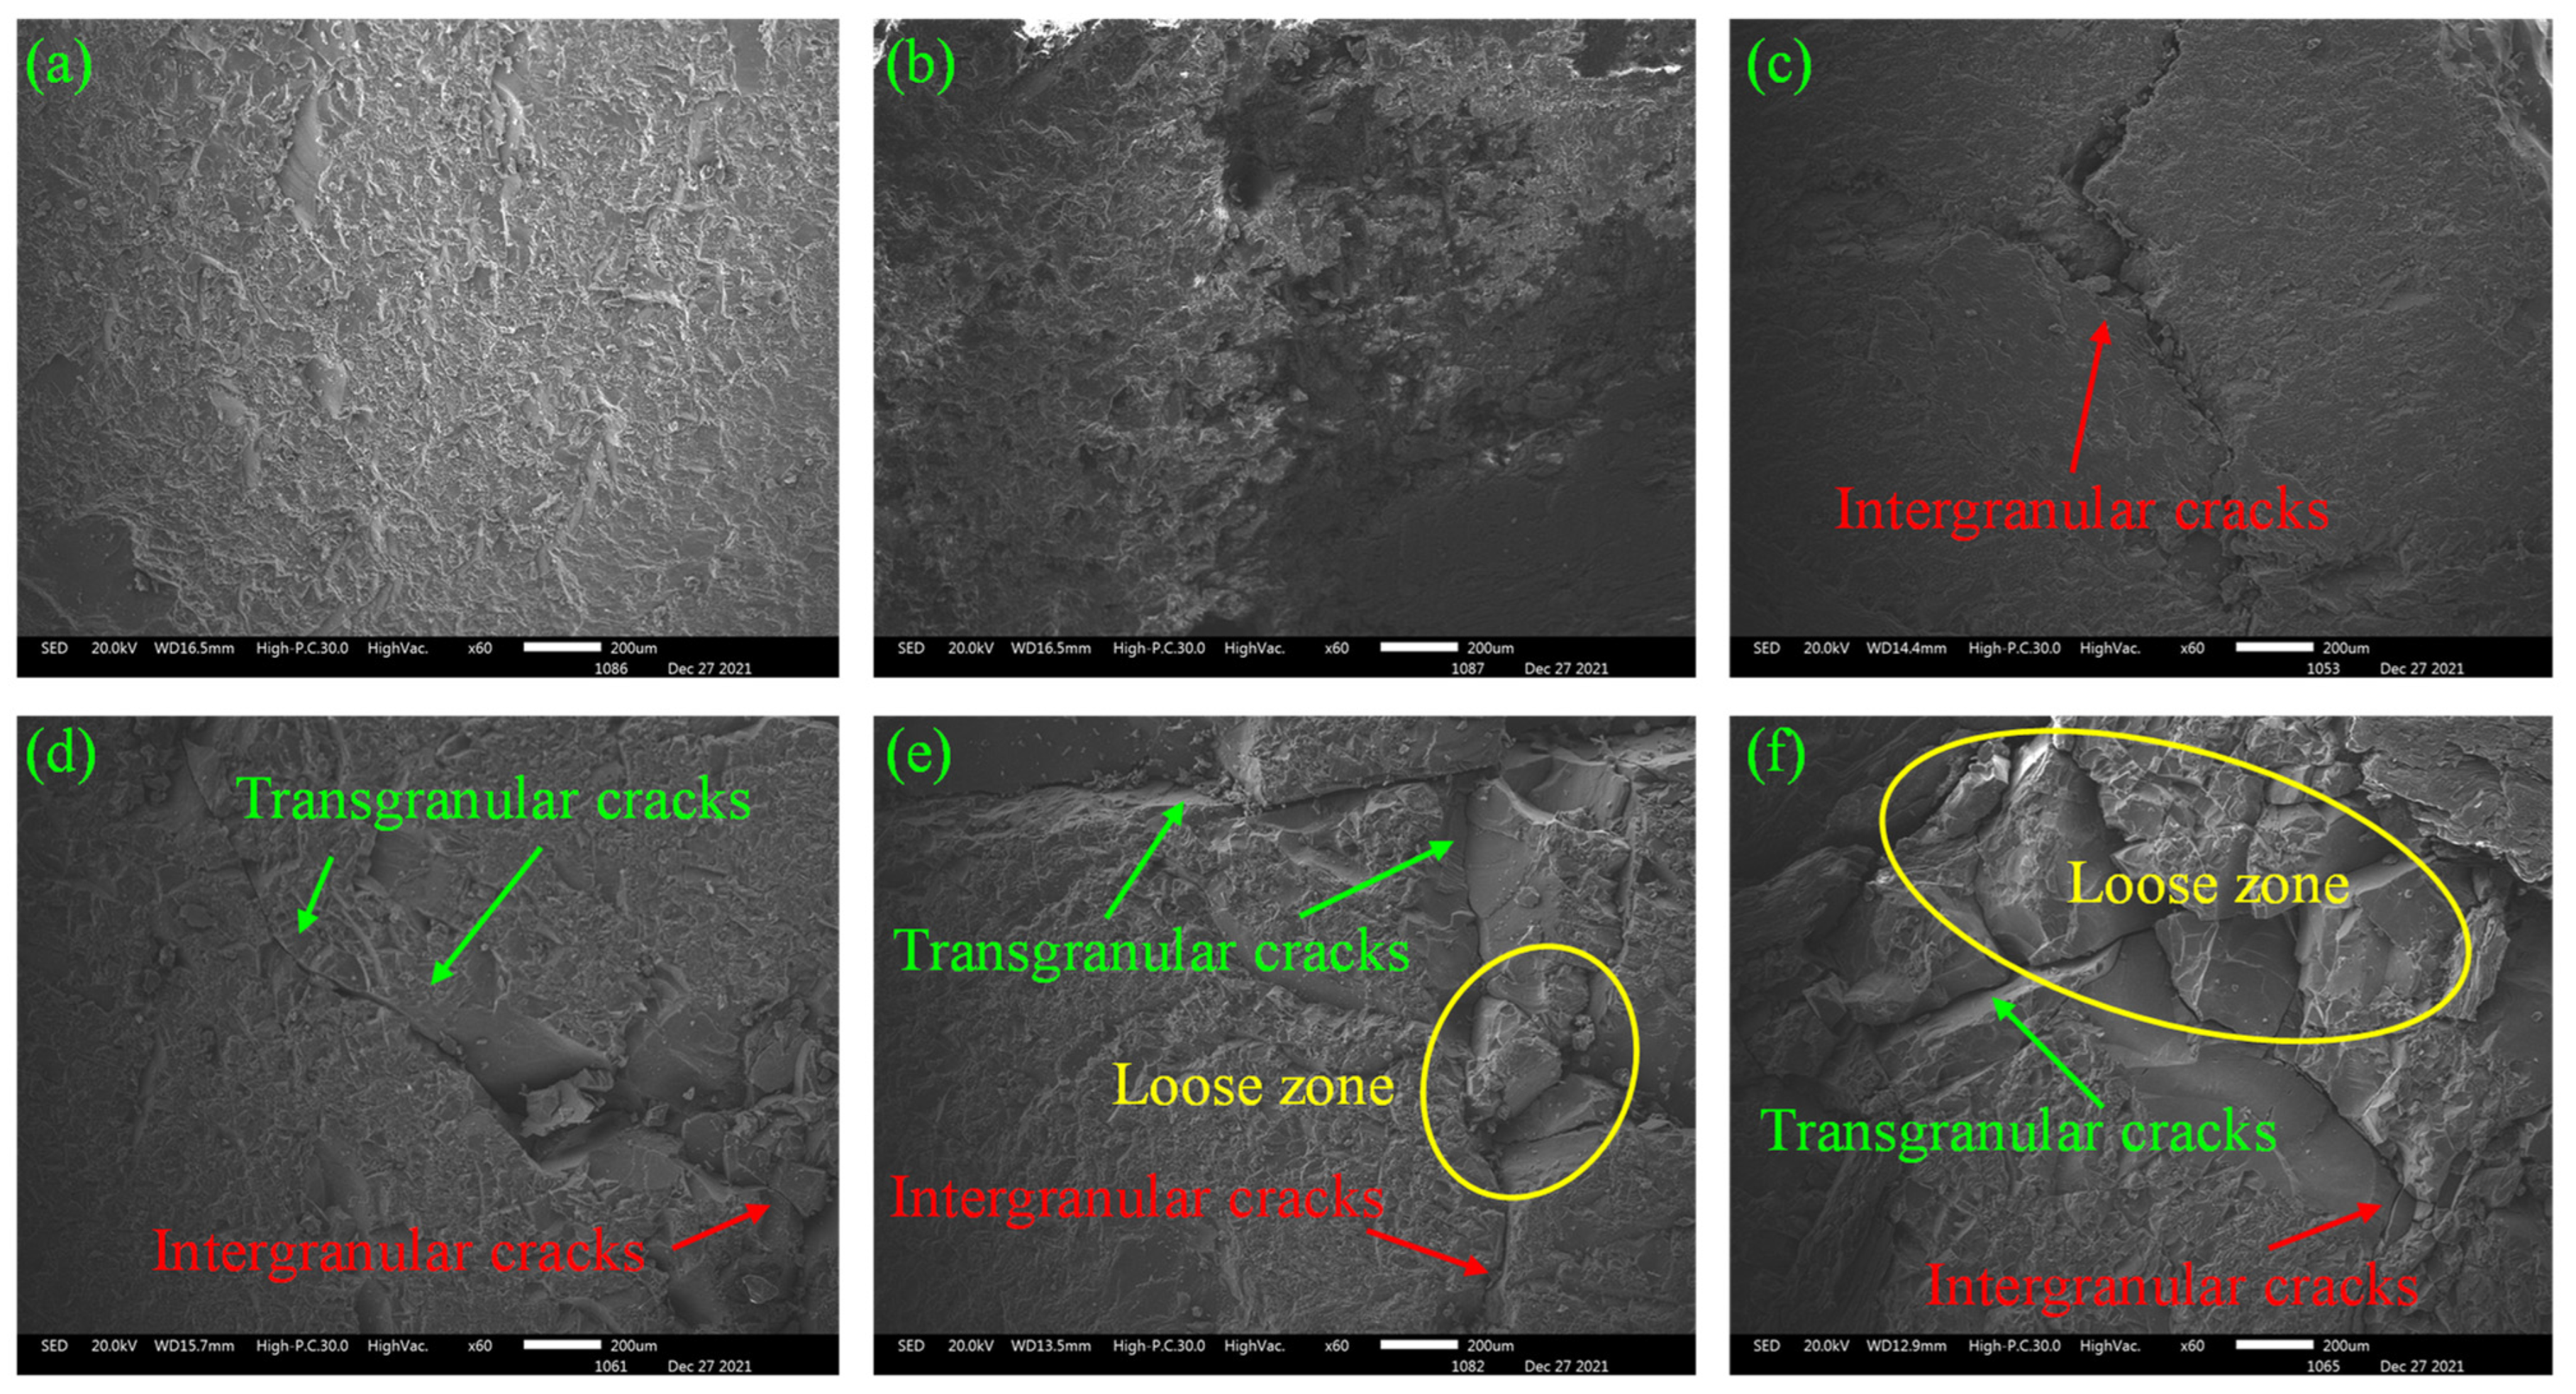
5.2. Thermal Damage Assessment based on SEM

The heat-treated granite specimens were sprayed with gold using an ion sputterer, then scanned by SEM to assess the thermal damage degrees of the specimen surface. Each SEM image was magnified 60 times to ensure comparability. Figure 19 shows the SEM images of the specimen surfaces after thermal shock. Firstly, it can be observed that the surfaces of the specimen were complete without obvious cracks for applied temperatures of less than 300 °C. Two intersecting intergranular cracks occurred on specimen surface at 300 °C, which can be considered as the critical temperature for thermal shock crack initiation. Finally, the surface cracks on the specimens developed quickly for applied temperatures above 300 °C, and the extent of the crack network increased. Especially for applied temperatures of 500 °C and 600 °C, obvious loose areas were present in addition to a lot of intergranular and transgranular cracks. These phenomena essentially reflect the decrease in ρs and Cs with increasing temperature. This is also why the higher the temperature, the more easily broken the specimen under the same EI. Therefore, for the same EA, the specimen subjected to higher temperatures before thermal shock were more uniformly broken and the powder was finer, primarily because the internal cracks in the granite were found to be more intensive after exposure to a high temperature. In other words, the energy required for crack propagation is relatively smaller. Taken together, these results indicate that thermal shock plays an important role in rock mass crushing and stability control.

6. Conclusions

In this study, dynamic compression testing of granite specimens under six temperatures and five impact gas pressures were performed using the SHPB system. Then, the effects of temperature and strain rate on the physical mechanical parameters, energy dissipation features and failure modes of granite were analyzed. The specific conclusions are summarized below:
(1)
The physical and mechanical parameters (mass, ρs, Cs, UCS and Es) of granite specimen decreased with increasing temperature, except for volume increased.
(2)
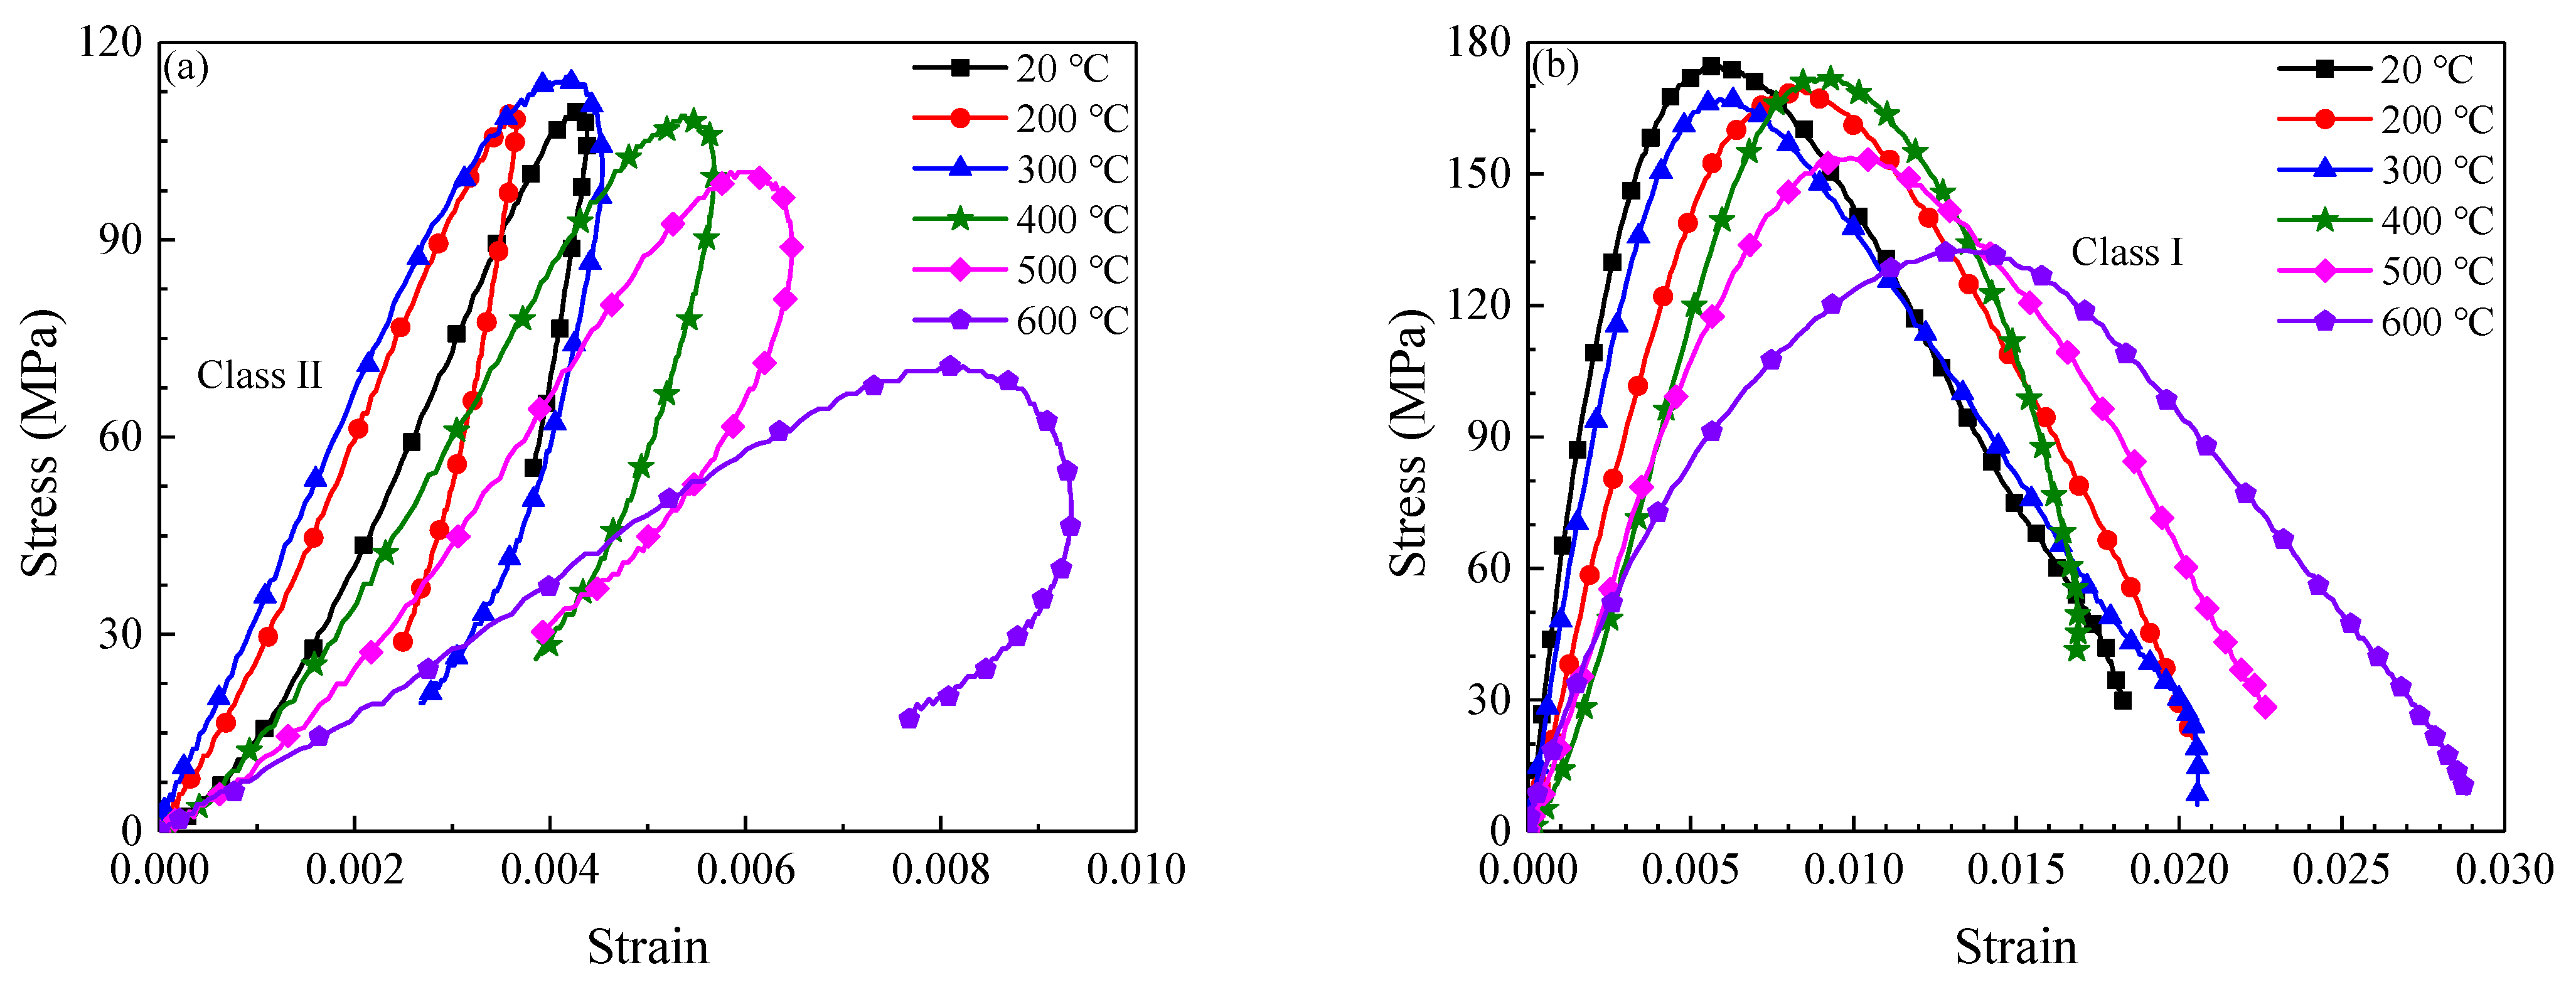
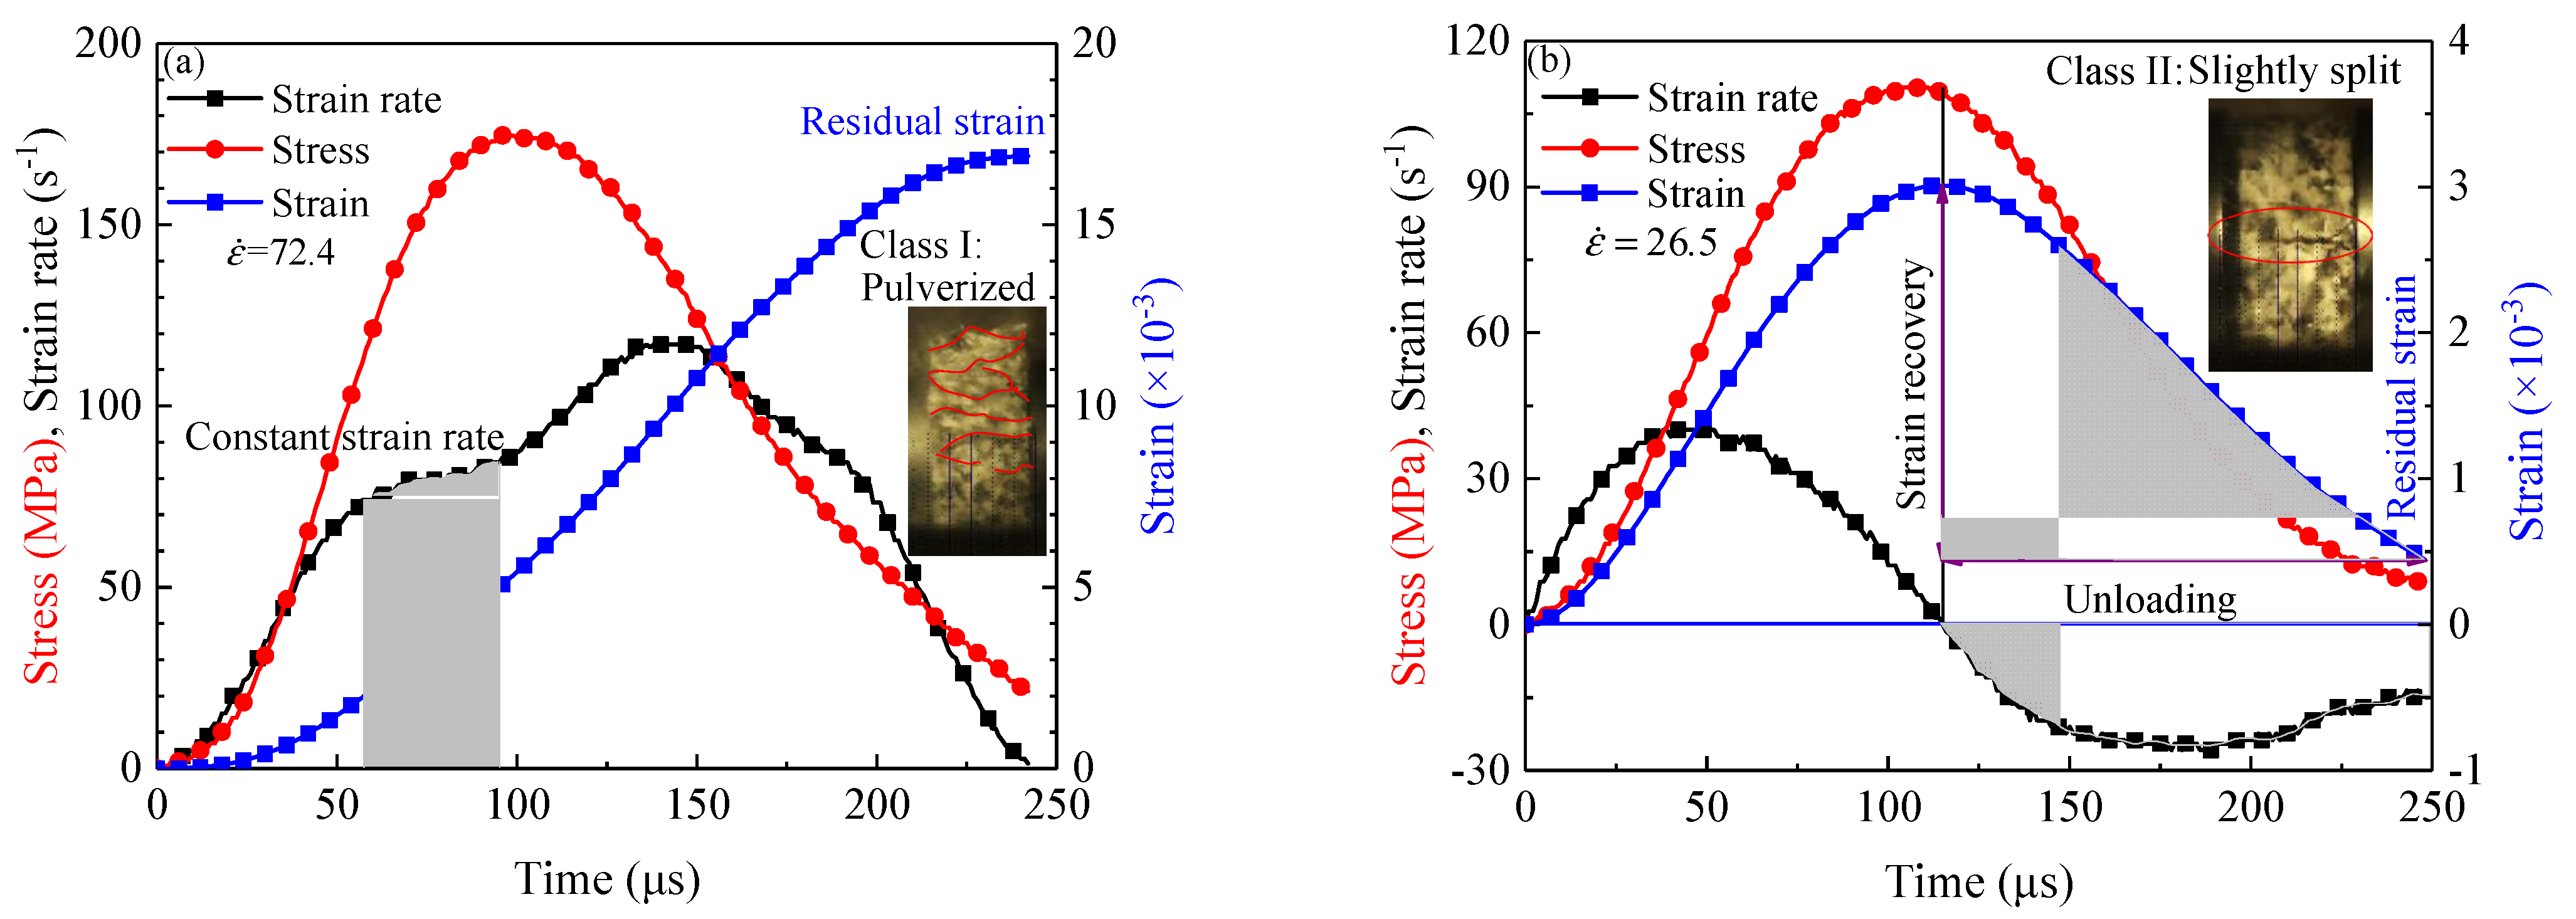
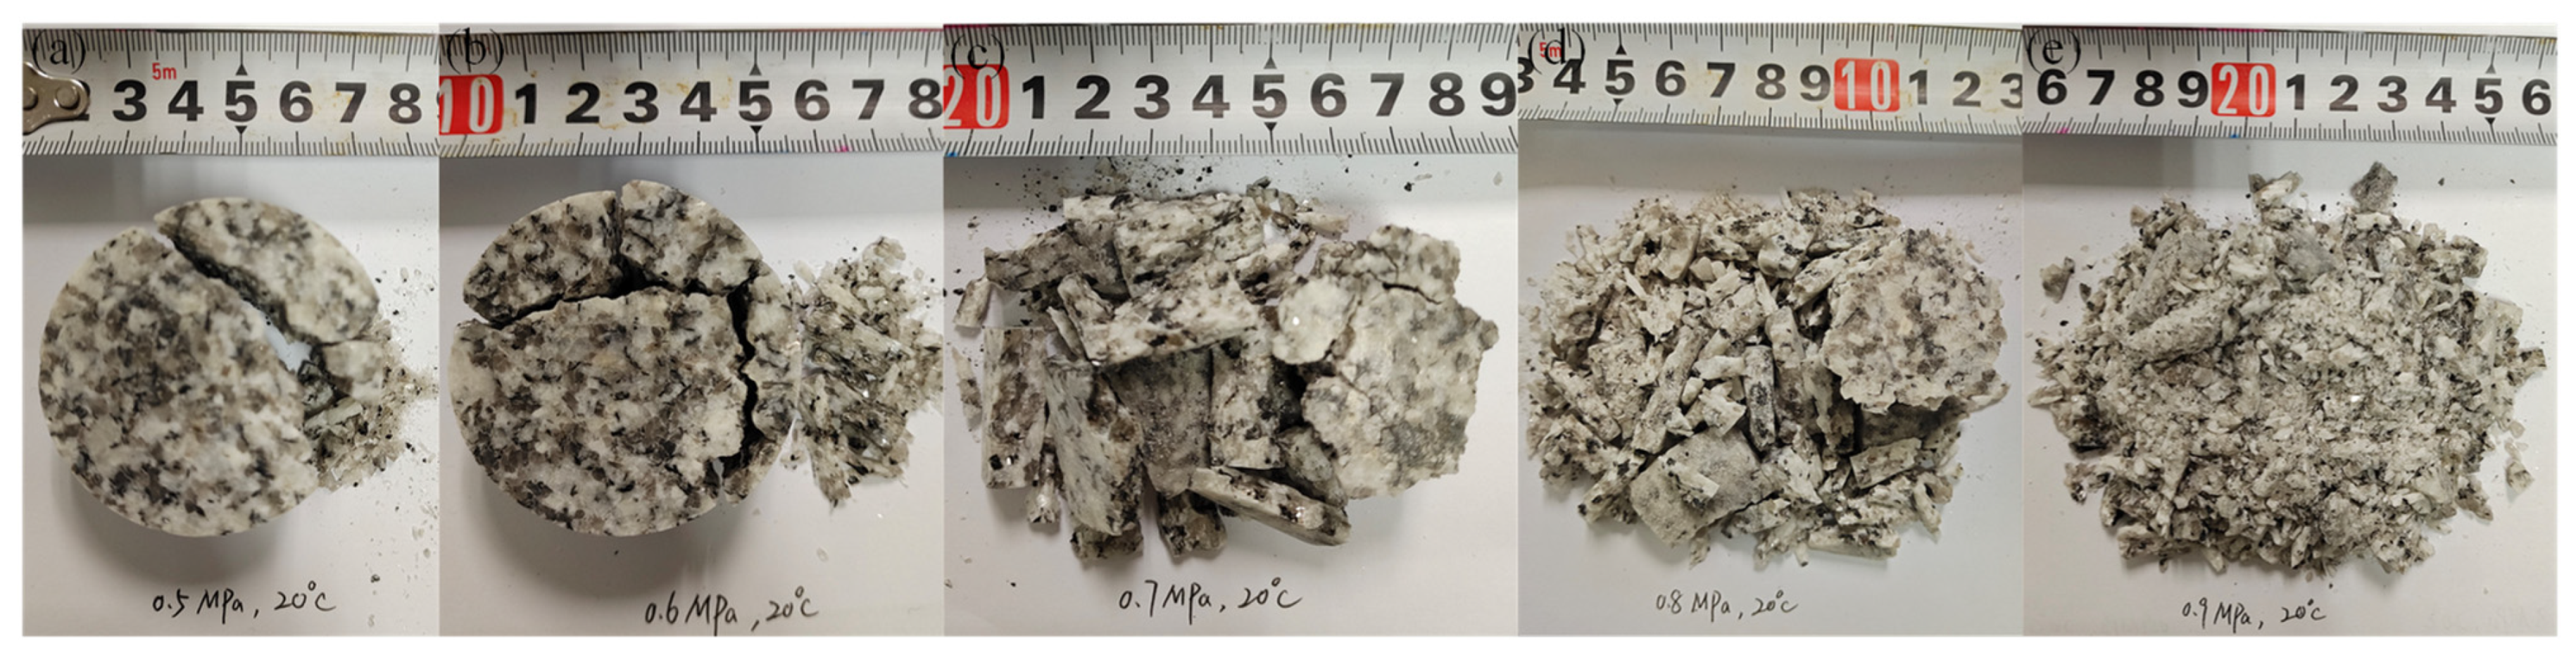
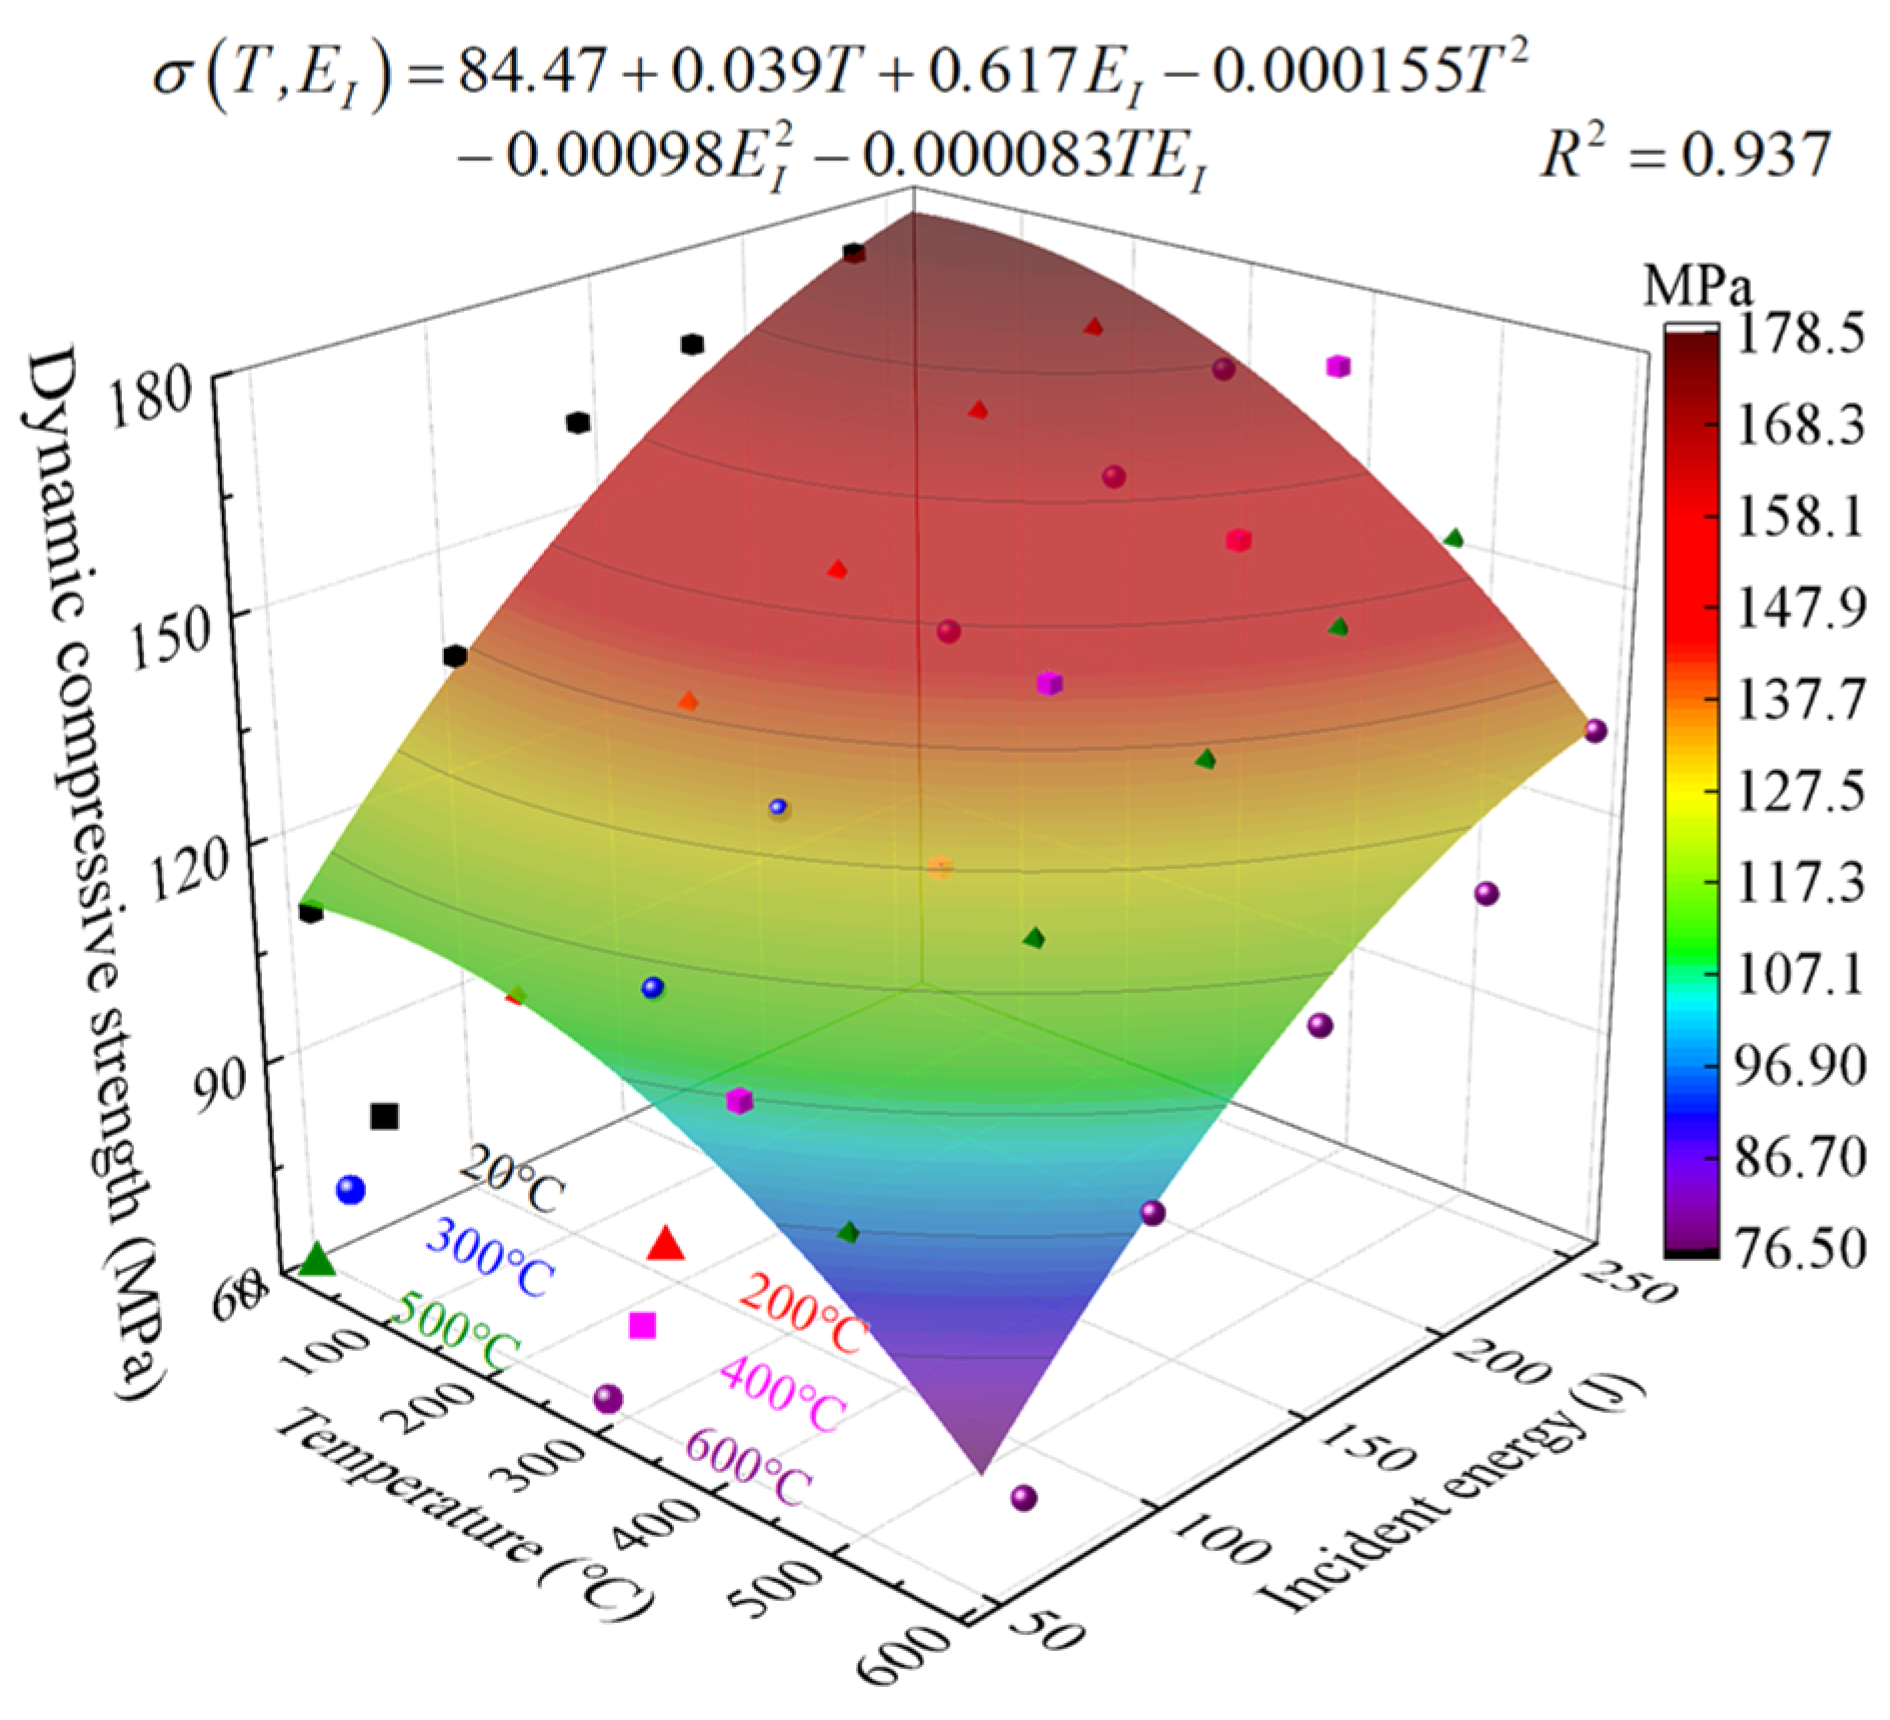
At the same temperature, the σd of granite specimens increased exponentially with increasing strain rate, and the stress-strain curves gradually transformed from Class II to Class I behavior. For the same strain rate or incident energy, the dynamic compressive strength decreased with increasing temperature. Therefore, the temperature and EI can equivalently transform for the same σd, but the degree of the granite fragmentation in these states varied considerably.
(3)
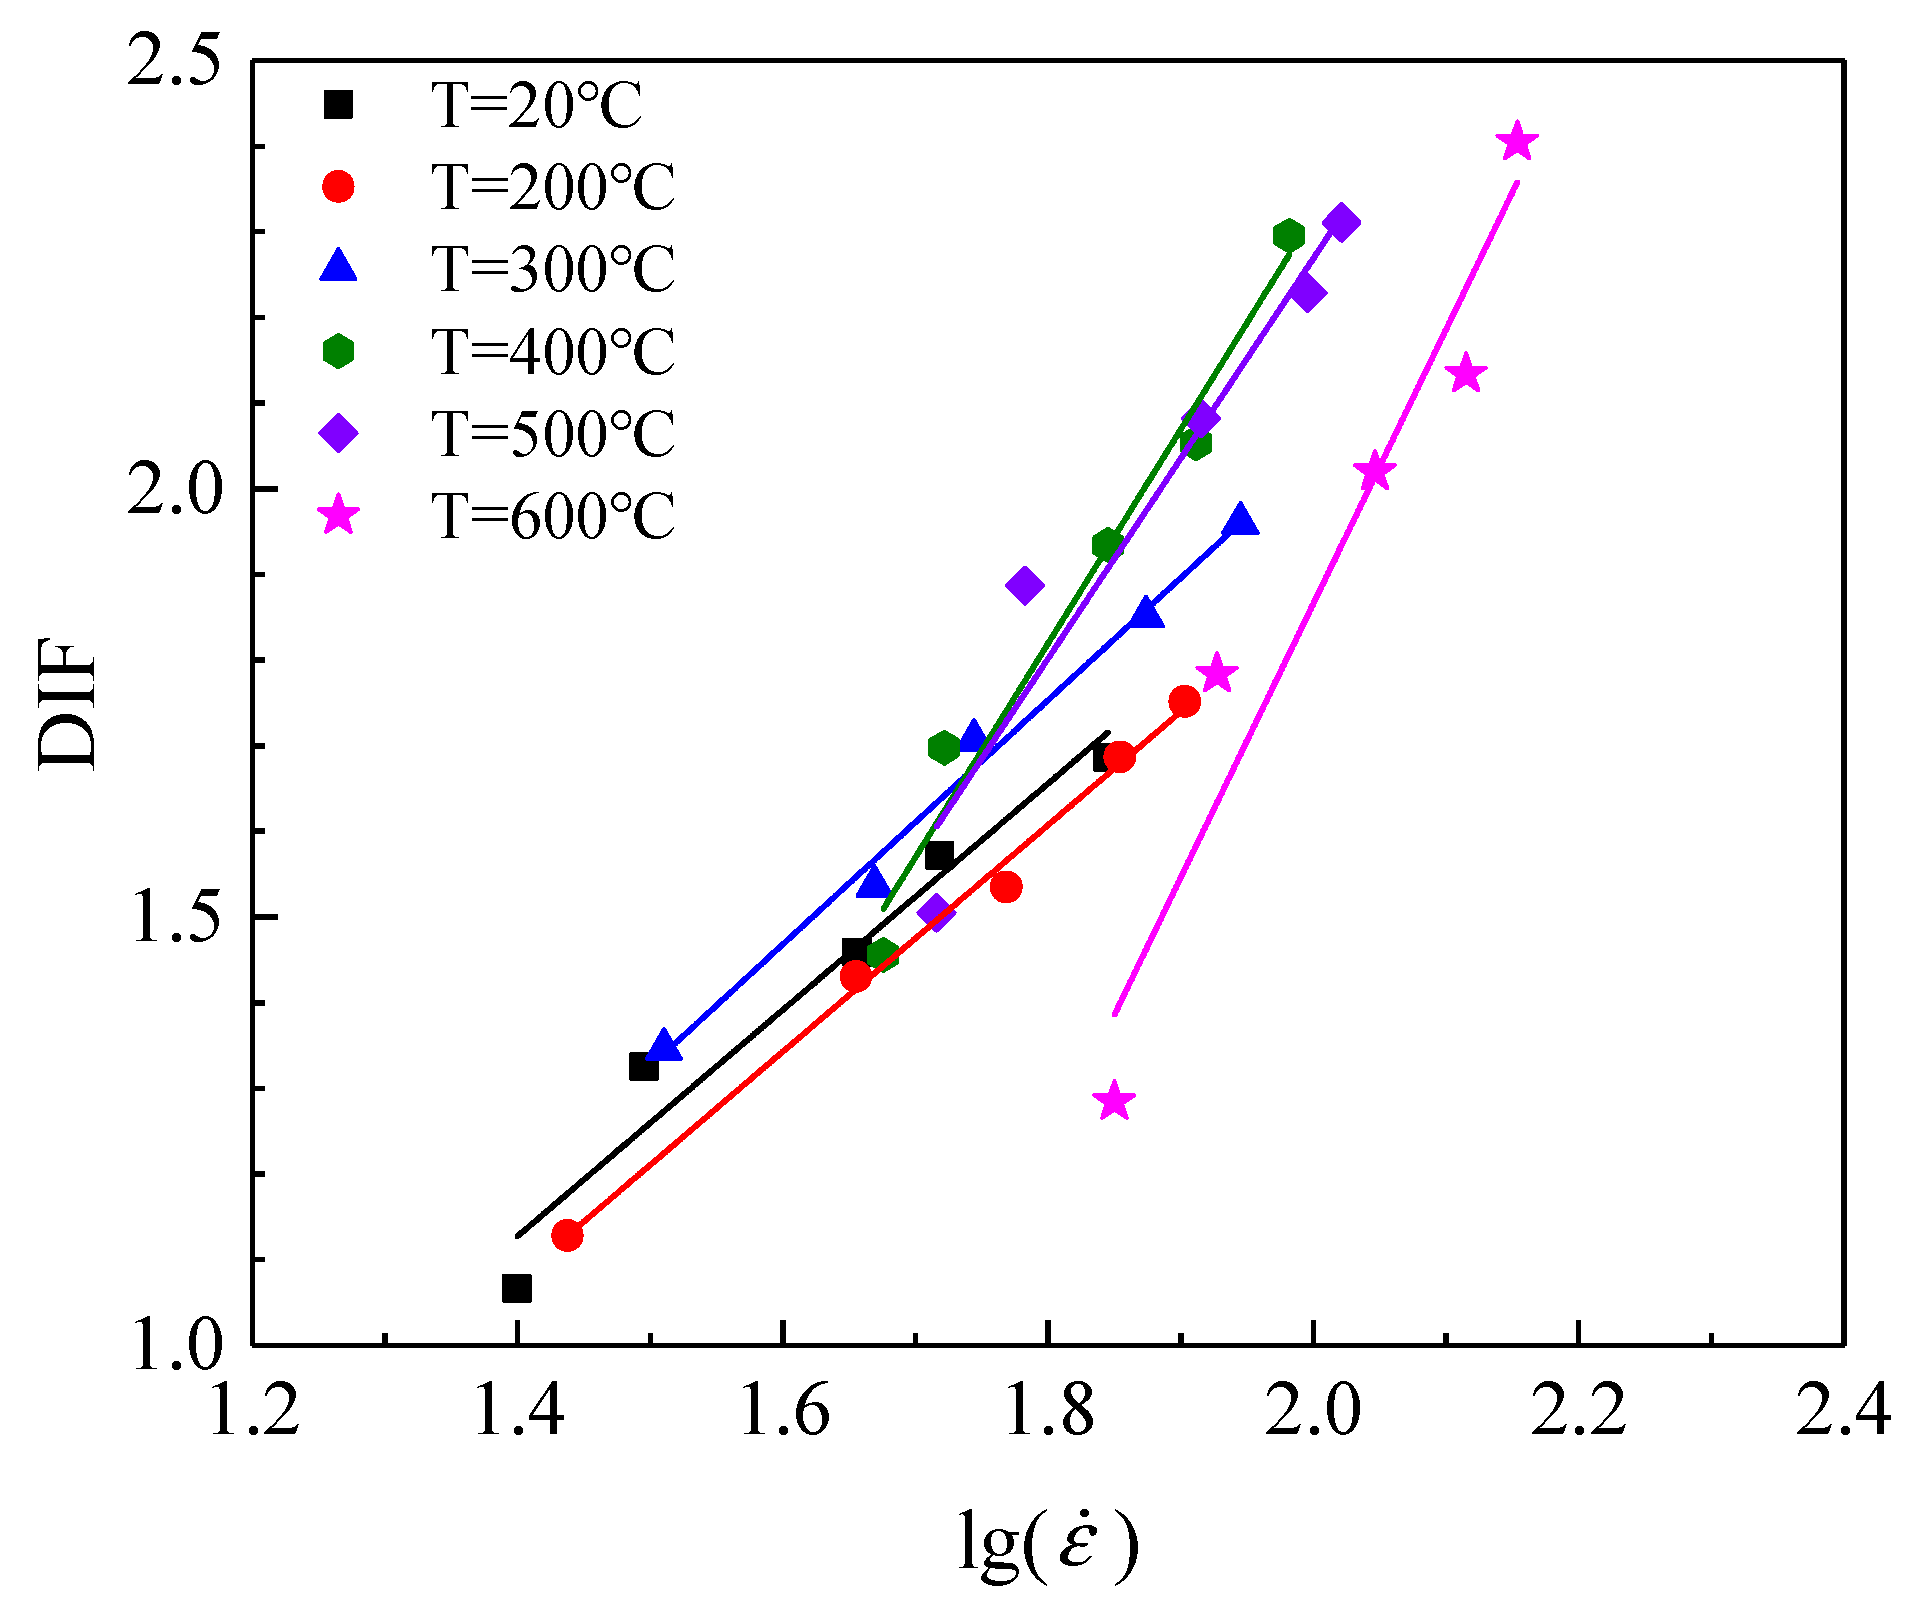
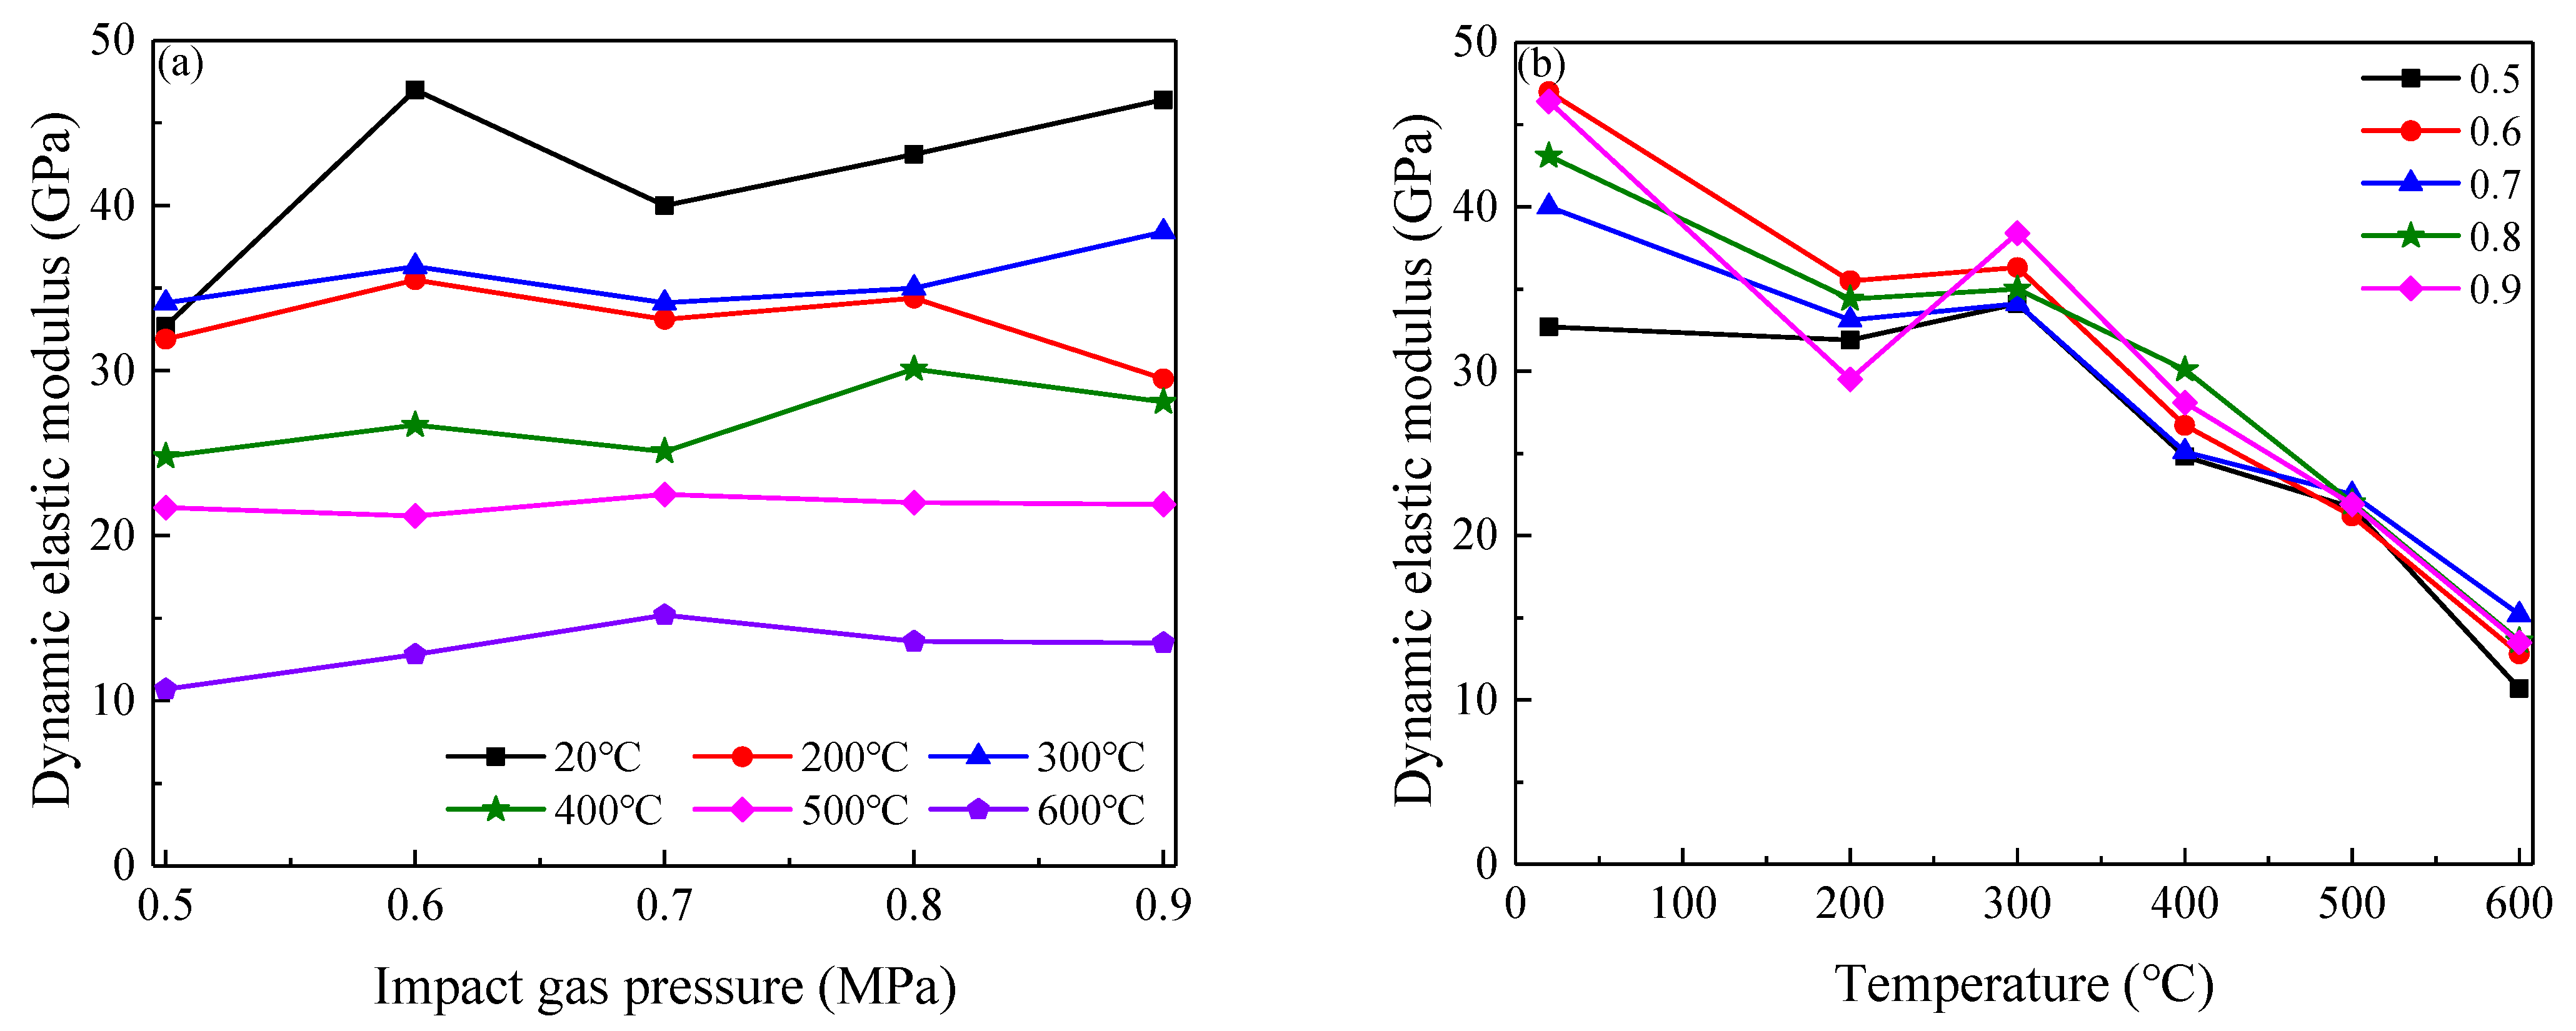
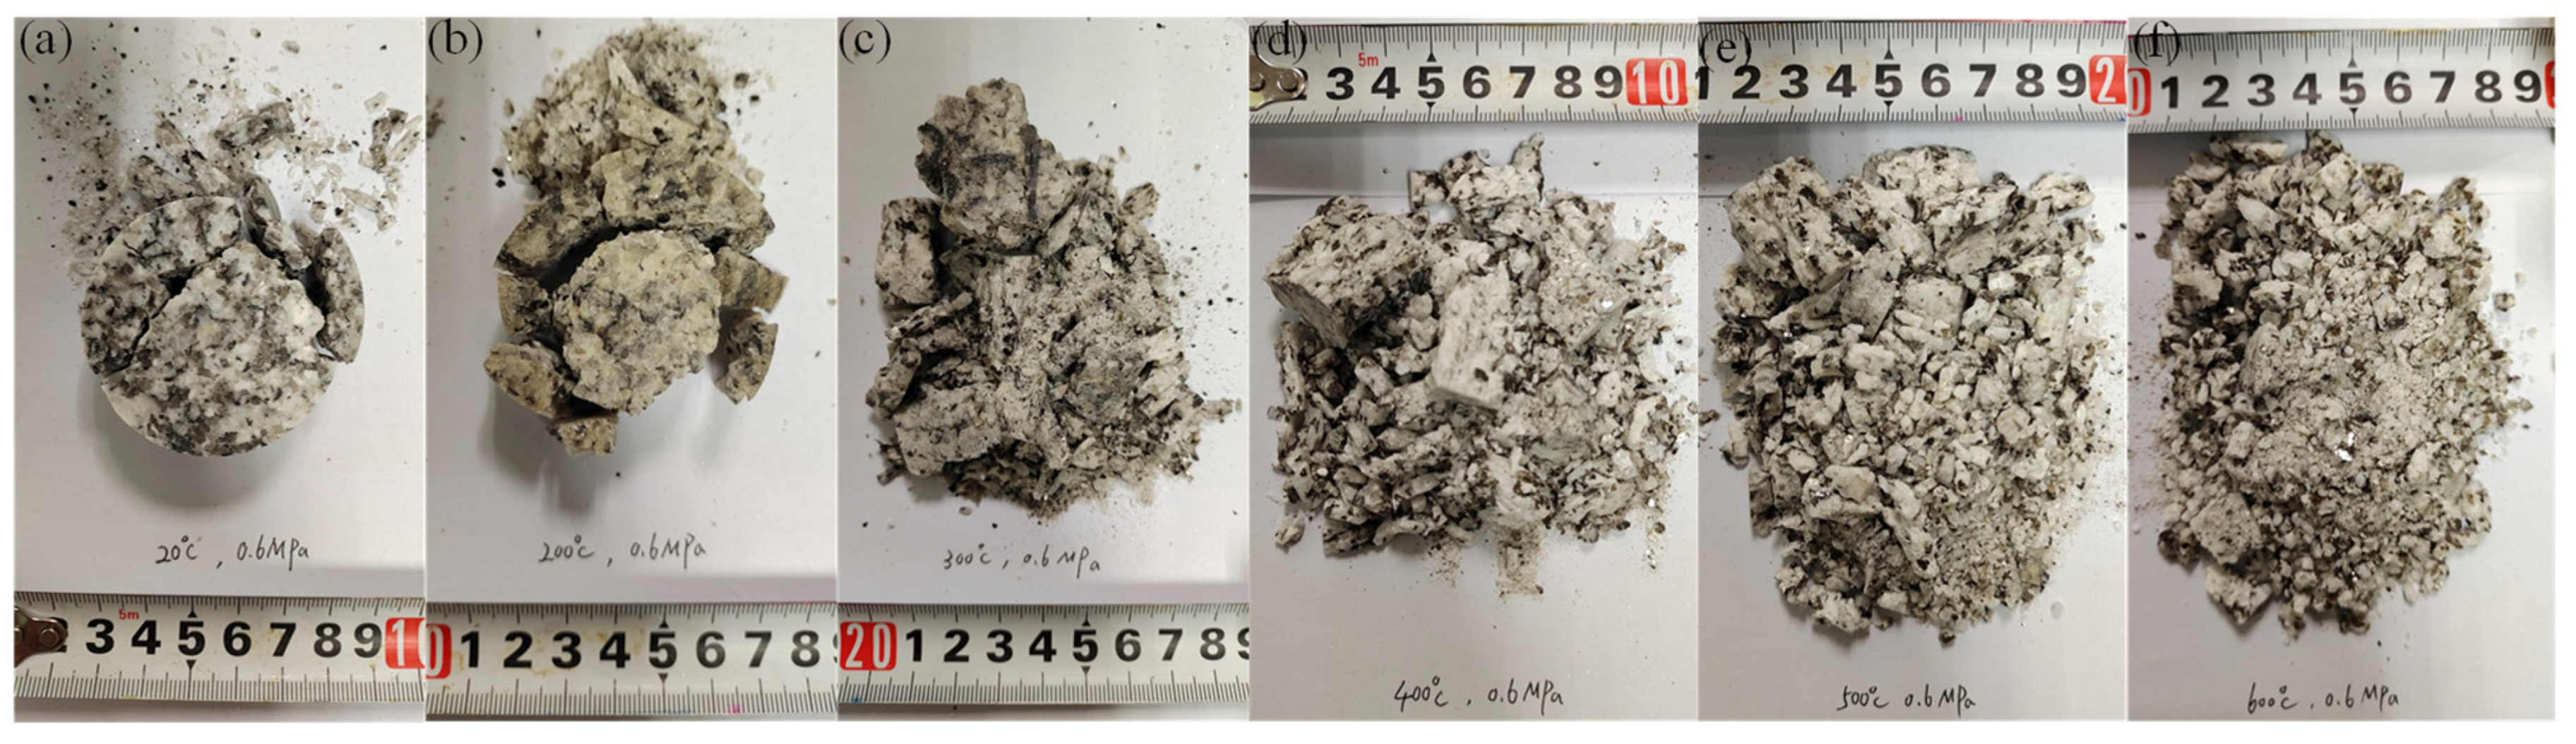
The DIF exhibited an obvious linear correlation with the lg ( ε ˙ ) at the same temperature. The Ed of granite was determined to be more sensitive to temperature than impact gas pressure and decreased obviously as the temperature increased. Meanwhile, the higher the temperature, the greater the strain rate and the more severe the specimen failure, and the failure modes of the granite changed from brittle to ductile.
(4)
When the impact gas pressure was 0.6 MPa, the critical temperature for the stress-strain curve transition from Class II to Class I behavior was determined to be 300 °C.
(5)
The critical temperature of the crack initiation of granite was determined to be 300 °C. As the temperature increased, the initiation cracks in the granite specimen surface developed from intergranular cracks to transgranular cracks. Furthermore, a number of loose areas were observed on the granite specimens subjected to higher temperatures, especially those greater than 500 °C.
(6)
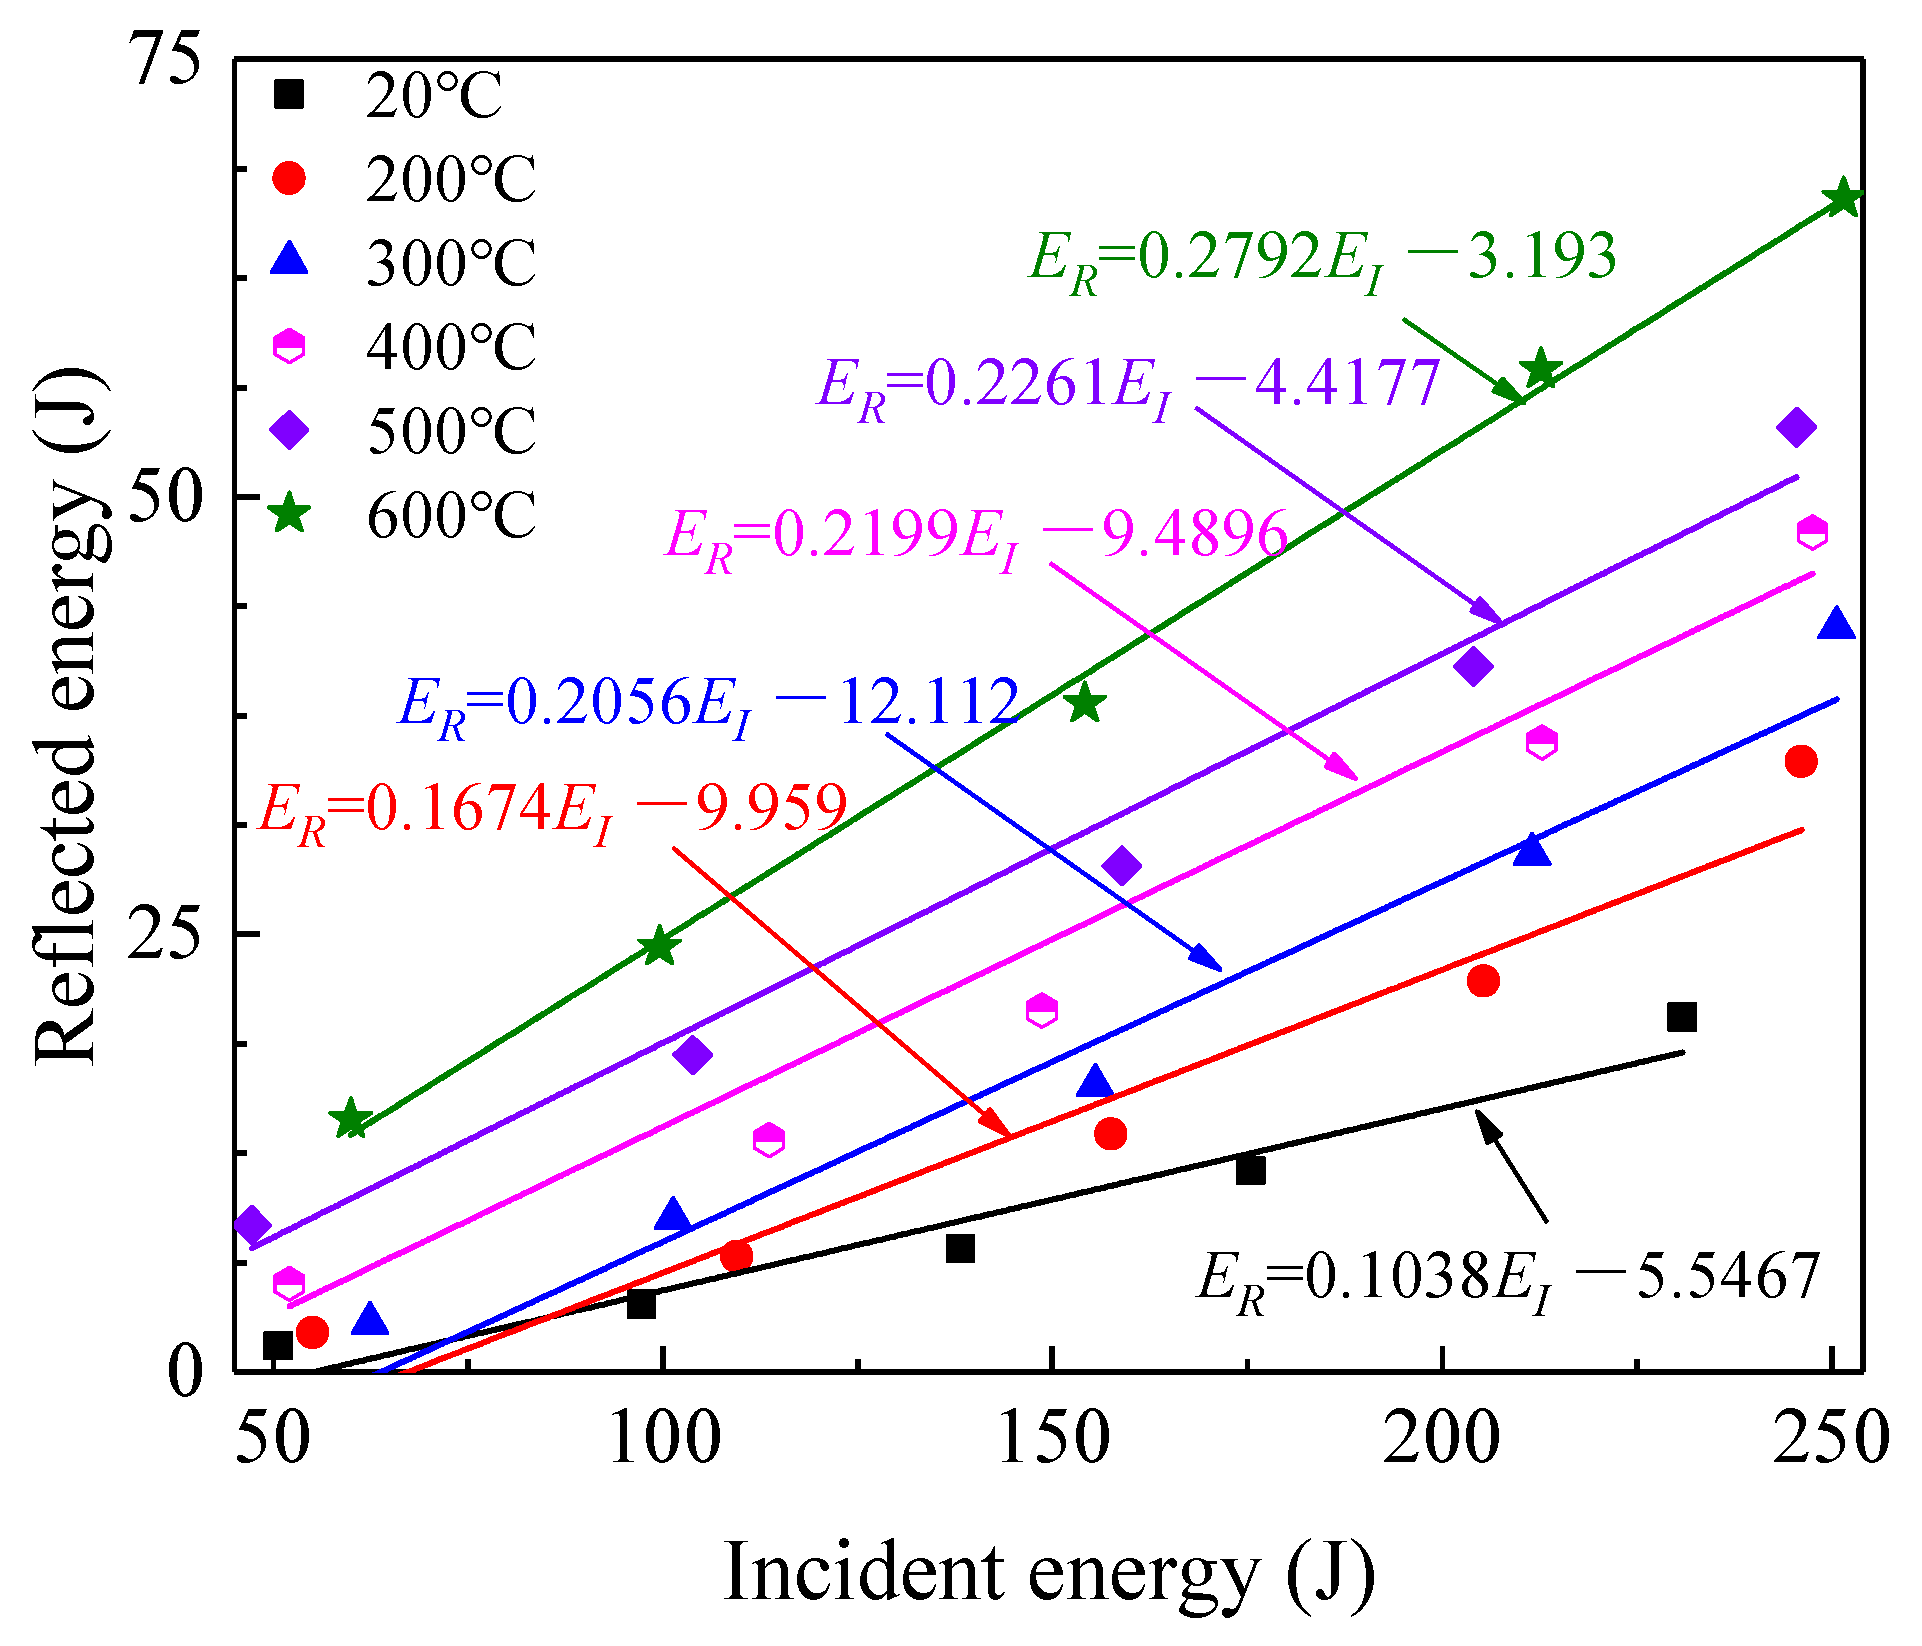
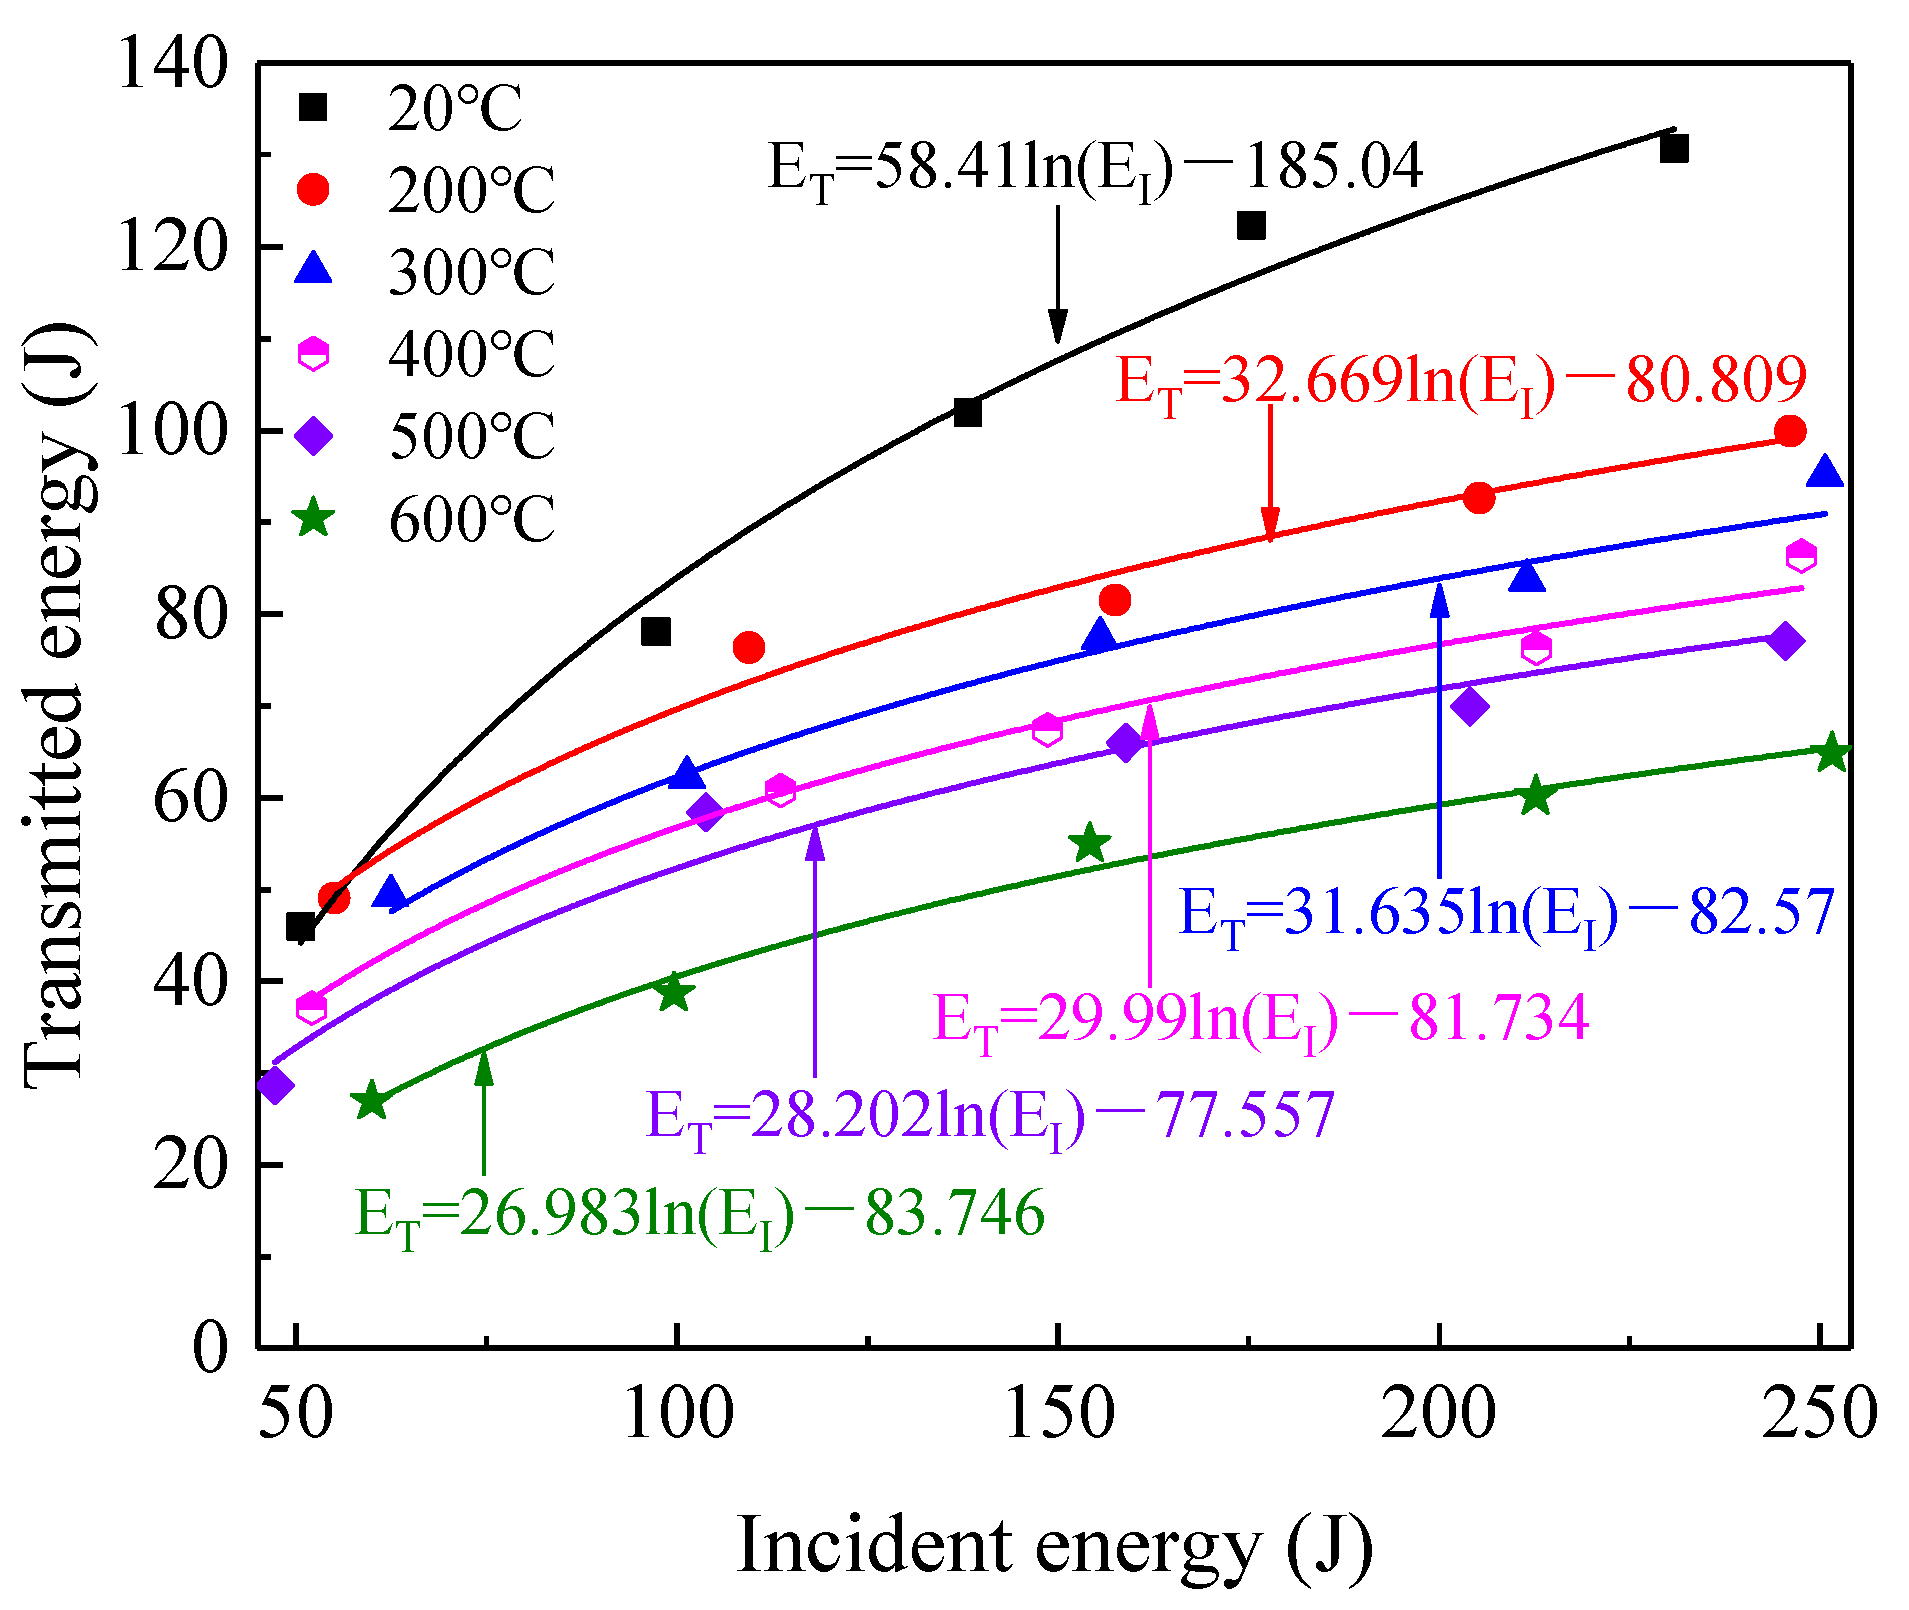
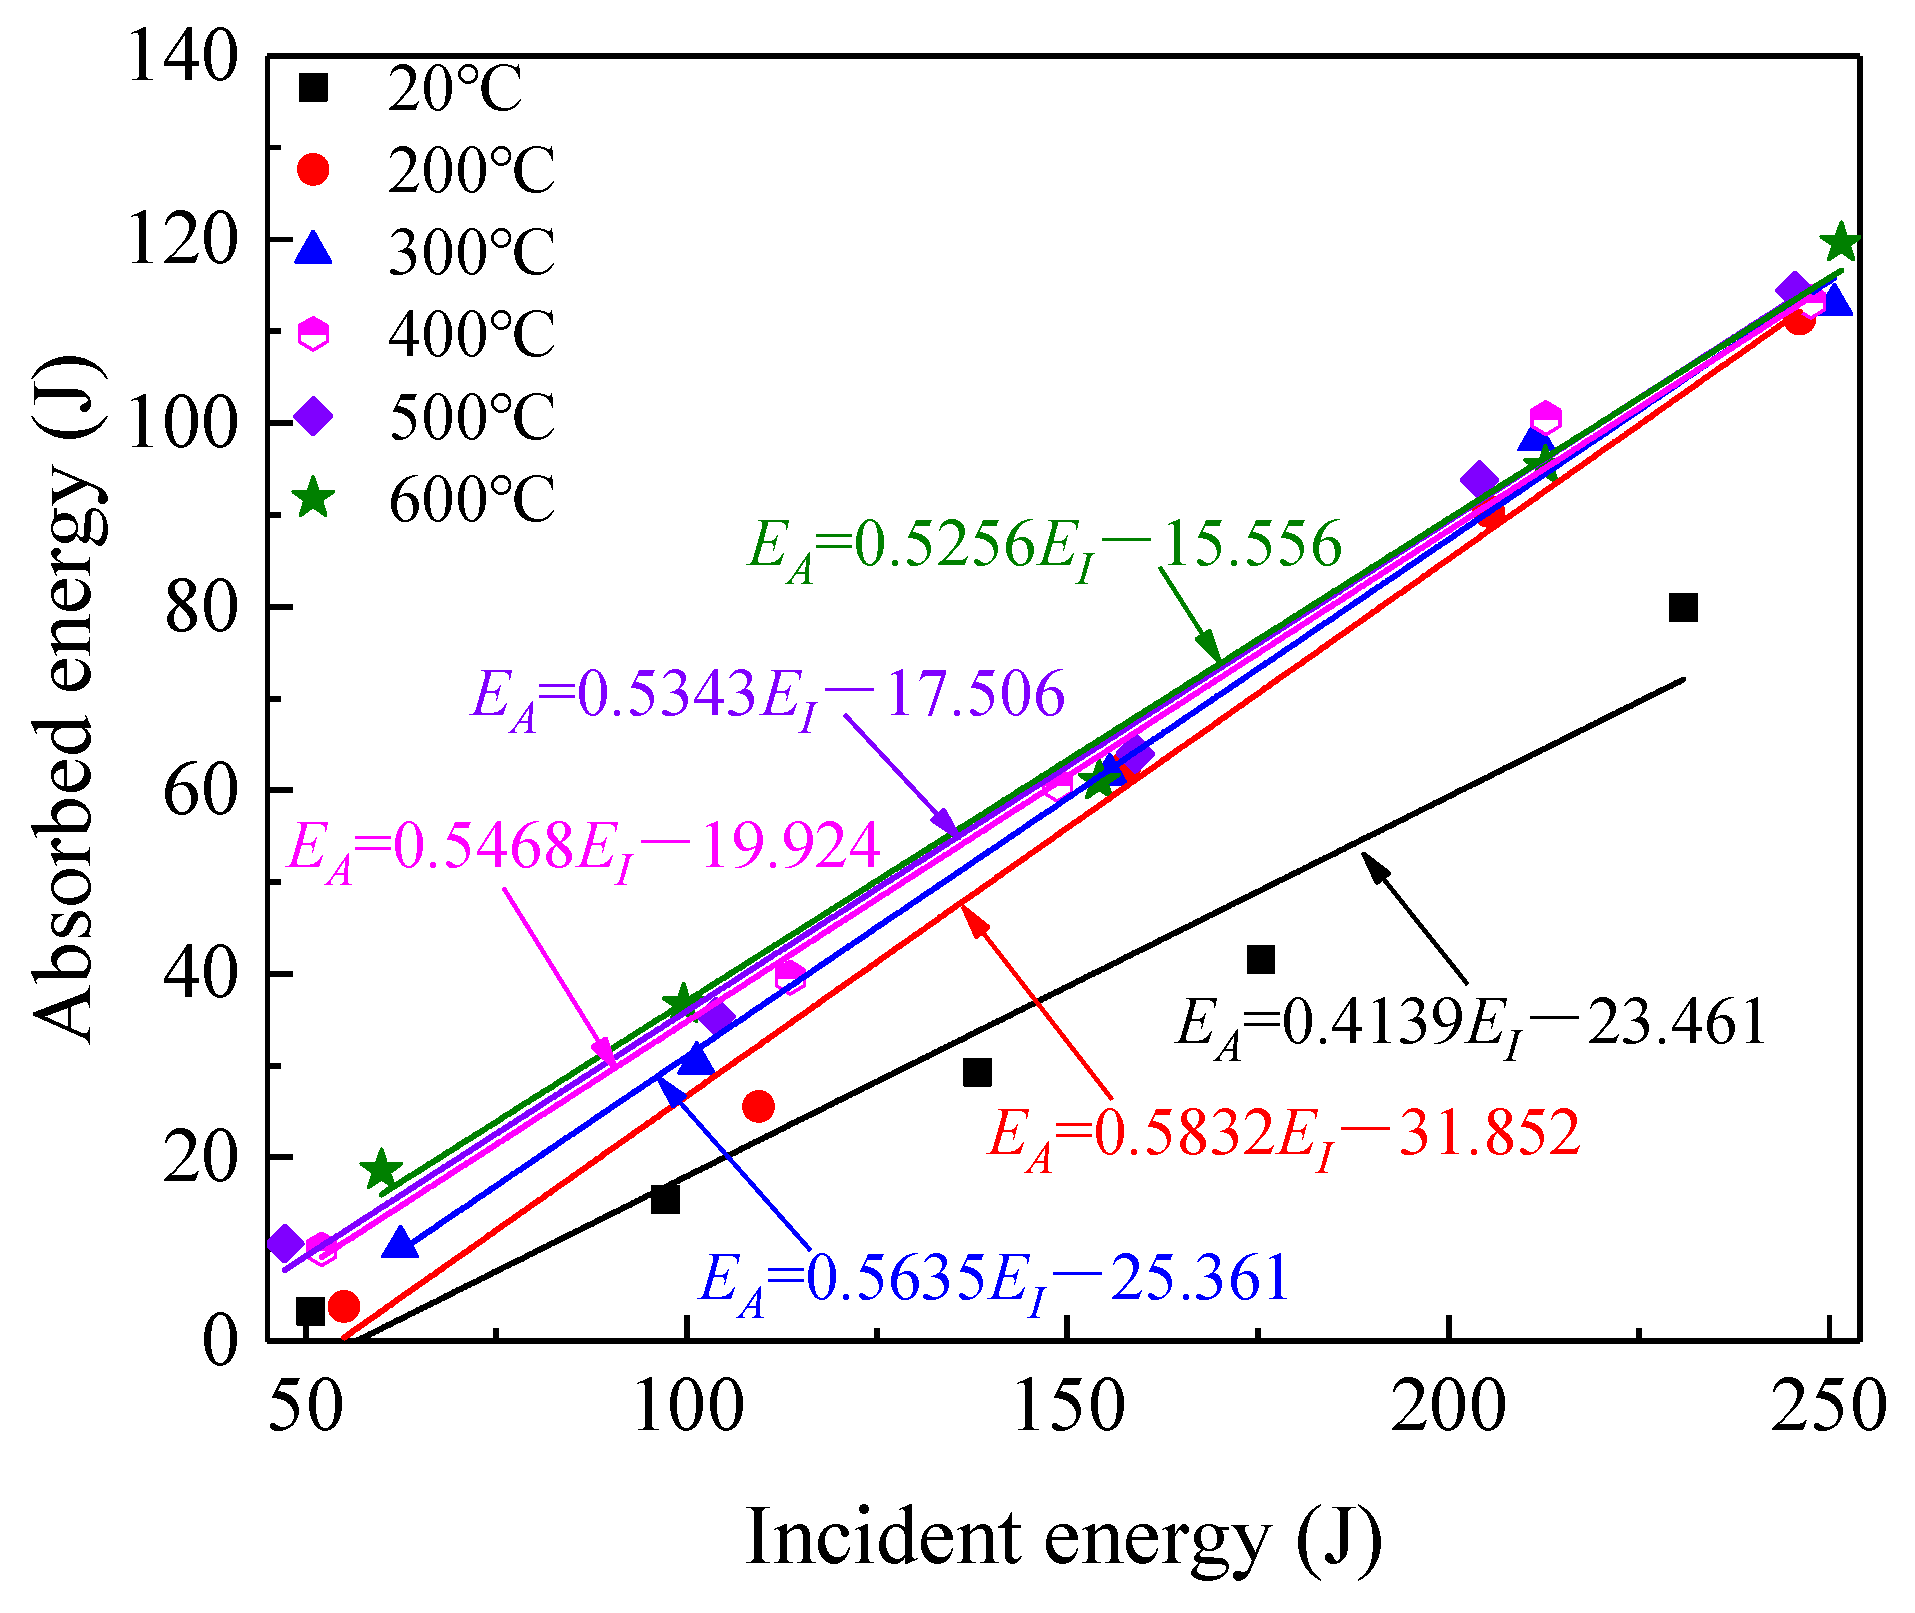
The ER and ET were found to be only related to the ratio of the wave impedances of the elastic bars and the specimen. For the same temperature, as the EI increased, the ER and the EA increased linearly, whereas ET increased logarithmically. For a similar EI, the ER increased but the ET decreased as the temperature increased.

Author Contributions

Conceptualization, Y.W. and L.H.; methodology, Y.W.; software, Y.W.; validation, Y.W., X.L. and L.H.; formal analysis, Y.W. and Y.G.; investigation, Y.W. and H.L.; resources, L.H.; data curation, L.H.; writing—original draft preparation, Y.W.; writing—review and editing, Y.W.; visualization, Y.W. and J.W.; supervision, J.W.; project administration, L.H.; funding acquisition, X.L. All authors have read and agreed to the published version of the manuscript.

Funding

This work was supported by the National Natural Science Foundation of China (51904335, 52174098, 51927808), the Postgraduate Scientific Research Innovation Project of Hunan Province (No. CX20210297), and the Fundamental Research Funds for Central Universities of the Central South University (No. 2021zzts0276).

Institutional Review Board Statement

Not applicable.

Informed Consent Statement

Not applicable.

Data Availability Statement

The data presented in this study are available on request from the corresponding author.

Conflicts of Interest

The authors declare no conflict of interest.

Nomenclature

σd, σsdynamic compressive strength, static compressive strength, MPa;
EI, ER, ET, EAincident, reflected, transmitted, absorbed energy, J;
ρs, ρespecimen density, elastic bar density, g/cm3;
Cs, Celongitudinal wave velocity of the specimen, longitudinal wave
velocity of the elastic bar, m/s;
Es, Edstatic elastic modulus of the specimen, dynamic elastic modulus of
the specimen, GPa;
UCSuniaxial compressive strength, MPa;
DIFdynamic increase factor;
SHPBsplit Hopkinson pressure bar;
SEMscanning electron microscope;
XRDX-ray diffraction;
lg ( ε ˙ ) logarithm of strain rate, s−1;
R, Tthe reflection coefficient, the transmission coefficient;
nthe ratio of wave impedance of two materials;
ε ˙ strain rate, s−1.

References

  1. Delong, Z.; Jun, J.; Yuwen, H.; Wei, W.; Wenjian, Z. Study on well control technology of high temperature geothermal drilling. Procedia Eng. 2014, 73, 337–344. [Google Scholar] [CrossRef] [Green Version]
  2. Xu, H.; Rutqvist, J.; Birkholzer, J. A study of thermal pressurization and potential for hydro-fracturing associated with nuclear waste disposal in argillaceous claystone. Int. J. Rock Mech. Min. Sci. 2020, 136, 104536. [Google Scholar] [CrossRef]
  3. Hua, N.; Elhami Khorasani, N.; Tessari, A.; Ranade, R. Experimental study of fire damage to reinforced concrete tunnel slabs. Fire Saf. J. 2022, 127, 103504. [Google Scholar] [CrossRef]
  4. Xu, X.L.; Karakus, M. A coupled thermo-mechanical damage model for granite. Int. J. Rock Mech. Min. Sci. 2018, 103, 195–204. [Google Scholar] [CrossRef]
  5. Ge, Z.; Sun, Q. Acoustic emission (AE) characteristics of granite after heating and cooling cycles. Eng. Fract. Mech. 2018, 200, 418–429. [Google Scholar] [CrossRef]
  6. Fan, L.F.; Wu, Z.J.; Wan, Z.; Gao, J.W. Experimental investigation of thermal effects on dynamic behavior of granite. Appl. Therm. Eng. 2017, 125, 94–103. [Google Scholar] [CrossRef]
  7. Huang, L.; Guo, Y.; Li, X. Failure characteristics of shale after being subjected to high temperatures under uniaxial compression. Bull. Eng. Geol. Environ. 2021, 81, 33. [Google Scholar] [CrossRef]
  8. Kumari, W.G.P.; Ranjith, P.G.; Perera, M.S.A.; Shao, S.; Chen, B.K.; Lashin, A.; Arifi, N.A.; Rathnaweera, T.D. Mechanical behaviour of australian strathbogie granite under in-situ stress and temperature conditions: An application to geothermal energy extraction. Geothermics 2017, 65, 44–59. [Google Scholar] [CrossRef]
  9. Yin, T.; Wu, B.; Wang, C.; Wu, Y. Determination of dynamic tensile strength of microwave-induced basalt using Brazilian test. Rock Mech. Rock Eng. 2022, 55, 1429–1443. [Google Scholar] [CrossRef]
  10. Kumari, W.G.P.; Ranjith, P.G.; Perera, M.S.A.; Chen, B.K.; Abdulagatov, I.M. Temperature-dependent mechanical behaviour of Australian Strathbogie granite with different cooling treatments. Eng. Geol. 2017, 229, 31–44. [Google Scholar] [CrossRef]
  11. Guo, Y.; Huang, L.; Li, X.; Chen, J.; Sun, J. Experimental investigation on the effects of thermal treatment on the physical and mechanical properties of shale. J. Nat. Gas Sci. Eng. 2020, 82, 103496. [Google Scholar] [CrossRef]
  12. Shao, S.; Wasantha, P.L.P.; Ranjith, P.G.; Chen, B.K. Effect of cooling rate on the mechanical behavior of heated Strathbogie granite with different grain sizes. Int. J. Rock Mech. Min. Sci. 2014, 70, 381–387. [Google Scholar] [CrossRef]
  13. Chen, S.; Yang, C.; Wang, G. Evolution of thermal damage and permeability of Beishan granite. Appl. Therm. Eng. 2017, 110, 1533–1542. [Google Scholar] [CrossRef]
  14. Shu, R.; Yin, T.; Li, X. Effect of heating rate on the dynamic compressive properties of granite. Geofluids 2019, 2019, 8292065. [Google Scholar] [CrossRef]
  15. Guo, L.; Zhang, Y.; Zhang, Y.; Yu, Z.; Zhang, J. Experimental investigation of granite properties under different temperatures and pressures and numerical analysis of damage effect in enhanced geothermal system. Renew. Energy 2018, 126, 107–125. [Google Scholar] [CrossRef]
  16. Li, Q.; Yin, T.; Li, X.; Zhang, S. Effects of rapid cooling treatment on heated sandstone: A comparison between water and liquid nitrogen cooling. Bull. Eng. Geol. Environ. 2020, 79, 313–327. [Google Scholar] [CrossRef]
  17. Zhao, Y.; Feng, Z.; Zhao, Y.; Wan, Z. Experimental investigation on thermal cracking, permeability under HTHP and application for geothermal mining of HDR. Energy 2017, 132, 305–314. [Google Scholar] [CrossRef]
  18. Zhang, W.; Wang, Z.; Du, Y.; Zhang, S.; Shi, Z.; Li, F. Effect of high temperature on pore characteristics, yield stress, and deformation property of sandstone. Bull. Eng. Geol. Environ. 2021, 81, 43. [Google Scholar] [CrossRef]
  19. Zhao, Y.S.; Wan, Z.J.; Feng, Z.J.; Xu, Z.H.; Liang, W.G. Evolution of mechanical properties of granite at high temperature and high pressure. Geomech. Geophys. Geo-Energy Geo-Resour. 2017, 3, 199–210. [Google Scholar] [CrossRef]
  20. Peng, J.; Rong, G.; Cai, M.; Yao, M.-D.; Zhou, C.-B. Physical and mechanical behaviors of a thermal-damaged coarse marble under uniaxial compression. Eng. Geol. 2016, 200, 88–93. [Google Scholar] [CrossRef]
  21. Zhang, Y.; Sun, Q.; Cao, L.; Geng, J. Pore, mechanics and acoustic emission characteristics of limestone under the influence of temperature. Appl. Therm. Eng. 2017, 123, 1237–1244. [Google Scholar] [CrossRef]
  22. Han, H.; Peng, J.; Guo, Y.; He, Q.; Zhou, J.; Gou, X. Experimental research on the mechanical properties of heated granite after rapid cooling. J. Eng. 2021, 2021, 8838520. [Google Scholar] [CrossRef]
  23. Zhang, B.; Tian, H.; Dou, B.; Zheng, J.; Chen, J.; Zhu, Z.; Liu, H. Macroscopic and microscopic experimental research on granite properties after high-temperature and water-cooling cycles. Geothermics 2021, 93, 102079. [Google Scholar] [CrossRef]
  24. Xiao, P.; Zheng, J.; Dou, B.; Tian, H.; Cui, G.; Kashif, M. Mechanical behaviors of granite after thermal shock with different cooling rates. Energies 2021, 14, 3721. [Google Scholar] [CrossRef]
  25. Wu, X.; Huang, Z.; Song, H.; Zhang, S.; Cheng, Z.; Li, R.; Wen, H.; Huang, P.; Dai, X. Variations of physical and mechanical properties of heated granite after rapid cooling with liquid nitrogen. Rock Mech. Rock Eng. 2019, 52, 2123–2139. [Google Scholar] [CrossRef]
  26. Tarasov, B.G.; Stacey, T.R. Features of the energy balance and fragmentation mechanisms at spontaneous failure of class I and class II rocks. Rock Mech. Rock Eng. 2017, 50, 2563–2584. [Google Scholar] [CrossRef]
  27. Wawersik, W.R.; Fairhurst, C. A study of brittle rock fracture in laboratory compression experiments. Int. J. Rock Mech. Min. Sci. Geomech. Abstr. 1970, 7, 561–575. [Google Scholar] [CrossRef]
  28. Ma, L.; Wu, J.; Wang, M.; Dong, L.; Wei, H. Dynamic compressive properties of dry and saturated coral rocks at high strain rates. Eng. Geol. 2020, 272, 105615. [Google Scholar] [CrossRef]
  29. Feng, P.; Xu, Y.; Dai, F. Effects of dynamic strain rate on the energy dissipation and fragment characteristics of cross-fissured rocks. Int. J. Rock Mech. Min. Sci. 2021, 138, 104600. [Google Scholar] [CrossRef]
  30. Yan, Z.; Dai, F.; Liu, Y.; Du, H. Experimental investigations of the dynamic mechanical properties and fracturing behavior of cracked rocks under dynamic loading. Bull. Eng. Geol. Environ. 2020, 79, 5535–5552. [Google Scholar] [CrossRef]
  31. Dai, B.; Shan, Q.; Chen, Y.; Luo, X. Mechanical and energy dissipation characteristics of granite under cyclic impact loading. J. Cent. South Univ. 2022, 29, 116–128. [Google Scholar] [CrossRef]
  32. Huang, L.; Guo, Y.; Li, X. Mechanical response to dynamic compressive load applied to shale after thermal treatment. J. Nat. Gas Sci. Eng. 2022, 102, 104565. [Google Scholar] [CrossRef]
  33. Wang, Z.L.; Shi, H.; Wang, J.G. Mechanical behavior and damage constitutive model of granite under coupling of temperature and dynamic loading. Rock Mech. Rock Eng. 2018, 51, 3045–3059. [Google Scholar] [CrossRef]
  34. Yin, T.; Chen, Y.; Li, X.; Li, Q. Effect of high temperature and strain rate on the elastic modulus of rocks: A review. Int. J. Earth Sci. 2021, 110, 2639–2660. [Google Scholar] [CrossRef]
  35. Li, X.B.; Lok, T.S.; Zhao, J. Dynamic characteristics of granite subjected to intermediate loading rate. Rock Mech. Rock Eng. 2005, 38, 21–39. [Google Scholar] [CrossRef]
  36. Zhou, Y.X.; Xia, K.; Li, X.B.; Li, H.B.; Ma, G.W.; Zhao, J.; Zhou, Z.L.; Dai, F. Suggested methods for determining the dynamic strength parameters and mode-I fracture toughness of rock materials. Int. J. Rock Mech. Min. Sci. 2012, 49, 105–112. [Google Scholar] [CrossRef]
  37. Yin, T.; Shu, R.; Li, X.; Wang, P.; Dong, L. Combined effects of temperature and axial pressure on dynamic mechanical properties of granite. Trans. Nonferrous Met. Soc. China 2016, 26, 2209–2219. [Google Scholar] [CrossRef]
  38. Guo, Y.; Li, X.; Huang, L.; Liu, H.; Wu, Y. Effect of water-based working fluid imbibition on static and dynamic compressive properties of anisotropic shale. J. Nat. Gas Sci. Eng. 2021, 95, 104194. [Google Scholar] [CrossRef]
  39. Huang, L.; Wang, J.; Momeni, A.; Wang, S. Spalling fracture mechanism of granite subjected to dynamic tensile loading. Trans. Nonferrous Met. Soc. China 2021, 31, 2116–2127. [Google Scholar] [CrossRef]
  40. Li, X.B.; Lok, T.S.; Zhao, J.; Zhao, P.J. Oscillation elimination in the Hopkinson bar apparatus and resultant complete dynamic stress–strain curves for rocks. Int. J. Rock Mech. Min. Sci. 2000, 37, 1055–1060. [Google Scholar] [CrossRef]
  41. Liu, X.; Liu, Z.; Li, X.; Gong, F.; Du, K. Experimental study on the effect of strain rate on rock acoustic emission characteristics. Int. J. Rock Mech. Min. Sci. 2020, 133, 104420. [Google Scholar] [CrossRef]
  42. Jin, P.; Hu, Y.; Shao, J.; Zhao, G.; Zhu, X.; Li, C. Influence of different thermal cycling treatments on the physical, mechanical and transport properties of granite. Geothermics 2019, 78, 118–128. [Google Scholar] [CrossRef]
  43. Inserra, C.; Biwa, S.; Chen, Y. Influence of thermal damage on linear and nonlinear acoustic properties of granite. Int. J. Rock Mech. Min. Sci. 2013, 62, 96–104. [Google Scholar] [CrossRef]
  44. Sun, Q.; Zhang, W.; Xue, L.; Zhang, Z.; Su, T. Thermal damage pattern and thresholds of granite. Environ. Earth Sci. 2015, 74, 2341–2349. [Google Scholar] [CrossRef]
  45. Ohno, I. Temperature variation of elastic properties of α-quartz up to the α-β transition. J. Phys. Earth 1995, 43, 157–169. [Google Scholar] [CrossRef] [Green Version]
  46. Li, Q.; Li, X.; Yin, T. Factors affecting pore structure of granite under cyclic heating and cooling: A nuclear magnetic resonance investigation. Geothermics 2021, 96, 102198. [Google Scholar] [CrossRef]
  47. Tedesco, J.W.; Ross, C.A. Strain-rate-dependent constitutive equations for concrete. J. Press. Vessel Technol. 1998, 120, 398–405. [Google Scholar] [CrossRef]
  48. Li, Q.M.; Meng, H. About the dynamic strength enhancement of concrete-like materials in a split Hopkinson pressure bar test. Int. J. Solids Struct. 2003, 40, 343–360. [Google Scholar] [CrossRef]
  49. Yin, T.; Shu, R.; Li, X.; Wang, P.; Liu, X. Comparison of mechanical properties in high temperature and thermal treatment granite. Trans. Nonferrous Met. Soc. China 2016, 26, 1926–1937. [Google Scholar] [CrossRef]
  50. Li, X.B. Rock Dynamics Fundamentals and Applications; Science Press: Beijing, China, 2014. [Google Scholar]
Figure 1. Specimens photograph.
Mathematics 10 01521 g001
Figure 2. XRD spectrum of granite (20 °C).
Mathematics 10 01521 g002
Figure 3. SHPB device. (a) Schematic diagram; (b) Scene photo.
Mathematics 10 01521 g003
Figure 4. Relationship between physical properties and temperature. (a) Change rate of mass, volume and density; (b) Wave velocity of specimen.
Mathematics 10 01521 g004
Figure 5. Stress-strain curves of specimens after thermal shock.
Mathematics 10 01521 g005
Figure 6. Dynamic stress balance checkout of specimen (20 °C, 0.8 MPa).
Mathematics 10 01521 g006
Figure 7. Dynamic stress-strain curves of granite at different temperature and impact gas pressure. (a) 20 °C, (b) 200 °C, (c) 300 °C, (d) 400 °C, (e) 50 °C, (f) 600 °C.
Mathematics 10 01521 g007
Figure 8. Relationship between strain rate and dynamic compressive strength of granite after thermal shocking.
Mathematics 10 01521 g008
Figure 9. Relationship between DIF and lg ( ε ˙ ) at different temperatures.
Mathematics 10 01521 g009
Figure 10. Dynamic stress-strain curves of specimens at different temperature. (a) 0.5 MPa, (b) 0.9 MPa.
Mathematics 10 01521 g010
Figure 11. Dynamic elastic modulus of specimens. (a) Impact gas pressure, (b) Temperature.
Mathematics 10 01521 g011
Figure 12. Relationship between reflected and incident energy.
Mathematics 10 01521 g012
Figure 13. Relationship between transmitted and incident energy.
Mathematics 10 01521 g013
Figure 14. Relationship between absorbed and incident energy.
Mathematics 10 01521 g014
Figure 15. Variation curves of stress, strain rate and strain of specimens at 20°C with time. (a) 0.9 MPa; (b) 0.5 MPa.
Mathematics 10 01521 g015
Figure 16. Relationship between fragment degree of specimens and impact gas pressure at 20 °C. (a) 0.5 MPa; (b) 0.6 MPa; (c) 0.7 MPa; (d) 0.8 MPa; (e) 0.9 MPa.
Mathematics 10 01521 g016
Figure 17. Relationship between fragment degree of specimens and temperature at 0.6 MPa. (a) 20 °C, (b) 200 °C, (c) 300 °C, (d) 400 °C, (e) 500 °C, (f) 600 °C.
Mathematics 10 01521 g017
Figure 18. Relationship between temperature, incident energy and dynamic compressive strength of granite.
Mathematics 10 01521 g018
Figure 19. SEM images of specimens at different temperatures. (a) 20 °C, (b) 200 °C, (c) 300 °C, (d) 400 °C, (e) 500 °C, (f) 600 °C.
Mathematics 10 01521 g019
Table 1. Static physical and mechanical parameters of specimen after thermal shock.
Temperature (°C)Change Rate of Physical Parameters (%)Cs (m/s)UCS (MPa)Peak Strain (%)Es (GPa)
MassVolumeDensity
200004558.4103.5 1.739.30
200−0.1700.092−0.2613124.896.6 1.728.99
300−0.1440.312−0.4542840.985.2 1.758.13
400−0.1740.677−0.8441995.374.8 1.827.17
500−0.2721.726−1.9641202.766.5 2.075.95
600−0.3463.190−3.427950.955.1 2.494.30
Table 2. Dynamic mechanical parameters of specimens at different temperature and gas pressure.
T
(°C)
No.Impact Gas Pressure (MPa)
0.50.60.70.80.9
ε ˙ d E d σ d ε ˙ d E d σ d ε ˙ d E d σ d ε ˙ d E d σ d ε ˙ d E d σ d
20125.032.8110.131.847.4136.545.139.8150.852.543.5162.970.546.7174.5
226.533.4118.430.546.1138.546.241.3155.550.642.8158.172.445.6178.6
323.932.5102.631.647.5136.645.039.0146.653.743.1167.267.246.9170.7
Ave25.132.7110.431.347.0137.245.340.0151.052.343.1162.770.046.4174.6
200127.130.0109.545.336.1138.558.332.7148.171.433.9163.880.728.6169.2
228.533.7111.246.335.5140.160.133.2150.373.834.8167.578.329.1167.3
326.632.1106.344.135.0136.057.633.5146.469.434.5157.681.130.9171.1
Ave27.431.9109.045.235.5138.258.733.1148.371.534.4163.080.029.5169.2
300132.234.5114.346.336.9130.656.734.4146.174.534.9157.487.639.7166.8
233.433.1116.747.936.1132.955.335.1145.676.235.9158.989.437.2169.1
331.734.7113.145.935.9129.254.632.9144.473.834.1156.787.338.4165.1
Ave32.434.1114.746.736.3130.955.534.1145.474.835.0157.788.138.4167.0
400147.125.4108.552.126.1126.770.124.4144.981.329.5154.094.827.4169.1
248.925.9110.851.427.3125.372.125.6147.180.632.1150.497.429.1174.2
346.124.4107.454.626.8129.167.825.3142.083.028.7156.495.527.9171.9
Ave47.424.8108.952.726.7127.070.025.1144.781.630.1153.695.928.1171.7
500152.122.099.660.021.0125.182.022.2138.199.321.7147.9104.321.5153.4
253.722.0103.462.922.3128.683.924.0141.696.923.4146.5103.123.4150.2
350.320.197.358.820.4122.981.021.3135.8102.521.0150.3107.620.8157.5
Ave52.021.7100.160.621.2125.582.322.5138.599.022.0148.2105.021.9153.7
600171.310.370.584.213.498.5110.515.4110.6130.913.9117.1142.113.2133.2
272.912.173.586.413.1100.4114.316.0114.1133.114.2120.4144.514.4135.5
368.19.768.383.211.996.1109.214.1109.3127.113.6115.3140.812.9128.9
Ave70.810.770.884.612.898.3111.315.2111.3130.413.6117.6142.513.5132.5
Note: T (Temperature), NO. (Number), ε ˙ d (s−1), Ed (MPa), σd (GPa) and Ave (average value).
Publisher’s Note: MDPI stays neutral with regard to jurisdictional claims in published maps and institutional affiliations.

