Abstract
Clustered and heterogeneous interval-censored data occur in many fields such as medical studies. For example, in a migraine study with the Netherlands Twin Registry, the information including time to diagnosis of migraine and gender was collected for 3975 monozygotic and dizygotic twins. Since each study subject is observed only at discrete and periodic follow-up time points, the failure times of interest (i.e., the time when the individual first had a migraine) are known only to belong to certain intervals and hence are interval-censored. Furthermore, these twins come from different genetic backgrounds and may be associated with differential risks for developing migraines. For simultaneous subgroup identification and regression analysis of such data, we propose a latent Cox model where the number of subgroups is not assumed a priori but rather data-driven estimated. The nonparametric maximum likelihood method and an EM algorithm with monotone ascent property are also developed for estimating the model parameters. Simulation studies are conducted to assess the finite sample performance of the proposed estimation procedure. We further illustrate the proposed methodologies by an empirical analysis of migraine data.
1. Introduction
Subgroup identification for heterogeneous data has become a ubiquitous problem in a broad range of applications including social science, marketing, and clinical trials. For instance, in clinical trials, heterogeneity may arise due to underlying differences among groups of patients. For patients with similar attributes, disease progression or treatment effects often exhibit close patterns. Therefore, it is valuable to classify the patients into a few homogeneous groups and tailor a disease treatment specifically for each subgroup to optimize the treatment effect. Conceptually, analyzing data from a heterogeneous population consisting of a few homogeneous subgroups is to view data as generated from a mixture of subgroups and leads to a finite mixture model. In unsupervised learning, parametric mixture models have been widely used in many fields. The books [1,2,3,4] and the review paper [5] provide a thorough introduction and applications on finite mixture models. In addition, a mixture model can be applied in reliability analysis ([6,7,8]).
Interval-censored data is a common type of data in real applications. In many clinical applications, the observations are recorded periodically, and the failure times of interest are known between each period, which causes the difficulties on analyzing on this type of data. Refs. [9,10,11] reviewed existing methods that applied the parametric models and nonparametric estimations for survival curves based on interval-censored data. Particularly, Ref. [12] proposed the nonparametric way for survival distribution estimation and [13] provided the score statistics for parameter estimation for interval-censored data. However, as for heterogeneous interval-censored data, mixture models should be considered for subgroup classification. Only limited research studies are targeting this area. Ref. [14] proposed the estimation methods for Gaussian mixtures using MCMC methodology and [15] proposed a semi-parametric mixture model in the field of antimicrobial resistance with interval-censored observations. However, the methods mentioned above are density estimation using a mixture model without conducting regression analysis on other observed covariates. There exist computational difficulties on conducting group identification and regression analysis based on mixture models in survival analysis for interval-censored data.
In this paper, motivated by the Netherlands twin study on migraines, we propose a new latent Cox model for analyzing clustered and heterogeneous interval-censored data. The population is separated into a few subgroups according to the covariate effects. The baseline hazard functions for the subgroups as well as the number of subgroups are left unspecified to avoid restrictive distributional assumptions and allow for flexibility.
Compared with existing mixture survival models ([16,17,18]) in the literature for right-censored data, the proposed model aims to accomplish simultaneous subgroup identification and regression analysis. It is important to note that compared with right-censored data, for interval-censored survival data, the incomplete data information and computational complexity bring greater challenges for the aforementioned tasks. Moreover, we investigate the heterogeneity driven by unknown covariate effects without specifying the baseline hazard functions and the number of subgroups, which make the model estimation more challenging and the computation more intensive. Our new proposed nonparametric maximum likelihood estimation approach separates the parameters during estimation, which greatly reduces the computational complexity. In addition, the proposed EM algorithm has the monotone ascent property for estimating the model parameters. Numerical studies demonstrate its good performance. A modified Bayesian information criterion is also proposed to select the number of mixing components [19].
The rest of the paper is organized as follows. In Section 2, we present the latent Cox model for clustered interval-censored data. In Section 3, we develop an estimation procedure for the proposed model using the EM algorithm. Selecting the number of subgroups and assessing the finite-sample performance of the proposed methods are presented in Section 4. We further provide an application to migraine data to illustrate the practical utilities of the proposed methods in Section 5.
2. Data and Model
Let denote the response of interest (i.e., the failure time) for the jth subject in the ith cluster, where , , is the number of subjects in the ith cluster and n is the number of clusters in the dataset. Furthermore, is interval-censored and only known to belong to the interval . The q-dimensional vector of covariates is denoted by . The observations are summarized as . For accommodating heterogeneous covariate effects that may exist among subgroups, we propose a latent Cox model for simultaneous subgroup identification and regression analysis. Specifically, the instantaneous hazard function for the jth subject in the ith cluster
As in [10,20], we make the following two assumptions. (A1) and are random and (A2) are independent of . It is important to note that the baseline hazard functions and the covariate effects are allowed to vary across the clusters and accordingly accommodate the heterogeneity. In the same spirit of mixture modeling and for extrapolation and interpretation purposes, further assume that n clusters are from M subgroups with and the clusters in the same subgroup have the same baseline hazard and covariate effects. In other words, let be a partition of . Let the mixing probabilities be and . For each cluster , with probability , we have and and . In practice, the number of subgroups M is unknown and will be estimated in a data-driven way. However, in practice, it is usually reasonable to assume that M is much smaller than n. Our goal is to estimate M and the model parameters , and . The observed likelihood function of the i-th cluster can be written as
where denotes the likelihood function of the i-th cluster when it belongs to the m-th subgroup. When the i-th cluster comes from the m-th subgroup, its hazard function for where is the unspecified baseline hazard function and is the corresponding cumulative baseline risk of the m-th subgroup. is the corresponding effect of in the m-th subgroup. Furthermore, we suppose that is monitored at a sequence of positive time points and are independent of as a conventional assumption for interval-censored data. Let be the shortest time interval that brackets , i.e., and , where and . Then, we have
and the log-likelihood based on the observed data is
To estimate , and , we adopt the nonparametric maximum likelihood estimation approach. Let be the ordered sequence of all and with . The estimator for is a step function that jumps only at those time points with respective jump sizes of . It follows that (3) can be rewritten as
3. Estimation and Algorithm
The observed data with unknown subgroup memberships can be formulated as an incomplete-data problem in the EM framework. We view the observed data as being incomplete and introduce the unobserved Bernoulli random variables for ,
and Poisson random variables with means . Define and . Since the probability of observing and is , the likelihood from the observations is the same as (4). Therefore, we develop an EM algorithm to maximize (4) by treating as missing data, where . Then, the complete-data log-likelihood is proportional to
In the M-step, we maximize (6) for any given , then we have
where . After incorporating (8) into (6), we obtain
To update , we employ the following Newton–Raphson algorithm
where
In the E-step, we evaluate the conditional expectations of and involved in the M-step. The posterior mean of is
where
In addition, the conditional expectation of for is
Now, we summarize iteration processes between the E-step and M-step for the proposed algorithm as follows.
Step 1. Give initial values of , , and .
Step 6. Iterate steps 2 to 5 until convergence.
We iterate between the E-step and M-step until the sum of the absolute differences of the estimates at two iterations is less than , i.e., the stopping criterion is set to be
where indicates the norm for , i.e., with .
In the following section, we let , and simulation studies are conducted to assess the finite sample performance of the proposed method and in particular, we propose a modified BIC criterion to select the number of subgroups M.
4. Simulation Study
As in the mixture model [21], the number of subgroups M in the proposed model is unknown and will be estimated in a data-driven manner. Here, we use the modified Bayesian information criterion (BIC [19]) to choose the number of components M by minimizing the criterion function
where , is the sample size, and q is the dimension of .
In the following, we conduct a set of simulation studies to assess the finite sample performance of our proposed method.
Example 1.

We generate clustered interval-censored data from a latent Cox model with two covariates and three subgroups
where the covariates and are independent and both follow the standard normal distribution. The n clusters are randomly assigned into three subgroups with equal probabilities, i.e., we let , so that for , for and for . The cluster size is set to be m for each cluster. We consider different combinations of the number of clusters (n) and the cluster size (m) to assess the performance of the proposed estimation procedure.
We identify the number of subgroups M by minimizing the modified BIC given in (12). Table 1 presents the mean, median, and standard error (s.d.) of the estimated number of subgroups, denoted by , and the empirical percentage ofequal to the true number of subgroups based on 100 replications. It can be seen from Table 1 that forand, the BIC identifies the true number of subgroups among all 100 replications, indicating its favorable performance. Table 2 reports the estimation results for the regression coefficients,, and, and the mixing probabilitiesand, based on 100 replications. The proposed method preforms well and yields the estimators with small biases for the case of. However, as we increase the number of clusters to 800 and decrease the number of subjects within each cluster to 2, the biases of some estimators become larger even though the total sample sizes are the same for the two cases.
Table 1.
The sample mean, median, and standard error (s.d.) of and the empirical percentage (per) of equal to the true number of subgroups based on 100 replications in Example 1.
Table 2.
The empirical bias and sample standard error (s.d.) of the estimators , , , , and based on 100 replications in Example 1.
Example 2.
We simulate data from a latent Cox model with three covariates and two subgroups
where the covariatesare generated from a multivariate normal distribution with mean zero and a first-order autoregressive covariance structurewithfor. The clusters are randomly assigned into two subgroups with equal probabilities, i.e., we let, andfor,for. The cluster size is set to be m for all n clusters. We consider the cases ofand. As in Example 1, we estimate the number of subgroups M by minimizing the modified BIC given in (12). Table 3 reports the mean, median, and standard error (s.d.) of the estimatorand the empirical percentage ofequal to the true number of subgroups based on 100 replications. We observe that the median ofis equal to the true number of subgroups 2, and the mean also gets closer to 2 as the number of clusters increases. Moreover, the empirical percentage of correctly identifying the true number of subgroups is close to 1 as the cluster number becomes moderately large. The estimation results for the regression coefficientsand mixing probabilitiesare summarized in Table 4. It can be seen that in terms of the estimation accuracy, the proposed estimation procedure performs quite well and yields the estimators with small biases for. Similar with Example 1, as we increase the number of clusters to 600 and decrease the number of subjects within each cluster to 2, the biases of some estimators become larger even though the total sample sizes are the same for the two cases.
Table 3.
The sample mean, median, and standard error (s.d.) of and the empirical percentage (per) of equal to the true number of subgroups based on 100 replications in Example 2.
Table 4.
The empirical bias and standard error (s.d.) of the estimators , , and based on 100 replications in Example 2.
Example 3.
We next generate data from the Cox model with two covariates
where the covariatesare generated from a multivariate normal distribution with mean zero and a first-order autoregressive covariance structurewithfor. We set,and consider or . Note that the model corresponds to the latent Cox model with the true number of subgroups M being 1.
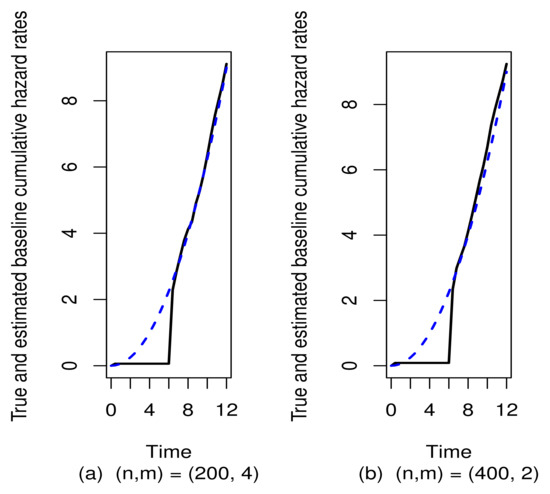
Based on the BIC criterion given in (12), we estimate the number of subgroups M and report the sample mean, median, and standard error (s.d.) of the estimated number of subgroupsand the empirical percentage ofequal to the true number of subgroups M based on 100 replications. We considerand. The results are given in Table 5. We observe that for each replication, the number of subgroups is correctly identified to be 1. The estimation results are summarized in Table 6. We find that the regression coefficients are estimated accurately with small biases for. Similar with Examples 1 and 2, as we increase the number of clusters to 400 and decrease the number of subjects within each cluster to 2, the biases of some estimators become larger even though the total sample sizes are the same for the two cases. To assess the estimation accuracy of the cumulative baseline hazard rate function, by plotting them in Figure 1, we show the difference between the true cumulative hazard rate functionand the estimated baseline cumulative hazard curves. From Figure 1, it can be seen that two curves are quite close to each other during the time periods ofand. However, because there are no sample points falling in the time period of, the two curves exhibit a significant difference during this time period.
Table 5.
The sample mean, median, and standard error (s.d.) of and the empirical percentage (per) of equal to the true number of subgroups M based on 100 replications in Example 3.
Table 6.
The empirical bias and sample standard error (s.d.) of the estimator , and based on 100 replications in Example 3.
Figure 1.
The dotted and solid lines plot the true and estimated baseline cumulative hazard functions, respectively. The estimated baseline cumulative hazard function is the empirical average of the estimated baseline cumulative hazard functions based on 50 replications with or in Example 3.
5. An Application to the Netherlands Twin Study on Migraine
We now apply the proposed model to analyze the Netherlands twin migraine data. The participants were volunteer members of the Netherlands Twin Registry, which is maintained by the Department of Biological Psychology at the Vrije Universiteit in Amsterdam [22]. The data were collected between 1991 and 2002 as part of an ongoing study of health, lifestyle, and genetics involving a large cohort of Dutch twins and their relatives. The primary response of interest in the migraine study is the time when the individual first had a migraine. Since the individuals were followed up on a periodic basis, the time to event may be known only to belong to intervals and hence be interval-censored. The twins form into the clusters with the cluster size 2 and come from different genetic backgrounds, which naturally can be classified into heterogeneous subgroups based on the genetic profiles of the twin families, which are not directly observed. Our analysis is based on 3975 monozygotic and dizygotic twin pairs. The left and right endpoints of the interval in which the individual had migraine (in years) are denoted by and , respectively, for the jth individual in the ith cluster. In this dataset, and are random and are independent of the event time. Furthermore, two covariates included in the model are gender (1 = male, 0 = female) and the type of twins (1 = monozygotic, 0 = dizygotic).
To explore the heterogeneity across the twins as indicated by their initial health status, household lifestyle, disease progression, and genetic profiles, we assume that the twins can be classified into a few homogeneous subgroups for each of which the conditional hazard function is postulated by a Cox model. We fit the migraine data by the proposed model with varying M, and the number of subgroups M is estimated by minimizing the BIC criterion function in (12). We found that by the BIC criterion, the optimal M is 3. In Table 7, for the number of subgroups , we report the maximum log-likelihood values (LL), the BIC values (BIC), and the estimated parameters. We found that the model with three subgroups yields the best fit. The twins can be classified into three homogeneous subgroups with mixing probabilities of , , and , respectively. The estimated regression coefficients for three subgroups are also detailed in Table 7. In addition, the baseline cumulative hazard functions for three subgroups are plotted in Figure 2.
Table 7.
Estimation results for migraine data with : the number of subgroups (M), the maximum log-likelihood values (LL), the BIC values (BIC), and the estimated parameters.
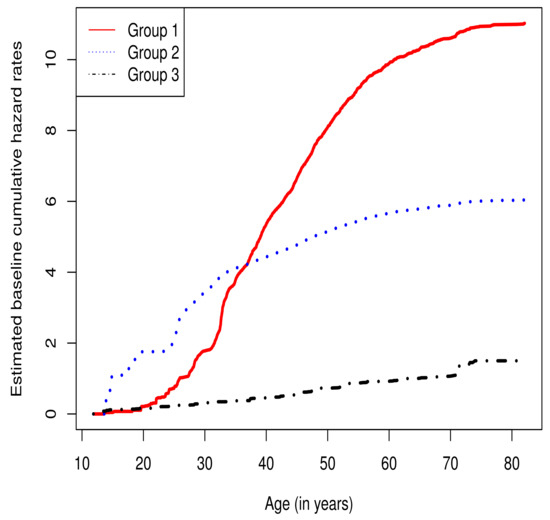
Figure 2.
The estimated baseline cumulative hazard functions for migraine data in the optimal model with three subgroups.
For the optimal model selected by BIC criterion, we calculate the empirical standard error and 95%CI of the parameters by the bootstrap method. We repeatedly generated bootstrap samples for G times and obtained bootstrap estimates with . Then, the normal-based bootstrap interval for is
where , . The bootstrap percentile interval for is ; here, and are the -th and -th order statistics of . The confidence intervals and the empirical standard errors for other parameters can be calculated in a similar way, and the results are reported in Table 8.
Table 8.
The estimated parameters for the optimal model.
Author Contributions
Data curation, X.H. and J.X.; Formal analysis, X.H.; Funding acquisition, J.X.; Investigation, J.X.; Methodology, J.X. All authors have read and agreed to the published version of the manuscript.
Funding
This research received no external funding.
Institutional Review Board Statement
Not applicable.
Informed Consent Statement
Not applicable.
Data Availability Statement
Not applicable.
Acknowledgments
The authors are very grateful to Marianne Jonker, D. I. Boomsma, and Aad van der vaart for sharing the migraine data from the Netherlands Twin Registry.
Conflicts of Interest
The authors declare no conflict of interest.
References
- McLachlan, G.J.; Lee, S.X.; Rathnayake, S.I. Finite mixture models. Annu. Rev. Stat. Its Appl. 2019, 6, 355–378. [Google Scholar] [CrossRef]
- Everitt, B. Finite Mixture Distributions; Springer Science & Business Media: Berlin/Heidelberg, Germany, 2013. [Google Scholar]
- Lindsay, B.G. Mixture Models: Theory, Geometry and Applications; NSF-CBMS Regional Conference Series in Probability and Statistics; JSTOR: New York, NY, USA, 1995; pp. 1–163. [Google Scholar]
- Titterington, D.M.; Afm, S.; Smith, A.F.; Makov, U. Statistical Analysis of Finite Mixture Distributions; John Wiley & Sons Incorporated: Chichester, UK; New York, NY, USA, 1985; Volume 198. [Google Scholar]
- McLachlan, G.; Chang, S. Mixture modelling for cluster analysis. Stat. Methods Med. Res. 2004, 13, 347–361. [Google Scholar] [CrossRef] [PubMed]
- Aslam, M.; Yousaf, R.; Ali, S. Two-Component Mixture of Transmuted Fréchet Distribution: Bayesian Estimation and Application in Reliability. Proc. Natl. Acad. Sci. India Sect. A Phys. Sci. 2021, 91, 309–336. [Google Scholar] [CrossRef]
- Rachid, A.; Naima, B. The Weibull log-logistic mixture distributions: Model, theory and application to lifetime data. Qual. Reliab. Eng. Int. 2021, 37, 1599–1627. [Google Scholar] [CrossRef]
- Sindhu, T.N.; Hussain, Z.; Aslam, M. Parameter and reliability estimation of inverted Maxwell mixture model. J. Stat. Manag. Syst. 2019, 22, 459–493. [Google Scholar] [CrossRef]
- Lindsey, J.C.; Ryan, L.M. Methods for interval-censored data. Stat. Med. 1998, 17, 219–238. [Google Scholar] [CrossRef]
- Zhang, Z.; Sun, J. Interval censoring. Stat. Methods Med. Res. 2010, 19, 53–70. [Google Scholar] [CrossRef]
- Sun, J. The Statistical Analysis of Interval-Censored Failure Time Data; Springer: Berlin/Heidelberg, Germany, 2006; Volume 3. [Google Scholar]
- Turnbull, B.W. Nonparametric estimation of a survivorship function with doubly censored data. J. Am. Stat. Assoc. 1974, 69, 169–173. [Google Scholar] [CrossRef]
- Rabinowitz, D.; Tsiatis, A.; Aragon, J. Regression with interval-censored data. Biometrika 1995, 82, 501–513. [Google Scholar] [CrossRef]
- Komárek, A. A new R package for Bayesian estimation of multivariate normal mixtures allowing for selection of the number of components and interval-censored data. Comput. Stat. Data Anal. 2009, 53, 3932–3947. [Google Scholar] [CrossRef]
- Jaspers, S.; Aerts, M.; Verbeke, G.; Beloeil, P.A. A new semi-parametric mixture model for interval censored data, with applications in the field of antimicrobial resistance. Comput. Stat. Data Anal. 2014, 71, 30–42. [Google Scholar] [CrossRef]
- Peng, Y.; Dear, K.B. A nonparametric mixture model for cure rate estimation. Biometrics 2000, 56, 237–243. [Google Scholar] [CrossRef] [PubMed]
- Altstein, L.; Li, G. Latent subgroup analysis of a randomized clinical trial through a semiparametric accelerated failure time mixture model. Biometrics 2013, 69, 52–61. [Google Scholar] [CrossRef] [PubMed] [Green Version]
- Wu, R.F.; Zheng, M.; Yu, W. Subgroup analysis with time-to-event data under a logistic-Cox mixture model. Scand. J. Stat. 2016, 43, 863–878. [Google Scholar] [CrossRef]
- McLachlan, G.J.; Peel, D. Finite Mixture Model; Wiley: New York, NY, USA, 2000. [Google Scholar]
- Ma, L.; Hu, T.; Sun, J. Cox regression analysis of dependent interval-censored failure time data. Comput. Stat. Data Anal. 2016, 103, 79–90. [Google Scholar] [CrossRef] [Green Version]
- McLachlan, G.J.; Krishnan, T. The EM Algorithm and Extensions; Wiley: New York, NY, USA, 1997. [Google Scholar]
- Boomsma, D.I.; De Geus, E.J.; Vink, J.M.; Stubbe, J.H.; Distel, M.A.; Hottenga, J.J.; Posthuma, D.; Van Beijsterveldt, T.C.; Hudziak, J.J.; Bartels, M.; et al. Netherlands Twin Register: From twins to twin families. Twin Res. Hum. Genet. 2006, 9, 849–857. [Google Scholar] [CrossRef] [PubMed]
Publisher’s Note: MDPI stays neutral with regard to jurisdictional claims in published maps and institutional affiliations. |
© 2022 by the authors. Licensee MDPI, Basel, Switzerland. This article is an open access article distributed under the terms and conditions of the Creative Commons Attribution (CC BY) license (https://creativecommons.org/licenses/by/4.0/).