Abstract
Despite many millions of dollars being spent each year to support undergraduate research experiences for students in the sciences, there has been little in the way of solid evaluation of these experiences. Recently, research has surfaced that addresses this issue and provides tools that are useful for researchers and evaluators to assess the gains students make from participation. This paper offers a new tool that can be used to measure student gains as a result of participation in these experiences. We discuss the development of the tool and use confirmatory factor analysis to evaluate the quality of the tool for measuring change over time in student confidence.
1. Introduction
Recent international reports advocate for the engagement of undergraduate students in authentic research in preparation for the science, technology, engineering, and mathematics (STEM) workforce and to face the global challenges of the 21st century as scientifically-literate citizens [1,2,3,4,5]. Reflecting this emphasis, as well as the substantial resources (e.g., funding, faculty, and student time) made available to support undergraduate research (UR), students are gaining greater access to these high-impact learning practices through apprenticeship-like undergraduate research experiences (UREs) and course-based undergraduate research experiences (CUREs). A recent US survey of student engagement found that approximately one-in-two senior life science majors participated in some form of faculty-sponsored research during their educational careers [6], and it is likely that the number of students engaged in research experiences will continue to grow with the increasing popularity of UR as part of both majors’ and non-majors’ post-secondary science curricula [7].
Undergraduate research “provides a window on science making, allowing students to participate in scientific practices such as research planning, modeling of scientific observations, or analysis of data” [8]. In comparison to “cookbook” lab activities that may not engage students into authentic scientific inquiry, UR experiences are characterized by involving students in the process of doing science through iterative, collaborative, and discovery-based research efforts that rely on disciplinary research practices [7,9,10]. As a form of situated learning [9,11], UR embeds learning in authentic situations to help hone students’ cognitive skills through use and support of their abilities to increasingly interact as members of the research community [12].
Scholarly attention to the efficacy and impact of UR increased over the past two decades for both accountability purposes in reporting to funding agencies [13] and to document and refine key design features in support of educational outcomes [7,14]. Recently, an emerging base of educational research reported on numerous short- and long-term personal and professional benefits for students engaging in UR [15]. Commonly-identified positive outcomes include increased research-related skills [13,16,17,18] familiarity with the research process [17], positive affect toward science (e.g., self-confidence; valuing science) [9,19], degree completion [20], intentions to pursue graduate school and careers in STEM [21], and understanding the culture and norms of science [9,22]. Evidence also suggests that UR supports the retention and advancement of underrepresented groups in STEM and professional careers [23,24,25].
Most commonly, evidence of student outcomes is collected using self-report survey data after completion of the UR experience ([8,26]). UR survey studies often rely on poorly-developed measures limiting the valid assessment of cognitive gains, a point raised by other researchers [8,27,28]. In particular, UR studies regularly use Likert-scale ratings that offer unequal or coarse-grained categories (e.g., [13,29]) requiring respondent interpretation, increasing the potential for bias [30,31]. For example, it may be difficult to ensure that UR students perceive the differences between “little gain” to “moderate gain” equal to the distance between “moderate gain” and “good gain” when evaluating their respective proficiencies. Most current UR studies also rely on single post-experience administration (e.g., [16,28,32]) since the surveys are designed to measure only the gains after UR experiences. Therefore, currently-available assessments for students’ perceived research skills do not allow to compare baseline and post-interventional data for estimating changes in student outcomes [33]. Additionally, the ubiquity and ease of use of Likert-type items, it can be suggested that insufficient attention has been paid to rigorously evaluating survey psychometrics [34].
While most research suggests that students benefit from engaging in UR activities, recent calls have been made for improvements in documenting participant progress to strengthen the research base [8]. Despite the recognized challenges of self-reports [28] and questionable value of this data in studying UR [8], surveys are of particular practical use in evaluating research experiences as they: (a) require lower investments of time, resources, and assessment experience in collecting and analyzing than other data forms (e.g., interviews, observations) [35]; (b) can be used to collect information from large samples of UR participants [28]; (c) lend insight to student competencies (e.g., the ability to use lab techniques) that may not be easily assessed using direct measures (e.g., evaluation of oral presentations, performance tests) alone [36]; and (d) have been justified as a general measure of achievement [34]. Given this, need exists for generalizable, well-designed, and validated surveys that document UR student progress and program efficacy.
This article describes the development and testing of the Undergraduate Scientists—Measuring Outcomes of Research Experiences student survey (USMORE-SS). As part of a large national project focused on understanding how students benefit from UREs, the USMORE-SS was designed as an instrument that includes a common set of items (e.g., self-reported research-related proficiencies, views of UREs) to track student progress over their research experience(s) and permit generalizable comparisons across institutions, as well as site-specific questions to inform departments and administrators about given program features of interest (e.g., professional development activities). Although a discussion of the broader range of survey results is outside the scope of this article, evidence is provided here to the validity of the USMORE-SS instrument in documenting undergraduate researchers’ self-reported skills. As our colleagues in the sciences are regularly asked to provide evidence to programmatic effectiveness for quality assurance and refinement purposes, the aim of this article is to report on a validated self-report survey tool that can be used to confidently measure student outcomes.
1.1. Instrument Development and Administration
Development of the USMORE-SS was through an iterative process where we developed new items or modified ones from earlier assessments of UR [13,16,37,38]. A multi-step, iterative design approach to survey development was undertaken [39], including data collection on URE student and research mentor experiences to establish content validity. Multiple revisions occurred throughout the design process based on field-testing and faculty feedback.
In order to collect greater detail about the cognitive and affective gains students believe they make during UR, survey items were constructed based on research from two national mixed-methods studies. The first investigated UR as part of the transition from student to practicing scientist in the fields of chemistry and physics (Project Crossover NSF DUE 0440002). Respondent survey (n = 3014) and interview (n = 86) data were used to outline long-term outcomes conferred to UR participants from the perspective of individuals who went on to research-related careers [32]. Those data, drawn from a subset of items, provided some background to the residual benefits of early research training. The USMORE study focused specifically on UREs and how they lead to learning and development of career interest. Since 2012, data gathering has been continuous over the 5-year study with a sample of more than 30 colleges and universities that support UREs in the natural sciences through formal or informal research programs. In an effort to provide an encompassing view of UREs, data for all aspects of the project were collected from more than 750 student researchers; and more than 100 faculty, postdoctoral researchers, or graduate student mentors and program administrators, using multiple forms of quantitative and qualitative data to allow triangulation of data sources [40]. Data collection included: pre/post- experience surveys and semi-structured interviews, weekly electronic journals, in-situ observations using student-borne point-of-view (POV) video and performance data to assess student learning progressions [36].
During our initial investigations, we asked student researchers about the gains they expected or received based on involvement in their UREs. In addition, we asked lab mentors (faculty, post-docs, graduate students) about their expectations and evaluations of gains their student researchers made during the experience. Right away, themes emerged that helped us to make sense of our initial data on participant outcomes. Similar to faculty accounts reported at four liberal arts institutions, it was indicated that student research participants were expected to gain knowledge, skills, or confidence related to: (a) understanding of the scientific process and research literature; (b) how to operate technical equipment and do computer programming; (c) how to collect and analyze data, and (d) how to interact and build networks in the professional community. Through the first year of the study, we collected information on these gains through responses to open-ended interview and survey questions for each of the categories we identified. We were not sure if each of the categories we developed items for would hold up under factor analysis, but we knew we were capturing the most common activities occurring in these experiences. By summer 2013, we finalized these items and have used the same set in data collection since that time. Items fell into each of seven broad categories, nested in the four themes above, including: reading of primary literature, data collection, data analysis, data interpretation, scientific communication skills, understanding of research/field, and confidence. Item stems for each of these categories are listed in the Appendix A.
As mentioned, a limitation of existing UR evaluation methods is the use of coarsely defined rating scales that require respondent interpretation, which can inadvertently increase bias [34]. To address this early in the study, students and research mentors were asked in the pre-surveys and interviews about the greatest anticipated gain and what types of evidence would demonstrate whether the gain(s) were made. Often participants indicated that the degree of independence in task completion as a key indicator of skill proficiency. To align with this, we created a scale with response options based on level of independence, which included: No Experience (lowest), Not Comfortable, Can complete with substantial assistance, Can complete independently, and Can instruct others how to complete (highest). For the knowledge (or understanding) and confidence items that would not be appropriately represented using this scale, options included: No [understanding or confidence], Little, Some, Moderate, and Extensive. In an effort to increase scale reliability with these options, the knowledge and confidence items were written as actions (e.g., rating their confidence to “Work independently to complete ‘basic’ research techniques such as data entry, weighing samples, etc.”). Prior to use in the formal study, mentor feedback (n = 7) was solicited to evaluate scale appropriateness and clarity, with slight modifications made based on feedback.
The USMORE-SS was developed to include partnered pre- and post-URE versions to provide information on students’ expected and actual experiences, as well as changes in research-related skills and knowledge and academic or career intentions. While there are limitations to students’ realistic assessment of their abilities upon entering a research project due to a lack of professional experience [28], baseline and post-intervention data offer greater fidelity in measuring the effects of UREs by: (a) taking students’ background or beginning skills into account to estimate net gains [34], and (b) providing multiple estimates of (then) current aptitudes rather a single reflection of gains over time [41]. Similar to other self-report data [13,17,28], the USMORE-SS provides a broad indicator to the cognitive, affective, and conative impact of UREs on participants, rather than a substitute for direct performance data (e.g., tests, skill demonstration). More broadly, we believe this tool should be used with complementary direct and indirect (e.g., interviews, observations) measures to evaluate the nature of these experiences and how they lead to learning [42]. The results reported here are based on data from students who completed the partnered pre- and post-experience surveys with the finalized survey items. The finalized USMORE-SS includes 38 questions which were intended to quantify student gains in the seven areas of research skills gained through UREs. To make this tool useful to a broad audience of those running UREs, the structural validity needs to be tested.
1.2. Study Aim
While the goal of the larger study is to increase our understanding of how undergraduate research experiences influence students’ skills and academic/career choices, the main goal of this paper is to share the survey instrument (USMORE-SS) with others interested in evaluating their research programs and provide strong support for its use. In this paper we investigate various psychometric properties of the USMORE-SS including reliability, structural validity, and longitudinal measurement invariance.
2. Materials and Methods
In this section we present information on the sample of UR participants we collected data from and our factor analysis of the scales included in the USMORE-SS instrument. The intent here is to present the structure of the scales so others can use these scales to evaluate their UR programs. All subjects gave their informed consent for inclusion before they participated in the study. The study was conducted in accordance with the Declaration of Helsinki, and the protocol was approved by the Ethics Committee of Indiana University (Protocol 11120007580).
2.1. Sample
Data gathering with the surveys was continuous between summer 2013 and summer 2016 with a total of 507 undergraduate researchers from 43 different institutions completing the USMORE-SS. For the purpose of generalizability, Institutions were selected to provide diversity in educational mission (n = 6 liberal arts institutions, n = 7 Master’s granting institutions, n = 25 Doctoral/research institutions, n = 4 research organizations), geographic location, academic field, timing (i.e., summer and academic-year) and program type (e.g., externally- and internally-funded student research programs). In terms of sample demographics, roughly half (48%) were female and 59% self-identified as Caucasian, 9% Asian, 8% Black/African-American, 6% Latino/a, 1% American Indian, and 18% as multiple ethnicities. Nearly 85% of respondents were in their third or fourth year as undergraduates at the time of the survey, and 44% had previously participated in at least one URE. Participants’ majors were physics (25%), biology (23%), chemistry (19%), multiple STEM majors (19%), other STEM majors (e.g., engineering, Earth science; 16%), and non-STEM majors (2%).
2.2. Data Collection
Student participants were recruited through faculty or administrators working with formal programs (e.g., NSF REUs, university-sponsored initiatives) or informal URE opportunities (e.g., student volunteers) across the US. Faculty and administrators interested in having their students participate in the pre/post-survey study could decide to (a) provide their students’ contact information for us to directly solicit participation and distribute the surveys, or (b) distribute the surveys themselves via email link. The survey was hosted via Qualtrics, an online survey platform. Students who completed the survey received a $5 gift card, per administration, for their participation.
2.3. Analytic Procedure
We evaluated the USMORE-SS through two phases. First, we examined descriptive statistics of the pre- and post-survey items to explore possible outliers and to examine the proportion of missing data. We conducted Kolmogorov-Smirnov tests to examine the normality of the items using IBM SPSS 23. This phase is meant to determine which type of estimation method is most appropriate for our data to test structural validity and measurement invariance. For example, the maximum likelihood robust estimation method is more appropriate for the data violating normality assumption than the maximum likelihood estimation method to avoid the problem of underestimating standard errors [43,44,45,46]. We also investigated internal consistency reliability of the whole test and each of the hypothesized sub-constructs in the survey by referring to Cronbach’s α.
The second phase of analysis consisted of three steps:
- testing adequacy of the hypothesized seven-factor model for pre- and post-surveys;
- testing longitudinal measurement invariance between pre- and post-surveys; and
- comparing latent means between pre- and post-surveys only if the finally established measurement invariance model is adequate for doing so.
The first step is important as it provides evidence for the adequacy of using the subscale scores which represent different aspects of research-related skills. The second step is necessary to compare latent means of each subscale. If the second step results are adequate to move on to the third step, we can validly test the change (ideally, gain) in students’ research skills after a URE. All steps in the second phase were conducted using MPlus 7.0. The survey items in the USMORE-SS was treated as continuous because they are ordered categorical variables with five response options [47].
2.3.1. Confirmatory Factor Analysis and Longitudinal Measurement Invariance
Similar to Weston and Laursen’s [28] analysis of the URSSA instrument, for Phase 2, we selected the confirmatory factor analysis (CFA) framework. Compared to exploratory factor analysis (EFA) used by many researchers when developing scales [48,49], CFA provides a stronger framework grounded on theories rather than relying on data itself [50,51]. In this study, we identify a plausible factor structure of the USMORE-SS beforehand based on the interviews and survey contents and, thus, EFA was not considered. In the current version of the instrument, seven constructs were formalized, including: reading and understanding of primary literature, collecting research data, analysis and interpretation of research data, programming skills, scientific communication, understanding of the field and research process, and confidence in research-related activities. In our original conceptualization, we thought that programming skills would reside as a part of analysis and interpretation of research data, but in our early analysis we realized that these are measuring potentially related, but separate constructs. CFA also provides a more trustworthy solution for evaluating instruments including multiple constructs and we can directly test the adequacy of the hypothesized factor structure using the range of fit indices provided in CFA [50]. CFA also facilitates testing method effects that cannot be tested under the EFA framework, for example, by imposing correlation between error variances [52]. In addition, CFA is more flexible than EFA in testing every aspect of measurement invariance [53].
In practice, CFA delineates the linear relationship between hypothesized construct(s) and multiple observed indicator variables. Suppose that the number of observed indicators is m and the number of hypothesized constructs is k (always < m). A CFA model for the above case can be mathematically expressed as:
Here, O denotes a p × 1 vector-valued observed variable of the multiple indicators, while ξ denotes a k × 1 vector of the hypothesized constructs. τ, , and δ represent a p × 1 vector of intercept, a p × k matrix of factor loadings, and a p × 1 vector of unique factor scores, respectively. Equation (1) is analogous to a linear regression model (Y = a + bX + e; Y: outcome variable, X: predictor, a: regression intercept, b: regression weight, and e: random error). An intercept represents the score of each item when the score of the hypothesized (latent) score is zero while a factor loading indicates the strength of the relationship between the latent construct and each of the observed items. Each factor score includes both the random error and the uniqueness of each item.
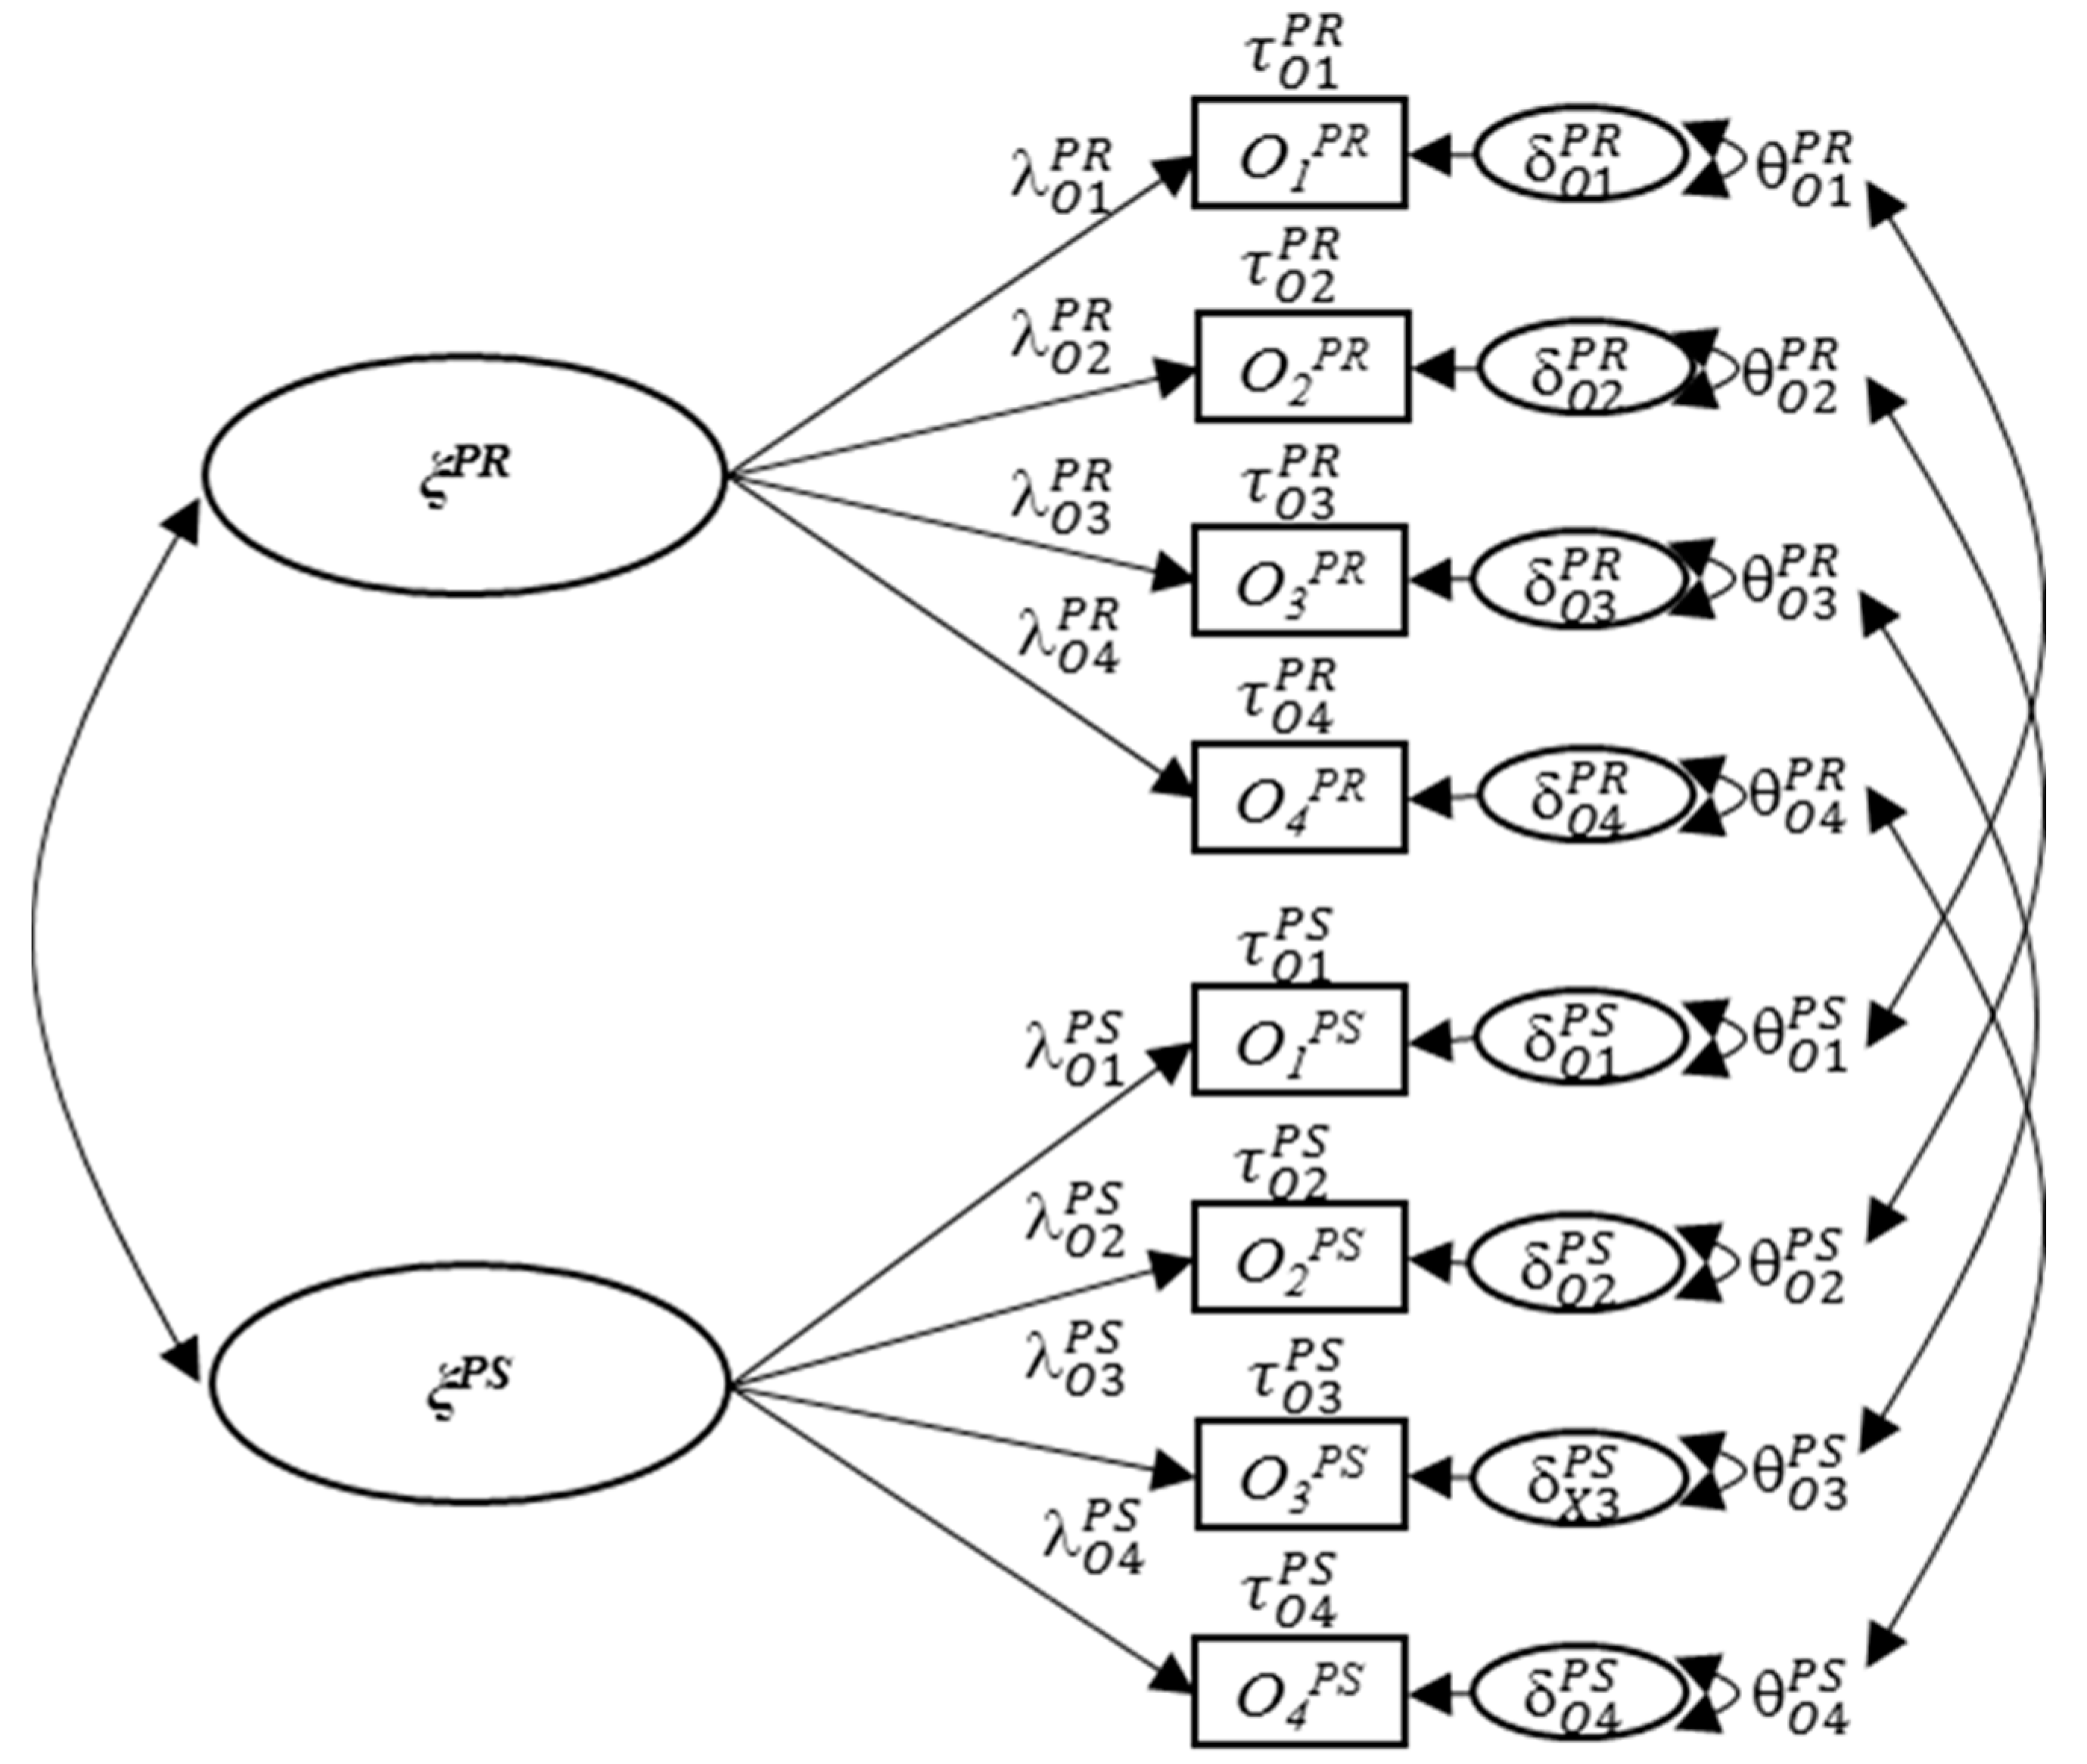
The three parameters (τ, , and δ) are the main interest of factorial invariance, which is a special case of measurement invariance under a factor analysis framework. To study longitudinal change across our two waves of data collection, factorial invariance can be tested by putting the pre- and post-survey in one model [54,55,56]. Figure 1 illustrates a longitudinal factorial invariance model of one factor with four indicators for pre- and post-survey conditions. Factorial invariance is established when τ, , and (a diagonal matrix of unique variances which is the variance of δ) are equivalent across different times. The change in the observed scores (O) is considered to originate from the change in latent constructs (ξ) without any differential functioning of the measurement. Typically, factorial invariance is investigated with comparing four hierarchically nested models: (1) configural (equal structure); (2) metric (equal factor loadings); (3) scalar (equal intercepts), and (4) strict invariance (equal unique variances) models [53,57,58]. We followed this sequence of modeling to test the longitudinal measurement invariance between the pre- and post-surveys.
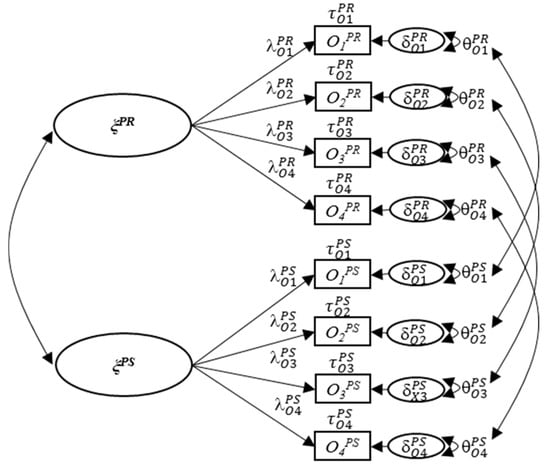
Figure 1.
Longitudinal measurement invariance model under a confirmatory factor analysis framework. Following the typical method of expressing a structural equation model, the variables in a circle indicates latent variables while the variables in a rectangle are observed variables.; PR: pretest; PS: posttest; ξ: latent variable (factor); Oi: ith observed variable; λOi: factor loading of the ith observed variable; τOi: intercept of the ith observed variable; δOi: unique factor score of the ith observed variable; θ: unique variance of the ith observed variable; When sequentially testing metric, scalar, and strict invariance, the equality of the corresponding factor loadings, intercepts, and unique variables can be expressed by dropping the time indicators, PR and PS, from the tested parameters.
2.3.2. Evaluating Structural Validity and Measurement Invariance
In order to evaluate the adequacy of the tested CFA model, we referred to the commonly used model fit indices: (1) chi-square statistics (χ2) at the level; (2) the comparative fit index (CFI); (3) the root mean square of approximation (RMSEA); and (d) the standardized root mean squared residual (SRMR). A non-significant χ2 (p > 0.05) indicates a good model fit [59], however, χ2 overly rejects an adequate model when the sample size is large [50,60,61]. Meanwhile, other fit indices indicate how adequate the tested model is, independent of the sample size. The criteria for acceptable model fit are the RMSEA ≤ 0.08, the SRMR ≤ 0.08, and the CFI ≥ 0.90 [50,62].
Using the established CFA model for both the pre- and post-surveys, we sequentially tested configural, metric, scalar, and strict invariance models. Each pair of two nested models (e.g., configural vs. metric invariance models) is typically compared by the difference in the χ2 fit statistics as well as the differences in the CFI, RMSEA, and SRMR (ΔCFI, ΔRMSEA, and ΔSRMR). In this study, we report Sattora-Bentler χ2 difference test because we used the maximum likelihood-robust (MLR) estimation method [63]. Given the same problem of the test based on χ2 (i.e., falsely rejecting an adequate model with large samples), we consulted the criteria ΔCFI, ΔRMSEA, and ΔSRMR suggested by Chen [60]. Although χ2 rejects the tested invariance model, we can go further for the higher-level invariance model based on ΔCFI, ΔRMSEA, and ΔSRMR. When sample size is greater than 300, as in this study, the model with more invariant constraints is rejected with ΔCFI ≤ −0.010 and ΔRMSEA ≥ 0.015 regardless of the tested parameters. Yet, the criteria of the SRMR is different between metric invariance (ΔSRMR ≥ 0.030) and scalar/strict invariances (ΔSRMR ≥ 0.010). To summarize, we used the criteria for ΔCFI, ΔRMSEA, and ΔSRMR suggested by Chen [60] to determine the adequacy of each of the tested invariance models instead of relying on chi-square difference tests, which is known to be too sensitive to negligible misfit.
3. Results
3.1. Descriptive Statistics and Normality Test
A total of 507 students completed the pre-survey since summer 2013. Of these students, 338 completed the post-survey (retention rate of 67%). No outstanding outliers exist in the data and the percentage of the missing data were less than 1.4% for the pre- and post-surveys. Table 1 provides descriptive statistics for each item in the pre- and post-surveys. Among all items, the average scores of the third item (PRO3) of the hypothesized construct, Programming Skills were the lowest for both pre-survey (Mean = 2.51; SD = 1.15) and post-survey (Mean = 2.81; SD = 1.21). On average, participants obtained the highest scores on the first item (CON1) of Confidence of your Research Related Abilities for both pre-survey (Mean = 4.31; SD = 0.81) and post-survey (Mean = 4.64; SD = 0.59). The skewness values across all items of the pre- and post-surveys ranged from −1.24 to 0.17 and from −1.74 to −0.05, respectively. Kurtosis values and the results of Kolmogorov-Smirnov test indicated that few of the pre- and post-survey items met the assumption of normality, which suggests use of an estimation method robust to non-normality (i.e., MLR; Yuan & Bentler, 2000 [45]).

Table 1.
Descriptive statistics of the pre- and post-survey items.
3.2. Internal Consistency Reliability (Cronbach’s α)
As a measure of internal consistency reliability, we calculated Cronbach’s α for the whole survey and each of the seven subscales (See Table 2). The set of 38 items had very high Cronbach’s α coefficients for both pre-survey (0.95) and post-survey (0.94). Each of the sub-constructs also exhibited sufficiently high Cronbach’s α coefficients for pre-survey and post-survey to be adequate based on the criteria of good internal consistency [64].
Table 2.
Cronbach’s α coefficients by sub-construct.
3.3. Construct Validity
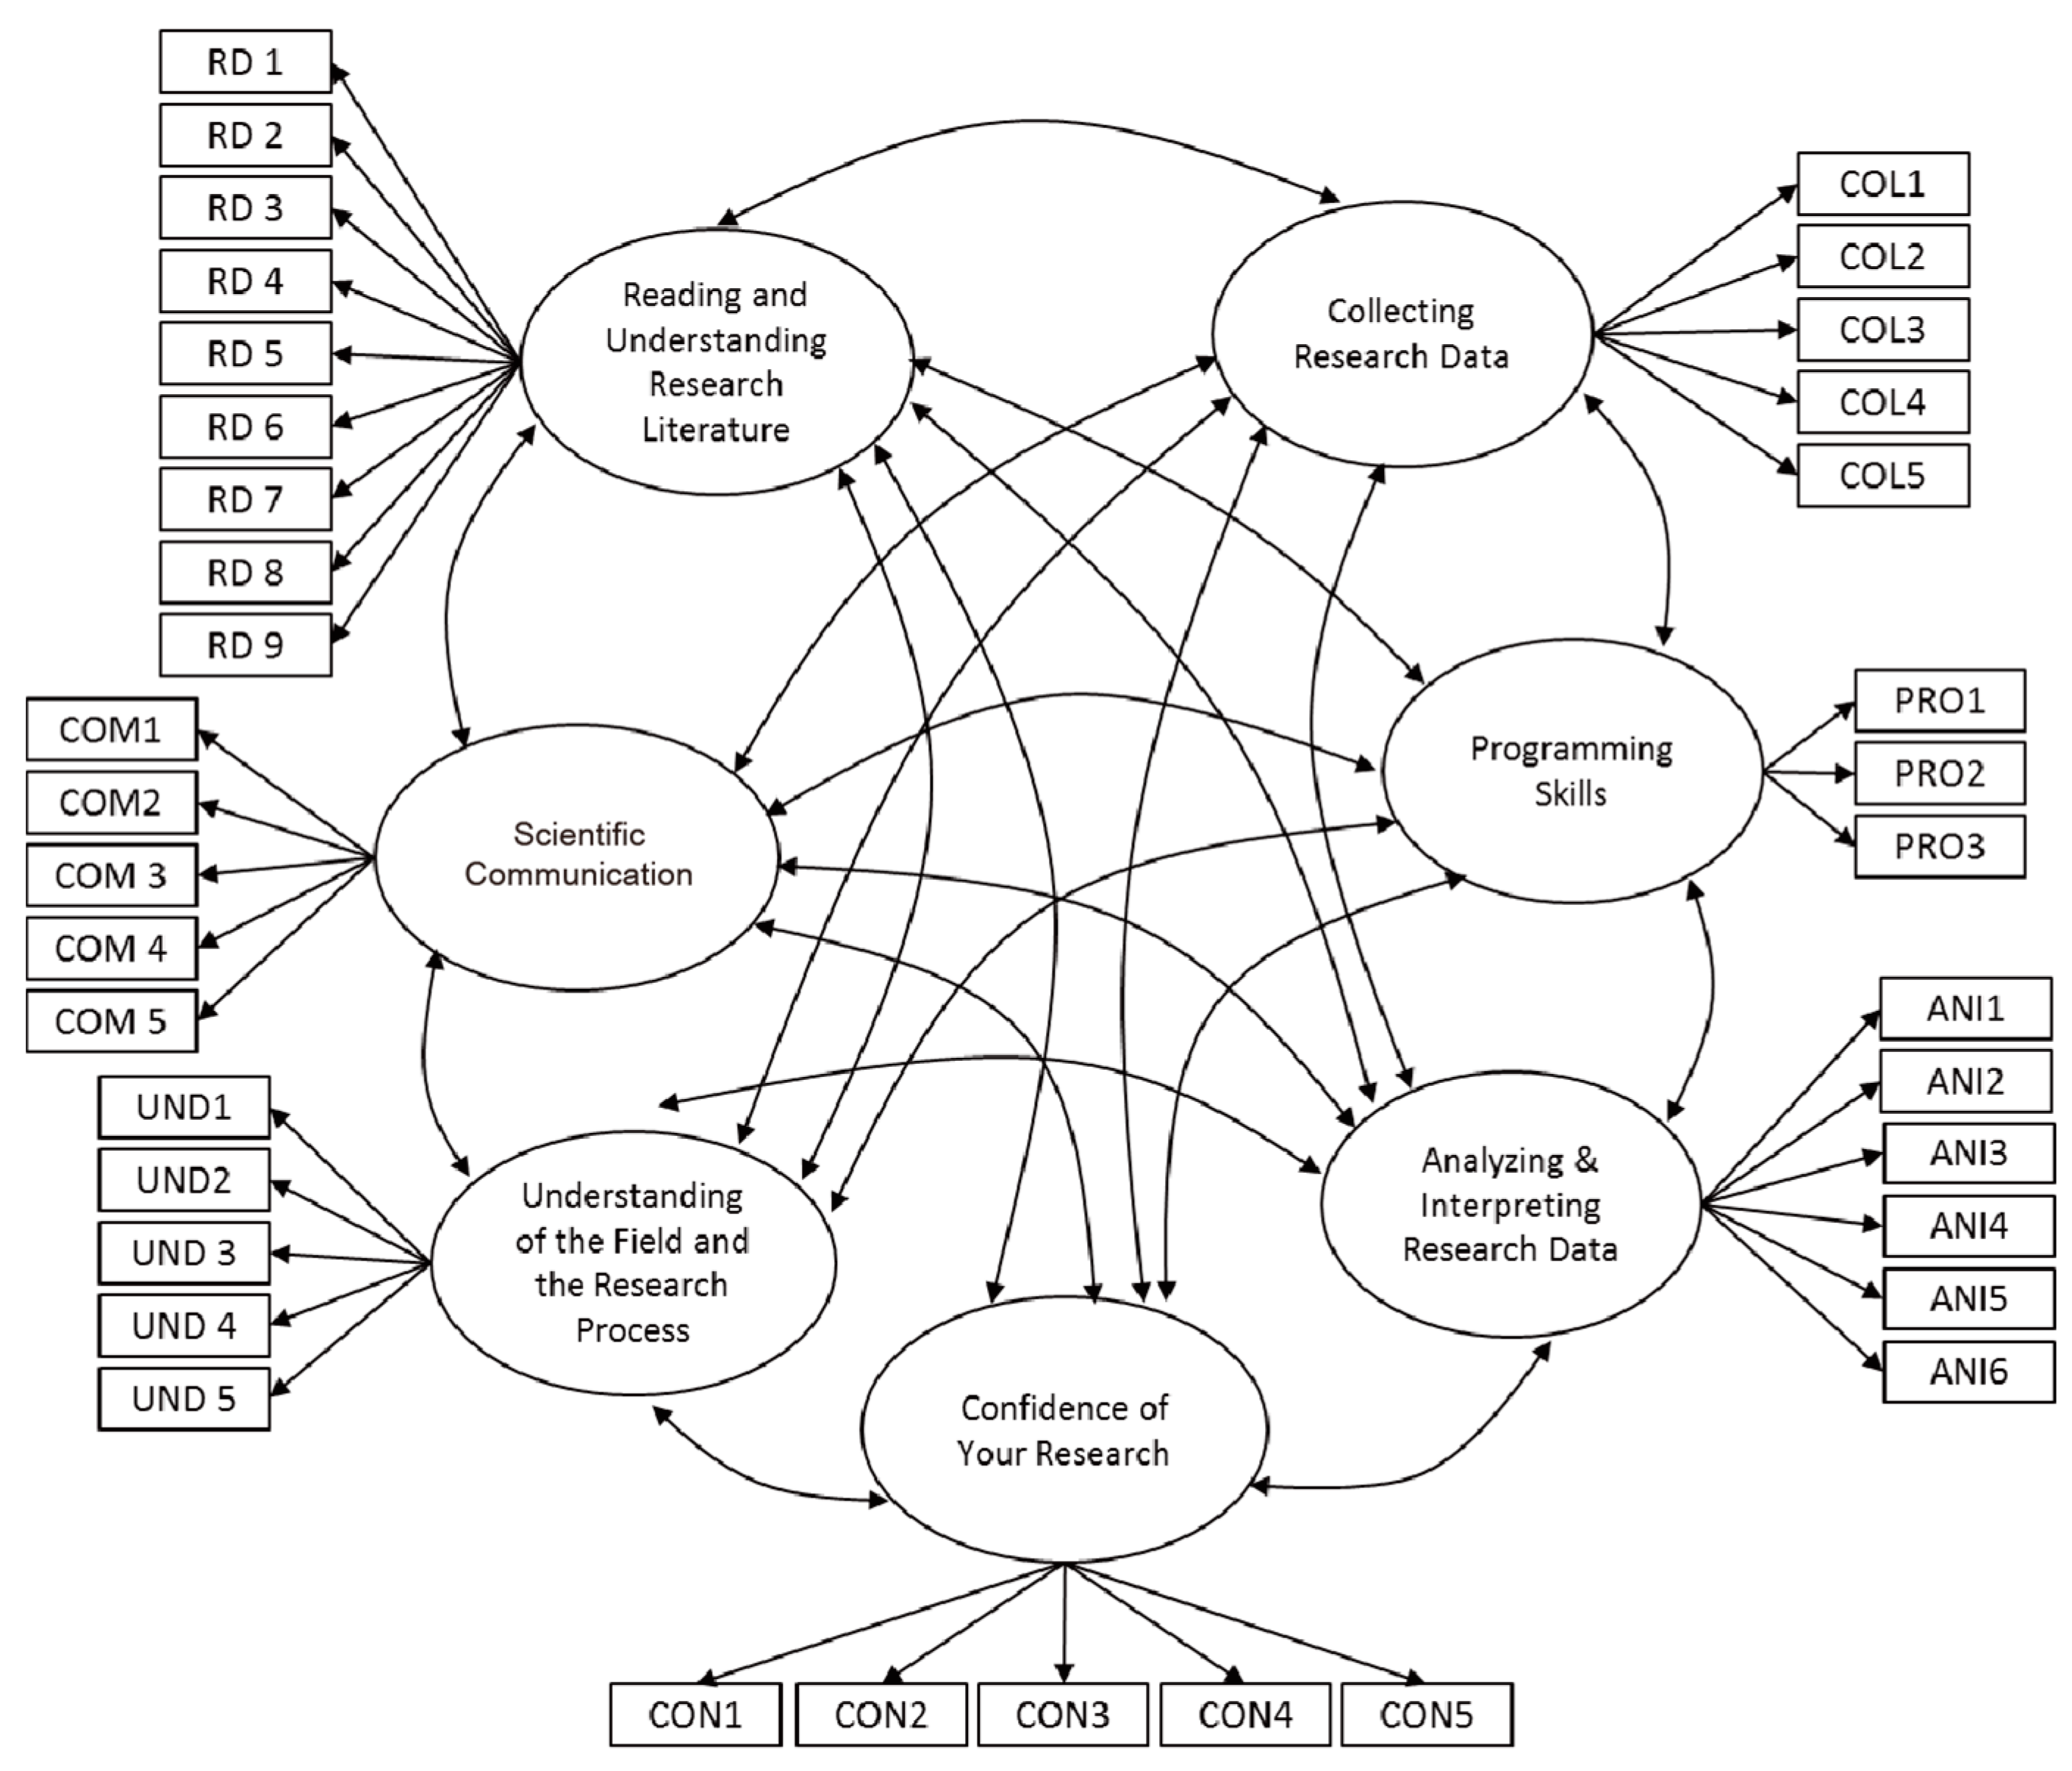
We tested the seven-factor model based on the conceptual model we used to develop the survey (see Figure 2) using a maximum likelihood-robust (MLR) estimation method since the normality assumption was violated for most items. Table 3 presents the model fit indices of the original correlated seven-factor model. While the χ2 value rejected the original model at the 0.05 alpha level and the CFI (0.858) was not acceptable, the RMSEA (0.067) and SRMR (0.062) were acceptable for the pre-survey. A similar pattern manifested for the post-survey with a significant χ2 value, an unacceptable CFI, and acceptable RMSEA (0.068) and SRMR (0.068). Although not all of the fit indices consistently indicated that the model is acceptable based on the suggested criteria, we considered that the criteria might be too stringent for an adequate but complex model [65,66,67]. In addition, the size of standardized factor loadings was between 0.454 and 0.930 for the pre-survey and between 0.536 and 0.892 for the post-survey. Although there is no ‘golden rule’ for an acceptable size of factor loadings, Tabachnick and Fidell [68] suggested a cutoff value of 0.32 which is consistent with the suggestion in Comrey and Lee [69]. Using these values, all of the items in the pre- and post-survey appear to have substantial linear relationships with the hypothesized construct each is associated with. We concluded that the originally constructed
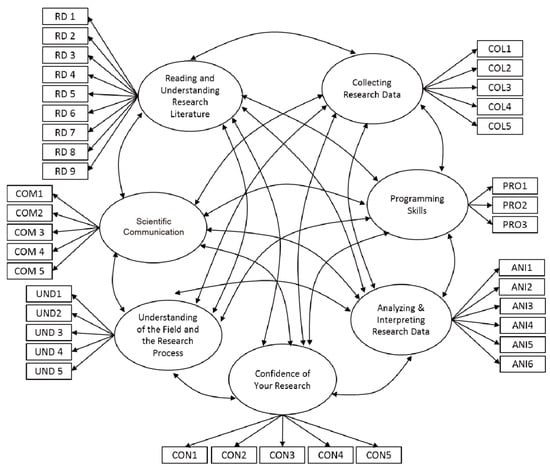
Figure 2.
Confirmatory factor analysis model (CFA) for the pre- and post-survey.
Table 3.
Results of confirmatory factor analysis (CFA) and measurement invariance tests.
A seven-factor model is adequate for both the pre- and post-survey rather than making model adjustments.
3.4. Longitudinal Factorial Invariance
Using the original seven-factor model, we tested the longitudinal factorial invariance between the pre- and post-survey following the typical sequence: configural, metric, scalar, and strict invariances. Based on the same rationale for the CFA analysis, we accepted that the configural invariance model is sustainable based on the acceptable RMSEA (0.047) and SRMR (0.062) although it had a significant χ2 value and low CFI (0.837). Metric invariance holds since the RMSEA and the CFI did not change with ΔSRMR below the cutoff value (≥0.030) although the Satorra-Bentler chi-square difference test between configural and metric invariance models was not significant (ΔχSB2 = 34.315, p = 0.312). For the next step, even though the Satorra-Bentler chi-square difference test (ΔχSB2 = 153.278, p < 0.001) was significant between metric and scalar invariance models, the RMSEA and the SRMR stayed the same and the CFI decreased slightly (−0.006). Thus, scalar invariance was considered to hold between the pre- and post-survey. For the comparison between scalar and strict invariance models, the Satorra-Bentler chi-square difference test (ΔχSB2 = 153.278, p < 0.001) was significant. Yet, there was no change in the RMSEA, while ΔCFI (−0.007) and ΔSRMR (0.010) were below the criteria. We concluded that strict invariance holds between the pre- and post-survey. These results imply that the URE did not affect participants’ interpretation of the survey items substantially. As a result, comparing latent means before and after the URE is legitimate.
Table 4 provides unstandardized factor loadings, intercepts, and unique variances in the established strict invariance model. Given that each of the seven constructs are latent variables without established scales, we need to set metrics for each to overcome this issue (i.e., scale indeterminacy problem). Although it is possible to set this metric in two different ways; (a) by fixing one of the factor loadings to 1 or (b) by setting the latent construct variance to 1—we chose to fix one of the loadings to one, a very common approach. The loadings can be interpreted as any other factor loadings, where the parameter estimates are the slope value from regressing each item on the overarching factor.
Table 4.
Unstandardized measurement parameter estimates of the strict invariance model.
3.5. Latent Mean Comparison
Under the strict invariance model established in the previous step, we compared the equality of the latent mean score of each sub-construct between the pre- and post-surveys. The means and standard deviations are presented with effect sizes in Table 5. Participants scored significantly higher on each sub-construct of the post-survey than on the corresponding sub-construct of the pre-survey (for all subscales, p < 0.01), which implies that the participants’ perceived research skills on every aspect measured by the survey were substantially improved after participation in UREs, with effect sizes ranging from 0.39 to 0.74. Based on the standard suggested by Cohen [70], most of them lie between medium (0.5) to large (0.8) effects while two of them were between small (0.2) and medium effects. However, the effect sizes cannot be directly compared among the sub-constructs because the units of the latent means may not be comparable across the sub-constructs.
Table 5.
Estimated latent means of the seven sub-constructs in the strict invariance model.
4. Discussion
In this manuscript, we present and statistically evaluate the survey we generated for the purpose of providing reliable self-report data for measuring changes in students’ skills through participation in undergraduate research. We contend that our instrument addresses common limitations faced by extant survey tools. Rather than using Likert scales that offer unequal or coarse-grained categories, our response scales are defined by the level of competence students have for each skill. The definition of these scales was informed by faculty perceptions of student expertise in the research setting and extensive interviewing of students, mentors, and faculty across various science disciplines. Using this, respondents can more easily identify their competencies with less potential for interpretive bias. In comparison with other tools intended only for a single post-experience administration (e.g., URSSA), our instrument was developed as a pre/post measure to establish baseline information and monitor self-reported changes in students’ skills over the course of a single or multiple research experiences. The longitudinal measurement invariance test results also indicate that the same interpretation of the survey items held before and after the URE. Hence, future studies can confidently use the USMORE-SS to measure the level of student research skills before and after the URE experiences and compare the scores legitimately. Finally, few other instruments demonstrated their suitability to assess student skills or growth as a result of participation in UREs. We employed a rigorous CFA-based analysis to examine the psychometric properties of the USMORE-SS and the results presented here indicate the suitability of the instrument for estimating URE students’ self-rated abilities.
4.1. Limitations
The significant limitation with this tool, and most others, is that it relies on self-report to measure student gains. While we do have data from graduate student and faculty mentors, we believe these measures are also flawed in that they lack prior knowledge of students’ skills and are significantly more difficult to collect. As this research continues, we plan to explore the comparisons between student and mentor data to investigate any differences in ratings between these groups. Additionally, since our items measure students’ levels of confidence in given skills. It is possible that students with the same skills may rate their comfort in teaching a skill to others differently based on their levels of confidence.
4.2. Future Work
Successfully implementing educational practices requires the articulation of measurable goals, followed by rigorous evaluation that documents effectiveness and impact and guides future decision making [71]. With the increased emphasis internationally on UR in higher education (e.g., [1,5]), it is essential that reliable assessment tools are made available to faculty and program administrators to monitor student development. The USMORE-SS is a generalizable and validated instrument that was designed to offset common limitations in existing UR survey data allowing for better estimates of student skill trajectories. While self-report indicators should be complemented with other more direct measures, as possible, for a more comprehensive understanding of student outcomes [16,36], this study demonstrates the value of the USMORE-SS for providing insight to self-perceived gains and can help inform faculty how to “best” support participant learning.
Additionally, there are a number of analyses we plan to address the noted limitations and to extend this research. We are actively working on analyses that compare results from these survey items with an assessment tool we developed to provide direct evidence to the development of students’ experimental problem-solving skills over a research experience [42]. As mentioned, we also plan to pursue a detailed comparison of student ratings and mentor/faculty ratings. Future extensions of this work will involve specific analyses to identify the association between programmatic characteristics (e.g., mentorship strategies, day-to-day activities) and student gains.
Acknowledgments
This work is funded by the U.S. National Science Foundation (#1140445). No funds were received for covering the costs to publish in open access.
Author Contributions
Adam V. Maltese and Joseph A. Harsh conceived and designed the project and ran data collection; Eunju Jung analyzed the data; All contributed to the writing and editing of the paper.
Conflicts of Interest
The authors declare no conflict of interest. The funding sponsors had no role in the design of the study; in the collection, analyses, or interpretation of data; in the writing of the manuscript; or in the decision to publish the results.
Appendix A
Table A1.
USMORE Student Survey Questions.
Table A1.
USMORE Student Survey Questions.
| Reading and Understanding Research Literature | |
| RD1 | Conducting searches for research literature related to your research project (this does NOT include programming or technical guidance unless directly from a peer-reviewed published article) |
| RD2 | Reading research articles in the discipline (i.e., physics/chemistry) |
| RD3 | Reading research articles in the relevant sub-discipline (i.e., particle physics/organic chemistry) |
| RD4 | Identifying the theoretical purpose to why given methods or techniques are used in the literature |
| RD5 | Interpreting and critiquing the results and findings presented in literature |
| RD6 | Identifying further information necessary to support research-related results in the literature |
| RD7 | Interpreting visual representations of data (i.e., graphs, diagrams, and tables) provided in research literature |
| RD8 | Discussion of research literature within ‘informal’ group setting (i.e., research group or journal club) |
| RD9 | Create written or oral summaries of research article |
| Collecting Research Data | |
| COL1 | Developing your own research questions or hypotheses |
| COL2 | Developing your own research plan |
| COL3 | Using basic research techniques (i.e., those often learned in early classes—data entry, weighing of samples, etc.) |
| COL4 | Using advanced research techniques and methods in your field of study |
| COL5 | Trouble shooting theoretical/technical errors in research during data collection |
| Programming Skills | |
| PRO1 | Computer programming for data collection |
| PRO2 | Computer programming for statistical analysis/modeling of numerical data |
| PRO3 | Computer programming for analysis of non-numerical data (e.g., image processing, chemical analysis) |
| Analyzing and Interpreting Research Data | |
| ANI1 | Qualitative/descriptive analysis of results |
| ANI2 | Statistical analysis of research results using established stat software |
| ANI3 | Interpreting statistical analysis of research in the field |
| ANI4 | Interpreting research-related results |
| ANI5 | Representing data in a visual form common for the research field (i.e., the construction of graphs, tables, and diagrams) |
| ANI6 | Trouble shooting theoretical/technical errors in research after interpreting the data |
| Scientific Communication | |
| COM1 | Discussion of research plans or results within ‘informal’ group setting (i.e., research group or journal club) |
| COM2 | Writing up research methods |
| COM3 | Writing up results |
| COM4 | Writing up a discussion of the results |
| COM5 | Making an oral presentation on research you participated in within a ‘formal’ group setting (i.e., professional meeting, undergraduate research conference) |
| Understanding of the Field and the Research Process | |
| UND1 | Understanding of the overarching discipline (i.e., chemistry/physics) in which your research is conducted |
| UND2 | Understanding of the sub-discipline (i.e., particle physics, organic chemistry) in which your research is conducted |
| UND3 | Understanding of the elements of work involved in science research |
| UND4 | Understanding the process of science in your field (i.e., “how science research is done”) |
| UND5 | Understanding the social or cultural practices of your field (i.e., “how scientists act or behave”) |
| Confidence in your Research Related Abilities | |
| CON1 | Working independently to complete "basic" research tasks (e.g., data entry, weighing of samples, etc. |
| CON2 | Working independently to complete advanced research techniques and methods in your field of study |
| CON3 | Working in the lab setting with other individuals to complete tasks |
| CON4 | Discussing results with mentors |
| CON5 | Suggesting next steps in the research process |
References
- Commission, B. Reinventing Undergraduate Education: A Blueprint for America’s Research Universities; Stony Brook: New York, NY, USA, 2008. [Google Scholar]
- Olson, S.; Riordan, D.G. Engage to Excel: Producing One Million Additional College Graduates with Degrees in Science, Technology, Engineering, and Mathematics. Report to the President; Executive Office of the President: Washington, DC, USA, 2012.
- Walkington, H. Students as Researchers: Supporting Undergraduate Research in the Disciplines in Higher Education; Higher Education Academy: York, UK, 2017. [Google Scholar]
- Brew, A. Enhancing Undergraduate Engagement Through Research and Inquiry; Australian Learning and Teaching Council: Sydney, Australian, 2010. [Google Scholar]
- Healey, M.; Jenkins, A. Developing Undergraduate Research and Inquiry; Higher Education Academy: York, UK, 2009. [Google Scholar]
- National Survey of Student Engagement. Engagement Insights: Survey Findings on the Quality of Undergraduate Education; Indiana University Center for Postsecondary Research: Bloomington, IN, USA, 2015. [Google Scholar]
- Corwin, L.A.; Graham, M.J.; Dolan, E.L. Modeling course-based undergraduate research experiences: An agenda for future research and evaluation. CBE-Life Sci. Educ. 2015, 14, es1. [Google Scholar] [CrossRef] [PubMed]
- Linn, M.C.; Palmer, E.; Baranger, A.; Gerard, E.; Stone, E. Undergraduate research experiences: Impacts and opportunities. Science 2015, 347, 1261757. [Google Scholar] [CrossRef] [PubMed]
- Laursen, S.; Seymour, E.; Hunter, A.B.; Thiry, H.; Melton, G. Undergraduate Research in the Sciences: Engaging Students in Real Science; John Wiley & Sons: Hoboken, NJ, USA, 2010. [Google Scholar]
- Jenkins, A.; Healey, M. Undergraduate research and international initiatives to link teaching and research. Counc. Undergrad. Res. Q. 2010, 30, 36–42. [Google Scholar]
- Brown, J.S.; Collins, A.; Duguid, P. Situated cognition and the culture of learning. Educ. Res. 1989, 18, 32–42. [Google Scholar] [CrossRef]
- Hunter, A.B.; Laursen, S.L.; Seymour, E. Becoming a scientist: The role of undergraduate research in students’ cognitive, personal, and professional development. Sci. Educ. 2007, 91, 36–74. [Google Scholar] [CrossRef]
- Kardash, C.M. Evaluation of undergraduate research experience: Perceptions of undergraduate interns and their faculty mentors. J. Educ. Psychol. 2000, 92, 191. [Google Scholar] [CrossRef]
- Delatte, N. Undergraduate summer research in structural engineering. J. Prof. Issues Eng. Educ. Pract. 2004, 130, 37–43. [Google Scholar] [CrossRef]
- Gentile, J.; Brenner, K.; Stephens, A. Undergraduate Research Experiences for STEM Students: Successes, Challenges, and Opportunities; National Academies Press: Washington, DC, USA, 2017. [Google Scholar]
- Lopatto, D. Survey of undergraduate research experiences (SURE): First findings. Cell Biol. Educ. 2004, 3, 270–277. [Google Scholar] [CrossRef] [PubMed]
- Lopatto, D. Undergraduate research experiences support science career decisions and active learning. CBE-Life Sci. Educ. 2007, 6, 297–306. [Google Scholar] [CrossRef] [PubMed]
- Healey, M.; Jordan, F.; Pell, B.; Short, C. The research–teaching nexus: A case study of students’ awareness, experiences and perceptions of research. Innov. Educ. Teach. Int. 2010, 47, 235–246. [Google Scholar] [CrossRef]
- John, J.; Creighton, J. Researcher development: the impact of undergraduate research opportunity programmes on students in the UK. Stud. High. Educ. 2011, 36, 781–797. [Google Scholar] [CrossRef]
- Gregerman, S.R.; Nagda, B.A.; Jonides, J.; von Hippel, W.; Lerner, J.S. Undergraduate student-faculty research partnerships affect student retention. Rev. High. Educ. 1998, 22, 55–72. [Google Scholar] [CrossRef]
- Russell, S.H.; Hancock, M.P.; McCullough, J. Benefits of undergraduate research experiences. Science 2007, 316, 548–549. [Google Scholar] [CrossRef] [PubMed]
- Carlone, H.B.; Johnson, A. Understanding the science experiences of successful women of color: Science identity as an analytic lens. J. Res. Sci. Teach. 2007, 44, 1187–1218. [Google Scholar] [CrossRef]
- AAAS. Describing and Measuring Undergraduate STEM Teaching Practices; American Association for the Advancement of Science: Washington, DC, USA, 2012; p. 57. [Google Scholar]
- Morley, R.L.; Havick, J.J.; May, G.S. An evaluation of the Georgia Tech summer undergraduate program of research in electrical engineering for minorities. J. Eng. Educ. 1998, 87, 321. [Google Scholar] [CrossRef]
- Harsh, J.A.; Maltese, A.V.; Tai, R.H. A perspective of gender differences in chemistry and physics undergraduate research experiences. J. Chem. Educ. 2012, 89, 1364–1370. [Google Scholar] [CrossRef]
- Crowe, M.; Brakke, D. Assessing the impact of undergraduate research experiences on students: An overview of current literature. CUR Q. 2008, 28, 43–50. [Google Scholar]
- Eagan, M.K., Jr.; Hurtado, S.; Chang, M.; Garibay, J.C. Making a difference in science education: The impact of undergraduate research programs. Am. Educ.Res. J. 2013, 50, 683–713. [Google Scholar] [CrossRef] [PubMed]
- Weston, T.J.; Laursen, S.L. The Undergraduate Research Student Self-Assessment (URSSA): Validation for use in program evaluation. CBE-Life Sci. Educ. 2015, 14, ar33. [Google Scholar] [CrossRef] [PubMed]
- Lopatto, D. Exploring the benefits of undergraduate research: The SURE survey. In Creating effective Undergraduate Research Programs in Science; Teachers College Press: New York, NY, USA, 2008; pp. 112–132. [Google Scholar]
- Bertram, D. Likert Scales … Are the Meaning of Life: CPSC 681–Topic Report. 2007. Available online: poincare.matf.bg.ac.rs/~kristina//topic-dane-likert.pdf (accessed on 8 November 2011).
- Chimi, C.J.; Russell, D.L. The Likert scale: A proposal for improvement using quasi-continuous variables. In Information Systems Education Conference; Citeseer: Washington, DC, USA, 2009. [Google Scholar]
- Harsh, J.A.; Maltese, A.V.; Tai, R.H. Undergraduate Research Experiences from a longitudinal perspective. J. Coll. Sci. Teach. 2010, 41, 84–91. [Google Scholar]
- Pascarella, E.T. Identifying Excellence in Undergraduate Education Are We Even Close? Chang. Mag. High. Learn. 2001, 33, 18–23. [Google Scholar] [CrossRef]
- Gonyea, R.M. Self-reported data in institutional research: Review and recommendations. New Dir. Inst. Res. 2005, 127, 73. [Google Scholar] [CrossRef]
- Creswell, J.W. Research Design: Qualitative, Quantitative, and Mixed Methods Approaches; Sage publications: Thousand Oaks, CA, USA, 2013. [Google Scholar]
- Bauer, K.W.; Bennett, J.S. Alumni perceptions used to assess undergraduate research experience. J. High. Educ. 2003, 74, 210–230. [Google Scholar] [CrossRef]
- Seymour, E.; Hunter, A.-B.; Laursen, S.L.; DeAntoni, T. Establishing the benefits of research experiences for undergraduates in the sciences: First findings from a three-year study. Sci. Educ. 2004, 88, 493–534. [Google Scholar] [CrossRef]
- Groves, R.M.; Presser, S.; Dipko, S. The role of topic interest in survey participation decisions. Public Opin. Q. 2004, 68, 2–31. [Google Scholar] [CrossRef]
- Creswell, J.W.; Clark, V.L.P. Designing and Conducting Mixed Methods Research; Sage Publications, Inc.: Thousand Oaks, CA, USA, 2007; p. 275. [Google Scholar]
- Harsh, J.; Esteb, J.J.; Maltese, A.V. Evaluating the development of chemistry undergraduate researchers’ scientific thinking skills using performance-data: First findings from the performance assessment of undergraduate research (PURE) instrument. Chem. Educ. Res. Pract. 2017, 18, 472–485. [Google Scholar] [CrossRef]
- Pascarella, E.T.; Blaich, C.; Martin, G.L.; Hanson, J.M. How robust are the findings of academically adrift? Change Mag. High. Learn. 2011, 43, 20–24. [Google Scholar] [CrossRef]
- Harsh, J.A. Designing performance-based measures to assess the scientific thinking skills of chemistry undergraduate researchers. Chem. Educ. Res. Pract. 2016, 17, 808–817. [Google Scholar] [CrossRef]
- Arminger, G.; Schoenberg, R.J. Pseudo maximum likelihood estimation and a test for misspecification in mean and covariance structure models. Psychometrika 1989, 54, 409–425. [Google Scholar] [CrossRef]
- Gourieroux, C.; Monfort, A.; Trognon, A. Pseudo maximum likelihood methods: Theory. Econom. J. Econom. Soc. 1984, 52, 681–700. [Google Scholar] [CrossRef]
- Yuan, K.H.; Bentler, P.M. Three likelihood-based methods for mean and covariance structure analysis with nonnormal missing data. Sociol. Methodol. 2000, 30, 165–200. [Google Scholar] [CrossRef]
- Wang, L.; Fan, X.; Willson, V.L. Effects of nonnormal data on parameter estimates and fit indices for a model with latent and manifest variables: An empirical study. Struct. Equ. Model. Multidiscip. J. 1996, 3, 228–247. [Google Scholar] [CrossRef]
- Rhemtulla, M.; Brosseau-Liard, P.É.; Savalei, V. When can categorical variables be treated as continuous? A comparison of robust continuous and categorical SEM estimation methods under suboptimal conditions. Psychol. Methods 2012, 17, 354–373. [Google Scholar] [PubMed]
- Buchanan, A.L.; McCubbin, L.D.; Adesope, O. Exploratory factor analysis of the Trauma and Attachment Belief Scale among partners of service members. Traumatology 2016, 22, 214–221. [Google Scholar] [CrossRef]
- Singh, S.; Knox, M.; Pelletier, H. Exploratory factor analysis and psychometric evaluation of the Healthcare Provider Attitudes Toward Child Maltreatment Reporting Scale. Child. Health Care 2016, 356–365. [Google Scholar] [CrossRef]
- Brown, T.A. Confirmatory Factor Analysis for Applied Research; Guilford Publications: New York, NY, USA, 2015. [Google Scholar]
- Raykov, T.; Marcoulides, G.A. Introduction to Psychometric Theory; Routledge: New York, NY, USA, 2011. [Google Scholar]
- Williams, L.J.; O’Boyle, E.H. Ideal, nonideal, and no-marker variables: The confirmatory factor analysis (CFA) marker technique works when it matters. J. Appl. Psychol. 2015, 100, 1579–1602. [Google Scholar] [CrossRef] [PubMed]
- Vandenberg, R.J.; Lance, C.E. A review and synthesis of the measurement invariance literature: Suggestions, practices, and recommendations for organizational research. Organ. Res. Methods 2000, 3, 4–70. [Google Scholar] [CrossRef]
- Bowers, E.P.; Li, Y.; Kiely, M.K.; Brittian, A.; Lerner, J.V.; Lerner, R.M. The five Cs model of positive youth development: A longitudinal analysis of confirmatory factor structure and measurement invariance. J. Youth Adolesc. 2010, 39, 720–735. [Google Scholar] [CrossRef] [PubMed]
- Millsap, R.E.; Hartog, S.B. Alpha, beta, and gamma change in evaluation research: A structural equation approach. J. Appl. Psychol. 1988, 73, 574–584. [Google Scholar] [CrossRef]
- Widaman, K.F.; Ferrer, E.; Conger, R.D. Factorial invariance within longitudinal structural equation models: Measuring the same construct across time. Child Dev. Perspect. 2010, 4, 10–18. [Google Scholar] [CrossRef] [PubMed]
- Steenkamp, J.-B.E.; Baumgartner, H. Assessing measurement invariance in cross-national consumer research. J. Consum. Res. 1998, 25, 78–90. [Google Scholar] [CrossRef]
- Yoon, M.; Millsap, R.E. Detecting violations of factorial invariance using data-based specification searches: A Monte Carlo study. Struc. Equ. Model. 2007, 14, 435–463. [Google Scholar] [CrossRef]
- Barrett, P. Structural equation modelling: Adjudging model fit. Pers. Indiv. Differ. 2007, 42, 815–824. [Google Scholar] [CrossRef]
- Chen, F.F. Sensitivity of goodness of fit indexes to lack of measurement invariance. Struc. Equ. Model. 2007, 14, 464–504. [Google Scholar] [CrossRef]
- Kline, R.B. Principles and Practice of Structural Equation Modeling; Guilford publications: New York, NY, USA, 2015. [Google Scholar]
- Hu, L.T.; Bentler, P.M. Cutoff criteria for fit indexes in covariance structure analysis: Conventional criteria versus new alternatives. Struc. Equ. Model. Multidiscip. J. 1999, 6, 1–55. [Google Scholar] [CrossRef]
- Satorra, A.; Bentler, P.M. Ensuring positiveness of the scaled difference chi-square test statistic. Psychometrika 2010, 75, 243–248. [Google Scholar] [CrossRef] [PubMed]
- Henson, R.K. Understanding Internal Consistency Reliability Estimates: A Conceptual Primer on Coefficient Alpha. Meas. Eval. Counsel. Dev. 2001, 34, 177. [Google Scholar]
- Marsh, H.W.; Hau, K.-T.; Grayson, D. Goodness of Fit in Structural Equation Models. In Contemporary psychometrics: A festschrift for Roderick P. McDonald; McArdle, A.M.-O.J.J., Ed.; Lawrence Erlbaum Associates Publishers: Mahwah, NJ, USA, 2005; pp. 275–340. [Google Scholar]
- Marsh, H.W.; Hau, K.-T.; Wen, Z. In search of golden rules: Comment on hypothesis-testing approaches to setting cutoff values for fit indexes and dangers in overgeneralizing Hu and Bentler’s (1999) findings. Struct. Equ. Model. 2004, 11, 320–341. [Google Scholar] [CrossRef]
- Marsh, H.W.; Muthén, B.; Asparouhov, T.; Lüdtke, O.; Robitzsch, A.; Morin, A.J.S.; Trautwein, U. Exploratory structural equation modeling, integrating CFA and EFA: Application to students’ evaluations of university teaching. Struct. Equ. Model. Multidiscip. J. 2009, 16, 439–476. [Google Scholar] [CrossRef]
- Tabachnick, B.G.; Fidell, L.S. Using Multivariate Statistics, 5th ed.; Allyn & Bacon/Pearson Education: Boston, MA, USA, 2007; p. xxvii, 980. [Google Scholar]
- Comrey, A.L.; Lee, H.B. A First Course in Factor Analysis, 2nd ed.; Lawrence Erlbaum Associates: Hillsdale, NJ, USA, 2013. [Google Scholar]
- Cohen, J. Statistical Power Analysis for the Behavioral Sciences, rev. ed.; Academic Press: New York, NY, USA, 1977; pp. 357–410. [Google Scholar]
- Council, N.R. Knowing What Students Know: The Science and Design of Educational Assessment; National Academies Press: Washington, DC, USA, 2001. [Google Scholar]
© 2017 by the authors. Licensee MDPI, Basel, Switzerland. This article is an open access article distributed under the terms and conditions of the Creative Commons Attribution (CC BY) license (http://creativecommons.org/licenses/by/4.0/).