Abstract
This study investigated how the time that elementary pre-service teachers (PSTs) spend studying certain mathematics topics during a content course is related to growth in their perseverance in problem-solving. Using a quasi-experimental design, PSTs from two classes taught by the same instructor engaged in 12 problem-solving sessions each to measure their willingness to initiate and sustain, and re-initiate and re-sustain upon an impasse, productive struggle during engagement. Inspired by the thinking-oriented and knowledge-oriented theoretical approaches to teacher preparation in elementary mathematics, there were two class conditions. Over one semester, the treatment group studied five mathematics topics (averaging about 400 min of classroom time per topic) and the control group studied 10 mathematics topics (averaging about 150 min of classroom time per topic). The results show that the perseverance of PSTs in problem-solving in the treatment group grew at a significantly greater rate compared to PSTs in the control group. This suggests that PSTs’ perseverance development may be supported by spending more classroom time studying fewer topics during mathematics content courses.
1. Introduction
There is no consensus about the best practices by which to structure elementary education teacher education programs, especially when considering mathematics education [1,2,3]. Amongst other foci, professional organizations recommend that preparation programs focus on developing elementary pre-service teachers’ (PSTs’) knowledge of mathematics concepts and productive mathematical practices during coursework [4]. Teachers must be experts in the mathematics content they teach (e.g., content and pedagogy related to K-8 mathematics), and also experts in understanding the mathematical practices their students encounter during the learning process (e.g., perseverance in problem-solving and supporting productive struggle during sensemaking). Research shows that teachers’ mathematical knowledge for teaching, or the knowledge teachers have about mathematics instruction and the learning experience of students, directly affects the quality of instruction their students experience [5]. Therefore, elementary teacher preparation programs must carefully consider what content and practices PSTs have opportunities to learn in their preparatory mathematics coursework to help them develop into effective educators.
However, PSTs across North America experience great variance in what they study and for how long they study it [6,7,8,9], making it difficult to predict how effective any teacher preparation program may be in producing effective elementary teachers of mathematics. Furthermore, many PSTs enter their teaching field with mathematics anxiety [10] and inadequate mathematical knowledge for teaching [11], which can influence their instructional choices, student expectations, and how they teach mathematics [12,13]. Different preparation programs make different decisions about what mathematics topics to include in instruction, the depth at which those topics are studied, and the degree to which mathematical practices like perseverance in problem-solving are being developed [1]. Amidst such uncertainty, the future of elementary mathematics teacher preparation calls for new research efforts that consider the relationship between the mathematics content being studied and the mathematical practices cultivated in PSTs.
2. Theoretical Perspectives and Review of Related Literature
When designing the goals and structure of mathematics content courses for PSTs, many teacher preparation programs consider two theoretical perspectives: knowledge-oriented approaches and thinking-oriented approaches [14]. Although aspects of these two approaches can overlap significantly, each of them appears across many institutions around North America and offers different answers for what elementary mathematics PSTs need to know and experience in order to be prepared to teach. In this section, I review these two theoretical perspectives and their related literature, as well as argue for an increased focus on perseverance development for future elementary mathematics teachers in their preparation programs.
2.1. Knowledge-Oriented Approaches
A knowledge-oriented approach to elementary mathematics teacher preparation emphasizes the importance of PSTs knowing the mathematics content they will eventually teach [14]. Put simply, this theoretical approach asserts that a mathematics teacher must have considerable content knowledge to teach mathematics effectively. Yet there is no consensus around what it means to know from this perspective. To help understand the nature of knowing, Skemp’s [15] foundational work depicts two ways of mathematical knowing: instrumental understanding and relational understanding. Instrumental understanding is focused on knowing rules and procedures without understanding the underlying concepts or reasonings behind them. Conversely, relational understanding is a deeper form of knowledge in which students understand both how and why mathematical ideas work. Relational understanding emphasizes conceptual understanding, which focuses on identifying and exploring connections and relationships between mathematical ideas [16]. Relational understanding can involve instrumental understanding, leveraging a balance between conceptual and procedural knowledge to build flexible and transferable mathematical understandings and to help students see mathematics as a coherent whole.
To study the knowledge-oriented approach, some scholars have operationalized knowledge with general measures that are more aligned to instrumental understanding, such as skills-based achievement tests and the number of mathematics topics studied [17]. Other scholars have operationalized knowledge with deeper measures that are more aligned to relational understanding, including both subject matter and pedagogical content knowledge (i.e., mathematical knowledge for teaching), which focus on the unique knowledge and skills that teachers require to understand and convey mathematical concepts in ways that are accessible and meaningful to students [12]. Although there are a multitude of ways to interpret what it means to know, there is little doubt in the notion that students will have better learning experiences when their teachers have experienced more mathematics [17]. However, there is some disagreement on what mathematics content PSTs should study during preparation. This is an especially contentious issue considering that time is limited during teacher preparation [18]. These debates have been ongoing for decades, with researchers struggling to find significant connections between what content PSTs study and their students’ mathematics achievement [19,20,21,22].
Spending Less Instructional Time on More Topics
One influential outcome of teacher preparation programs operating from a knowledge-oriented perspective is the formation of survey courses for mathematics. Policy documents have encouraged these programs to provide PSTs with learning experiences with mathematics that have a close connection with what they will teach in the future [23]. In other words, PSTs should study the mathematics standards that their future students will study. Based on this advice, it naturally follows that PSTs should be exposed to as many mathematics topics as possible in the K-8 curriculum. Thus, in many teacher preparation programs, PSTs engage in survey courses aiming to cover the complete spectrum of elementary mathematics content topics [6]. These survey courses imply that PSTs experience lessons related to many content topics but for a relatively short amount of time, and thus, with a limited amount of depth. Some perspectives on what it means to know might value the high number of mathematics topics studied in these survey courses [22]; however, such depth limitations make it challenging for PSTs to develop mathematical knowledge for teaching [12], especially the conceptual knowledge associated with understanding the connections between mathematical objects, which is essential to understand in order to teach mathematics well [15,24,25]. Instead, PSTs in such survey courses may be developing more of an instrumental understanding of these mathematical ideas under study [15].
2.2. Thinking-Oriented Approaches
A thinking-oriented approach to elementary mathematics teacher preparation emphasizes conceptual understanding and distinct conception changes in PSTs [14]. This theoretical approach is in contrast to a knowledge-based approach by focusing more on both the how and why of mathematical ideas rather than reinforcing the instrumental understandings that PSTs may have developed in their own elementary schooling. A thinking-oriented approach, like a knowledge-oriented approach, does involve the notion of knowing; however, a thinking-oriented approach is less ambiguous about what it means to know. Knowing from a thinking-oriented approach emphasizes relational and conceptual understandings, where connections between mathematical ideas are most valued and leveraged to create flexible and transferable knowledge [15,16]. Additionally, a thinking-oriented approach involves changing PSTs’ beliefs and conceptions of mathematics, which requires the development of mathematical thinking skills. This shift from memorizing to reasoning and thinking mathematically is challenging and requires perseverance from PSTs who may be problem-solving with this elementary content (and not simply memorizing) for the first time [16].
Researchers and policymakers agree on the critical importance of developing mathematical thinking in PSTs [4,23,26]. PSTs should engage in reasoning, explaining, and making sense of mathematics, all while participating in coursework that emphasizes developing productive dispositions and practices around mathematics. These dispositions and practices include cultivating habits of mind that support mathematical thinking and problem-solving, such as perseverance and willingness to engage in productive struggle, reasoning abstractly and quantitatively, argumentation, modeling, strategically using tools, attending to precision, finding and using structure, and using repeated reasoning [27]. To be clear, the thinking-oriented approach does not reject the importance of PSTs acquiring mathematical knowledge; instead, it emphasizes the understanding related to knowledge acquisition and the applications of such knowledge to problem-solving with challenging mathematical ideas [28]. Research supports the idea that developing these habits in PSTs can be achieved through practices that encourage exploration, questioning, and reflection, inspired by Pólya’s [29] problem-solving principles [30,31]. These habits do not require deep prior mathematical knowledge but leverage an inquisitive mindset. The goal is to prepare PSTs to think mathematically and creatively, equipping them to tackle a broad range of problems in their teaching careers.
Spending More Instructional Time on Fewer Topics
In contrast to a knowledge-oriented perspective, one influential outcome of teacher preparation programs operating from a thinking-oriented perspective is the formation of elementary content courses that purposely omit mathematics topics to focus more time on high-leverage topics and practices (the definition of “high-leverage topics and practices” is subjective and contextual, and no such consensus exists amongst mathematics teacher educators about exactly what mathematics topics to include (and omit) during the limited amount of time in elementary teacher preparation [1]), such as number concepts and problem-solving [32]. Since there is not enough time during teacher preparation to deeply engage PSTs with every mathematics topic they may teach [18], content courses like these are designed to spend ample time on fewer topics, with the goal of PSTs using that time to alter their prior conceptions of mathematics and develop deep conceptual understanding for the topics under study. Foundational research exists that supports this notion, which indicates that the amount of time PSTs spend studying a topic is likely related to how well they learn the topic, provided that the time is spent using meaningful instructional activities that support the development of content knowledge necessary for the work of teaching [33,34,35,36]. More recent research has shown the benefits of spending more time on fewer topics with elementary PSTs, highlighting PST growth in agency, authority, and identity measures [37], as well as evidence of PST understanding of a single, albeit vast, mathematical topic: the multiplicative conceptual field [38].
Although few, some research exists that attempts to relate PSTs’ time spent studying a topic and their related learning outcomes. Researchers found that undergraduate mathematics coursework [19,21,39,40] or advanced degrees [40,41] showed little correlation with teachers’ later knowledge or teaching. Additionally, a meta-analysis showed that teachers who have completed more mathematics courses generally do not produce greater mathematics achievement gains in their elementary students [42]. This may be because the measures of content knowledge in these studies were often imprecise and not directly related to the mathematical knowledge used in teaching. Other researchers used more specific measures of content knowledge to find positive associations between instructional time and related learning outcomes. For example, studies using the Learning Mathematics for Teaching instrument [43] found that higher content knowledge at the end of teacher preparation was associated with better instructional practices and pedagogical beliefs during teaching [44,45]. Despite these studies, scholars have generally found it challenging to identify clear, long-term connections between elementary mathematics content coursework and teachers’ knowledge or teaching skills.
In contrast to the lack of clear connections between PSTs’ time spent studying a topic and their related learning outcomes, a research program out of the University of Delaware, USA, has found some promising results from their thinking-oriented approach to teacher preparation. The elementary teacher preparation program at the University of Delaware has long used a thinking-oriented approach to its content coursework, facilitating mathematics content courses that focus on fewer topics at great depth [46]. Within this program, Morris and Hiebert [47] followed graduates from their teacher preparation program to assess their postgraduation performance on a task in which they were required to simulate lesson planning for a new mathematics topic. Administered 2–3 years after graduation, the lesson planning task evaluated the appropriateness and depth of key mathematical concepts in their lesson plans. Graduates showed stronger subject conceptual knowledge for topics covered during their coursework compared to those not covered. Notably, the graduates performed better on key mathematical concepts addressed multiple times across different content courses, suggesting that more time spent studying a topic leads to better performance on teaching-related tasks [47].
Following a similar research design as Morris and Hiebert [47], Hiebert et al. [48] tracked two cohorts of elementary teachers (former PSTs) for several years after graduation, asking participants to complete three tasks designed to assess their specialized content knowledge (specialized content knowledge [12] pertains to the deep mathematical understanding and expertise specific to teaching; this type of subject matter knowledge is uniquely profound and essential for educators, extending beyond the depth typically required in other professions) on four mathematics topics: three taught during their coursework and one that was not. Significant differences were consistently found, favoring the topics covered in coursework, which indicated that PSTs can acquire and retain this conceptual knowledge early in their preparation, applying it effectively in teaching-related tasks years after graduation [48].
Building on both of the aforementioned studies [47,48], Corven, DiNapoli, Willoughby, and Hiebert [49] examined the relationship between the number of instructional minutes dedicated to mathematics topics in teacher preparation and the specialized content knowledge demonstrated by program graduates years later. These researchers leveraged both the lesson planning task [47] and specialized content knowledge task [48], as well as used a more precise measure of instructional time across all mathematical topics (minutes). Also, this study involved 13 mathematics topics: nine of these topics were studied for varying amounts of instructional time by PSTs during content coursework, and four were not. Participants completed these tasks postgraduation and the analysis showed that over 400 min of high-quality instruction on one mathematics topic was needed to develop the specialized content knowledge to teach it well years later. This finding, coupled with the findings from Morris and Hiebert [47] and Hiebert et al. [48], suggest that instructional time indeed does matter on topics during content courses for teachers to remember and apply years later. For PSTs to develop conceptual knowledge, they need to be able to recognize and make connections across mathematical ideas [16]. Although the approach of exposing PSTs to more mathematical topics to encourage the creation of more mathematical connections makes theoretical sense, these studies suggest that PSTs need considerable time spent studying a topic to develop and retain such conceptual knowledge. Thus, survey courses, which devote small amounts of time to many mathematical topics, may not be effective in fostering lasting conceptual knowledge and application for future elementary teachers of mathematics.
It is important to note that the elementary teacher preparation program at the University of Delaware has some clear advantages in conducting research in this area for two primary reasons. First, over the past 25 years, instructors of the mathematics content courses in the elementary teacher program have made significant efforts to consistently improve the quality of instruction across all topics, regardless of the time allocated to each. Every lesson plan for each course has been systematically refined through a continuous improvement process [50]. All lessons are based on a constructivist theory of learning [51], which is focused on developing conceptual understanding through exploring the connections between mathematical concepts and procedures [52]. This consistent effort across all topics enhances the likelihood that PSTs are engaged in similarly effective learning activities during instructional time for all topics [53]. Second, these lesson plans specified the exact number of minutes for the instructor to spend on each activity and even offered expert suggestions about what to say when discussing particularly important connections between mathematical ideas. Furthermore, weekly instructor meetings ensured a consistent approach to teaching, including any necessary time adjustments. In fact, a study showed that content instructors in this program closely followed these lesson plans, allowing for precise estimates of the actual time dedicated to each topic [54]. Additionally, the program’s elementary and middle school mathematics methods courses showed no systematic focus on the topics studied, minimizing the impact of any incidental exposure on the results. Although such rigid structure in lesson plans can be controversial [55], in this case, these explicit, reliable details about what is being taught and for how long make educational settings like these ideal for research on PSTs’ time spent studying a topic and their related learning outcomes.
2.3. Toward a Focus on Perseverance Development
The aforementioned studies out of the University of Delaware were the chief motivators for the current study. While that research shows potential, further investigation is needed to explore the advantages and limitations of the instructional time allocated (or not allocated) to specific mathematics topics in content courses for PSTs.
For this study, I specifically wanted to investigate the relationship between instructional time and elementary PSTs’ perseverance development during content coursework, to couple with the previously reviewed findings about PSTs’ knowledge development and retention. I chose to focus on a practice-based PST outcome measure (perseverance in problem-solving), rather than PSTs’ knowledge development, based on the call for new scholarship to support a thinking-oriented approach that values the development of practices that support mathematical thinking [14]. Furthermore, because this is the first study of its kind about instructional time and elementary PSTs’ perseverance development, I chose to focus on only one practice that supports mathematical thinking (i.e., PSTs’ perseverance). I have empirically studied perseverance in problem-solving in the past and felt prepared to carry out a new study with this as a sole focus. The omission of other constructs related to mathematical practices (e.g., argumentation, modeling [27]) is not meant to mean that they are not also worthy of research focus. In fact, all mathematical practices have the potential to be intertwined and simultaneously necessary in mathematics education.
Research shows that PSTs can develop and retain mathematical understandings by devoting more time to studying fewer topics [47,48,49], but little is known about other outcome measures related to PSTs, including the development of mathematical practices like perseverance in problem-solving. Perseverance, or initiating and sustaining productive struggle in the face of obstacles [56], promotes sensemaking with mathematical ideas [57,58,59,60]. Students make meaning through productive struggle, or as they grapple with mathematical ideas that are within reach but not yet well formed; it is essential for teachers to create student learning environments that promote these kinds of productive struggles [52]. In fact, in their book Thinking Mathematically, Mason and colleagues [53] build off of Pólya’s [29] problem-solving work to suggest that perseverance is not about sheer determination alone; rather, it is supported by a flexible mindset that encourages experimentation and learning from partial solutions or failed attempts. The authors propose that problem-solvers should engage in behaviors like “specializing, generalizing, conjecturing, and convincing” as they work, which require patience and sustained focus. Mason and colleagues use words like “entry”, “attack”, “stuck”, and “review” to describe the actions prevalent in the problem-solving process. They highlight the importance of perseverance through a cyclical process of attempting different strategies, reflecting on what does or does not work, and continually refining one’s approach. Additionally, they stress the role of metacognition—being aware of one’s own thought processes—as essential for persevering effectively, as it helps learners make intentional decisions about how to proceed, when to revise their approach, and how to keep motivation high throughout the problem-solving journey. Related, encouraging student perseverance has been highlighted in mathematics education reform documents as a method to enhance teaching and learning, with the expectation that this support will lead to perseverance growth in students over time [61,62]. Notably, the first Standard for Mathematical Practice in the United States’ Common Core State Standards for Mathematics [27] is “Make sense of problems and persevere in solving them” (p. 6), underscoring the critical role of fostering perseverance in students.
Several studies have shown that perseverance in problem-solving can be malleable in students and nurtured, depending on the learning environment, to grow and improve over time [57,60,63,64,65,66,67,68,69,70,71,72,73]. Many of these studies [57,63,64,65,66,67,68] employed the Three-Phase Perseverance Framework as an analytic perspective, which also guided the perseverance analysis in this paper (see Section 3). Learning environments that emphasized certain achievement goals had an influence on students’ perseverance in problem-solving [63]. In DiNapoli’s [63] study, students’ perseverance was measured as they clinically worked on a challenging task and affirmed their goals for problem-solving. Students who had goals of authentic mastery, or motivations to understand and make meaning [74], tended to persevere more consistently and not give up easily when they encountered a setback or impasse. On the other hand, students who had goals of performance, or motivations to be correct [74], tended to fluctuate more in their perseverance, experiencing jubilance during productive attempts at problem-solving and depression during failures. Interestingly, students who had mastery goals also reported less mathematics anxiety than students who had performance goals.
Other perseverance research has investigated the effects of scaffolding on perseverance in problem-solving. Kapur [71] clinically investigated the impact of non-scaffolding on student perseverance. Kapur’s study on productive failure demonstrated that students who engaged in problem-solving without external scaffolds achieved deeper learning outcomes than those who followed a structured lecture-and-practice approach for tackling ill-structured mathematics tasks. In the productive-failure condition, students were encouraged to struggle and independently explore possible solutions without direct guidance. In contrast, students in the lecture-and-practice condition were taught the correct procedures from the beginning. Although many students in the productive-failure group chose not to re-engage with tasks after encountering an impasse, they frequently outperformed their peers in the lecture-and-practice condition. This suggests that the act of persevering through challenges—despite not achieving immediate success—can enhance learning and highlight the potential downsides of over-scaffolding tasks, which may limit students’ development of resilience and independent problem-solving skills. On the other hand, DiNapoli and Miller [57] clinically investigated the impact of various scaffolding types on student perseverance and found that students were more likely to persevere, enhance their self-confidence, reduce their mathematics anxiety, and overcome perceived impasses when they documented their own problem conceptualizations and connected them to prior knowledge at the beginning of problem-solving. This type of scaffold encouraged students to create an artifact of general heuristics associated with mathematical problem-solving, and those self-generated, general heuristics often aided students throughout their problem-solving experiences. These positive outcomes were less frequent when students were not explicitly prompted to record their conceptualizations, and students did not naturally apply such self-scaffolding techniques in problem-solving sessions without prompting. Both Schoenfeld’s [70] and Koichu et al.’s [73] work reinforces, in part, these findings, as these two studies found benefits of both mathematically specific and mathematically general heuristic use on perseverance in problem-solving. This body of work suggests that perseverance can develop over time as students improve their heuristic knowledge with both general and specific heuristics, supporting their willingness to navigate and stay engaged with complex problem-solving situations.
Additionally, more naturalistic studies have collectively shown the importance of teachers and classroom environments that consistently use pedagogies inviting perseverance in problem-solving. In a classroom study, Warshauer [60] found that teachers’ formative assessments of students who are struggling can significantly impact the productivity of those struggles. Teachers who could maintain the cognitive demand of the content while encouraging students to stay engaged through questioning, clarifying, interpreting, confirming students’ thinking, and providing opportunities for student-to-student discussion experienced the most success, supporting student perseverance with challenging mathematics tasks. However, Warshauer also found that these interactions also expose classroom inequities, as teachers must balance supporting individual students with the broader demands of managing a classroom, often limiting their ability to assist every student equally. Related, Barnes [69] studied students’ problem-solving to show that students require external support systems to help them self-regulate at moments when they encounter impasses. These supports included teachers reminding students to set short-term goals during problem-solving, as well as teachers interjecting at various timepoints to help students manage their frustration during productive struggles. Bass and Ball [72] investigated the influences, in part, of a low-floor/high-ceiling task on elementary students’ perseverance in problem-solving. The task, which prompted students to design a train that met specific requirements for a fictional client, had simple entry points (low floor) yet no actual solution (high ceiling). Students spent days collaborating on the task, developing new strategies, and overcoming obstacles with the teacher’s support. Students experienced productive struggles with this task, as evidenced by their confidence and enthusiasm in writing a letter to the fictional client, which included mathematical details about why this particular train was impossible to design.
In other studies, student perseverance was supported in a variety of ways, including by monolingual teachers inviting their students to leverage their bilingualism while problem-solving [64]. Perseverance was supported by teachers employing educational technology that can detect student mathematical mistakes and provide targeted feedback to support engaging in productive struggle [65] and by teachers being purposeful in designing lessons that foster problem-solving, mathematical thinking, and making mathematical connections across ideas [66]. Specific to elementary teacher education, DiNapoli and Marzocchi [67] reflected on their work with PSTs and found that they could best support PSTs’ productive struggles by employing mathematical tasks that were low-floor/high-ceiling, collaborative, and had room for autonomy. PSTs working with such tasks also made it easier to involve more discourse during class, which helped normalize productive struggle as part of the learning process.
Taken together, these perseverance studies have implications for teacher education, primarily that PSTs must have consistent opportunities to persevere and develop a disposition and willingness to engage in productive struggle during their mathematics content coursework. Such respect for productive struggle is integral for their future careers as teachers, to be able to empathize with and support their future students to productively struggle to learn mathematics [4]. It is unclear in the literature, however, if and how PSTs develop their perseverance in problem-solving during their elementary teacher preparation mathematics coursework, especially since such coursework can be designed and taught from different theoretical perspectives [14]. Thus, this study aimed to investigate PSTs’ perseverance growth as it related to their experiences in an elementary mathematics content course taught from two different perspectives: inspired by a knowledge-oriented approach in which more mathematics topics are covered with less instructional time, and inspired by a thinking-oriented approach in which fewer mathematics topics are covered with more instructional time. As such, the research question that guided this study was as follows: what is the relationship between mathematics instructional time and perseverance growth for elementary PSTs in a content course?
3. Context and Methodology
This study followed a quasi-experimental design [75] to explore the connection between instructional time and perseverance development among elementary PSTs in a mathematics content course. Data were collected and analyzed from two separate groups of participants, specifically from two sections of a terminal Mathematics Content for Elementary Teachers II course. There were two class conditions: a treatment group and a control group, each comprising 30 PSTs, totaling 60 participants. Each PST in this study earned at least 80% in their prerequisite Mathematics Content for Elementary Teachers I course. I served as the sole instructor for both classes and each class met once per week for 150 min. For context, this study took place at a public research university in the northeast region of the United States of America. This university is a designated Hispanic Serving Institution and enrolls around 23,000 students per year.
3.1. Treatment and Control Groups
Inspired by the common manifestations of Li and Howe’s [14] knowledge-oriented and thinking-oriented approaches, I designed the treatment and control conditions with one primary difference: the number of mathematical topics taught during one semester. PSTs in the treatment group encountered 5 mathematics topics during one semester, averaging about 400 min of classroom time dedicated to each mathematics topic. This meant that each mathematics topic of study in the treatment group required approximately three class sessions to finish. The mathematics topics for the treatment group were Conceptions of Fractions, Addition of Fractions, Subtraction of Fractions, Multiplication of Fractions, and Division of Fractions. PSTs in the control group encountered 10 mathematics topics during one semester, averaging about 150 min of classroom time dedicated to each mathematics topic. This meant that each mathematics topic of study in the control group required approximately one class session to finish. The mathematics topics for the control group were the 5 mathematics topics for the treatment group, plus Percentages, Ratios and Proportions, Polygons, Angles, and Area.
In both the treatment and control conditions, I taught each lesson using the same pedagogy and following the same style of lesson plans, both of which emphasized conceptual learning opportunities through exploring the connections between mathematical concepts and procedures [52,54]. For instance, each lesson involved learning goals of understanding, minimal lectures, problem-solving opportunities for individuals and groups of students, and time for mathematical discussions. In this way, I viewed Li and Howe’s [14] knowledge-oriented and thinking-oriented approach as not two different epistemological approaches, per se, but instead as two approaches that could involve the same style of instruction, but across a different number of mathematical topics.
3.2. Data Collection
The data for this study were collected primarily from PSTs’ experiences in problem-solving sessions [57,63,67]. In both the treatment and control groups, each PST worked individually during 12 problem-solving sessions, one per week. In these sessions, PSTs were presented with a challenging mathematical task for them to attempt to solve. The instructor was not present during these sessions; the PSTs were alone. These problem-solving sessions were video-recorded from the PSTs’ point of view (their face was not on video to support anonymity for later analysis) and were collected for analysis. Therefore, there were 12 problem-solving session videos of each PST, and thus, there were 720 videos to analyze (360 from the treatment group and 360 from the control group).
The goal of these problem-solving sessions was to engage PSTs with tasks they did not immediately know how to solve, i.e., tasks that required perseverance. The tasks were designed as low-floor/high-ceiling tasks, which were aimed to induce productive struggle and perceived moments of impasse, that is, moments when PSTs felt substantially stuck [76,77]. If PSTs working on such tasks never encountered any productive struggles or challenges, they were provided a different task for that problem-solving session that would require perseverance. The tasks were always related to the mathematics of the most recent class lesson. This meant that PSTs could have worked on different tasks in their respective problem-solving sessions, depending on what their most recent lesson was or whether or not the task required perseverance from them. This ensured that each PST was working on a low-floor/high-ceiling task in their problem-solving sessions that was familiar to them, yet challenging, which is essential for perseverance analysis. During their work on challenging tasks in these problem-solving sessions, PSTs were instructed to think out loud and narrate their every thought and move during problem-solving [78]. PSTs were specially instructed to announce if/when they encountered a perceived impasse. PSTs’ work in these sessions was not graded and they could stop working at any time.
As an example of a task that PSTs encountered during a problem-solving session, consider the 100 Stars Task related to the topic of Conceptions of Fractions: If 100 stars represent , how many stars represent 1 whole?
The 100 Stars Task was an apt choice for a problem-solving session because it was conceptually related to the PSTs’ lesson(s) on fractions as measurements, the meaning of the numerator, the meaning of the denominator, and discrete models. However, this task challenged students to make sense of a rational number numerator, as well as the actions of partitioning and iterating to eventually form a discrete representation of one whole with stars. The familiarity of the concepts in the task (low floor) coupled with the complexity of the representations and actions required to solve it (high ceiling) makes the 100 Stars Task worthy of perseverance for most PSTs learning about the concepts of fractions in their content courses. To help the reader gain a sense of the common types of tasks with which PSTs productively struggled during their problem-solving sessions, a selection of tasks is available in Appendix A.
In addition to the video data, each PST completed an open-ended reflection survey after each problem-solving session. In the survey, PSTs were prompted to engage in written stimulated recall [78] and reflective practice [79] about specific moments during their work on the challenging task. Responding to these prompts, PSTs wrote about any in-the-moment emotional and cognitive activity they may have experienced, especially around their perceived impasses. These reflection surveys were helpful in diagnosing impasse moments and problem-solving heuristics for PSTs, which was essential for data analysis. In some cases, I asked PSTs follow-up questions based on their survey responses, via email, to help clarify specific moments during their problem-solving sessions.
3.3. Data Analysis
I used the Three-Phase Perseverance Framework (3PP) (see Figure 1) to analyze each PST’s perseverance on tasks during problem-solving sessions [57]. The 3PP has been shown to be effective in measuring perseverance in problem-solving in several empirical studies [57,63,64,65,67]. The 3PP was designed to operationalize a conception of perseverance that considered the extent to which participants initiated and sustained, and re-initiated and re-sustained upon an impasse, productive struggle on a challenging task. The 3PP has three phases: the Entrance Phase, the Initial Attempt Phase, and the Additional Attempt Phase. Work in these phases aligns well with Mason et al.’s [53] notions of perseverance in problem-solving, as students enter a problem, attack a problem, review their progress, and potentially get stuck at times along the way. Please consult DiNapoli and Miller [57] for a full description of the origins and functionality of the 3PP.
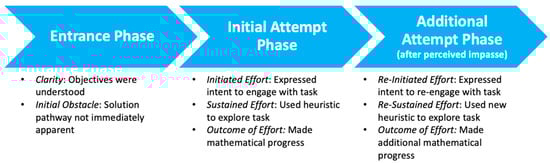
Figure 1.
The Three-Phase Perseverance Framework.
The Entrance Phase determines the appropriateness of the task for the participant. For perseverance to be reasonable on a task, the participant must first understand what the task is asking (Clarity component). Just as important, the participant must also not immediately know a solution pathway (Initial Obstacle component). If these two components are affirmative, further analysis can occur by considering a participant’s initial and additional attempts at problem-solving.
The Initial Attempt Phase determines whether and how a participant initiates and sustains their effort, as well as the results of this effort, while engaging with the task. Here, perseverance is demonstrated by a participant showing intent to engage with or enter the task through problem-solving (Initiate Effort component). When the participant chooses to pursue the problem, perseverance is further evidenced by their actions to engage with or attack the task, using a problem-solving heuristic to navigate the uncertain mathematical situation (Sustain Effort component). Consequently, perseverance is also indicated by making or reflecting on one’s perceived progress toward understanding the mathematical ideas at play or by solving the problem completely (Outcome of Effort component).
If a participant does not solve the task after the initial attempt, the Additional Attempt Phase determines whether and how the student revises their original problem-solving plan and the outcomes of these efforts to overcome setbacks and re-engage with the task. To transition into the Additional Attempt Phase, the participant must have encountered a perceived impasse or felt substantially stuck and unsure of how to proceed [53,76,77]. At this juncture, perseverance is evidenced by the participant’s intent to re-engage with or re-enter the task using a different heuristic than in the first attempt (Re-initiated Effort component). If the participant decides to continue tackling the problem with a new approach, further evidence of perseverance includes taking action on their intent to re-engage by exploring or attacking the mathematical situation with the new heuristic (Re-sustained Effort component) and making or reflecting on one’s new perceived progress toward understanding the mathematics involved or by solving the problem completely (Outcome of Effort component). Theoretically, a participant may continue their efforts in the Additional Attempt Phase, making multiple subsequent attempts as needed. For this study, I only considered participants’ actions around one perceived impasse during their work on a challenging task.
I utilized a points-based version of the 3PP (see Figure 2) to represent whether and how a PST initiated (0–1 point) and sustained (0–1 point) efforts toward a solution before encountering an impasse, as well as the mathematical productivity of these efforts (0–1 point). After an impasse, I also assessed whether and how a PST re-initiated (0–1 point) and re-sustained (0–1 point) their efforts toward a solution, along with the mathematical productivity of these new efforts (0–1 point). To make scoring decisions, I relied on PSTs’ think-alouds, their written work, their stimulated recall responses, and, in some cases, their responses to my emailed follow-up questions. Consequently, PSTs could earn 0–6 3PP points per problem-solving session, with 0 indicating no evidence of perseverance and 6 indicating ample evidence of perseverance. A PST could demonstrate ample perseverance by gradually building understanding through effort, even without completely solving the task. A descriptive example of a PST’s perseverance in problem-solving, including how it was coded, is presented in the Results, specifically in Section 4.2.
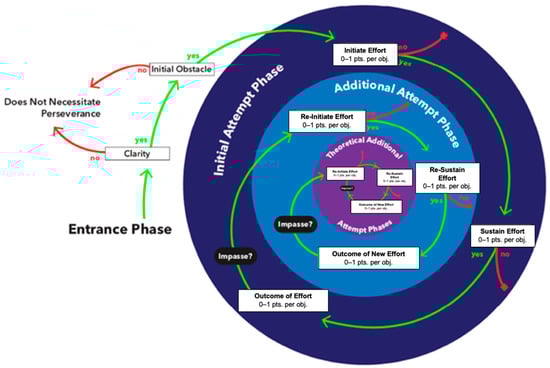
Figure 2.
The Three-Phase Perseverance Framework (points-based version).
When considering how the 3PP captures perseverance improvement, over time, an increase in just one 3PP point signifies a substantial improvement in perseverance quality because it could represent perseverance growth in various ways: the difference between not engaging at all vs. initiating some effort (0 points vs. 1 point); initiating some effort but then giving up vs. sustaining that effort (1 point vs. 2 points); sustaining an effort but not making mathematical progress vs. actually making mathematical progress based on that sustained effort (2 points vs. 3 points); engaging in a successful first attempt but giving up upon an impasse vs. re-initiating a second attempt after an impasse (3 points vs. 4 points); re-initiating some new effort but then giving up vs. re-sustaining that new effort (4 points vs. 5 points); and re-sustaining an effort but not making any new mathematical progress vs. actually making new mathematical progress based on that re-sustained effort (5 points vs. 6 points).
Each PST engaged with 12 challenging tasks and thus engaged in 12 problem-solving sessions in this study. Therefore, each PST earned 12 3PP scores, each ranging from 0 to 6 points. Descriptive statistics and hierarchical linear modeling were used to examine the relationship between group (treatment and control) and growth in 3PP scores.
3.4. Addressing Potential Bias
I served as the sole instructor of both the treatment and control group in this study. Furthermore, I was the sole researcher in this study. Because of my presence and influence in all aspects of this study, it is prudent to address how I managed the possibility of bias in this research. Eliminating all of my own biases and subjectivities is not possible; however, being transparent and explaining how I tried to address them is helpful for research validity [80].
Regarding myself as the sole instructor of both groups of PSTs in this study, I worked hard to teach each class in the same manner. Despite some manifestations of thinking-oriented perspectives being more conducive to problem-solving and discourse opportunities [14], I made earnest and organized efforts to provide similar opportunities when teaching in both the treatment and control conditions. To help with this, I explicitly followed detailed lesson plans. Lesson plans for the treatment group (fewer topics) and control group (more topics) were created with the same goals in mind: to build conceptual knowledge, encourage problem-solving, and involve mathematical discussions. I have had multiple years of experience teaching both kinds of lesson plans. These lesson plans also indicated strict time limits for each component in the lesson progression. Treatment group lesson plans were longer (about 400 min each) and devoted more time to each component, by design. As such, treatment group lesson plans were partitioned into smaller lessons to deliver across multiple class sessions. Control group lesson plans were shorter (about 150 min each) and thus devoted less time to each component. As such, control group lesson plans were able to be delivered in one class period, and thus the control group was able to study more mathematics topics in one semester. In fact, one affordance of my serving as the sole instructor in this study was that I could be sure about how much instructional time was being allocated to each mathematics topic in each group. Since the instruction itself was the same quality for both groups, I was able to study the differences in student outcomes related to the amount of instructional time spent explicitly.
Regarding myself as the sole researcher in this study, I took precautions in the ways I analyzed the PSTs’ data. One risk of my subjectivity is that due to the relationship I expected to discover, I might interpret the data in a biased manner, seeing only what I wished to see [80]. To help manage this, I employed the help of two independent coders to assist me in analyzing the data using the 3PP. For each mathematics topic, two research assistants and I independently coded data from nine randomly chosen problem-solving sessions (15% of the data set). Thus, each of us coded the data from each problem-solving session using a score from 0 to 6 3PP points. We compared our 3PP scores and discussed any differences; any coding disagreements were resolved by consensus. This process helped me determine how consistent my codes were with those of my assistants, addressing any unconscious biases I may have had. I coded the rest of the data myself with this frame of mind.
In the next section, I share my results of using these methods. As a reminder, the research question that guided this study was as follows: what is the relationship between mathematics instructional time and perseverance growth for elementary PSTs in a content course?
4. Results
The results are structured into two subsections. First, I explain the overall findings of this study using quantitative measures. The overall findings show how PSTs in the treatment group experienced significantly greater perseverance growth compared to PSTs in the control group. Second, I provide a descriptive example of perseverance growth from one PST’s experiences across two problem-solving sessions. This rich example helps to illustrate the ways in which this PST did or did not persevere while engaging with two challenging tasks during this study.
4.1. Overall Findings
The means and standard deviations of the 3PP scores for each task by group are presented in Table 1. A profile plot comparing the means of the 3PP scores for each task by group is presented in Figure 3. An independent samples t-test showed that there was no significant effect for the group when comparing the average 3PP scores for task 1 (t(58) = −0.8360, p = 0.2033). Thus, at the start of the problem-solving sessions, participants in the control group were persevering with about the same success compared to participants in the treatment group.

Table 1.
The 3PP means (standard deviations) from the 12 tasks by group.
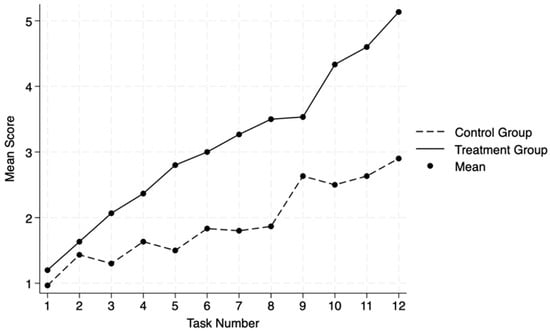
Figure 3.
Profile plot comparing the 3PP means from the 12 tasks by group.
Hierarchical linear modeling (HLM) was used to examine the relationship between group and growth in 3PP scores. HLM is a good fit for these data because of their nested structure: 12 3PP scores are nested within each of the 60 participants. Furthermore, 3PP scores within each participant are likely to exhibit less variance than 3PP scores across participants, and HLM accounts for this data structure. In the below paragraphs, I describe the HLM building process and the results that followed.
For n = 60 participants measured at T = 12 task timepoints, yij was defined as the 3PP score at timepoint i (for i = 0, …, T − 1) for participant j (for j = 1, …, n) and ti as the time at which task i was conducted. In this case, it is not necessary to define tij since the tasks were conducted at equal increments for all participants. Therefore, ti suffices. A random intercept model (Model 1), with the group as an explanatory variable (0 = control, 1 = treatment), was fitted as follows:
- Model 1:
In Model 1, is the intercept, averaged across individuals, which serves as the expected value of at , the first timepoint. is the slope of the regression of on time. For a random intercept model, this is assumed to be the same for all participants. is the group effect, comparing the 3PP scores of the treatment group to those of the control group. is a random effect, specific to each participant, representing the difference between a participant’s 3PP score and the overall mean, . Lastly, is a residual, specific to each participant and each timepoint. The fitted equation for Model 1 is , indicating significant growth in 3PP scores over time (for the entire sample) and a significant difference in 3PP growth rates favoring the treatment group (for the entire sample) (see Table 2).
Table 2.
Hierarchical Linear Model 1.
To allow for random slopes for task timepoints, Model 1 was extended to allow for the possibility that participants’ 3PP scores grew at different rates over time. Model 2 was fitted as follows:
- Model 2:
In Model 2, is a random effect, specific to each participant, representing the difference between a participant’s 3PP growth rate by task and the overall slope, . The fitted equation for Model 2 is the , indicating significant growth in 3PP scores over time (for the entire sample) and a significant difference in 3PP growth rates favoring the treatment group (for the entire sample (see Table 3)). A likelihood ratio test showed that Model 2, which allowed for random slopes for task timepoints, was a better fit than the random intercept-only Model 1 (, ).
Table 3.
Hierarchical Linear Models 1 and 2.
At this point, additional models were also considered to ascertain the best fit for the data. Model 3 was built and tested to add a random slope for group assignment, but it was not a significantly better fit for the data than Model 2. Also, Model 4 was built and tested to test for non-linear (quadratic) growth, but it was not a significantly better fit for the data than Model 2. See Appendix B for information about these additional models. At this point, Model 2 was still the best fit for the data.
Lastly, Model 2 was extended to create Model 5, which allowed for an interaction between group and task. Model 5 was created to include an interaction term without a random slope. Model 5 was fitted as follows:
- Model 5:
For Model 5, the fitted equation is , indicating significant growth in 3PP scores over time (for the entire sample) and a significant interaction between group and task, which implies a divergence of 3PP growth rates over time favoring the treatment group (see the paragraphs below for an illustration of such divergence). A significant likelihood ratio test indicated that Model 5, which incorporated this interaction term (without a random slope), was a better fit for the data than Model 2, which did not include the interaction term (). At this point, an additional model was tested, Model 6, which included a random slope for the interaction term. Model 6 was not a significantly better fit for the data than Model 5. See Appendix B for information about Model 6.
Across all HLM buildings, Model 5, which included a random slope for task only, was found to be the best fit for the data. After adding the interaction term between group and task in Model 5, the coefficient for the group was no longer significant (see Table 4). This indicates that the relationship between the 3PP growth rates of the two groups changes over time. Examining the profile plot (see Figure 2), it appears that the 3PP growth from Task 1 to Task 2 appears very similar regardless of group. However, after Task 2, the 3PP growth rates of the two groups appear to diverge, with the treatment group exhibiting greater growth in 3PP scores over time from Task 2 to Task 12.
Table 4.
Hierarchical Linear Models 1, 2, and 5.
To help illustrate this divergence, consider the following examples. Recall that, for the purposes of the HLM, the 12 tasks were renumbered 0 through 11. Consider the predicted 3PP score for a control group participant at time 0 (the first task; group = 0, t0 = 0) as follows:
- Control group:
Now, compare this to the predicted 3PP score for a treatment group participant at time 0 (the first task; group = 1, t0 = 0) as follows:
- Treatment group:
The coefficient for the group in Model 5, 0.29, is the difference between the predicted 3PP scores of the control and treatment groups on the first task (). Now, consider the predicted 3PP scores for the control and treatment groups at time 1 (the second task) as follows:
- Control group:
- Treatment group:
The predicted 3PP scores again favor the treatment group by 0.29, the coefficient for the group, but now there is also a contribution from the interaction term that results in a larger predicted difference between 3PP scores favoring the treatment group (). Thus, the gap between the predicted 3PP scores of the treatment and control groups will continue to widen over time, favoring the treatment group, due to the significant interaction term between group and time.
4.2. Descriptive Example of Perseverance Growth
To help illustrate the ways in which participants may have persevered (or not) while engaging with tasks during problem-solving sessions, consider the following descriptive example of perseverance growth from Participant 6, a member of the treatment group. I share Participant 6’s experiences on Task 7 and Task 8, which they encountered one week apart. Participant 6 earned 3 3PP points on their work on Task 7 and 6 3PP points on their work on Task 8. This descriptive example is not meant to represent the ways in which all PSTs improved in their perseverance over time. Instead, it is meant to illustrate one example of perseverance growth, as well as an example of how PSTs’ perseverance in problem-solving was coded using the 3PP.
4.2.1. Evidence of Participant 6’s Perseverance on Task 7
During their seventh problem-solving session, Participant 6 engaged with the following challenging task: Draw an area model to show the product of 2/3 and 4/3.
This task was an apt choice for a problem-solving session because it was conceptually related to the previous introductory lesson on the meaning of multiplication of fractions. It also challenged students because, in the context of multiplication, it was their first experience with area models and with a rational number multiplicand greater than one whole. Accordingly, during their think-aloud video, Participant 6 affirmed that this task was indeed familiar, but that they did not know immediately how to solve it. Through the analytic lens of the 3PP, this was evidence of Participant 6 passing through the Entrance Phase since they understood what the task was asking (Clarity component) but did not immediately know a solution pathway (Initial Obstacle component).
In their Initial Attempt Phase of the 3PP, Participant 6 initiated their effort (1 3PP point, Initiated Effort component) with this task by verbally expressing ways they could enter the task, that they could “draw it out…like the other area models we’ve done in class.” Participant 6 sustained this effort (1 3PP point, Sustained Effort component) by reminding themselves that “this means two-thirds of four over three”, and also by drawing the quantity of 4/3 relative to one whole (the Basic Measuring Unit, or BMU). They continued attacking the problem by redrawing the quantity 4/3 and attempting to find two-thirds of it. Participant 6 said “this is two of them” while shading in two of the four pieces of their picture of 4/3 to represent what two-thirds of the quantity 4/3 might look like. Next, they studied their picture and admitted some confusion, “this doesn’t look right…this is not two-thirds…two-thirds would be more than a half and this is a half”. Despite the mistake, this admission implied some perceived mathematical progress toward a solution (1 3PP point, Outcome of Effort component) since Participant 6 realized their work depicted half of the quantity 4/3, and not two-thirds of 4/3. Participant 6’s work in the First Attempt Phase on Task 7 is shown in Figure 4.
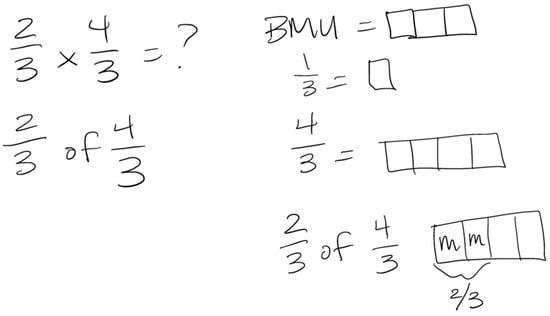
Figure 4.
Participant 6’s written work in the Initial Attempt Phase on Task 7.
Next, Participant 6 encountered a perceived impasse and was substantially stuck. After admitting they had indeed drawn half of 4/3 instead of two-thirds of 4/3, they decided to stop working. This concluded Participant 6’s efforts, and they earned 3 3PP points on this task, which reflected a quality first attempt at solving the task, but no additional attempt after the impasse. Participant 6 clarified their perceived impasse in their problem-solving session reflection survey. They wrote, “I got stuck when I couldn’t draw 2/3 of 4/3. It looked like half of 4/3 and I didn’t know how to fix it. You can’t get 2/3 of four”. This indicated that Participant 6 was struggling with partitioning the four pieces of 1/3 into three equal parts. Of course, redrawing 4/3 as an equivalent quantity using more, smaller pieces is an option in this case, but that did not occur to Participant 6 during their work on this task.
4.2.2. Evidence of Participant 6’s Perseverance on Task 8
One week later, during their eighth problem-solving session, Participant 6 engaged with the following challenging task: Draw a discrete model to show the product of 2 2/3 and 2 2/3.
This task was an appropriate choice for a problem-solving session because it was conceptually related to the follow-up lesson on the meaning of multiplication of fractions that occurred earlier that week. It also challenged students because, in the context of multiplication, it was their first experience with discrete models and with a rational number operator greater than one whole. Once again, Participant 6 affirmed that this task was indeed familiar, but that they did not know immediately how to solve it, which illustrated evidence of Participant 6 passing through both components of the Entrance Phase of the 3PP.
In their Initial Attempt Phase of the 3PP, Participant 6 initiated their effort (1 3PP point, Initiated Effort component) with this task when they verbally expressed their intent to enter the task, “I could draw Xs for the 2 2/3…I could find copies of that”. Participant 6 sustained this effort (1 3PP point, Sustained Effort component) by drawing eight Xs to represent the quantity 2 2/3, or 8/3, implying that one X represented a quantity of 1/3. They continued such efforts by attempting to operate on that quantity with an operator of 2 2/3. They said, “I know this means to find [2 2/3] copies of the eight Xs”. They began to draw copies of the 8/3, showcasing the meaning of multiplication. They continued their attack by drawing two whole copies of 8/3 as 16 total Xs (two rows of eight Xs) and labeled them as 2, implying that those 16 Xs represented two copies of 8/3. Then, Participant 6 drew another copy of 8/3 as eight Xs and attempted to find two-thirds of it. They split the eight Xs into three groups, although unequal groups, and labeled two of the three groups as 2/3, implying that those two groups represented another two-thirds of 8/3. Next, similarly to their work on Task 7, Participant 6 reflected on their work and confessed some confusion, “Oh, this two-thirds is wrong again! I keep doing that! I don’t get it; I can’t get this to be two-thirds”. Once again, this admission implied some perceived mathematical progress toward a solution (1 3PP point, Outcome of Effort component) since they realized this aspect of their work did not depict two-thirds of 8/3. Participant 6’s work in the First Attempt Phase on Task 8 is shown in Figure 5.
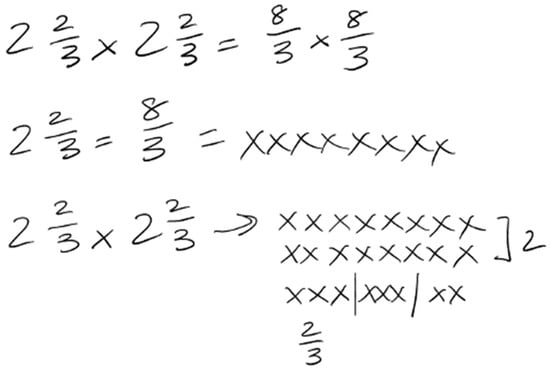
Figure 5.
Participant 6’s written work in the Initial Attempt Phase on Task 8.
As a result of their confusion with finding two-thirds of 8/3, Participant 6 encountered a perceived impasse and was substantially stuck. At this point in their problem-solving session, they said, “I guess I’m stuck”. This moment of impasse was triggered in a similar manner as their impasse on Task 7: they were unable to partition a drawn quantity into a certain number of equal-sized parts. Despite this impasse, however, Participant 6 did not immediately give up. Instead, they paused for a while, about 40 s, and reviewed their written work. Eventually, they exclaimed, “Wait, I never did the BMU!” Participant 6 realized that they never explicitly attended to what counts as one whole for this problem situation (the BMU). Although they did implicitly decide that three Xs should represent 1 whole when they drew 8/3 as 8 Xs during their first attempt at problem-solving, Participant 6’s exclaim suggested that they never deeply thought about how to construct one whole in a beneficial way for this task. This proclamation about the BMU was evidence of Participant 6 overcoming their perceived impasse and beginning their work in the Additional Attempt Phase of the 3PP.
In the Additional Attempt Phase of the 3PP, Participant 6 exclaimed that they “never did the BMU”, which expressed an intent to re-initiate their effort and re-enter the task (1 3PP point, Re-initiated Effort component). They re-sustained this effort (1 3PP point, Re-sustained Effort component) by drawing their BMU as nine Xs, thinking about one whole as 9/9, implying that one X represented 1/9. They continued attacking by redrawing the quantity 8/3 relative to this new representation of one whole. As they redrew 8/3, they said, “I have to draw this again because my BMU is different now”. They drew 24 Xs to represent 8/3 as 24/9. Then, Participant 6 started the multiplication. They said, “I need 2 2/3 of [24/9] now…I know that two copies of [24/9] is 24 Xs and 24 Xs”. They labeled this pair of 24 Xs as 2, implying that those 48 Xs represented two copies of 24/9, and drew 48 Xs to more clearly show two copies of 24/9. Next, they started work on finding 2/3 of 24/9. They pointed to their earlier drawing of 24/9, which was collectively three rows of 8 Xs, and said, “I need two-thirds or two rows”. They drew two additional rows of 8 Xs each under their drawing of 48 Xs and labeled those two rows as 2/3, implying that those 16 Xs represented two-thirds of 24/9. Altogether, Participant 6 had drawn 64 Xs to represent 2 2/3 of 24/9, or the product of 2 2/3 and 2 2/3. Lastly, Participant 6 wrote that 2 2/3 × 2 2/3 = 64 Xs but struggled to write a fraction that depicted those 64 Xs relative to the task situation. They said, “I know it’s 64 [in the numerator], but I’m not sure about [the denominator]”. At this point, Participant 6 decided to stop working. Technically, this implied another perceived impasse and an opportunity for Participant 6 to engage in another Additional Attempt Phase to reconcile the meaning of the denominator in this context. However, for this study, I only considered participants’ actions around one perceived impasse during their work on a challenging task. This concluded Participant 6’s work in the Additional Attempt Phase and concluded their efforts overall with Task 8. Despite their inability to completely solve the task, Participant 6’s new efforts certainly indicated additional mathematical progress toward a solution (1 3PP point, Outcome of Effort component) since they were able to represent the quantity 8/3 in a way that made it possible to partition it into three equal-sized parts in their discrete model. Thus, Participant 6 earned 6 3PP points on this task, which reflected a high-quality first attempt at solving the task and a high-quality second attempt at solving the task after an impasse. Participant 6’s work in the Additional Attempt Phase on Task 8 is shown in Figure 6.
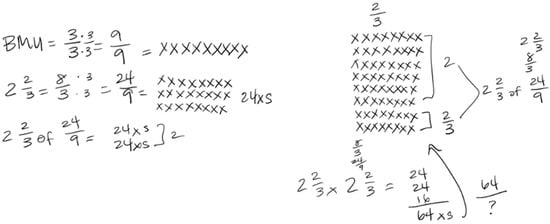
Figure 6.
Participant 6’s written work in the Additional Attempt Phase on Task 8.
In their problem-solving session reflection survey, Participant 6 clarified a few moments of their work on Task 8. Regarding their perceived impasse around finding two-thirds of 8/3, they wrote, “I got stuck again with finding 2/3… I remembered how to set up the BMU though, like we practiced, so that was good”. This indicated that Participant 6 indeed reached a perceived impasse by partitioning the eight pieces of 1/3 into three equal parts. However, they were able to overcome this impasse by thinking more deeply about what counts as one whole for this problem situation (the BMU), which was a heuristic they practiced during their previous lesson in class. Responding to a follow-up question about why they chose to represent one whole as 9/9 in the Additional Attempt Phase (instead of as 3/3, as they did in the Initial Attempt Phase), Participant 6 explained, “I knew I could write the BMU as any way I wanted as long as it was 1 so I tried 9/9 and it worked”. This indicated that Participant 6 understood that the construction of one whole is very important to the partitioning process in multiplication, yet perhaps they were not so intentional about choosing 9/9 as one whole for this task, which compelled the quantity of 8/3 to be redrawn as 24/9, using three times as many pieces and each piece being three times smaller, thus ensuring that the equivalent quantity could be equally partitioned into three equal parts. Still, Participant’s 6’s understanding of a general connection between constructing one whole and the partitioning process in multiplying fractions helped them continue to productively struggle with Task 8, after an impasse.
Overall, this descriptive example of Participant 6’s experiences across two problem-solving sessions shows some possible ways in which PSTs could improve their perseverance over time, as measured by the 3PP. Participant 6’s perceived impasses were similar with both Task 7 and Task 8, yet with Task 8 they were able to overcome their impasse and continue to persevere toward a solution. Participant 6’s experience with Task 8 suggested meaningful perseverance growth compared to their experience with Task 7, in part because they were able to leverage their experiences from class to apply a practiced heuristic to help them resist the urge to give up and overcome a time they felt substantially stuck.
5. Discussion and Conclusions
Elementary teachers must be able to empathize with and support their students to productively struggle to learn mathematics [4,52], yet we know very little about how teacher preparation programs help develop such perseverant practices in PSTs. In the context of a mathematics content course, this study investigated the relationship between the allocation of instructional time and perseverance growth in elementary PSTs. Importantly, after the first problem-solving session, participants in the control group exhibited a similar level of perseverance and success as those in the treatment group. In general, the results of this study showed that although both groups of PSTs significantly improved their perseverance over time, the rate of perseverance growth was significantly greater for the treatment group compared to the control group. This suggests that PSTs in the treatment group, who studied fewer mathematics topics for more time, inspired by a common manifestation of a thinking-oriented approach [14], experienced a learning environment that was more conducive to perseverance development compared to PSTs in the control group, who studied more mathematics topics for less time, inspired by a common manifestation of a knowledge-oriented approach [14]. This implies that instructional time matters on mathematics topics during content courses for PSTs to develop their perseverance in problem-solving, and that survey courses may not be as effective in developing mathematical practices like perseverance for future elementary teachers of mathematics.
This study offers a fresh perspective on scholarship related to a thinking-oriented approach to elementary mathematics teacher preparation [14]. By focusing on PST outcomes related to practices that support mathematical thinking (e.g., perseverance in problem-solving), this study complements other research that focused on PSTs’ knowledge development in similar settings. Collectively, these studies help inform a knowledge base about the benefits of allocating more time to fewer mathematics topics during elementary teacher preparation content courses. This research shows that not only do such course designs support future teachers in developing specialized content knowledge that they can remember and apply years later in their classrooms [47,48,49], but these course designs also support future teachers in developing important mathematical practices, like perseverance in problem-solving, which will aid them in empathizing with and supporting their future students to productively struggle to learn mathematics [4,52]. These collective findings challenge the knowledge-oriented approach to elementary mathematics teacher preparation [14], specifically those programs that utilize survey courses to prepare PSTs to teach K-8 mathematics.
This study also offers an important contribution to perseverance research in mathematics education. This study is the first of its kind to examine how elementary PSTs develop their perseverance in problem-solving, over time, as part of their mathematics content coursework. The findings of this study strengthen the claim that perseverance is indeed malleable and can be nurtured and developed in an appropriate learning environment [63]. The fact that PSTs in both the control group and treatment group experienced significant gains in their perseverance emphasizes the importance of exposure and opportunity for perseverance development. This aligns with other perseverance research that showed that students could improve their perseverance in problem-solving, over time, when they were consistently engaging with tasks that required perseverance [57,58,60,63,64,65,66,67,68,69,70,71,72,73].
However, the fact that PSTs in the treatment group were improving their perseverance at a significantly greater rate than PSTs in the control group indicates that the learning environment in the treatment group was more conducive to perseverance development in some ways. PSTs in the treatment group encountered more challenging tasks about the same mathematics topic compared to PSTs in the control group. This might mean that PSTs in the treatment group were better able to develop their heuristic knowledge during that extra time spent teaching mathematical topics, which could have aided in their perseverance development [57,70,73]. As depicted in the descriptive example, this might help explain Participant 6’s perseverance improvement across Tasks 7 and 8, considering that they were able to leverage the general heuristic of adjusting what counts as one whole, a heuristic they had encountered in class a few days prior, to help them overcome their perceived impasse in Task 8. That class was the second of three classes on the meaning of multiplication for the treatment group, and since the control group only had one class devoted to the meaning of multiplication, it is possible that a PST in the control group would not have encountered such a heuristic during their instructional time, and thus, such a heuristic would not be available to them during problem-solving sessions.
Limitations and Future Research
There were some limiting factors associated with this study. Although this study was motivated by the research studies out of the University of Delaware [47,48,49] and designed similarly, this study was conducted at a different institution and in a different teacher preparation program. Therefore, programmatic details that made the University of Delaware an ideal setting for research on PSTs’ time spent studying a topic and their related outcomes were not exactly present here. Although I made ample efforts to recreate those details to create a setting for this study in a similar way, the settings were not the same. Furthermore, the results presented in the studies by Morris and Hiebert [47], Hiebert et al. [48], and Corven et al. [49] followed graduates into the teaching field, enabling those researchers to make longitudinal claims about the impact of participants’ experiences in their teacher preparation program on their knowledge for teaching years later. This study was not longitudinal and the claims I made about perseverance growth pertain to PSTs’ experiences in one semester-long class. Future research should investigate if such perseverance improvements persist beyond PSTs’ experiences in their coursework.
Another limitation of this study was the sole focus on the development of just one mathematical practice that supports mathematical thinking: perseverance in problem-solving. Many mathematical practices act in intertwined ways. For instance, seeing and using mathematical structure can be imperative for mathematical modeling, and perseverance is essential to do both [72]. Since this study was the first of its kind, I chose to keep the outcome measures as simple as possible; however, future research should investigate how the development of PSTs’ other mathematical practices is influenced by instructional time during preparation coursework.
This study was also limited by the potential bias involved. As addressed in Section 3.4, I served as the sole instructor of both the treatment and control groups in this study, as well as the sole researcher. Although I did make concerted efforts to address bias, it is impossible to eliminate all subjectivities.
An additional limitation of this work was the lack of qualitative analysis. The quantitative results presented in this paper showed a significant relationship between class group and perseverance growth, but they do not explain the explicit details of why PSTs were improving in their perseverance so differently across classes. The descriptive example presented in Section 4.2 illustrated some possible ways in which many PSTs improved their perseverance, but this account is not research and is not meant to be representative of broad themes in the data. Future research should include a full qualitative investigation to uncover those details and tell the full story about the nature of the learning environments and their relationship with PSTs’ perseverance growth.
Funding
This research received no external funding.
Institutional Review Board Statement
The study was conducted in accordance with the Declaration of Helsinki, and approved by the Institutional Review Board (or Ethics Committee) of Montclair State University (protocol code: IRB-FY18-19-1294; date of approval: 9 November 2022).
Informed Consent Statement
Informed consent was obtained from all subjects involved in this study.
Data Availability Statement
The datasets presented in this article are not readily available because the data are part of an ongoing study. Requests to access the datasets should be directed to the corresponding author.
Acknowledgments
The author gratefully acknowledges Emily K. Miller for her statistics consulting work.
Conflicts of Interest
The author declares no conflicts of interest.
Appendix A
To obtain a sense of the common types of tasks with which PSTs productively struggled during their problem-solving sessions, some sample tasks are below.
Conceptions of Fractions: Suppose a set of 21 check marks represents How many check marks would represent ?
Division of Fractions: Use an area model to solve the following story problem. “Today, Tammy ran kilometers. Usually, she runs km. What part of her normal distance did she run today?” Be sure to show the actions of the operation in your diagram.
Ratios and Proportions: Use a double number line to solve the following story problem. “A 5-min shower requires about 17 gallons of water. How much water will you use for an 8-min shower?”
Area: Below is a rectangle and a domino unit. The rectangle is 5 dominoes long and 3 dominoes high. Explain why the number of dominoes that will cover the rectangle is not the product of .

Appendix B
Model 3 was created by extending Model 2 to add a random slope for group assignment. Model 3 was fitted as follows:
- Model 3:
In Model 3, is a random effect, specific to each participant, representing the difference between a participant’s growth rate by group and the overall slope, . The fitted equation for Model 3 is . While the fitted parameters in Model 3 are slightly different than those in Model 2, a likelihood ratio test showed that Model 3 was not a significantly better fit for the data than Model 2 (, ).
Model 4 was created by extending Model 2 to test for non-linear growth by adding a quadratic term. Model 4 was fitted as follows:
- Model 4:
However, the quadratic term in this model was not significant () and a likelihood ratio test comparing Model 4, the non-linear random slopes model, to Model 2, the linear random slopes model, was not significant (). Thus, Model 4 was not a significantly better fit for the data than Model 2.
Model 6 was created by extending Model 5 to include an interaction term with a random slope. Model 6 was meant to compare to Model 5 to ascertain the usefulness of the random slope for the interaction term. Model 6 was fitted as follows:
- Model 6:
In Model 6, is a random effect, specific to each participant, representing the difference between a participant’s growth rate by group*time and the overall slope, . When comparing Model 6, which included a random slope for the interaction term, to Model 5, which did not include a random slope for the interaction term, a likelihood ratio test was not significant (), indicating that the random slope for the interaction term was unnecessary. Thus, Model 6 was not a significantly better fit for the data than Model 5.
References
- Garner, B.; Munson, J.; Krause, G.; Bertolone-Smith, C.; Saclarides, E.S.; Vo, A.; Lee, H.S. The landscape of US elementary mathematics teacher education: Course requirements for mathematics content and methods. J. Math. Teach. Educ. 2023, 27, 1009–1037. [Google Scholar] [CrossRef]
- Masingila, J.O.; Olanoff, D. Who teaches mathematics content courses for prospective elementary teachers in the USA? Results of a second national survey. J. Math. Teach. Educ. 2022, 25, 385–401. [Google Scholar] [CrossRef]
- Saclarides, E.S.; Garner, B.; Krause, G.; Bertolone-Smith, C.; Munson, J. Design principles that support course design innovation for elementary mathematics methods courses. Math. Teach. Educ. 2022, 11, 9–25. [Google Scholar] [CrossRef]
- Association of Mathematics Teacher Educators. Standards for Preparing Teachers of Mathematics; Information Age Publishing: Charlotte, NC, USA, 2014. [Google Scholar]
- Hill, H.C.; Blunk, M.L.; Charalambous, C.Y.; Lewis, J.M.; Phelps, G.C.; Sleep, L.; Ball, D.L. Mathematical knowledge for teaching and the mathematical quality of instruction: An exploratory study. Cogn. Instr. 2008, 26, 430–511. [Google Scholar] [CrossRef]
- An, T.; Clark, D.L.; Lee, H.Y.; Miller, E.K.; Weiland, T. A discussion of programmatic differences within mathematics content courses for prospective elementary teachers. Math. Educ. 2021, 30, 52–70. [Google Scholar]
- Hrusa, N.A.; Much Islas, P.; Schneider, J.A.; Vega, I.J. Policies for teacher professionalization in Mexico’s education reform. In Empowering Teachers to Build a Better World: How Six Nations Support Teachers for 21st Century Education; Reimers, F.M., Ed.; Springer: Gateway East, Singapore, 2020; pp. 63–85. [Google Scholar] [CrossRef]
- Malzahn, K.A. 2018 NSSME+: Trends in U.S. Mathematics Education from 2012 to 2018; Horizon Research, Inc.: Chapel Hill, NC, USA, 2020. [Google Scholar]
- The National Center on Education and the Economy [NCEE]. Canada: Diversity and Decentralization; The National Center on Education and the Economy [NCEE]: Washington, DC, USA, 2016. [Google Scholar]
- Beilock, S.L.; Gunderson, E.A.; Ramirez, G.; Levine, S.C. Female teachers’ math anxiety affects girls’ math achievement. Proc. Natl. Acad. Sci. USA 2010, 107, 1860–1863. [Google Scholar] [CrossRef] [PubMed]
- Scheibling-Sève, C.; Pasquinelli, E.; Sander, E. Assessing conceptual knowledge through solving arithmetic word problems. Educ. Stud. Math. 2020, 103, 293–311. [Google Scholar] [CrossRef]
- Ball, D.L.; Thames, M.H.; Phelps, G. Content knowledge for teaching: What makes it special? J. Teach. Educ. 2008, 59, 389–407. [Google Scholar] [CrossRef]
- Stoehr, K.; Olson, A. Can I teach mathematics? A study of preservice teachers’ self-efficacy and mathematics anxiety. In Proceedings of the 37th Annual Meeting of the North American Chapter of the International Group for the Psychology of Mathematics Education; Bartell, T.G., Bieda, K.N., Putnam, R.T., Bradfield, K., Dominguez, H., Eds.; Michigan State University: East Lansing, MI, USA; pp. 948–951.
- Li, Y.; Howe, R.E. Toward a thinking-oriented training in mathematics for elementary school teachers. In Developing Mathematical Proficiency for Elementary Instruction; Li, Y., Howe, R.E., Lewis, W.J., Madden, J.J., Eds.; Springer: Cham, Switzerland, 2021; pp. 13–49. [Google Scholar] [CrossRef]
- Skemp, R.R. Relational understanding and instrumental understanding. Math. Teach. 1976, 77, 20–26. [Google Scholar]
- Hiebert, J.; Carpenter, T.P. Learning and teaching with understanding. In Handbook of Research on Mathematics Teaching and Learning; Grouws, D.A., Ed.; IAP: Cancun, Mexico, 1992; pp. 65–97. [Google Scholar]
- American Council on Education. To Touch the Future: Transforming the Way Teachers are Taught. An Action Agenda for College and University Presidents; American Council on Education: Washington, DC, USA, 1999. [Google Scholar]
- Cochran-Smith, M.; Villegas, A.M.; Abrams, L.; Chavez-Moreno, L.; Mills, T.; Stern, R. Critiquing teacher preparation research: An overview of the field, part II. J. Teach. Educ. 2015, 66, 109–121. [Google Scholar] [CrossRef]
- Ahn, S.; Choi, J. Teachers’ subject matter knowledge as a teacher qualification: A synthesis of the quantitative literature on students’ mathematics achievement [Paper presentation]. In Proceedings of the Annual Meeting of the American Educational Research Association, San Diego, CA, USA, 12–16 April 2004. [Google Scholar]
- Begle, E.G. Teacher Knowledge and Student Achievement in Algebra; School Mathematics Study Group Reports, No. 9; School Mathematics Study Group: Austin, TX, USA, 1972. [Google Scholar]
- Begle, E.G. Critical Variables in Mathematics Education: Findings from a Survey of the Empirical Literature; Mathematical Association of America: Washington, DC, USA; National Council of Teachers of Mathematics: Reston, VA, USA, 1979. [Google Scholar]
- Mewborn, D.A. Teachers content knowledge, teacher education, and their effects on the preparation of elementary teachers in the United States. Math. Educ. Res. J. 2001, 3, 28–36. [Google Scholar]
- Conference Board of the Mathematical Sciences. The Mathematical Education of Teachers II; American Mathematical Society: Providence, RI, USA; Mathematical Association of America: Washington, DC, USA, 2012. [Google Scholar] [CrossRef]
- Li, Y.; Howe, R.E. Developing pre-service teachers’ mathematics conceptual knowledge for teaching. In Proceedings of the 41st Conference of the IG-PME, Singapore; Kaur, B., Ho, W.K., Toh, T.L., Choy, B.H., Eds.; PME: Singapore, 2017; Volume 1, pp. 84–87. [Google Scholar]
- Li, Y.; Pang, J.S.; Zhang, H.; Song, N. Mathematics conceptual knowledge for teaching—Helping prospective teachers know mathematics well enough for teaching. In International Handbook of Mathematics Teacher Education: Knowledge, Beliefs and Identity in Mathematics Teaching and Teaching Development, 2nd ed.; Potari, D., Chapman, O., Eds.; Brill|Sense: Leiden, The Netherlands, 2019; Volume 1, pp. 77–104. [Google Scholar]
- National Council of Teachers of Mathematics (NCTM). Standards for Mathematics Teacher Preparation; National Council of Teachers of Mathematics (NCTM): Charlotte, NC, USA, 2020. [Google Scholar]
- Common Core State Standards Initiative. Common Core State Standards for Mathematical Practice; National Governors Association Center for Best Practices: Washington, DC, USA; the Council of Chief State School Officers: Washington, DC, USA, 2010. [Google Scholar]
- Li, Y.; Schoenfeld, A.H. Problematizing teaching and learning mathematics as “given” in STEM education. Int. J. STEM Educ. 2019, 6, 44. [Google Scholar] [CrossRef]
- Pólya, G. How to Solve It; Princeton University Press: Princeton, NJ, USA, 1945. [Google Scholar]
- Cuoco, A.; Goldenberg, E.P.; Mark, J. Habits of mind: An organizing principle for mathematics curricula. J. Math. Behav. 1996, 15, 375–402. [Google Scholar] [CrossRef]
- Jacobbe, T.; Millman, R.S. Mathematical habits of the mind for preservice teachers. Sch. Sci. Math. 2009, 109, 298–302. [Google Scholar] [CrossRef]
- Chapin, S.H.; Gibbons, L.K.; Feldman, Z.; Callis, L.K.; Salinas, A. The Elementary Mathematics Project: Supporting preservice teachers’ content knowledge for teaching mathematics. In Developing Mathematical Proficiency for Elementary Instruction; Li, Y., Howe, R.E., Lewis, W.J., Madden, J.J., Eds.; Springer: Cham, Switzerland, 2021; pp. 89–113. [Google Scholar] [CrossRef]
- Brown, B.W.; Saks, D.H. Measuring the effects of instructional time on student learning: Evidence from the Beginning Teacher Evaluation Study. Am. J. Educ. 1986, 94, 480–500. [Google Scholar] [CrossRef]
- Harnischfeger, A.; Wiley, D.E. The teaching–learning process in elementary schools: A synoptic view. Curric. Inq. 1976, 6, 5–43. [Google Scholar] [CrossRef]
- Stallings, J. Allocated academic learning time revisited, or beyond time on task. Educ. Res. 1980, 9, 11–16. [Google Scholar] [CrossRef]
- Travers, K.J. Overview of the longitudinal version of the Second International Mathematics Study. In The IEA Study of Mathematics III: Student Growth and Classroom Processes; Burstein, L., Ed.; Pergamon: İzmir, Turkey, 1992; pp. 1–14. [Google Scholar] [CrossRef]
- Gibbons, L.; Feldman, Z.; Chapin, S.; Batista, L.N.; Starks, R.; Vasquez-Aguilar, M. Facilitation practices in mathematics teacher education and the mathematical identities of preservice elementary teachers. Math. Teach. Educ. Dev. 2018, 20, 20–40. [Google Scholar]
- Beckmann, S.; Izsák, A. Focusing on mathematical structure and sensemaking in courses for future teachers. In Developing Mathematical Proficiency for Elementary Instruction; Li, Y., Howe, R.E., Lewis, W.J., Madden, J.J., Eds.; Springer: Cham, Switzerland, 2021; pp. 131–164. [Google Scholar] [CrossRef]
- Monk, D.H. Subject area preparation of secondary mathematics and science teachers and student achievement. Econ. Educ. Rev. 1994, 13, 125–145. [Google Scholar] [CrossRef]
- Rowan, B.; Correnti, R.; Miller, R.J. What Large-Scale, Survey Research Tells us About Teacher Effects on Student Achievement: Insights from the Prospectus Study of Elementary Schools; Consortium for Policy Research in Education: Philadelphia, PA, USA, 2002. [Google Scholar]
- Wayne, A.J.; Youngs, P. Teacher characteristics and student achievement gains: A review. Rev. Educ. Res. 2003, 73, 89–122. [Google Scholar] [CrossRef]
- U.S. Department of Education. Foundations for Success: The Final Report of the National Mathematics Advisory Panel; U.S. Department of Education: Washington, DC, USA, 2008.
- Hill, H.C.; Schilling, S.G.; Ball, D.L. Developing measures of teachers’ mathematics knowledge for teaching. Elem. Sch. J. 2004, 105, 11–30. [Google Scholar] [CrossRef]
- Copur-Gencturk, Y. The effects of changes in mathematical knowledge on teaching: A longitudinal study of teachers’ knowledge and instruction. J. Res. Math. Educ. 2015, 46, 280–330. [Google Scholar] [CrossRef]
- Swars, S.; Hart, L.C.; Smith, S.Z.; Smith, M.E.; Tolar, T. A longitudinal study of elementary pre-service teachers’ mathematics beliefs and content knowledge. Sch. Sci. Math. 2007, 107, 325–335. [Google Scholar] [CrossRef]
- Hiebert, J.; Wieman, R.M.; Berk, D. Designing systems for continuously improving instruction: The case of teacher preparation mathematics courses. In Teachers, Teaching, and Reform: Perspectives on Efforts to Improve Educational Outcomes; Ferretti, R.P., Hiebert, J., Eds.; Routledge: Oxfordshire, UK, 2018; pp. 116–139. [Google Scholar] [CrossRef]
- Morris, A.K.; Hiebert, J. Effects of teacher preparation courses: Do graduates use what they learned to plan mathematics lessons? Am. Educ. Res. J. 2017, 54, 524–567. [Google Scholar] [CrossRef]
- Hiebert, J.; Berk, D.; Miller, E.; Gallivan, H.; Meikle, E. Relationships between opportunity to learn mathematics in teacher preparation and graduates’ knowledge for teaching mathematics. J. Res. Math. Educ. 2019, 50, 23–50. [Google Scholar] [CrossRef]
- Corven, J.; DiNapoli, J.; Willoughby, L.; Hiebert, J. Long-term relationships between mathematics instructional time during teacher preparation and specialized content knowledge. J. Res. Math. Educ. 2022, 53, 277–306. [Google Scholar] [CrossRef]
- Bryk, A.S. 2014 AERA distinguished lecture: Accelerating how we learn to improve. Educ. Res. 2015, 44, 467–477. [Google Scholar] [CrossRef]
- von Glasersfeld, E. Piaget’s constructivist theory of knowing. In Radical Constructivism: A Way of Knowing and Learning; Falmer Press: London, UK, 1995; pp. 53–75. [Google Scholar]
- Hiebert, J.; Grouws, D.A. The effects of classroom mathematics teaching on students’ learning. Second. Handb. Res. Math. Teach. Learn. 2007, 1, 371–404. [Google Scholar]
- Mason, J.; Burton, L.; Stacey, K. Thinking Mathematically, 2nd ed; Pearson Education Limited: London, UK, 2010. [Google Scholar]
- Morris, A.K. Using “lack of fidelity” to improve teaching. Math. Teach. Educ. 2012, 1, 71–101. [Google Scholar] [CrossRef]
- Suppa, S. Supporting Novice Mathematics Teacher Educators to Teach Ambitiously Via Continuously Improved Curriculum Materials. Doctoral Dissertation, University of Delaware, UDSpace, Newark, NJ, USA, 2018. [Google Scholar]
- Muir, T. Let’s Talk About Scripted Curriculum and Trusting Teachers (No. 5) [Audio podcast episode]. The Epic Classroom Podcast. Trevor Muir Productions, 21 February 2022. [Google Scholar]
- DiNapoli, J.; Miller, E.K. Recognizing, supporting, and improving student perseverance in mathematical problem-solving: The role of conceptual thinking scaffolds. J. Math. Beh. 2022, 66, 1–20. [Google Scholar] [CrossRef]
- Middleton, J.A.; Tallman, M.; Hatfield, N.; Davis, O. Taking the Severe Out of Perseverance: Strategies for Building Mathematical Determination; Spencer: New York, NY, USA, 2015. [Google Scholar]
- Paurowski, M.; Glassmeyer, D.; Kim, J.; Id-Deen, L. Struggling as part of success: International Baccalaureate students’ productive struggle is strongly correlated to mathematical achievement. Int. J. Math. Educ. Sci. Technol. 2024, 1–18. [Google Scholar] [CrossRef]
- Warshauer, H.K. Productive struggle in middle school mathematics classrooms. J. Math. Teach. Educ. 2014, 18, 375–400. [Google Scholar] [CrossRef]
- National Council of Teachers of Mathematics. Principles to Actions: Ensuring Mathematical Success for All; National Council of Teachers of Mathematics: Reston, VA, USA, 2014. [Google Scholar]
- National Council of Teachers of Mathematics. Catalyzing Change in High School Mathematics; National Council of Teachers of Mathematics: Reston, VA, USA, 2018. [Google Scholar]
- DiNapoli, J. Persevering toward what? Investigating the relationship between ninth-grade students’ achievement goals and perseverant actions on an algebraic task. Int. Elec. J. Math. Ed. 2019, 14, 435–453. [Google Scholar] [CrossRef][Green Version]
- DiNapoli, J.; Morales, H., Jr. Translanguaging to persevere is key for Latinx bilinguals’ mathematical success. J. Urb. Math. Ed. 2022, 14, 71–104. [Google Scholar] [CrossRef]
- DiNapoli, J.; Amenya, M.; Van Den Einde, L.; Delson, N.; Cowan, E. Simulating remote support for mathematical perseverance through a digital sketching application. J. High. Ed. Thy. Prac. 2021, 21, 41–52. [Google Scholar] [CrossRef]
- Daniel, A.; DiNapoli, J. Investigating pedagogies in undergraduate precalculus and their relationships to students’ attitudes towards mathematics and perseverance in problem-solving. J. Res. Sci. Math. Tech. Ed. 2024, 7, 43–59. [Google Scholar] [CrossRef]
- DiNapoli, J.; Marzocchi, A.S. Productive struggle: What we can learn from working with pre-service teachers. ComMuniCator 2017, 41, 10–13. [Google Scholar]
- DiNapoli, J. Distinguishing between grit, persistence, and perseverance for learning mathematics with understanding. Ed. Sci. 2023, 13, 402. [Google Scholar] [CrossRef]
- Barnes, A. Perseverance in mathematical reasoning: The role of children’s conative focus in the productive interplay between cognition and affect. Res. Math. Educ. 2019, 21, 271–294. [Google Scholar] [CrossRef]
- Schoenfeld, A.H. Explicit heuristic training as a variable in problem-solving performance. J. Res. Math. Educ. Res. 1979, 10, 173–187. [Google Scholar]
- Kapur, M. Productive failure. Cogn. Instr. 2008, 26, 379–424. [Google Scholar]
- Bass, H.; Ball, D.L. Beyond “You Can Do It!”: Developing Mathematical Perseverance in Elementary School; Spencer: New York, NY, USA, 2015. [Google Scholar]
- Koichu, B.; Berman, A.; Moore, M. Heuristic literacy development and its relation to mathematical achievements of middle school students. Instr. Sci. 2007, 35, 99–139. [Google Scholar]
- Elliot, A.J. Approach and avoidance motivation and achievement goals. Educ. Psychol. 1999, 34, 149–169. [Google Scholar] [CrossRef]
- Patten, M.L. Understanding Research Methods: An Overview of the Essentials; Routledge: Oxfordshire, UK, 2016. [Google Scholar] [CrossRef]
- Ross, W. Feeling Stumped: Investigating Dimensions of Impasse. PsyArXiv 2021. [Google Scholar] [CrossRef]
- VanLehn, K.; Siler, S.; Murray, C.; Yamauchi, T.; Baggett, W. Why do only some events cause learning during human tutoring? Cogn. Instr. 2003, 21, 209–249. [Google Scholar]
- Ericsson, K.A.; Simon, H. Protocol Analysis: Verbal Reports as Data; MIT Press: Cambridge, MA, USA, 1993. [Google Scholar]
- Schon, D.A. The Reflective Practitioner: How Professionals Think in Action; Basic Books: New York, NY, USA, 1983. [Google Scholar]
- Peshkin, A. In search of subjectivity—One’s own. Educ. Res. 1988, 17, 17–21. [Google Scholar] [CrossRef]
Disclaimer/Publisher’s Note: The statements, opinions and data contained in all publications are solely those of the individual author(s) and contributor(s) and not of MDPI and/or the editor(s). MDPI and/or the editor(s) disclaim responsibility for any injury to people or property resulting from any ideas, methods, instructions or products referred to in the content. |
© 2024 by the author. Licensee MDPI, Basel, Switzerland. This article is an open access article distributed under the terms and conditions of the Creative Commons Attribution (CC BY) license (https://creativecommons.org/licenses/by/4.0/).