Abstract
The research aims to examine and evaluate the accounting information disclosure (AID) quality of the non-current tangible assets in the annual financial statements of private sector entities of Lithuania and identify characteristics of these enterprises that have an impact on the AID quality. The research model of the AID quality in the financial statements is created. Based on the national accounting standards’ legal requirements, the original checklists were structured, and the disclosure quality indexes (DQIs) allowing evaluation of AID (both mandatory and voluntary) quality were formed. The empirical results show that Lithuanian enterprises’ AID quality was sufficient and average during the investigation period. The significant AID quality change was not observed during the short term (2007–2008), i.e., when Lithuania was going through a significant change in the economy, where the rapid growth was followed by the financial crisis. In addition, it was investigated whether significant changes were observed during the long term (2007–2016) when Lithuania was transforming from a developing to a developed country. The results show that during this period the disclosure of mandatory (for all enterprises) and voluntary information did not change significantly, while additional (for large and medium) AID quality increased. Multiple panel regression analysis showed that the enterprise’s characteristics (such as its size, debt-paying capacity, indebtedness, tangible assets, and profitability) appeared to have a statistically significant effect on the AID quality. The research findings could contribute to helping shareholders, potential investors or creditors, financial analysts, and other stakeholders when making decisions in regard to the evaluation of the AID quality as well as helping regulators to increase standards for information transparency and comparability.
Keywords:
accounting information disclosure quality; disclosure quality index; non-current tangible assets; financial reporting; private sector JEL Classification:
H83; M41; M48
1. Introduction
Organisations must provide adequate, truthful, and timely information to stakeholders to make reasonable decisions, i.e., disclose the accounting information. In the words of Nguyen et al. (2020), this accounting information disclosure should be understood as “a way to implement the transparent process of enterprises to ensure that shareholders and the investors can access information fairly and simultaneously”.
The information asymmetry problem and agency conflicts increase the need for accounting information disclosure, which should mitigate these problems (Healy and Palepu 2001; Graham et al. 2005; Lambert et al. 2007; Hassan et al. 2009; Hassan and Marston 2010). Raised accounting information disclosure impacts on the finance of an enterprise, i.e., it should reduce the uncertainty about the future performance of the enterprise and the rate of return required by investors as well as raising the value of the enterprise (Brammer and Millington 2006; Hassan et al. 2009; Hassan and Marston 2010; Hassan 2018). Furthermore, it should increase stock liquidity, as stated by Hassan (2018), “investors are more likely to buy stocks they are familiar with, which increases the liquidity of more visible stocks”. This view is supported by empirical research (e.g., Grullon et al. 2004; Barber and Odean 2008; Keloharju et al. 2012). Based on this approach, we have to consider the issue of the accounting information disclosure quality (hereinafter referred to as AID quality) as the quality of accounting information presented in annual financial statements “influences investors’ and other stakeholders’ decisions by mitigating information and incentive problems, as explained in agency theory” (Healy and Palepu 2001; Pivac et al. 2017). As Leung et al. (2015) state, it should be noted that “as a crucial input to corporate governance, transparency and accountability, financial reporting quality has been a focus of attention for investors, regulators and the broader community”.
According to researchers (Hassan et al. 2008), different interpretations have been discussed on the meaning of quality financial information. Burgstahler et al. (2006) agree with this point of view and emphasise that “accounting quality is a broad concept with multiple dimensions”. When analysing the financial reporting quality (FRQ) interpretations, several opinions of scientists can be distinguished. As the main characteristics, various dimensions of financial reporting quality are distinguished by different authors. Further, some examples are provided. (1) Researchers (Peek et al. 2010; Guo et al. 2020; Penman and Zhang 2002; Martínez-Ferrero 2014; Hope et al. 2013) have focused on the conservatism dimension of accounting quality, i.e., “the timeliness of the recognition of economic income in accounting income” (Hassan et al. 2008). (2) Another dimension of accounting quality applied in research (Burgstahler et al. 2006; Lang et al. 2003; Almarayeh et al. 2020; Martínez-Ferrero 2014; Barth et al. 2008) is the level of earnings management (also called earnings quality). The researchers examine the enterprise incentives to report earnings that reflect economic performance (Burgstahler et al. 2006). (3) The third dimension of research (Martínez-Ferrero 2014; Hope et al. 2013) is an investigation into quality based on the level of accruals (also called accruals quality). These research dimensions could be valuated as quantitative methods because they are based on measures constructed from items of the main financial statements: (i) Statement of financial position; (ii) statement of profit or loss; and (iii) statement of cash flows. (4) Measurement of the level of compliance with the accounting standards (also called disclosure quality) is the fourth method of research that could be evaluated as a qualitative–quantitative method. We will discuss it in greater detail. As stated by Renkas et al. (2015), the FRQ is a structured display of the company’s financial state and financial performance that can be regarded as a set of components: (i) Financial information presentation quality; (ii) financial information quality. According to this researcher, the financial information presentation quality is realised through the form and structure of financial reporting, whereas the evaluation of the quality of accounting information disclosure may only be possible in terms of the notes to the financial statements (Renkas et al. 2015; Hassan et al. 2008). As Hassan et al. (2008) highlight, “full disclosure relates to the provision of all information necessary for decision-making, thereby providing reasonable assurance that investors are not misled”. In this context, it can be stated that notes are important for financial statement users as the quality of this financial statement determines what is appropriate, “explaining amounts disclosed in other financial statements and disclosing additional material information that is not presented in such other financial statements” (BAS 1 2015). Having considered the above-mentioned arguments, the fourth research dimension has been chosen for the study.
Having analysed the existing research, the AID quality research can be distinguished to take several directions. Firstly, researchers have explored the issue of the AID quality both in public (e.g., Steccolini 2004; Falkman and Tagesson 2008; Stanley et al. 2008; Martani and Lestiani 2012; Adi et al. 2016; Moreno-Enguix et al. 2019) and private sectors. Secondly, by investigating private-sector research in more detail, both theoretical (e.g., Hellman et al. 2018) and empirical (e.g., Hellstrom 2009; Andre et al. 2018) types of research can be distinguished. Thirdly, Mamun and Kamardin (2014) and Hellman et al. (2018) agree that the research studies can be divided into two groups: The research in both developed countries (e.g., Street and Bryant 2000 (in the United States); Street and Gray 2002 (in the United States, Switzerland, France, Germany, etc.); Chalmers and Godfrey 2004 (in Australia); Hellstrom 2009 (in the Czech Republic); Leung et al. 2015 (in Hong Kong); Holder et al. 2016 (in the United States); Andre et al. 2018 (in the UK, Switzerland, Germany, Finland, Portugal, etc.); Mnif and Znazen 2020 (in Canada)), and developing/emerging countries (e.g., Barako et al. 2006 (in Kenya); Wang et al. 2008 (in China); Hassan et al. 2009 (in Malaysia); Nandi and Ghosh 2013 (in India); Pivac et al. 2017 (in Croatia, Montenegro, Romania, Serbia, and Slovenia); Wang 2017 (in Taiwan); Dey et al. 2018 (in Bangladesh); Rep et al. 2019 (in Croatia)). Fourthly, according to Hellman et al. (2018), the studies that analysed the level of compliance with national accounting standards or IAS/IFRS mandatory disclosures can be divided into three categories: “studies of (i) the general level of disclosure compliance in a country” (e.g., Hassan et al. 2009; Barako et al. 2006; Wang et al. 2008; Nandi and Ghosh 2013; Leung et al. 2015; Holder et al. 2016; Dey et al. 2018; Wang 2017; Mnif and Znazen 2020), (ii) “the level of disclosure compliance in a specific area in a country or a region” (e.g., Chalmers and Godfrey 2004; Ebrahim and Fattah 2015; Devalle et al. 2016; Rep et al. 2019), and (iii) “studies of disclosure compliance in a number of countries sharing some similarities” (e.g., Street and Bryant 2000; Street and Gray 2002; Pivac et al. 2017; Andre et al. 2018; Dilling and Caykoylu 2019). Fifth, as a separate group, research for comparing accounting quality in listed (or public) and unlisted (or private) enterprises should be distinguished (e.g., Street and Bryant 2000; Burgstahler et al. 2006; Hope et al. 2013). The conducted research has shown that not only does the financial ratios differ between listed (or public) and unlisted (or private) enterprises (e.g., “privately held companies tend to have larger cash reserves than publicly traded firms” (Hall et al. 2014); “the cost of equity for a private firm is higher <...> than for a public firm” (Abudy et al. 2016)), but also the financial reporting quality (FRQ). For instance, in the United States, “public firms have higher accrual quality and are more conservative” (Hope et al. 2013); however, the European “private firms exhibit higher levels of earnings management” (Burgstahler et al. 2006). Researchers (Peek et al. 2010) consider “the relationship between timeliness demands and the importance of accounting information to shareholders and creditors” in Western European countries and show “that creditors’ but not investors’ reporting demands explain the public versus the private firm difference in asymmetric timeliness”. Street and Bryant (2000) have investigated the level of disclosure for enterprises (i) with U.S. listings, (ii) U.S. filings, and (iii) without U.S. listings or filings, and the following conclusion has been drawn: “the overall level of disclosure is greater for companies with U.S. listings”. In order to not underestimate the fact that “transparent presentation of information in annual reports is especially important for listed companies” (Pivac et al. 2017), it is also necessary to analyse the AID quality of unlisted enterprises. Sixth, a large number of studies have analysed the listed enterprises. It should be noted that unlisted enterprises are investigated insufficiently.
Finally, having performed a theoretical analysis of the prior empirical research, Hellman et al. (2018) emphasise that although the level of disclosure compliance in developed countries is high, that of developing/emerging countries is, however, relatively low. Thus, as mentioned above, the following conclusion could be drawn: The low AID quality does not ensure the main objective of financial statements “to provide information about the financial position, financial performance and cash flows of an entity that is useful to a wide range of users in making economic decisions” (International Financial Reporting Standards (IFRSs) 2008). Therefore, AID quality research remains significant and needs to be further developed.
In summary, it can be stated that the research usually analyses listed, large-scale, audited enterprises applying international accounting standards. However, AID quality research of unlisted enterprises, which generally apply national accounting standards, are insufficient. Therefore, these enterprises are selected as the subject of this research.
The question of the AID quality in the Lithuanian private sector is relevant according to two aspects. On the one hand, since 2004, after the Accounting Reform, accounting management has been changed significantly. The Business Accounting Standards (BASs) have been introduced, which are employed to enhance the presentation quality of the financial statements of the private sector enterprises. It should be noted that the structure and the scope of financial statements have changed again in Lithuania since 2016. The financial statements formed according to these standards would help the users of financial information to reach more reasonable economic decisions dealing with the distribution of resources. Moreover, the transparency indicators of the financial statements would increase. Nevertheless, this objective can be reached only if the information presented in the financial statements meets the requirements laid down in the standards. On the other hand, it is noticed that the research of the AID quality in the Lithuanian private sector is insufficient.
It is also necessary to consider two aspects. Firstly, in classifying the research by the disclosed information, the research could be divided into those intended to investigate voluntary and mandatory disclosures. As stated by Hassan et al. (2009), Mamun and Kamardin (2014), and Hellman et al. (2018), most of the prior research has focused on voluntary disclosure, as well as making an incorrect assumption about the mandatory disclosure that “companies fully comply with regulated disclosures” (Mazzi et al. 2017). Therefore, the research analyses both mandatory and voluntary disclosures.
Secondly, in the prior research, the AID quality has been analysed in the following specific areas: Business combination and goodwill (e.g., Mazzi et al. 2017), financial instruments and risk reporting (e.g., Chalmers and Godfrey 2004; Hassan et al. 2008; Moumen et al. 2015; Dey et al. 2018), intangible assets, and intellectual capital (e.g., Andre et al. 2018; Rep et al. 2019). The majority of assets in enterprises are non-current1 tangible assets; however, these assets are investigated insufficiently. Therefore, this type of asset is selected to analyse the issue of AID quality.
In summary, as stated above, the research studies are conducted in both developed and developing/emerging countries. The case of Lithuania is interesting because this country goes through the developing/emerging and developed country phase. The researchers emphasise that although the level of disclosure compliance in developed countries is high, that of developing/emerging countries, however, it is relatively low. Thus, using the case of Lithuania, it would be possible to assess and compare the AID quality level at different phases of the country’s economic development. Therefore, the annual financial statements of the private sector enterprises of Lithuania over the time period of 2007–2008 and 2016 have been selected for the analysis of this research.
The aim of the research is to examine and evaluate the accounting information disclosure quality (hereinafter referred to as AID quality) of the non-current tangible assets (hereinafter referred to as tangible assets) in the annual financial statements of the private sector enterprises of Lithuania and identify these enterprise’s characteristics that have an impact on the AID quality.
To fulfil this aim, the following objectives have been set. Firstly, to design the research model of the AID quality in the financial statements of private sector profit-oriented entities (hereinafter referred to as enterprises). Secondly, in accordance with the designed disclosure quality index (hereinafter referred to as DQI), to evaluate and compare the AID quality of the tangible assets in the annual financial statements of enterprises of Lithuania. Thirdly, to identify specific factors (enterprise’s characteristics) that have an impact on the AID quality.
The contributions of this paper are summarised as follows. Firstly, we propose the original and comprehensive research model of the AID quality in the financial statements. This model is used to identify the research object and its characteristics at the level of (i) an entity, (ii) the financial statements, and (iii) an element of financial statements. (2) Furthermore, (i) based on the legal and regulatory requirements, three different original checklists are structured for the assessment of the accounting information disclosure (AID) quality of the non-current tangible assets in the annual financial statements of the enterprises of Lithuania; and (ii) three indexes (DQIs) allowing evaluation of AID (both mandatory and voluntary) quality are formed.
This model could contribute to further theoretical research in accounting information disclosure (AID) quality. Moreover, these results could be of interest to the following users of enterprises financial statements. The created checklists and the disclosure quality indices (DQIs) allow for identifying the non-compliance to the regulatory requirements in the enterprise financial statements, which may be of importance to standard setters when developing disclosure requirements in the future. Moreover, the formed checklists and indices (DQIs) can be used by shareholders, investors, or creditors when making decisions regarding the evaluation of accounting information disclosure (AID) quality of the non-current tangible assets in the annual financial statements.
Secondly, the results show that Lithuanian enterprises’ AID quality was sufficient and average in the investigation period. The difference between DQIs values in the short term (2007–2008) is not statistically significant. It means that a significant AID quality change is not observed during the short term. In the case of Lithuania, it is worth noting that although Lithuania has undergone a significant change during the mentioned period (i.e., though in 2007 the economy was still growing very fast, in 2008, the financial crisis started), the AID quality did not decrease. However, this change may occur in the long term. Furthermore, we investigated whether significant changes were observed during the long term (2007–2016) when Lithuania was transforming from a developing to a developed country. The results show that during this period the disclosure of mandatory (for all enterprises) and voluntary information did not change significantly, while additional (for large and medium) AID quality increased.
Thirdly, the multiple panel regression analysis shows that enterprise characteristics (such as size of enterprise, enterprise debt-paying capacity, enterprise indebtedness, enterprise tangible assets, and profitability of enterprise) appeared to have a statistically significant effect on the AID quality. The research findings could be used by potential investors, financial analysts, and other stakeholders to determine the impact of enterprise characteristics on AID quality, and by regulators to increase standards for information transparency and comparability.
The rest of the paper is organised as follows. Section 2 describes the requirements of financial reporting and regulation in Lithuania. Section 3 describes the methodology of research, i.e., data, variables, and methods. Section 4 provides the empirical results and discussion. Finally, the concluding remarks are presented.
2. Financial Reporting and Regulation in Lithuania
2.1. Financial Reporting Regulation in the Private Sector in Lithuania
After the Restoration of the Independence of the Republic of Lithuania in 1990, many changes have occurred in the field of accounting. However, until 2004, the main focus in Lithuania was placed on calculating and declaring taxes, though no emphasis was given to the company’s financial position in the accounts. Since the entry of the National Accounting Standards (more precisely, Business Accounting Standards (BASs)) in 2004 (which are drafted based on the European Union Law and International Accounting Standards), the financial accounting regulation has fundamentally changed in Lithuania. Accounting has become much more complicated, requiring a very high level of accountant qualifications to prepare financial statements correctly. This change has also caused additional difficulties for such a complicated business system, as well as for Lithuania’s entrepreneurial development.
Following this reform of the accounting and financial reporting system in the private sector of Lithuania, the accounting regulation in Lithuania is conducted on several levels. The first level of regulation is the Accounting Law of the Republic of Lithuania, valid for all economic entities (both private and public). The Law governs the accounting of assets, equity, funding sums, and liabilities of legal persons <…>, as well as the organisation and handling of accounting thereof (Article 1, Accounting Law of the Republic of Lithuania). The second level of regulation accounts for the legislation for the preparation of annual financial statements. In the private sector, this is the Law of the Republic of Lithuania on Financial Reporting by Undertakings (adopted on 6 November 2001). The third level of regulation is the standards specifying financial accounting content and accounting policies, whereas in the private sector, these are the Business Accounting Standards (BASs) or the International Financial Reporting Standards (IFRSs). Economic entities, whose securities are traded on a regulated market and who are obligated to compile consolidated financial statements, handle their accounting to ensure the compilation of consolidated financial statements according to the International Accounting Standards (Article 3 of Accounting Law of the Republic of Lithuania). The Nasdaq Vilnius Stock Exchange is usually chosen by Lithuanian companies listing shares on the stock exchange. The requirements of this stock exchange regarding the choice of standards are even stricter, i.e., if the company seeks to trade its shares on the Nasdaq Vilnius stock exchange, “the financial statements for the past reporting years must be drafted according to international accounting standards, with consideration of any exceptions envisaged in laws of the Republic of Lithuania regulating financial accounting” (The Listing Rules of AB Nasdaq Vilnius). Thus, in order to draft financial statements, listed companies in Lithuania apply the International Financial Reporting Standards (IFRSs) and most unlisted companies apply the Business Accounting Standards (BASs).
The system of financial accounting was developed on the assumption that “small- and medium-sized enterprises do not differ significantly from large companies and should follow similar accounting requirements” (Kanapickiene and Spicas 2019). However, at the beginning of the 21st century, this point of view has changed. Accordingly, the structure of financial statements has changed in Lithuania again since 2016.
On the one hand, Lithuanian normative documents (specifically BASs) indicate that if there is no specific requirement, an enterprise shall apply an accounting policy that ensures that the information in financial statements: (1) Is valuable to their users, (2) is neutral, (3) is complete in all material respects, and (4) presents fairly the entity’s financial position, performance, and cash flows.
On the other hand, private sector enterprises are subject to strict standards. The following requirements confirm it. Firstly, the financial reporting forms provided by BASs are mandatory, i.e., according to BAS 1, enterprises may not, in their sole discretion, change the established forms of financial statements, add other titles of items, insert new or delete existing items, or regroup them, even if the amounts stated in them are equal to zero. Secondly, notes (i) shall present information required by BASs and are related to the enterprise’s performance and (ii) “shall explain the material amounts of financial statements and reasons for their changes”.
In this study, we focus on the presentation of both mandatory (i.e., disclosures required by the accounting standards in the financial statements) and voluntary disclosures.
2.2. Requirements for Presenting Tangible Assets in Financial Statements
To examine and evaluate the AID quality in the annual financial statements of the private sector enterprises of Lithuania, the tangible assets are selected as the element of financial statements. Therefore, the requirements for presenting tangible assets in financial statements are discussed briefly below. It should be noted that national accounting standards have been prepared following IFRS. However, they are not identical to IFRS. Hence, it is appropriate to highlight the differences between international and national accounting standards.
In accounting, the definition of assets is the fundamental requirement when a particular object is recognised as assets. According to the International Accounting Standard 16 “Property, Plant and Equipment” (IAS 16), “property, plant and equipment are tangible items that (a) are held for use in the production or supply of goods or services, for rental to others, or administrative purposes; and (b) are expected to be used during more than one period”. On the other hand, in the national accounting standard (BAS 12), the definition of non-current tangible assets is augmented by one more requirement, i.e., the acquisition cost is equal to at least the minimum cost of non-current tangible assets established by the entity. An item of the tangible assets “that qualifies for recognition as an asset shall be measured at its cost” (IAS 16, Paragraph 122; BAS 12 formulates this requirement in principle the same way as Article 11 does). It should be noted that the capitalisation of borrowing costs is one of the most significant differences between the requirements of national and international standards in determining the acquisition cost of tangible assets, i.e., according to IAS 16, an enterprise “shall capitalise borrowing costs that are directly attributable to the acquisition or construction of a qualifying asset as part of the cost of that asset”. However, according to BAS 12, an enterprise “shall recognise borrowing costs as an expense in the period in which it incurs them”.
Different selections are possible regarding the usage accounting of tangible assets. An enterprise shall (a) estimate the useful life of assets or the depreciation rates used; (b) determine the residual value; (c) select the depreciation methods used. The IASs provide that a variety of depreciation methods can be used. These methods include the straight-line method, the diminishing balance method, and the units of production method. The BAS 12 specifies one more depreciation method, i.e., sum-of-years’-digits method. (d) Moreover, the enterprise shall determine the frequency of the reviews of the residual value and the useful life of an asset. In accordance with IAS, “the residual value and the useful life of an asset shall be reviewed at least at each financial year”.
After the initial recognition as an asset, an enterprise shall select the tangible assets measurement model. According to IAS 16 and BAS 12, an item of the tangible assets shall be carried using either the cost model or the revaluation model. It means that, after recognition as an asset, an item of the tangible asset shall be carried at its cost (or a revalued amount if the revaluation model is used) “less any accumulated depreciation and any accumulated impairment losses”. If an enterprise chooses the revaluation model, it should revalue the asset. According to IASs, revaluations shall be made with sufficient regularity. The BASs are stricter than IASs: They shall be carried out “at least once in five years”.
According to IAS 40 and BAS 12, investment property is distinguished as a separate class of non-current tangible assets (land or a building, or part of a building, or both) that are “held to earn rentals or for capital appreciation or both”. Initially, investment property shall be measured at its cost. After recognition, an enterprise shall choose (as its accounting policy) either the cost model or the fair value model.
Finally, if a non-current tangible asset no longer meets the requirements for its attribution to such assets, it shall be derecognised.
3. Methodology
During the research, the analysis of the annual financial statements was carried out with the objective to assess the AID quality of the non-current tangible assets in the annual financial statements of the private sector entities of Lithuania.
3.1. Data
First of all, in order to organise the research, the sampling, the investigated period, the data sources, and the sample size were determined.
3.1.1. Sampling and the Data Sources
The research analyses the annual financial statements of the unlisted enterprises of Lithuania. The sample of enterprises was formed in a few stages:
First, to reach the aim of the research, i.e., to examine and evaluate the AID quality in the annual financial statements, the notes, i.e., one of the financial statements, were analysed. However, the lower requirements for financial statements of micro-enterprises are established in the Law on Financial Statements of Entities of the Republic of Lithuania. Article 20 of this Law provides that micro-enterprises “can omit drawing up notes and then the set of their financial statements shall consist of the following financial statements: (i) short balance sheet and (ii) short profit and loss account”.
In this research, a micro-enterprise is understood as it is defined by the Law on Financial Statements of Entities of the Republic of Lithuania, i.e., an enterprise that has “at least two indicators of which do not exceed the following amounts on the last day of a financial year: (i) the value of assets on the balance sheet—EUR 350,000; (ii) net sales revenue during a reporting financial year—EUR 700,000; (iii) the average annual number of payroll employees during a reporting financial year—10 employees” (Article 4, Law on Financial Statements of Entities of the Republic of Lithuania). Hence, the research should analyse the small, medium, and large enterprises. Thus, the surveyed enterprises were selected from the list of business leaders TOP 500 (for 2007), i.e., the largest Lithuanian enterprises by sales revenue, published by the leading Lithuanian business newspaper “Verslo žinios” (English: “Business News”).
Second, the research analyses the annual financial statements of the unlisted enterprises of Lithuania that use national accounting standards, i.e., BASs. Therefore, the following companies were removed from this list: (i) Listed companies; (ii) companies providing financial services; (iii) companies that use accounting standards other than BASs, and (iv) companies that are not required to prepare financial statements, such as sole proprietorships, limited partnerships, and partnerships in Lithuania that are required to present financial statements only if specified in their instruments of incorporation. Thus, by the legal form, the sample of Lithuanian enterprises consists of public or private limited enterprises. In this way, the list of business leaders was reduced to 463 enterprises.
Third, the sample must exclude enterprises that have ceased or otherwise restricted their activities before 2016. Therefore, an additional requirement was imposed on the selection of enterprises. The enterprise must be in the list of TOP500 in both 2007 and 2016 or remain in the list of TOP1000. However, in Lithuania, the TOP500 list has been changing significantly, i.e., during this period, only 231 enterprises remained in the TOP500 list (46% of the 2007 TOP500); 75 enterprises dropped to the TOP501–1000 positions (15% of the 2007 TOP500). In this way, the list of business leaders was reduced to 306 enterprises. In terms of enterprise size, these enterprises were classified as follows: Large and medium-sized enterprises account for 82% of the total, while small enterprises account for the remaining part. This classification of enterprises was also followed in the sample of the surveyed enterprises.
Fourth, in order for the survey to be representative of the country’s enterprises, the selected enterprises must be classified by economic activities in a way that corresponds to this classification in the country.
As it was mentioned above, the survey does not analyse micro-enterprises as they do not prepare notes. As we see, the size of the enterprises is defined by three parameters: Assets, annual sales revenue, and the number of employees. Meanwhile, the Department of Statistics of the Republic of Lithuania details enterprises only by the number of employees, i.e., an enterprise is considered micro as with less than 10 employees. Hence, in this research, the enterprises with more than ten employees represent the group of small, medium, and large enterprises.
According to the data of the Department of Statistics of the Republic of Lithuania, the enterprises in operation at the beginning of 2016 in Lithuania with more than ten employees carried out the economic activities (measured by sales revenue) in the following sections: 28% of total revenue was generated in Manufacturing (C section); 3% in Electricity, gas, steam, and air conditioning supply (D); 6% in Construction (F); 40% in Wholesale and retail trade; repair of motor vehicles and motorcycles (G); 11% in Transportation and storage (H); 3% in Information and communication activities (J).
This revenue distribution must be maintained in the sample. As mentioned in Stage 3, the enterprises in the sample must maintain the classification of enterprises by the size of the enterprise. According to these requirements, the sample is formed.
It should be also mentioned that the accounting information provided in the set of financial statements cannot be a commercial secret. However, in practice, the unlisted enterprises do not publish the annual financial statements on their websites. According to the Civil Code of the Republic of Lithuania, companies submit a set of annual financial statements to the State Enterprise Centre of Registers every year within thirty days of their approval. Although administrative liability may be imposed for non-submission, only about 50% of legal entities (which were required to submit reports) submit financial statements to the Centre of Registers. These objective conditions limit access to the data of unlisted enterprises for research purposes. Consequently, for this research, the data of the Lithuanian enterprises’ financial statements were provided by the State Enterprise Centre of Registers and a credit bureau Creditinfo Lietuva. If, after selecting an enterprise in the sample, its financial statements were not available, the enterprise was removed from the sample, and the fourth selection stage was repeated.
Finally, subject to the criteria mentioned above and data availability, the sample was formed, and the financial statements data of 37 enterprises were analysed. It should also be noted that the sample size was limited by the methods used in the research: The content method chosen to determine the AID quality, i.e., the qualitative research method.
In order to examine the dynamics of DQI and its factors properly with regard to time, panel data models allowing the use of a greater volume of data are chosen. In this instance, the variation within a selected group of enterprises as well as the dynamics in the period of 2007–2008 and 2016 were examined. Thus, a single group consisting of 111 observations (37 enterprises × 3 years) allows for obtaining reliable results of the statistical analysis.
3.1.2. The Investigated Period
The investigated period is the period over which the financial data were analysed. The research includes the analysis of enterprises’ financial data of three years, i.e., 2007, 2008, and 2016. The assumptions of the selection of the investigated period are the following.
First, due to the selected period of 2007–2008, the National Accounting Standards started to be applied from 2004. Three years are considered to be a sufficient period of time for the accountants to be sufficiently familiar with the new accounting standards and to be sufficiently qualified to prepare sets of financial statements in accordance with the requirements of the accounting standards. Secondly, due to the selected period of 2016, not only the structure of financial statements but also the amount of the disclosed information has changed in Lithuania again since 2016. Therefore, the impact of regulatory changes on the quality of disclosures is examined. Third, the aim is to assess (i) whether the AID quality of enterprises is likely to change significantly in the short term (2007–2008) or in the long term (2008–2016) and (ii) which enterprise’s characteristics may affect the observed significant changes.
The period chosen is also interesting for the following economic reasons. First, according to (Kiyak et al. 2011), the Lithuanian economy grew very rapidly in 2002–2007. Lithuania’s economic growth began to slow down and fell sharply in the fourth quarter of 2008 (this continued for 6 consecutive quarters). In 2008–2010, the Lithuanian economy went through a complex financial crisis, which operated both domestically (the bursting of the real estate bubble) and externally (the ongoing global financial crisis). For these reasons, it becomes important to assess whether the AID quality of enterprises changed in 2008 (when business faced a crisis) compared to 2007 (when it was observed the “record corporate profits earned in 2007” (Bank of Lithuania 2008)). The relevance of this issue is particularly acute at a time when business is facing a crisis caused by the COVID-19 pandemic. Secondly, Lithuania from a developing country has become a developed country. (i) In 2007, Lithuania was considered a developing country. (ii) According to the World Bank (World Bank 2019), since 2012, Lithuania’s economy has been classified as one of the “high-income economies”. According to the International Monetary Fund (IMF 2011), since 2015, Lithuania’s economy has been classified as one of the “advanced economies”. Moreover, Lithuania became the latest country to join the euro area in 2015. Hence, in 2016, Lithuania’s economy is considered as one of the developed economies. In this way, we can compare the AID quality of enterprises when a country has been developing and has reached the level of a developed country.
3.2. The Dependent Variable: Accounting Information Disclosure Quality
In particular, it is reasonable to discuss the design of the accounting information disclosure quality (hereinafter referred to as AID quality) research model. AID quality is a variable that is difficult to measure directly. This problem is solved using the disclosure index, that is, according to Beattie et al. (2004), “a fairly objective, form-oriented content-analytic method”. It should be noted that the research model of the AID quality in the private sector profit-oriented entities’ (hereinafter referred to as enterprises) financial statements used in this article is the specification of the authors’ designed (Kanapickienė and Keliuotytė-Staniulėnienė 2019) research model of the AID quality in the financial statements targeted on the public sector entities (municipalities).
The research model of the AID quality in the enterprise’s financial statements consists of two stages (Figure 1): (A) Identification of the research object and its characteristics and (B) the assessment of the element of financial statements AID quality.
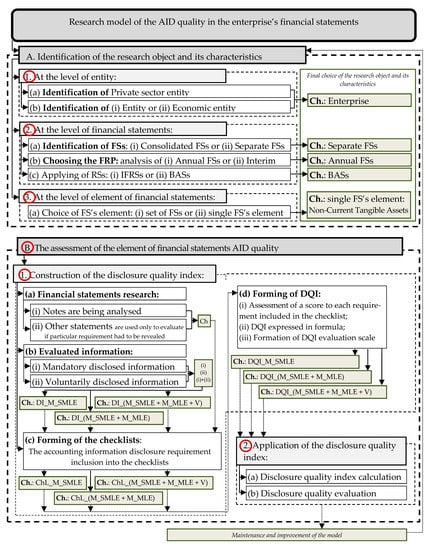
Figure 1.
Research model of the accounting information disclosure (AID) quality in the enterprise’s financial statements. Abbreviations used: Ch.—Choice; FS—Financial statement; FRP—Financial reporting period; RS—Report standard; IFRSs—International Financial Reporting Standards; BASs—Business Accounting Standards; DQI—Disclosure quality index. DI_M_SMLE—Mandatory disclosed information required for all—small, medium, and large—enterprises; DI_(M_SMLE+ M_MLE)—(a) Mandatory disclosed information required for all—small, medium, and (b) additional disclosed information required for medium, and large enterprises; DI_(M_SMLE + M_MLE + V)—(a) Mandatory disclosed information required for all—small, medium, (b) additional disclosed information required for medium, and large enterprises, and (c) voluntary disclosed information; ChL_M_SMLE—checklist formed by (a) mandatory disclosed information required for all—small, medium, and large—enterprises; ChL_(M_SMLE+ M_MLE)—checklist formed by (a) mandatory disclosed information required for all—small, medium, and large—enterprises, and (b) additional disclosed information required for medium, and large enterprises; ChL_(M_SMLE + M_MLE + V)—checklist formed by (a) mandatory disclosed information required for all—small, medium, and large—enterprises, (b) additional disclosed information required for medium, and large enterprises, and (c) voluntary disclosed information; DQI_M_SMLE—disclosure quality index (DQI) formed by mandatory disclosed information required for all—small, medium, and large—enterprises; DQI_(M_SMLE + M_MLE)—disclosure quality index (DQI) formed by (a) mandatory disclosed information required for all—small, medium, and large—enterprises, and (b) additional disclosed information required for medium, and large enterprises; DQI_(M_SMLE + M_MLE + V)—disclosure quality index (DQI) formed by (a) mandatory disclosed information required for all—small, medium, and large—enterprises, (b) additional disclosed information required for medium, and large enterprises, and (c) voluntary disclosed information. Source: created by the authors.
In the first stage, the identification of the research object and its characteristics is carried out at the level (1) of an entity, (2) of financial statements, and (3) of an element of financial statements. To construct and apply the disclosure quality index in the enterprise’s financial statements, the following selections are made. (1) By identification of a private sector entity, the essential selection is made, i.e., in this research, the private sector profit-oriented entity (hereinafter referred to as an enterprise) is chosen. (2) To identify the main characteristics of financial statements, (a) having considered the possibility to choose between the consolidated financial statements or separate financial statements, it is decided to analyse the separate financial statements. (b) The opportunity to select either annual or interim financial statements is analysed, and the annual financial statements are selected. (c) It is considered that accounting standards, according to which the annual financial statements are prepared, will be analysed. In the private sector, the financial reports can be prepared according to either International Financial Reporting Standards (IFRSs) or National Accounting Standards (NASs)—in the case of Lithuania—Business Accounting Standards (BASs). The entities followed by Business Accounting Standards (BASs) are selected. (3) For the identification of the researched element of financial statements, two possibilities are considered, i.e., to evaluate the AID quality either of the whole set of financial statements or of its single elements. In this research, tangible assets are selected as the researched element of financial statements.
To sum up, the annual financial statements of the Lithuanian enterprises are selected for analysis as the private sector profit-oriented entities. Moreover, the enterprises prepare the annual financial statements using the BASs. In this research, tangible assets are selected as the element of financial statements.
In the second stage, the assessment process of the element of financial statements AID quality is investigated. The method of the disclosure index is used to measure the AID quality.
In the research literature (Ingram 1984; Robbins and Austin 1986; Street and Bryant 2000; Gordon et al. 2002; Giroux and McLelland 2003; Beattie et al. 2004; Chalmers and Godfrey 2004; Hassan et al. 2008; Hassan et al. 2009; Hellstrom 2009; Fischer et al. 2010; Hassan and Marston 2010; Mamun and Kamardin 2014; Abdullah et al. 2015; Leung et al. 2015; Adi et al. 2016; Ali and Saidin 2016; Houcine 2017; Pivac et al. 2017; Andre et al. 2018; Rep et al. 2019; Nguyen et al. 2020), the method of the disclosure index is used widely.
The stage of this assessment process can be broken down into two sub-stages including (1) construction and (2) application of the disclosure quality index (hereinafter referred to as DQI).
The sub-stage of the construction of the DQI involves (a) the financial statements research, (b) the evaluated information, (c) the forming of the checklist, and (d) the forming of the DQI, which will be discussed in detail.
(a) Financial statements research is made to determine what financial statements are used in AID quality research. The previous research has shown that the AID quality is evaluated (i) by analysing the notes, i.e., one of the financial statements, which, in accordance with the International Accounting Standard 1 (TAS 1) “Presentation of Financial Statements” (International Financial Reporting Standards (IFRSs) 2008), comprise “significant accounting policies and other explanatory information” whereas (ii) other financial statements are used only to the extent necessary to evaluate whether a certain requirement should have been disclosed.
(b) In the AID quality research, evaluated information, which is disclosed in the annual financial statements of enterprises, can be mandatory or voluntary.
Definition of the mandatory disclosed information is highlighted in scientific papers. Abdullah et al. (2015) determine that “mandatory disclosure is the minimum information which promulgated regulation requires from a reporting entity”. According to Andre et al. (2018), “the rationale for this reporting approach is that this kind of disclosures assists users of the financial statements to understand a company’s underlying economics and how their values are measured and change from year to year”.
Mandatory disclosed information in notes is described in the TAS 1 as follows (International Financial Reporting Standards (IFRSs) 2008): “Notes contain information in addition to that presented in the statement of financial position, statement(s) of profit or loss and other comprehensive income, a separate statement of comprehensive income (if presented), statement of changes in equity and statement of cash flows. Notes provide narrative descriptions or disaggregations of items presented in those statements and information about items that do not qualify for recognition in those statements”. Usually, accounting standards indicate the list of mandatory disclosed information.
In paragraph 122 of the TAS 1 (International Financial Reporting Standards (IFRSs) 2008), the informational requirements for notes are described in detail: The notes shall: (a) “present information about the basis of preparation of the financial statements and the specific accounting policies used in accordance with paragraphs” referred”; (b) “disclose the information required by IFRSs that is not presented elsewhere in the financial statements”; and (c) “provide information that is not presented elsewhere in the financial statements, but is relevant to an understanding of any of them”. In the case of Lithuania, according to BAS 6 (Business Accounting Standards (BASs)), (a) the notes provide the information on the enterprise’s operations required by BAS 6 and explain the material amounts of the financial statements and the reasons for the changes. (BAS 6, Article 15); (b) the section of the notes for the accounting policies discloses the information about accounting policies applied by the entity, which affected the data of the financial statements, and is likely to influence the decisions of the users of information of the financial statements (BAS 6, Article 19); and (c) explanatory notes should include the information required by BAS 6 that discloses the nature of the enterprise’s operations, financial position, financial performance, and cash flows and is not provided in other financial statements (BAS 6, Article 20).
Hellman et al. (2018) evaluated the benefits of the mandatory disclosure and emphasise that “imposing mandatory disclosure requirements is done to ensure that companies with incentives to avoid disclosure will still provide a minimum level of information, i.e., comply with the mandatory disclosure requirements”. Furthermore, the researchers (Hellman et al. 2018) point out that “entities, auditors and regulators might previously have interpreted ‘shall be disclosed’ as a mandatory requirement to disclose the item referred to (when applicable)”. However, in 2014, the revised version of International Accounting Standard 1 (hereinafter referred to as IAS) adopted the idea that “an entity need not provide a specific disclosure required by an IFRS if the information resulting from that disclosure is not material” (International Financial Reporting Standards (IFRSs) 2008). Furthermore, this requirement has been transposed in the national accounting standards, i.e., BAS 6, Article 18. Hence, “an entity does not have to disclose the ‘shall be disclosed’ information if that information would not be material” (Hellman et al. 2018). Thus, in the future, it becomes appropriate to revise interpretations of the definition of “mandatory disclosed information”.
Furthermore, “companies would provide disclosures even if they were not required to, and they do provide voluntary disclosures beyond regulatory requirements” (Hellman et al. 2018).
In prior research (Hassan and Marston 2010; Pivac et al. 2017), it was indicated that the “disclosure index could include mandatory items of information and/or voluntary items of information”. In this research, the DQIs include both mandatory and voluntary information.
(c) The third phase of the construction of the AID quality index is the forming of the checklists.
According to Pivac et al. (2017), “disclosure indexes are commonly based on a text analysis” conducted through an a priori defined checklist. In this research, the original checklists are structured to evaluate the AID quality of the tangible assets in the annual financial statements of the private sector entities (enterprises) of Lithuania. This method of research is chosen since (i) the AID quality of tangible assets in private sector entities (enterprises) of Lithuania is investigated for the first time, while the checklists to evaluate the AID quality were not produced in previous research. (ii) Information on tangible assets, which is mandatory to be disclosed in BASs (in particular in BAS 6), differentiates from the required information in IFRSs (in particular in IAS 16 “Property, plant and equipment”). Hence, there is no possibility to use indexes previously compiled in other countries.
This research examines how the non-current tangible assets presented in the statement of financial position are detailed in notes. Three checklists are formed, which will be discussed in detail.
First, we will discuss the assumptions about why it is appropriate to make several different checklists. In accordance with the BASs (specifically BAS 6), the notes shall present information in order to provide a fairer understanding of the information contained “in other financial statements and to disclose additional material information excluded from such other statements”. Having conducted the theoretical analysis of the BASs (standards), three levels of information that could be included in the notes might be distinguished. Firstly, the BAS 6 establishes the general requirements for small, medium, and large enterprises for (a) the contents of notes and (b) the explanatory notes. Hence, the standard contains a list of specific requirements and describes them as minimum requirements. Secondly, the explanatory notes for medium, large, and public-interest enterprises must provide the additional information required by the standard BAS 6, i.e., this additional information is mandatory for medium, large, and public-interest enterprises, whereas for small enterprises, this additional information is optional, provided voluntarily.
Based on the above-mentioned information, a checklist is created to analyse the information that all enterprises—small, medium, and large—shall disclose, i.e., mandatory disclosed information for all—small, medium, and large—enterprises (hereinafter referred to as DI_M_SMLE). This checklist is given the abbreviation ChL_M_SMLE.
Appendix A (Table A1) presents the checklist ChL_M_SMLE formed by information required by the BAS 6. The checklist consists of 22 requirements for the financial year 2016 (compared to the 16 requirements for the financial year 2008), which are divided into two groups: (1) Accounting policies of assets and its change (2 requirements) and (2) change of the carrying amount of an asset during the reporting period (20 requirements for the financial year 2016 and 14 requirements for the financial year 2008). It should be noted that this group is divided into two sub-groups including change of the carrying amount of (a) an asset presented in financial statements at the acquisition cost or revalued amount, as well as investment property presented in financial statements at the acquisition cost, and (b) investment property presented in financial statements at the fair value.
The second checklist is created from the information that should be disclosed by medium, large, and public-interest enterprises. Thus, this checklist includes (i) the information that shall be disclosed by all enterprises—small, medium, and large (DI_M_SMLE), and (ii) the additional information that shall be disclosed by medium, large, and public-interest enterprises (hereinafter referred to as ADI_M_MLE); it should be noted that this disclosure is voluntary for small enterprises. Thus, the checklist in question contains mandatory requirements for medium and large enterprises (hereinafter referred to as DI_(M_SMLE + M_MLE). The checklist in question is given the following abbreviation: ChL_(M_SMLE + M_MLE).
Appendix A (Table A2) presents the checklist ChL_(M_SMLE + M_MLE) formed by information required by the BAS 6. The checklist consists of 11 requirements, which are divided into three groups: (1) Accounting policies of assets and its change (5 requirements), (2) change of the carrying amount of an asset during the reporting period (it is worth noting that in the checklist ChL_M_SMLE this group is analysed in detail, i.e., 20 requirements for the financial year 2016 and 14 requirements for the financial year 2008, whereas in this checklist, this group is evaluated as one summarised indicator), and (3) other information disclosed (5 requirements). As it is shown in Appendix A (Table A2), information ADI_M_MLE contains 8 requirements.
The third checklist (see Appendix A (Table A3)) not only includes (i) mandatory disclosed information (i.e., the information that shall be disclosed by all enterprises—small, medium, and large (DI_M_SMLE) and (ii) additional information, which shall be disclosed by medium, large, and public-interest enterprises (ADI_M_MLE), but also (iii) voluntarily disclosed information (referred to as DI_V). The checklist in question is given the following abbreviation: ChL_(M_SMLE + M_MLE + V). In comparison with the checklist ChL_(M_SMLE + M_MLE) (Appendix A (Table A2)), the checklist ChL_(M_SMLE + M_MLE + V) (see Appendix A (Table A3)) additionally includes 4 voluntary disclosures, which is further discussed in detail.
(i) Presentation of the definition of non-current tangible assets in notes (item G0.1). According to IAS 16, “Property, plant and equipment are tangible items that: (a) are held for use in the production or supply of goods or services, for rental to others, or for administrative purposes; and (b) are expected to be used during more than one period”. Whereas in accordance with the national accounting standard (BAS 12), the definition of non-current tangible assets is augmented by one more requirement, i.e., the acquisition cost is equal to at least the minimum cost of non-current tangible assets established by the entity.
(ii) Presentation of the recognition criteria of non-current tangible assets in notes (item G0.2). In addition, Article 7 of BAS 12 provides two additional conditions: (1) “the entity can reliably measure the acquisition cost of the asset”, (2) “risk related to tangible asset has been transferred to the entity”. This is consistent with the discussion generated in the scientific literature (Bullen and Crook 2005) that one of the issues to be discussed in accounting theory and practice is the possible insufficiency of the content of the definition of assets in terms of recognition of resources as assets, i.e., it is necessary to identify additional criteria for the conformity of assets to non-current tangible assets. Therefore, it becomes important to clarify the criteria according to which enterprises recognise non-current tangible assets and whether it is declared in the notes.
As these requirements (G0.1 and G0.2) are not required by BASs (standards), the disclosure of this information is considered voluntary.
(iii) Asset recognition methods (item G1.1). Tangible assets “are recorded in accounting at their acquisition cost” (BAS 12, Article 11), therefore the enterprise shall establish a methodology for calculating this cost. For example, this methodology should (i) discuss in detail the potential additional costs that are added to the purchase price (BAS 12, Article 12); (ii) in the case the assets are produced independently, the cost that will constitute the production cost (BAS 12, Article 16). Disclosure of asset recognition methods in the notes is not a mandatory requirement and is therefore considered voluntary.
(iv) Presentation of the residual value of an asset in notes (item G1.6). In the accounting of the non-current tangible assets’ exploitation, an enterprise selects the residual value (BAS 12, Article 57). BAS 12 declares that “the residual value is estimated by an entity”. The aforementioned disclosure is also voluntary.
(d) The fourth phase of the construction of the AID quality index is the forming of disclosure quality index (DQI). It involves the following: (i) Assessment of a score to each requirement included in the checklist, (ii) the DQI expressed in the formula, and (iii) the formation of the scale of the DQI evaluation.
(i) To assess a score to each requirement included in the checklist, in accordance with the scientific literature, the weights of the items included in the index can be equal (Street and Bryant 2000; Hassan et al. 2008) or differ (Pivac et al. 2017). In this research, considering that every disclosure is equally important, the AID quality appertaining to an unweighted index has been assessed. A score of “one” is given to the disclosed requirement, and “zero”—otherwise.
In the research, a problem-solving approach (Kanapickienė and Keliuotytė-Staniulėnienė 2019) is used to provide the criteria in notes, which are not followed by zero meaning (which confirms that the scope of the researched criterion during the reporting period equals zero) or a hyphen (which confirms that during the reporting period an enterprise did not have any assets); however, to leave the cell empty, without inserted data, is regarded as the refusal to present any specific information.
The accounting policies provided in the notes are considered analogically unless specified that there are no changes in the mandatory disclosures during the investigated period; then, the information is considered not disclosed regarding the research criterion.
(ii) The DQI is expressed in the formula following the viewpoint of Street and Bryant (2000) and Pivac et al. (2017). The researchers claim that “the total disclosure index is measured as the sum of scores awarded to a particular entity in a particular year divided by the maximum number of applicable items (in order not to penalise entities for disclosing clearly non-applicable items of information)”.
The DQI of an enterprise is computed by the following equation:
where ADS is the actual disclosure score of an enterprise, N is the number of disclosed elements, n—of non-applicable elements, and consequently (N − n) is the number of applicable elements.
The ADS used in Equation (1) is calculated as follows:
where xi is the score of i component of the DQI (i = 1 to N) (a score of 1 is assigned to the disclosed requirement, and 0—otherwise), and, as mentioned above, N is the number of disclosed elements.
(iii) Finally, in the formation of the DQI evaluation scale, it is considered to use the DQI rating scale by Pivac et al. (2017). This means that the DQI should be interpreted in the following way: (i) DQI = 0: no information is disclosed, (ii) 0 < DQI ≤ 20: AID quality is poor, (iii) 20 < DQI ≤ 40: AID quality is low, (iv) 40 < DQI ≤ 60: AID quality is average, (v) 60 < DQI ≤ 80: AID quality is sufficient, (vi) 80 < DQI ≤ 100 AID quality is high, and (vii) DQI = 100: information is fully disclosed.
Finally, it is necessary to point out that in this research three DQIs are formed:
- DQI_M_SMLE—disclosure quality index (DQI) formed by mandatory disclosed information required for all—small, medium, and large—enterprises;
- DQI_(M_SMLE + M_MLE)—disclosure quality index (DQI) formed by (a) mandatory disclosed information required for all—small, medium, and large—enterprises, and (b) additional disclosed information required for medium, and large enterprises;
- DQI_(M_SMLE + M_MLE + V)—disclosure quality index (DQI) formed by (a) mandatory disclosed information required for all—small, medium, and large—enterprises, (b) additional disclosed information required for medium, and large enterprises, and (c) voluntarily disclosed information.
The second stage of the assessment of the element of financial statements AID quality—the process of the DQI application—involves two key sub-steps (Figure 1), the realisation results of which are defined in Section 4. It is also worth mentioning that the maintenance and improvement of the model must be realised, which would ensure the feedback on the model.
In this research, the evaluation of the AID quality using the disclosure quality indexes consists of four stages. The first stage is the evaluation of the AID quality according to disclosure quality indexes (DQI1, DQI2, and DQI3) components (including the correlation between DQI components). The second stage is the trend analysis of the enterprises DQIs of the investigated period (including using the DQI rating scale). The third stage is the analysis of the results of the descriptive statistics. Finally, to answer the research question R1, concerning whether the AID quality increased statistically significant during the investigated period, statistical tests are used. In order to verify that data are drawn from a normally distributed population, the choice of a statistical test is needed. Regarding a small sample, the key tests for the assessment of normality include the test introduced by Shapiro–Wilk. The null hypothesis (H0) states that the data come from a normally distributed population. When the result of the Shapiro–Wilk’s test is significant (p < α = 0.05, α—the level of significance), rejecting the null hypothesis means rejecting the assumption of normality for the distribution. Therefore, DQI is explored with a non-parametric Wilcoxon signed-ranks test. If the assumption of normality is valid, the paired-samples t-test is used.
3.3. The Independent Variable and Development of Hypotheses
To explain accounting practice, the research is based on several theories, which we will briefly discuss.
Agency theory is based on the self-interest of the agents and the principals. An agency problem exists both in the public and private sectors. Therefore, based on this theory, accounting disclosure decisions are explained both in the public sector organisations (e.g., Zimmerman 1977; Giroux and McLelland 2003; Laswad et al. 2005; Falkman and Tagesson 2008; Garcia and Garcia-Garcia 2010; Ali and Saidin 2016) and in the private sector enterprises (e.g., Healy and Palepu 2001; Hassan et al. 2009; Hellstrom 2009; Abdullah et al. 2015; Fonseka et al. 2019).
As stated in the literature, in the private sector, the agency problem arises as principals (such as shareholders or investors of an enterprise) typically do not intend to participate in business management and that responsibility is delegated to the agents (such as managers of an enterprise). Therefore, when principals invest their resources or funds in a business, the agents have an incentive to make decisions in the best interest of principals. However, self-interested agents might make decisions that are useful only for them. On the other hand, according to the information asymmetry theory (Healy and Palepu 2001; Hassan et al. 2009; Mamun and Kamardin 2014; Abdullah et al. 2015; Leung et al. 2015; Hassan 2018), usually, principals are not involved in the enterprise management. Therefore, agents have access to higher-level information compared to principals, which, in turn, leads to an information asymmetry problem. Hence, as Abdullah et al. (2015) and Fonseka et al. (2019) have highlighted, the situation might arise when agents (managers) have incentives to withhold information in their own rather than the principals’ (shareholders’) interest (moral hazard). As a result, according to Hellstrom (2009), “the information asymmetry between the different types of investors may lead to low liquidity of company’s shares since the uninformed investors will be unwilling to trade under such circumstances”.
The concept of agency and information asymmetry theories are the background of positive accounting theory. As emphasised by researchers (Falkman and Tagesson 2008), “accounting has the function of producing information for decision-makers”. Therefore, according to Hellstrom (2009), the selection of accounting principles becomes particularly important as “using different accounting principles will lead to different financial results even if the underlying activities are the same”; moreover, as Falkman and Tagesson (2008) have highlighted, the selection and applying of accounting methods depend on “the relative power between agents and principals”. Consequently, Dey et al. (2018) have argued that “disclosure is seen as a monitoring mechanism in agency theory”.
Another theory that is used to explain the disclosure issue is legitimacy theory that evolves “a social contract between the organisation and society” (Dilling and Caykoylu 2019). This theory predicted that, as Chalmers and Godfrey (2004) state, “organisations react to demands of diverse groups with responses aimed to legitimise their actions”, and, according to Baber (1983) (as cited by Susbiyani et al. (2014)), “organisation will continue work to ensure that the organisation operates within the frame and norms that exist in community or environment in which the organisation was and continues to ensure that activities of the organisation accepted by stakeholders as legitimate”. Gabrini (2013) discusses an issue when disclosure is analysed as “a mechanism used by organisations to manage legitimacy”, where “legitimacy is affected more through voluntary actions”, however, the mandatory disclosure has “little influence over perceptions of legitimacy held by stakeholders”. Consequently, disclosure can be understood as a communication tool in order to inform stakeholders about the financial position and the performance of the organisation, which ensures the legitimacy of the organisation’s activities.
The signalling theory explains how, through information disclosure, an enterprise “sends a signal to the market to reduce information asymmetry, minimize financing costs, and increase company value” (Dilling and Caykoylu 2019). According to this theory, as Pivac et al. (2017) have claimed, “voluntary disclosure signals the management’s desire to disclose its superior performance to external parties, because it will enhance the reputation of the company and its position in the market”. Lastly, political cost theory emphasises that enterprises that gained political visibility in the market “tend to increase disclosure as a means of mitigating potential political costs” (Dey et al. 2018).
Accounting disclosure decisions are explained based on these theories. In order to improve understanding of the information contained in financial statements for financial statement users, enterprises disclose additional information in the notes. On the one hand, it increases the quality of the information in other financial statements. On the other hand, when relevant items are not disclosed properly, the value of information to financial statement users reduces. As a financial consequence, according to Hellstrom (2009), “the lack of information negatively affects the efficient allocation of resources in the capital markets”, i.e., “investors experience uncertainty about the enterprise value and potential risks” and accordingly the cost of capital increases, and the value of the enterprise decreases. Furthermore, the liquidity of shares might lower, whereas “the uninformed investors will be unwilling to trade under such circumstances”. To summarise, agency conflicts and information asymmetry increase the demand for proper disclosure.
The information gap between uninformed and informed financial statement users might be filled in a number of ways, by disclosing mandatory or voluntary information. The first alternative is the disclosure requirements by the standard-setters. The researchers (Healy and Palepu 2001; Hellstrom 2009) support that mandatory disclosure enhances the credibility of management disclosure. As previous studies showed (Zimmerman 1977; Adi et al. 2016), another alternative is the voluntary disclosure, i.e., “information provided by company management which is not compulsory according to the accounting regulation in a respective country” (Hellstrom 2009), making “more private information as public” (Evan and Sridhar 1996 (as cited by Mamun and Kamardin 2014)). According to the signalling theory, as Pivac et al. (2017) have stated, voluntary disclosure supports the most profitable enterprises to provide the market with more and better information.
In summary, in this research, independent variable selection is explained using these theories.
3.3.1. Size of Enterprise
Researchers focused on disclosure issue in the public sector (e.g., Garcia and Garcia-Garcia 2010; Ali and Saidin 2016; Moreno-Enguix et al. 2019) and the private sector (e.g., Street and Bryant 2000; Street and Gray 2002; Chalmers and Godfrey 2004; Barako et al. 2006; Hassan et al. 2008; Hellstrom 2009; Hassan and Marston 2010; Houcine 2017; Hellman et al. 2018) have been discussing that the size of an entity is considered as one of the explanatory variables that is related to disclosure policy and accounting practices.
The issue that large enterprises tend to disclose more financial information than smaller enterprises (Riahi-Belkaoui 2001; Ali et al. 2004; Hassan et al. 2008; Hellstrom 2009; Hellman et al. 2018) is considered to be based on different theories. According to the agency theory, this dependence might exist due to (a) large enterprise tending to bear lower costs of the (i) processing (Hassan et al. 2008) and (ii) accumulation of information (Singhvi and Desai (1971) (as cited by Hassan et al. (2008)); (b) it has (i) more marketable securities and (ii) greater ease of financing (Singhvi and Desai (1971) (as cited by Hassan et al. (2008); Hall et al. 2014). Hellstrom (2009) has supported this approach and stated that the complexity of operations, as well as the costs for gathering and reporting financial information, might explain a different level of disclosure between large and small enterprises. Consequently, according to Dey et al. (2018) and Hellman et al. (2018), agency theory claims that larger enterprises have higher information asymmetry between agents (managers) and principals (owners); hence, agency’s costs increase. To reduce these costs, larger enterprises disclose more information than smaller enterprises. As Gabrini (2013) has implied, one of the factors related to the theory of legitimacy is the visibility that is determined by the size of the entity. According to the political cost theory, larger enterprises tend to provide greater transparency to reduce political costs (Hassan et al. 2008; Dey et al. 2018).
According to researchers (Ahmed and Courtis (1999) (as cited by Barako et al. (2006)); Wang et al. (2008), studies conducted at the end of the last century demonstrated that the size of enterprise has a significant impact on the disclosure level. Furthermore, current research has shown mixed results. (i) One group of researchers (e.g., Barako et al. 2006; Nandi and Ghosh 2013; Dilling and Caykoylu 2019; Rep et al. 2019) has supported that the size of an enterprise is positively related to high disclosure quality or disclosure level. The analysis of current research studies carried out by Dilling and Caykoylu (2019) has shown the same result. (ii) Other researchers (Street and Bryant (2000); Street and Gray 2002) have indicated that the size of an enterprise is not related to the disclosure level. Based on these arguments, the first hypothesis is formulated:
Hypothesis 1 (H1).
Size of enterprise is significantly positively related to the level of the accounting information disclosure quality (AID quality).
Different units of measurement are selected by researchers to measure the size of the enterprise. (1) Total assets are frequently used as the measurement unit of size by researchers both in the private sector (e.g., Street and Bryant 2000; Street and Gray 2002; Barako et al. 2006; Hassan and Marston 2010; Dilling and Caykoylu 2019) and public sector (e.g., Laswad et al. 2005; Mir et al. 2019). Concerning the variability in total assets between enterprises, this variable is transformed into the logarithm of total assets (Chalmers and Godfrey 2004; Hassan et al. 2008; Hellstrom 2009; Nandi and Ghosh 2013; Houcine 2017; Wang 2017; Dey et al. 2018; Nguyen et al. 2020), as Hassan et al. (2008) emphasise, “to normalize the distribution”. (2) Hassan and Marston (2010) and Street and Gray (2002) agree that sales could be considered to measure the size of the enterprise. (3) The size of the enterprise is measured by market capitalisation. For instance, (i) Street and Gray (2002) have used market capitalisation; (ii) Dargenidou et al. (2006), Wang et al. (2008), Leung et al. (2015), and Andre et al. (2018) used the logarithm of the market capitalisation. The attention should be drawn to Hassan and Marston’s (2010) viewpoint that “market value can be developed without recourse to corporate disclosure vehicles”. Furthermore, in legal documents (e.g., the Republic of Lithuania Law on Small and Medium-size Business Development (2017)), the size of the enterprises is determined by three parameters: (i) Total assets, (ii) annual revenue, and (iii) a number of employees. Also, researchers have used several parameters in order to determine the size of the enterprise, e.g., Rep et al. (2019) have taken into account both total assets and annual revenue.
As mentioned above, the following are units of measurement of an enterprise-size used in this research: The size of the enterprise is measured by (i) the natural logarithm of total assets (lnTA), (ii) the natural logarithm of sales (lnS), and (iii) the average annual number of employees (TEmp) (Table 1).

Table 1.
Variables of panel model, abbreviations, and description.
3.3.2. Enterprise Debt-Paying Capacity and Enterprise Indebtedness
Different theories explain the debt-paying capacity and indebtedness impact on disclosure, and their approaches to this issue may vary. As Dey et al. (2018) have pointed out, the agency theory evolves that enterprises “with lower liquidity disclose more information to reduce conflict between shareholders and creditors”. On the other hand, the signalling theory argues that enterprise (Dey et al. 2018) “with a high liquidity ratio tends to disclose more information in order to be differentiated from other firms with a lower liquidity ratio”.
This issue is also interpreted differently by researchers. The financial condition should be a significant factor for disclosure levels since, as Giroux and McLelland (2003) have stated, “an entity has incentives to signal financial health to creditors, voters and other users of financial information”.
Highly leveraged enterprises take a high financial risk (Abudy et al. 2016). Therefore, according to Lin et al. (2019), they, particularly listed enterprises, could “tend to conceal such risk from investors by window-dressing their accounting information”; consequently, their AID quality decreases. This view is supported by other researchers. For instance, according to Einhorn (2007) (as cited by Leung et al. 2015), indebted companies publish less information. The findings of studies (Nandi and Ghosh 2013; Dilling and Caykoylu 2019) have shown that the degree of disclosure is negatively related to leverage. The findings of the research by Leung et al. (2015) have suggested that enterprises with poor current performance “are more likely to engage in the concealment of voluntary narrative information in annual reports”. On the contrary, Hassan et al. (2008) and Wang (2017) have pointed out that enterprises with high leverage tend to disclose extensive information. Finally, Nguyen et al. (2020) have pointed out that experimental studies have shown two opposite perspectives: (i) The enterprises with higher solvency are more active to publish information by demonstrating the operational well-being of enterprises; and (ii) enterprises with low solvency tend to publish more information by justifying their status with external audiences.
Furthermore, a third alternative interpretation is possible. By investigating the derivative financial instrument disclosure, Chalmers and Godfrey (2004) have argued that “disclosure does not affect leverage related covenants directly”; however, “it can provide information that is vital to assessing the likelihood of such covenants being breached”. Moreover, “the disclosure of value relevant information reduces the price protection mechanisms instigated by debtholder”. The findings of research by Wang et al. (2008) are analogous, i.e., leverage “does not provide an explanation of the disclosure level variation in the Chinese context”.
Based on these statements, the second and third hypotheses are formulated as follows:
Hypothesis 2 (H2).
Debt-paying capacity (solvency and liquidity) of enterprise is significantly positively related to the level of accounting information disclosure quality (AID quality).
Hypothesis 3 (H3).
Indebtedness of enterprise is significantly positively related to the level of the accounting information disclosure quality (AID quality).
The researchers select different measures to assess debt-paying capacity.
To represent solvency (leverage) of enterprise, Chalmers and Godfrey (2004), Wang (2017), Dilling and Caykoylu (2019), Lin et al. (2019), and Rep et al. (2019) have used the ratio of total liabilities to total assets. For measuring the relative amount of debt (in this context, debt is understood as an interest-bearing short-term and long-term obligation) in the capital structure of the enterprise, Barako et al. (2006) and Hassan et al. (2008) have used the ratio of debt to total assets instead of the ratio of total liabilities to total assets.
Barako et al. (2006), Rep et al. (2019), and Nguyen et al. (2020) have used the ratio of current asset to current liabilities to represent the liquidity of an enterprise.
For empirical research of the disclosure issues in annual reports, other researchers have used solvency and liquidity ratios as control variables. For instance, Leung et al. (2015) have measured the current performance of an enterprise by Tobin’s Q ratio, i.e., the ratio of the sum of the market value of equity and total debts to total assets. Moreover, these researchers have used the leverage (measured as debt ratio, i.e., long-term debt scaled by total assets) and the liquidity ratio (measured as the sum of cash and short-term investment-to-total assets) as control variables. As the control variable in the model of voluntary disclosure in the annual reports of Chinese listed firms, Wang et al. (2008) have used leverage (measured as the ratio of total debt to equity).
In this research, the debt-paying capacity of an enterprise is measured by these parameters (Table 1): (a) To assess solvency, (i) the ratio of total liabilities to total assets (TL/TA), and (ii) the ratio of long-term liabilities to total assets (LTL/TA) is used; (b) to assess liquidity, the ratio of current assets to current liabilities (CA/CL) is used. Moreover, the indebtedness of an enterprise is measured by the natural logarithm of total liabilities (lnTL).
3.3.3. Tangible Assets of Enterprise
IAS 16 describes the non-current tangible assets, i.e., property, plant, and equipment, as “tangible items that: (a) are held for use in the production or supply of goods or services, for rental to others, or administrative purposes; and (b) are expected to be used during more than one period”.
Increasing tangible assets would be likely to influence economic decisions made by users of financial statements, and they should be more concerned about the performance of an enterprise.
The issue of influence assets on accounting information disclosure is more discussed in the research of the public sector. For instance, as stated by Mir et al. (2019), the assets of local government influence compliance with mandatory disclosure. Garcia and Garcia-Garcia (2010) have established that when local governments invest heavily, they consider more the reporting of financial information. Moreover, Bunget et al. (2014) show that “the municipalities with the largest value of intangible assets show a higher disclosure index”.
Analysing the size of an entity as an independent variable, it can be seen that in the works of some researchers, the size of an entity is measured by entity assets both (i) in the private sector (e.g., Street and Bryant 2000; Street and Gray 2002; Hassan and Marston 2010) and the public sector (e.g., Gordon et al. 2002; Laswad et al. 2005; Mir et al. 2019). As the object of this research is the tangible assets of an enterprise, these assets are selected as an independent variable. Based on this statement, the fourth hypothesis is formulated as follows:
Hypothesis 4 (H4).
Tangible assets of the enterprise are significantly positively related to the level of accounting information disclosure quality (AID quality).
In this research, the tangible assets of an enterprise are measured by the ratio of tangible assets to total assets (TngA/TA) and the natural logarithm of tangible assets (lnTngA) (Table 1).
3.3.4. Profitability of Enterprise
The literature review has provided evidence that the profitability of the enterprise also affects disclosure quality.
Researchers (Street and Bryant 2000; Street and Gray 2002) have determined that studies conducted at the end of the last century demonstrated mixed results regarding the association between profitability and level of disclosure. Furthermore, current research results have varied too. For instance, Nguyen et al. (2020) agree with the agency theory, which states, “if enterprises operate effectively, the managers will proactively disclose more information”. Furthermore, these authors have presented the reverse view too: “the enterprises who do not well operate will also publish much to explain the situation of the company to shareholders”. Theoretical analysis conducted by Hassan et al. (2008) has also shown mixed results: Ali et al. (2003) (as cited by Hassan et al. (2008)) have provided “evidence of a positive relationship between profitability and compliance level”; Wallace and Naser (1995) (as cited by Hassan et al. (2008)) have identified “a negative relationship between these variables”.
It is important to point out that the empirical research results have varied too. Hassan et al. (2008), Wang et al. (2008), Nandi and Ghosh (2013), and Leung et al. (2015) have shown that profitability is positively related to disclosure quality. Conversely, Dilling and Caykoylu (2019) have found that profitability has a negative and significant relationship with disclosure quality. Furthermore, Pivac et al. (2017) have analysed and compared “the level of annual report disclosure quality for listed companies in selected European transition countries” (Croatia, Montenegro, Romania, Serbia, and Slovenia). In these countries, research results have varied, i.e., correlations between the DQI and financial performance indicators (ROE, ROA) were not significant for enterprises in all countries, except in Romania, where the correlation between ROA and DQI was negative and significant.
Based on these statements, the fifth hypothesis is formulated as follows:
Hypothesis 5 (H5).
Profitability of enterprise is significantly positively related to the level of accounting information disclosure quality (AID quality).
The researchers have selected different measurement units to assess profitability: Return on equity (ROE), return on assets (ROA), and net profit margin are frequently used as the measurement unit of profitability by researchers. (1) Street and Bryant (2000), Barako et al. (2006), Wang et al. (2008), Pivac et al. (2017), and Rep et al. (2019) have used a return on equity (ROE) measurement unit. However, ROE calculation is different, for instance, (i) according to Barako et al. (2006), Wang et al. (2008), and Rep et al. (2019), ROE is defined as the ratio of net profit to equity; (ii) according to Street and Bryant (2000), ROE is defined as the ratio of net profit before tax to equity. (2) Hassan et al. (2008), Leung et al. (2015), Pivac et al. (2017), and Nguyen et al. (2020) have used return on assets (ROA). Furthermore, measurement units are selected differently, for instance, Hassan et al. (2008) used the ratio of profit before tax to total assets; meanwhile, Nguyen et al. (2020) have used the ratio of profit after tax-to-total assets). (3) Pivac et al. (2017) and Dilling and Caykoylu (2019) used the net profit margin that Dilling and Caykoylu (2019) described by the ratio of net profit to revenues.
In this research, the profitability of an enterprise is measured by three parameters (Table 1): (i) The ratio of net profit to equity (ROE), (ii) the ratio of net profit to total assets (ROA), and (iii) the ratio of net profit to sales (NP/S).
3.3.5. Control Variables
In this research, the financial ratios and financial data of enterprises discussed in previous research are used as control variables. The following six control variables of an enterprise are collected (Table 1): (i) Debt turnover (measured by the ratio of total liabilities-to-sales (TL/S)), (ii) tangible assets (measured as tangible assets per employee (TngAperEmp)), (iii) revenue (measured as sales per employee (SperEmp)), (iv) tangible assets turnover (measured by the ratio of sales to tangible assets (S/TngA)), (v) total assets turnover (measured by the ratio of sales to total assets (S/TA)), and (vi) own financing (measured by the ratio of total liabilities to equity (TL/E)).
3.4. Model Specification and Variable Measurement
To identify specific factors (enterprise’s characteristics) that have an impact on the AID quality, a panel regression model is used.
In this research, to test Hypotheses H1–H5, the invariant constant panel model, including (1) three disclosure quality indexes (DQI) as a dependent variable, (2) 12 independent variables, and (3) the control variables, is created (Table 1):
where (1) a dependent variable—the disclosure quality index (DQI)—is used to measure the AID quality, (2) 12 independent variables are divided into the five following groups: (i) Size of enterprise (average annual number of employees (TEmp), the natural logarithm of total assets (lnTA), the natural logarithm of sales (lnS)), (ii) debt paying capacity of enterprise (the ratio of total liabilities to total assets (TL/TA), the ratio of long term liabilities to total assets) (LTL/TA), the ratio of current assets to current liabilities (CA/CL)), (iii) indebtedness of enterprise (natural logarithm of total liabilities (lnTL)), (iv) tangible assets of enterprise (the ratio of tangible assets to total assets (TngA/TA), the natural logarithm of tangible assets (lnTngA)), and (v) profitability of enterprise (the ratio of net profit to equity (ROE), the ratio of net profit to total assets (ROA), the ratio of net profit to sales (NP/S)). In the model, the six control variables (ConVar) are used.
Coefficient C is identical for all observed objects (enterprises); β1, β2, …, β12 represents the particular coefficient in a linear combination of 12 independent variables; j = 1 to 37 and corresponds to enterprises; t = 1 to 3 and corresponds to year; k = 1 to 6 and corresponds to control variables, and ε corresponds to error. Binary and multivariate regression models are established using the method of least squares. Having eliminated insignificant variables, the final panel regression model is formed.
The creation of a DQI factors’ panel regression model consists of three stages. (a) Firstly, binary panel linear regression models are constructed to reject insignificant variables. If certain independent or control variables highly or moderately correlate with each other, they cannot be applied in the same panel regression model. After primary analysis, for each of the five hypotheses (Section 3.3.1, Section 3.3.2, Section 3.3.3 and Section 3.3.4), one “best-performing” (based on t-value and p-statistics) independent variable is selected ((i) if the relevant variable is not statistically significant according to the initial analysis but is the only one on the basis of which the certain hypothesis is tested, it is included in the model in any case; (ii) if all independent variables on which the certain hypothesis is tested are statistically insignificant, the “best performing” insignificant variable is selected for further analysis). (b) Secondly, several primary multivariate linear regression models are created for each DQI (i.e., for DQI1, DQI2 and DQI3). (c) Thirdly, after checking all reasonable combinations of variables, the final DQI factors’ models are created. Furthermore, in all of the final DQI models, the variables—specific factors (enterprise’s characteristics)—should be significant at least at the 90% confidence level.
It should be noted that this research is limited to panel estimation by using the invariant constant model (i.e., C is identical for all objects). The evaluation of DQI factors using the models with fixed effects (different Cj for each enterprise) and dynamic effects (same C but different error αj = C + vi), as well as the inclusion of additional internal and external factors, could increase statistical characteristics of the assessment of DQI factors, which could be a further direction for future research.
The descriptive statistics of dependent, independent, and control variables are presented in Appendix B, Table A4.
In total, 69.46% of enterprises notes of which were analysed were private limited liability companies, while 40.54% were public limited liability companies. Throughout the investigated period, the distribution between the types of enterprise remained unchanged. Most analysed enterprises (94.59% in 2007, 97.30% in 2008, and 89.19% in 2016, respectively) provide full notes. However, during the reporting period, the comparative share of enterprises providing a summary of notes had been increased (from 5.41% in 2007 to 10.81% in 2016). Here, “summary of notes” is considered to be “notes” where accounting policies and accounting principles are shortly described; however, other explanatory information is not provided. The section of accounting policies is presented in most of notes of enterprises; moreover, the comparative share of such enterprises increased slightly (94.59% in 2007, 97.30% in 2008 and 2016, respectively).
4. Results and Discussion
Firstly, we will discuss the accounting information disclosure of the tangible assets in the annual financial statements of the enterprises according to disclosure quality indexes (DQI1, DQI2, and DQI3) components.
4.1. Evaluation of the AID Quality According to Disclosure Quality Indexes Components
4.1.1. Accounting Information Disclosure According to DQI1 Components
As stated in the previous section, the DQI1 index formed mandatory disclosed information required for all—small, medium, and large—enterprises.
The trend analysis revealed that during the investigated period, in the notes, information disclosure on tangible assets (i) has increased according to two DQI1 components: Enterprises disclosed more information about the change in the accounting policies of assets (MSMLE1.2; R2 = 0.88) and the amount of impairment losses (MSMLE2.5.1; R2 = 0.81). (ii) Other components demonstrate a downward trend. (iii) It is worth mentioning that six components were not required to disclose for the financial years 2007 and 2008. Therefore, the trend of these components is not set (see Appendix B, Table A5, and Appendix C, Table A18).
Having analysed the frequency of disclosure of tangible assets in notes of enterprises, the disclosure of the DQI1 components is the following (for more details see Appendix B, Table A5 (summary)). (1) Most frequently, the enterprises disclosed information on (i) assets measurement basis (methods) (MSMLE1.1); (ii) the change of the carrying amount of an asset presented in financial statements at the acquisition cost or revalued amount during the reporting period. (2) Infrequently, the enterprises disclosed information related to (i) the change in the accounting policies of assets (MSMLE1.2), and (ii) investment property (M_SMLE3). These results will be discussed in more detail below.
The enterprises have to inform users about the measurement basis (methods) used in the financial statements. As the International Accounting Standard 1 (IAS 1) “Presentation of Financial Statements” (International Financial Reporting Standards (IFRSs) 2008) states, it is important “because the basis on which an entity prepares the financial statements significantly affects users’ analysis”. The results indicated that Lithuanian enterprises provide the users of the financial statements with this information: Throughout the reporting period, the disclosure of tangible assets measurement basis (methods) (MSMLE1.1) was high (100% in 2007 and 2008, 94.59% in 2016, respectively) (see Appendix B, Table A5). (i) During the investigated period, all enterprises that disclosed measurement basis (methods) of tangible assets used the method of acquisition cost. (ii) The number of enterprises using the revalued amount method (a) increased during the years 2007–2008; (b) however, this decreased during the years 2008–2016 (37.84% in 2007, 48.65% in 2008, and 25.73% in 2016, respectively). It could be explained that the 2004–2008 period is considered as “the period of the formation of the “bubble” and the country‘s economic and real estate market boom” (Keizerienė 2016). Hence, during this period, enterprises were interested in showing a higher value of assets in their financial statements and more enterprises were revaluing their assets. Whereas the period from 2010 “can be described as the period of the economic recovery and stabilization of the real estate market” (Keizerienė 2016), i.e., there was no need for enterprises to revalue their assets. (iii) The enterprises that have used the method of fair value also showed a downward trend (35.14% in 2007, 37.84% in 2008, and 25.71% in 2016, respectively). It could be explained that, during the investigated period, the amount of enterprises holding investment property has been decreasing. (iv) Whereas the number of enterprises that have been using the method of recoverable amount has increased (29.73% in 2007, 35.14% in 2008, and 65.71% in 2016, respectively), i.e., more companies analysed whether they had to recognise (or had to reverse the recognition of) an impairment loss.
It is worth noting that an enterprise might use a different measurement basis for particular classes of assets. Hence, it might use more than one measurement basis in the financial statements. Data analysis also revealed that the analysed enterprises disclosed the classes of tangible assets. In 2007 and 2008, on average, enterprises identified five classes of tangible assets (accordingly, six classes in 2016, i.e., the number of classes of tangible assets disclosed in notes increased).
As DQI1 component MSMLE2 (see Appendix A, Table A1) indicates, the financial statements of enterprises shall disclose, for each class of tangible assets presented in financial statements at the acquisition cost or revalued amount, and investment property presented in financial statements at the acquisition cost, (i) cost or revalued amount at the beginning and at the end of the reporting period (MSMLE2.1), (ii) the value of assets acquired (MSMLE2.2), (iii) the assets disposed or written off (MSMLE2.3 and its parts), (iv) depreciation (MSMLE2.4 and its parts), (v) impairment (MSMLE2.5 and its parts), and (vi) revaluation (MSMLE2.6 and its parts). In most of the cases, this status of assets and its changes were disclosed in a specific table: The comparative share of enterprises providing such tables in 2016, compared to 2007–2008, decreased significantly, at around 81–84% (accordingly, 92–95% in 2007 and 2008) (see Appendix B, Table A5).
During the investigated period, the comparative part of enterprises that disclosed depreciation in financial statements increased significantly (13.15% in 2007, 16.22% in 2008, and 51.35% in 2016, respectively). A weak positive correlation between these numbers and MSMLE2.5.2.1 (the amount of impairment losses recognized in the statement of profit or loss) is observed (Corr. = 0.392, p = 0.000, significant at the 99% confidence level).
Furthermore, it is also worth mentioning that during years 2007–2008, the disclosure of impairment and revaluation was not required (see Appendix B, Table A5).
During the investigated period, the number of enterprises holding investment property has decreased significantly (43.24% in 2007, 40.54% in 2008, and 24.39% in 2016, respectively). On the other hand, disclosure of measurement basis (methods) of the investment property increased (81.35% in 2007, 86.67% and 100% in 2016, respectively). It should be noted that if an enterprise does not have an investment property, it is considered that it did not have to disclose information about the valuation methods of this property (noted n = did not need to be disclosed). It was investigated whether enterprises holding investment property tend to disclose its measurement basis (methods): It was found that the majority of such enterprises disclose investment property measurement basis (methods) in notes (Corr. = 0.862, p = 0.000, significant at the 99% confidence level).
In 2007, 61.54% of enterprises that disclosed measurement methods used the acquisition cost method for measurement of the investment property (accordingly, 61.54% in 2008 and 80.00% in 2016, i.e., the amount of enterprises using this method increased). A much smaller proportion of enterprises used the method of fair value (MSMLE3); moreover, the comparative part of enterprises using this method decreased (38.46% in 2007 and 2008, 10.00% in 2016, respectively) (weak positive correlation (Corr. = 0.442, p = 0.000, significant at the 99% confidence level)). It should be noted that if an enterprise does not have an investment property or all available investment property is measured using the cost method, it is considered that it did not have to disclose information about the condition of investment property at fair value through profit or loss (noted n = did not need to be disclosed). The same regard applies when the notes clearly state that there was no investment property carried at fair value.
In the next step of the research, the correlation between DQI1 components (with each other and with DQI1) is evaluated (Appendix C, Table A20). The results of correlation analysis indicate the following conclusion. If an enterprise discloses one component of the change of the carrying amount of an asset during the reporting period, it discloses other components too. (1a) It is relevant for the following components: Cost or revalued amount at the beginning and at the end of the reporting period (MSMLE2.1), the value of assets acquired during the reporting period (MSMLE2.2), the assets disposed or written off (MSMLE2.3), and depreciation (MSMLE2.4) (for more details see Appendix C, Table A20 (summary)). (1b) Whereas this does not apply to components of MSMLE2.5 and MSMLE2.6 (i.e., impairment losses and revaluation). (2) It is relevant for the following components of investment property presented in financial statements at the fair value: The value of assets acquired during the reporting period (MSMLE3.2) and the assets disposed or written off (MSMLE3.3).
Finally, DQI1 level greatly depends on 8 of 22 components: MSMLE2.1, MSMLE2.2, MSMLE2.3.1, MSMLE2.3.2, MSMLE2.4.1, MSMLE2.4.2, MSMLE3.3.1, and MSMLE3.3.2.
4.1.2. Accounting Information Disclosure According to DQI2 Components
The DQI2 index is formed by (a) mandatory disclosed information required for all—small, medium, and large—enterprises; furthermore, this information is analysed in detail in DQI1, whereas, in the index DQI2, this information is presented as three components: Assets measurement basis (methods) (G1.3), the change in the accounting policies of assets (G1.7), and the change of the carrying amount of an asset during the reporting period (G2); and (b) additional disclosed information required for medium, and large enterprises.
The trend analysis revealed that during the investigated period, in the notes, information disclosure on tangible assets (1) had decreased according to the following three DQI2 components: (i) The minimum cost of tangible assets set by the entity (G1.2) (ii) assets measurement basis (methods) (G1.3); (iii) asset depreciation method for each class of tangible assets and investment property (G1.4) (R2 = 0.75); (2) other components demonstrate an upward trend (R2 ≥ 0.75) (see Appendix B, Table A6, and Appendix C, Table A18).
Having analysed the frequency of disclosure of tangible assets in notes of enterprises, the disclosure of the DQI2 components is the following (see Appendix B, Table A6; for more details see Appendix B, Table A6 (summary)). (1) Most frequently, the enterprises disclosed information on (i) the minimum cost of tangible assets set by the entity (G1.2) (ii) assets measurement basis (methods) (G1.3); (iii) asset depreciation method (G1.4); (iv) the useful life for each class of tangible assets and investment property (G1.5) and (v) presentation of the accounting estimates (G3.5). (2) Least frequently, the enterprises disclosed information related to (i) the change in the accounting policies of assets (G1.7), (ii) the reasons for revaluation, periodicity, and the result of the revaluation (G3.3), and (iii) when the separate portion of a property is held for different purposes, the criteria for determining the significance of these portions, and their sizes and values (G3.4). These results will be discussed in more detail below.
The results indicated that, during the reporting period, the minimum cost of tangible assets set by the entity (G1.2) was disclosed by more than two-thirds of enterprises (78.38% in 2007 and 2008, 72.97% in 2016, respectively) (see Appendix B, Table A6). From 16.22% to 18.92% of enterprises tend to apply different minimum costs for different classes of tangible assets. Furthermore, the minimum cost of tangible assets is likely to depend on the size of an enterprise. Therefore, it was investigated whether the minimum cost of tangible assets is correlated with enterprise sales, total assets, and tangible assets. However, none of these variables are statistically significantly correlated with G1.2 (Corr.(G1.2, Sales) = 0.111, p = 0.309; Corr.(G1.2, Total Assets) = 0.162, p = 0.137; Corr.(G1.2, Tangible Assets) = 0.044, p = 0.687).
The results of depreciation analysis indicated that in 2007 and 2008, the depreciation method for each class of tangible assets and investment property (G1.4) was disclosed in all analysed enterprises (100%). However, in 2016, the disclosure of the depreciation method decreased to 89.19% (see Appendix B, Table A6). The analysis of the enterprises that disclosed the depreciation method shows the following results. (i) The majority of enterprises (from 94.59% to 100%) used the straight-line method. (ii) The minority of enterprises (from 2.70% to 6.06%) used other depreciation methods (the units of production method, separate components depreciation method).
About two-thirds of enterprises provide information related to assets used as collateral and other restrictions of ownership rights (G3.2). For the component G3.2, it should be noted that when, in notes, the carrying amount of assets used as collateral and other restrictions of ownership rights is not presented, however it is stated that an enterprise does not hold this kind of assets during the reporting period, it is considered that assets are disclosed.
For component G3.3, it should be noted that in assessing how enterprises have disclosed in notes reasons for revaluation, periodicity, and the result of the revaluation, information disclosure is required only for those enterprises that use the revalued amount method. The above-mentioned criterion does not apply to enterprises that do not apply the revaluation method (noted n = did not need to be disclosed).
In the next step of the research, the correlation of DQI2 components (with each other and with DQI2) was evaluated (Appendix C, Table A21). The analysis revealed that during the investigated period, a strong positive relationship (p = 0.000, significant at the 99% confidence level) is observed between G1.3 (i.e., assets measurement basis (methods)) and G1.4 (i.e., asset depreciation method for each class of tangible assets and investment property) (Corr. = 0.701). It can be concluded that these DQI components are not only considered important by enterprises, but if they disclose one, the other component will also be disclosed. Though, this is not the case regarding G1.5 (i.e., the useful life for each class of tangible assets): This component does not show a significant correlation with G1.3 and G1.4. Furthermore, it is established that the DQI2 strongly positively correlates with none of the 11 components.
4.1.3. Accounting Information Disclosure According to DQI3 Components
As stated in Section 3, the DQI3 is formed by (a) mandatory disclosed information required for all—small, medium, and large—enterprises; furthermore, this information is analysed in detail in DQI1, whereas, in the index DQI2, this information is presented as three components (G1.3, G1.7, G2), (b) additional disclosed information required for medium and large enterprises (components G1.2, G1.4, G1.5, G3.1—G3.5), and (c) voluntarily disclosed information (components G0.1, G0.2, G1.1, G1.6). The analysis of the DQI3 components shows the following: (1) In the notes, information disclosure had increased according to (i) the same components that are included in the DQI2 and (ii) two DQI3 components that are disclosed voluntarily: G1.1 and G1.6 (Appendix B, Table A7; for more details see Appendix B, Table A7 (summary), and Appendix C, Table A18). (2) Infrequently disclosed components are equal, as in the case of the DQI2. (3) The definition and recognition criteria of tangible assets (G0.1, G0.2) are new components that the companies seldom disclose. These results will be discussed in more detail below.
The results indicated that only the minority of enterprises discloses the definition of non-current tangible assets (G0.1) (see Appendix B, Table A7). Moreover, during the analysed period, the comparative part of such enterprises decreased (16.22% in 2007, 13.51% in 2008, and 2.79% in 2016, respectively). In addition, only a small number of enterprises provide all five recognition criteria of tangible assets (G0.2) (10.81% in 2007, 13.51% in 2008 and 8.11% in 2016). For component G0.2, it should be noted that information is considered to be disclosed only if all five criteria are specified in the note (these criteria are discussed in Section 3.2); if less than five criteria are specified, the information is considered undisclosed (from 86.49% to 91.89% of enterprises).
The number of enterprises that provide both the definition of non-current tangible assets and all five recognition criteria of non-current tangible assets was 5.41% in 2007, 8.11% in 2008 and 2.70% in 2016. The number of enterprises that did not provide a definition of non-current tangible assets but presented all five recognition criteria for the whole year under review was 5.41%. In assessing enterprises that presented not all recognition criteria in the note, it was observed that in most enterprises, only two criteria are presented (61.29% in 2007, 58.06% in 2008, and 48% in 2016, respectively).
In notes, the residual value of an asset (G1.6) is disclosed of less than one-third of enterprises (24.32% in 2007, 24.32% in 2008, and 27.03% in 2016, respectively). In 2007–2008, 88.89% of enterprises applied LTL 1.00 (the national currency (the Litas) until 2015, equivalent to 0.29 EUR) and 11.11% indicated that the residual value was at least LTL 1.00 (equivalent to 0.29 EUR). In 2016, 50% of enterprises applied 1 EUR, 30%—0.29 EUR value. Ten percent of enterprises indicated that the residual value is not less than EUR 1.00 and EUR 0.29.
The next step of the research is the evaluation of the correlation between DQI3 components (with each other and with DQI3) (Appendix C, Table A22). The analysis revealed that during the investigated period, a strong positive relationship (p = 0.000, significant at 99% c.l) is observed between components G1.3 and G1.4 (Corr. = 0.701). This result was discussed in the analysis of the DQI2. The final point to stress is that the DQI3 strongly positively correlates with none of the 15 components.
4.1.4. Trend of the Enterprises DQI’s during the Investigated Period
This part of the research presents the trend analysis of the enterprises’ tangible assets DQI’s of the period 2007–2016 (Appendix C, Table A19). Analysis of DQI variation trends in the period of 2007–2016 revealed that (i) DQI1 had increased in 35.14% of enterprises (among these enterprises, a stable growth trend was demonstrated by 29.73% of enterprises (where R2 > 0.6)), while 64.86% of enterprises observe a decrease in the disclosed information estimated by DQI1; (ii) DQI2 had increased in 72.97% of enterprises (among these enterprises, a stable growth trend was demonstrated by 64.86% of enterprises (where R2 > 0.6)) and decreased in 27.03% of enterprises; (iii) DQI3 had increased in 62.16% of enterprises (among these enterprises, a stable growth trend was demonstrated by 56.76% of enterprises (where R2 > 0.6)) and decreased in 37.84% of enterprises (for more details see Appendix C, Table A19 (summary)).
The given results show that during the investigated period, the number of enterprises that disclosed mandatory information required for all—small, medium, and large—enterprises decreased significantly (as the trend DQI1 shows). This conclusion supports earlier claims, given the result of DQI1 components analysis, i.e., information disclosure on tangible assets, except two components, has decreased according to all DQI1 components). Nevertheless, DQI2 and DQI3 have increased during the investigated period. Interestingly, DQI2 has increased in more enterprises than the DQI3. It can be stated that the enterprises have been paying more attention to the additional information that shall be disclosed by medium, large, and public-interest enterprises rather than other information.
4.1.5. Evaluating the AID Quality of the Tangible Assets: Using DQI Rating Scale
For the DQI evaluation, it was decided to use the DQI rating scale by Pivac et al. (2017) (Table 2). In virtue of DQI1 analysis, it is established that during the investigated period, DQI1 of enterprises has decreased: The number of enterprises: (i) With poor accounting information disclosure (AID) quality increased twice, (ii) with an average AID quality decreased by one third, (iii) with sufficient AID quality decreased by 4.55%, and (iv) with high AID quality increased by one third. In virtue of DQI2 analysis, it is established that, during the investigated period, the DQI2 of enterprises has increased: (i) The number of enterprises with low information disclosure quality decreased to zero, (ii) the number of enterprises with an average and sufficient DQI2 decreased by 25.00% and 30.43%, respectively, and (iii) the number of enterprises with high DQI2 increased more than four times. In virtue of DQI3 analysis, it is established that, during the investigated period, the DQI3 of enterprises has increased: (i) The number of enterprises with low and average information disclosure quality decreased by 70.43% and 16.67%, respectively, (ii) while the number of enterprises with sufficient DQI3 decreased by 50.00%.
Table 2.
Disclosure quality (indexes DQI1, DQI2, DQI3) of the tangible assets in the annual financial statements of the enterprises: Using DQI rating scale.
4.1.6. AID Quality Changes during the Investigated Period
Descriptive statistics of DQI1, DQI2, and DQI3 are reported in Table 3. During the investigated period (2007–2016), the results indicated the decrease of DQI1 and the increase of DQI2 and DQI3. This conclusion supports the earlier given result.
Table 3.
Summary of descriptive statistics of DQI in the 2007–2016 financial statements of the enterprises.
Analysis of descriptive statistics of DQI1 revealed the following results. In 2007, on average, Lithuanian enterprises had disclosed 64.47% (66.37% in 2008 and 58.52% in 2016, respectively) of information measured by DQI1. The lowest found value of the DQI1 was 6 (6 in 2008 and 0 in 2016, respectively), and the highest was 89 (89 in 2008 and 82 in 2016, respectively). The lower quartile shows that in 2007, one-fourth of Lithuanian enterprises had disclosed less than 50% of the information (56.25% in 2008 and 60.00% in 2016, respectively). The top quartile indicates that 75% of all examined enterprises revealed less than 77.78% (77.78% in 2008 and 72.73% in 2016, respectively) of the mandatory disclosure information on tangible assets (see Table 3).
Analysis of descriptive statistics of DQI2 revealed the following results. On average, Lithuanian enterprises have disclosed 66.90% in 2007 (67.69% in 2008 and 74.51% in 2016, respectively) of the information measured by DQI2. The lowest found value of the disclosure index DQI2 during the period in question was 22 (22 in 2008 and 0 in 2016, respectively), and the highest was 89 (89 in 2008 and 100 in 2016, respectively). The lower quartile shows that 25% of Lithuanian enterprises have disclosed less than 59.43% of the information (61.65% in 2008 and 66.00% in 2016, respectively). The top quartile indicates that 75% of all examined enterprises revealed less than 78.79% (79.40% in 2008 and 88.47% in 2016, respectively) of the information (see Table 3).
Analysis of descriptive statistics of DQI3 revealed that, on average, Lithuanian enterprises have disclosed 53.60% of the information in 2007 (54.30% in 2008 and 57.83% in 2016, respectively). The lowest found value of the disclosure index DQI3 during the period in question was 23 (23 in 2008 and 0 in 2016, respectively), and the highest was 77 (78 in 2008 and 85 in 2016, respectively). The lower quartile shows that 25% of Lithuanian enterprises had disclosed less than 45.57% of the information (45.57% in 2007–2008 and 48.60% in 2016, respectively). The top quartile indicates that 75% of all examined enterprises revealed less than 63.74% (61.12% in 2008 and 68.43% in 2016, respectively) of the information on tangible assets measured by DQI3 (see Table 3).
It is ascertained that the enterprises of Lithuania in 2007 on average have revealed 64.47% of the information of mandatory disclosure on tangible assets, which allows for assuming that on average, the ADI quality was sufficient (DQI1 61–80) (accordingly, sufficient in 2008 and average (DQI1 41–60) in 2016).
In order to answer the research question R1 “Has the AID quality increased statistically significantly during the investigated period?”, statistical tests are used. Having carried out the assessment of normality, the results of the Shapiro–Wilk’s test have shown that most of the data come from a not normally distributed population) (see Table A8; for more details see Appendix B, Table A8 (summary)). Therefore, DQI is explored with a non-parametric Wilcoxon signed-ranks test to assess whether the quality of disclosure decreased in the case of DQI1 (increased in case of DQI2 and DQI3) during the investigated period (see Appendix B, Table A9; for more details see Appendix B, Table A9 (summary)).
The results indicated that there is no statistically significant difference between DQI1 values in 2007–2016 and 2007–2008. However, there is a statistically significant difference between DQI1 values in 2008–2016, i.e., disclosure of mandatory information (for all enterprises) (measured by DQI1) did not decrease for 2007–2016 and 2007–2008 but decreased for 2008–2016.
The results also showed that there is no statistically significant difference between DQI2 values in 2007–2008. However, there is a statistically significant difference between DQI2 values in 2007–2016 and 2008–2016. Hence, disclosure of the information on tangible assets (measured by DQI2) did not increase for 2007–2008, while the disclosure increased for 2007–2016 and 2008–2016.
Finally, the results revealed that there is no statistically significant difference between DQI3 values in 2007–2016 and 2007–2008, but there is a statistically significant difference between DQI3 values in 2008–2016. Hence, disclosure of information (measured by DQI3) did not increase for 2007–2016 and 2007–2008 and it increased for 2008–2016.
In summary, it can be stated that during the period of 2008–2016, the AID quality measured by DQI1 decreased, while AID quality measured by DQI2 and DQI3 increased statistically significantly.
4.2. Identification of Specific Factors (Enterprise Characteristics) Having an Impact on the Accounting Information Disclosure Quality
4.2.1. Specific Factors (Enterprise’s Characteristics) of DQI1
The research also aimed to identify the factors (enterprise characteristics) that may have an impact on AID quality (expressed by DQI). Panel regression models are constructed based on the methodology revealed in Section 3.
At first, binary panel linear regression models are constructed to reject insignificant variables (see Appendix B, Table A10). Based on the results of primary DQI1 regressions (Appendix B, Table A10) (t-value and p-statistics), it proved the following: (i) Three control variables (debt turnover (TL/Sjt), tangible assets turnover (S/TngAjt), and total assets turnover (S/TAjt)) are significant at least at the 95% confidence level and are selected for further calculations, while (ii) three control variables (tangible assets per employee (TngAperEmpjt), revenue per employee (SperEmpjt), and own financing of an enterprise (TL/Ejt)) are eliminated from further research as insignificant. Afterwards, four primary DQI1 factors multivariate linear regression models are created (see Appendix B, Table A11).
After checking all reasonable combinations of variables, the final DQI1 factors’ models (Model I, Model II, Model III) are created (Table 4).
Table 4.
Final DQI1 factors multivariate panel regression models.
Having estimated the statistical characteristics of each independent variable included in the primary Model I, two irrelevant independent variables were eliminated from the model—tangible assets of enterprise (measured as TngA/TAjt) and profitability of enterprise (measured as NP/Sjt). One independent variable (profitability of enterprise (measured as NP/Sjt)) was eliminated from Model II. Four independent variables (size of enterprise (measured as lnSjt), debt-paying capacity of enterprise (measured as CA/CLjt), indebtedness of enterprise (measured as lnTLjt), and tangible assets of enterprise (measured as lnTngAjt)) were eliminated from Model III. Generally, in all of the three final DQI1 models, the variables—specific factors (enterprise’s characteristics)—are significant at least at the 90% confidence level.
Panel estimation of the AID quality measured by DQI1 in enterprises (Table 4) reveals that: (i) Five out of six selected independent variables—size of enterprise (lnSjt), debt-paying capacity of enterprise (CA/CLjt), indebtedness of enterprise (lnTLjt) (Model I), tangible assets of enterprise (lnTngAjt) (Model II), and profitability of enterprise (NP/Sjt) (Model III)—have a statistically significant impact on DQI1, while in the case of enterprise tangible assets (measured as the ratio of tangible assets to total assets (TngA/TAjt)), no statistically significant impact was found (Model I, Model III).
The results allow stating the following: (i) Larger enterprises tend to demonstrate a higher disclosure quality degree estimated by DQI1; (ii) enterprises with higher debt-paying capacity and enterprises with higher indebtedness tend to demonstrate a lower degree of disclosure quality; (iii) enterprises with higher profits tend to demonstrate a lower degree of disclosure.
Control variables related to debt turnover of enterprise, tangible assets turnover, and total assets turnover were proven to have a statistically significant impact on DQI1: (i) Enterprises with higher total assets turnover tend to demonstrate a higher; and (ii) enterprises with higher debt and tangible assets turnover tend to demonstrate a lower disclosure quality degree.
4.2.2. Specific Factors (Enterprise Characteristics) of DQI2 and DQI3
The results of primary binary, primary multivariate, and final multivariate panel regression models for DQI2 and DQI3 are similar to those for DQI1 (see Appendix B, Table A12, Table A13, Table A14, Table A15, Table A16 and Table A17). The main similarities and differences are briefly discussed.
As well as in the case of DQI1, the main specific factors of DQI2 and DQI3 are the size and indebtedness of the enterprise: Larger enterprises (measured by sales) tend to demonstrate a higher disclosure quality degree while enterprises with higher indebtedness tend to demonstrate a lower degree of disclosure quality.
Unlike the case of DQI1, other specific factors (such as debt-paying capacity and profits) proved to have no statistically significant impact on disclosure quality measured by DQI2 and DQI3.
Unlike the case of DQI1, control variables related to debt turnover of enterprise, enterprise tangible assets, and enterprise revenue were proven to have a statistically significant impact on DQI2 and DQI3: (i) Enterprises with higher debt turnover, tangible assets, and revenue tend to demonstrate a lower disclosure quality degree.
4.2.3. Discussion of Specific Factors (Enterprise Characteristics) of Accounting Information Disclosure Quality
In conclusion, the findings of the research support the following hypotheses: H1 and H4, while hypotheses H2, H3, and H5 cannot be supported (Table 5).
Table 5.
Final results of DQI factors assessment.
The research shows that:
- 4.
- The size of an enterprise (measured by sales) is significantly positively related to the level of the accounting information disclosure (AID) quality measured by DQI1, DQI2, and DQI3;
- 5.
- The debt-paying capacity of an enterprise is significantly negatively related to the level of the AID quality measured by DQI1;
- 6.
- The indebtedness of an enterprise is significantly negatively related to the level of AID quality measured by DQI1, DQI2, and DQI3;
- 7.
- The tangible assets of an enterprise are significantly positively related to the level of AID quality measured by DQI1;
The profitability of an enterprise is significantly negatively related to the level of AID quality measured by DQI1.
Control variables related to debt turnover, tangible assets turnover, total assets turnover, tangible assets, and revenue were proven to have a statistically significant impact on the AID quality.
The findings are discussed in more detail.
This research shows that the size of an enterprise (measured by sales) is positively related to the level of the accounting information disclosure (AID) quality measured by DQI1, DQI2, and DQI3. Compared to the research already carried out, it can be stated that the size of an enterprise is widely used in the disclosure quality models. However, previous research has shown mixed results.
Our research finding—the size of an enterprise is significantly positively related to the level of the accounting information disclosure (AID) quality—is consistent with previous literature (Barako et al. 2006; Nandi and Ghosh 2013; Dilling and Caykoylu 2019; Rep et al. 2019). For instance, Rep et al. (2019) have highlighted that the size of an enterprise was “the only firm characteristic, which has shown a statistically significant positive influence on the amount of information disclosed” in Croatian high-tech companies. Nandi and Ghosh (2013) have claimed that “the results suggest a positive relationship between firm size and the extent of corporate disclosure”. Wang et al. (2008) have discussed the size of enterprise positively and significantly associated with voluntary disclosure in the annual reports of Chinese listed firms.
Differences in research results arise from assessing enterprise size measurement units. Barako et al. (2006), and Dilling and Caykoylu (2019) have used total assets as the size measurement unit. Nandi and Ghosh (2013) have transformed this variable into the logarithm of total assets. As mentioned above, these researchers’ studies have shown a statistically significant positive influence on disclosure. To measure the size of an enterprise, Rep et al. (2019) have selected total revenues and total assets, and both variables have shown a significantly positive relationship to the level of disclosure quality. Having taken into account this fact, our research results support Rep et al. (2019) that the size of an enterprise is significantly positively related to the level of the disclosure quality when the size is measured by sales of an enterprise. However, our research results show that the size of an enterprise is not significant when the size is measured by the natural logarithm of total assets. In this case, our research results support another group of researchers (Street and Bryant 2000; Street and Gray 2002; Wang 2017; Nguyen et al. 2020).
This research shows that the debt-paying capacity of an enterprise (measured as the ratio of current assets- to current liabilities) is significantly negatively related to the level of AID quality. This result is explained based on the agency theory stated that enterprises “with lower liquidity disclose more information to reduce conflict between shareholders and creditors”. However, previous research has shown mixed results. For instance, Nandi and Ghosh (2013) have found “a positive relationship between liquidity and the extent of corporate disclosure” of listed firms in India.
Another group of research (Barako et al. 2006; Rep et al. 2019; Nguyen et al. 2020) has demonstrated no significant relationship between liquidity and disclosure. For instance, Barako et al. (2006) have investigated the level of voluntary disclosure by companies in Kenya; Nguyen et al. (2020) have investigated the voluntary information disclosure on annual reports of listed companies in Vietnam.
This research shows that the debt-paying capacity of an enterprise (measured as the ratio of total liabilities to total assets and the ratio of long-term liabilities to total assets) is not significant to the level of the AID quality. Our research results support Chalmers and Godfrey (2004), Wang et al. (2008), Leung et al. (2015), Wang (2017), and Rep et al. (2019). Furthermore, experimental studies have shown two opposite perspectives. For instance, (i) Hassan et al. (2008) have found that the ratio of debt- to total assets is “significantly positively related with disclosure quality of financial instruments information”. Barako et al. (2006) have stated that enterprises with high debt have voluntarily disclosed more information by companies in Kenya. (ii) Whereas Dilling and Caykoylu (2019) have shown that leverage measured as the ratio of total liabilities to total assets has “a negative and significant relationship with total integrated reporting disclosure quality”. The same result is demonstrated by Nandi and Ghosh (2013).
Additionally, our research shows that the indebtedness of an enterprise (measured as the natural logarithm of total liabilities) is significantly negatively related to the level of the AID quality. This result can be explained based on the agency theory. Having taken into account the above-mentioned result of research, it could be stated that the disclosure quality depends on the amount of total liabilities rather than leverage. This could be explained as follows: Enterprises with higher liabilities take a high financial risk and, according to Lin et al. (2019), they “tend to conceal such risk from investors” through non-disclosure of information.
This research shows that the tangible assets of an enterprise are significantly positively related to the level of AID quality measured by DQI1. In other words, larger enterprises tend to disclose more information than smaller enterprises. Hence, these results support the agency theory. Furthermore, the research indicated that larger enterprises disclose more mandatory information. However, the additional and voluntary disclosed information does not depend on the size of an enterprise.
The research has investigated the relationship between the profitability of enterprise and disclosure quality and has given the following findings. Firstly, this research shows that the profitability of an enterprise (measured by the ratio of net profit-to-sales) is significantly negatively related to the level of the mandatory disclosed information required for all—small, medium, and large—enterprises (measured by DQI1). Our research results support Dilling and Caykoylu (2019). On the contrary, Hassan et al. (2008) have indicated that profit before tax to total assets is positively but not significantly related to disclosure quality of financial instruments information. Secondly, it should be noted that the additional and voluntary disclosed information does not depend on the profitability of an enterprise. There, previous research has shown mixed results. For instance, Nguyen et al. (2020) have shown that profitability has a positive impact on the disclosure of voluntary information on annual reports of listed enterprises in Vietnam. Thirdly, this research shows the profitability of an enterprise (measured by (i) the ratio of net profit to equity (ROE) and (ii) the ratio of net profit to total assets (ROA)) is not significant to the level of the AID quality. Accordingly, the findings are consistent with previous literature (Street and Bryant 2000; Street and Gray 2002; Barako et al. 2006; Rep et al. 2019). Pivac et al. (2017) have demonstrated that the country under examination makes an impact on the relationship between profitability and the level of disclosure quality. The researchers have analysed and compared the annual report disclosure quality level for listed enterprises in selected European transition countries (Croatia, Montenegro, Romania, Serbia, and Slovenia). The research results were different in these countries, i.e., correlations between the DQI and financial performance indicators (ROE, ROA) are not significant for enterprises in all countries, except in Romania, where the correlation between ROA and DQI is negative and significant. On the other hand, the empirical studies have shown both a positive (Wang et al. 2008) and a negative (Leung et al. 2015) relationship between profitability and the level of disclosure quality.
5. Conclusions
As the research of the accounting information disclosure (AID) quality in the Lithuanian private sector and the research of the unlisted enterprises, which generally apply national accounting standards, are insufficient, these enterprises are analysed in this research.
To carry out the more extensive research of the financial reporting quality in the Lithuanian private sector enterprises, first, the status of AID quality must be evaluated. For this purpose, based on legal requirements and related scientific literature, the research model of the AID quality in the financial statements has been created. This model consists of two stages. The first stage is devoted to the identification of the research object and its characteristics, where the research object and its characteristics have been identified at the level of (i) an entity, (ii) financial statements, and (iii) an element of financial statements. The second stage is devoted to the assessment of the element of financial statements AID quality, where the disclosure quality index (DQI) has been constructed and applied.
By assessing the accounting information disclosure (AID) quality of the non-current tangible assets in the annual financial statements of the enterprises of Lithuania, model validity has been checked. Based on the legal and regulatory requirements of the national accounting standards, three different original checklists have been structured. Three indexes (DQIs) allowing evaluation of the AID (both mandatory and voluntary) quality have been formed. These indexes are dedicated not only to assessing the changes in AID quality over different years in different enterprises of the private sector, but also to the comparison of different enterprises.
This model could contribute to further theoretical research in accounting information disclosure (AID) quality. Moreover, these results could be of interest to the following users of enterprises financial statements. The created checklists and indexes (DQIs) allow for identifying the non-compliance to the regulatory requirements in the enterprise financial statements, which may be important to standard setters when developing disclosure requirements in the future. These tools could help different stakeholders to evaluate the quality of financial statements. The formed checklists and indexes (DQIs) can be used by shareholders, investors, or creditors when making decisions due to the evaluation of accounting information disclosure (AID) quality of the non-current tangible assets in the annual financial statements.
The model has been verified in the case of Lithuanian enterprises. Using the content analytic method, indexes (DQIs) have been calculated. Furthermore, in accordance with the designed disclosure quality indexes, the AID quality of the non-current tangible assets in the annual financial statements of the enterprises of Lithuania has been evaluated and compared.
Evaluation of the quality according to disclosure quality indexes (DQIs) and their components shows the following.
The analysis of the AID of mandatory information required for all—small, medium, and large—enterprises quality shows that (1) the most frequent disclosure was the information on (i) assets measurement basis (methods); (ii) the change of the carrying amount of assets presented in financial statements at the acquisition cost or revalued amount during the reporting period. The requirements related to investment property are disclosed the least. (2) During the formation of the real estate “bubble”, the enterprises were interested in showing a higher value of assets in their financial statements, and more enterprises were revaluing their assets. (3) The results show that the AID quality (measured rating scale by Pivac et al. (2017)) of mandatory (for all enterprises) information (measured by DQI1) was sufficient in 2007 and 2008 (when Lithuania was the developing country), and average in 2016 (when Lithuania was the developed country). However, the difference between DQI1 values in the short term (2007–2008) and the long term (2007–2016) is not statistically significant. Hence, (i) during the short term (2007–2008), though Lithuania was undergoing a significant change during the mentioned period (i.e., in 2007, the economy was still growing very fast, while in 2008, the financial crisis started), the AID quality did not decrease. (ii) During the long term (2007–2016), when Lithuania was transforming from a developing to a developed country, the AID quality did not change statistically significantly.
During the investigated period, the Lithuanian enterprises had disclosed (1) the mandatory (for all enterprises) and additional (for medium and large enterprises) information measured by DQI2 sufficiently. The most frequent disclosed additional information is (i) the minimum cost of tangible assets set by the entity; (ii) asset depreciation method; (iii) the useful life for each class of tangible assets and investment property; and (iv) presentation of the accounting estimates. (2) Meanwhile, the mandatory (for all enterprises), additional (for medium and large enterprises), and voluntary information measured by DQI3 has been disclosed averagely. On the one hand, the results show that the AID quality (measured by both DQI2 and DQI3) did not change statistically significantly during the short term. On the other hand, during the long term, (i) disclosure of information (measured by DQI3) did not increase statistically significantly, whereas (ii) there is a statistically significant difference between DQI2 values in 2007–2016, i.e., the disclosure increased for this period. Hence, it can be stated that significant AID quality change is not observed during the short term. This change could occur during the long term.
The identification of specific factors (enterprise characteristics) with an impact on the accounting information disclosure quality shows the following. (1) The enterprise size and tangible assets have a statistically significant positive impact on the DQI. Taking these results into account, it can be stated that larger enterprises and enterprises with higher tangible assets tend to demonstrate a higher degree of the AID quality. (2) Enterprise debt-paying capacity, indebtedness, and profitability proved to have a statistically significant negative impact on DQI: Enterprises with higher debt-paying capacity, higher indebtedness, and higher profitability tend to demonstrate a lower degree of disclosure quality. (3) Moreover, the enterprise debt turnover, tangible assets turnover, total assets turnover, ratio of tangible assets to number of employees and revenue (divided by a number of employees) were proven to have a statistically significant impact on the AID quality. The potential investors, financial analysts, and other stakeholders could use these research findings to determine the enterprise characteristics impact on the AID quality. Moreover, regulators could increase the standards of information transparency and comparability.
Author Contributions
Conceptualization, R.K. and D.T.; methodology, R.K. and G.K.-S.; software, G.K.-S.; validation, R.K., G.K.-S. and D.T.; formal analysis, R.K. and G.K.-S.; investigation, G.K.-S.; resources, R.K. and G.K.-S.; data curation, R.K.; writing—original draft preparation, R.K. and G.K.-S.; writing—review and editing, R.K., G.K.-S. and D.T.; visualization, R.K. and G.K.-S.; supervision, R.K.; project administration, R.K.; funding acquisition, D.T. All authors have read and agreed to the published version of the manuscript.
Funding
This research received no external funding.
Acknowledgments
The authors express their gratitude to the business newspaper “Verslo žinios” (English: “Business News”), Creditinfo Lietuva, the State Enterprise Centre of Registers for data provided for the development of research.
Conflicts of Interest
The authors declare no conflict of interest.
Appendix A
Table A1.
Components of disclosure quality index DQI1.
Table A1.
Components of disclosure quality index DQI1.
| DQI Component Code | Requirements, According to BAS 6 (2015) | Reference (According to BAS) | Mandatory Requirement for the Financial Year 2016 | Mandatory Requirement for the Financial Year 2008 | Score |
|---|---|---|---|---|---|
| G | General requirements: | ||||
| G1 | Accounting policies of assets and its change: | ||||
| MSMLE1.1 | Assets measurement basis (methods) | Art. 28.1 of BAS 6 | Yes | Yes | 1 |
| MSMLE1.2 | Disclosure of the change in the accounting policies of assets. | Art. 31 of BAS 6 | Yes | Yes | 1 |
| G2 | Change of the carrying amount of an asset during the reporting period. | ||||
| MSMLE2 | The financial statements shall disclose, for each class of non-current tangible assets presented in financial statements at the acquisition cost or revalued amount, and investment property presented in financial statements at the acquisition cost: | ||||
| MSMLE2.1 | Cost or revalued amount at the beginning and at the end of the reporting period. | Art. 33.2.1 of BAS 6 | Yes | Yes | 1 |
| MSMLE2.2 | The value of assets acquired during the reporting period. | Art. 33.2.2 of BAS 6 | Yes | Yes | 1 |
| MSMLE2.3 | The assets disposed or written off: | -- | |||
| MSMLE2.3.1 | The value of assets disposed during the reporting period. | Art. 33.2.3 of BAS 6 | Yes | Yes | 1 |
| MSMLE2.3.2 | The value of assets written off. | Art. 33.2.4 of BAS 6 | Yes | Yes | 1 |
| MSMLE2.4 | Depreciation: | ||||
| MSMLE2.4.1 | Depreciation calculated during the reporting period. | Art. 33.2.7 of BAS 6 | Yes | Yes | 1 |
| MSMLE2.4.2 | Accumulated depreciation at the beginning and at the end of the reporting period. | Art. 33.2.8 of BAS 6 | Yes | Yes | 1 |
| MSMLE2.5 | Impairment losses: | -- | |||
| MSMLE2.5.1 | The amount of impairment losses. | Art. 33.2.5 of BAS 6 | Yes | Yes | 1 |
| MSMLE2.5.2 | Impairment losses presented in the statement of profit or loss: | -- | |||
| MSMLE2.5.2.1 | The amount of impairment losses recognised in the statement of profit or loss. | Art. 33.4.1 of BAS 6 | Yes | No | 1 |
| MSMLE2.5.2.2 | The amount of impairment losses reversed in the statement of profit or loss. | Art. 33.4.2 of BAS 6 | Yes | No | 1 |
| MSMLE2.6 | Revaluation: | -- | |||
| MSMLE2.6.1 | The amount of revaluation. | Art. 33.2.6 of BAS 6 | Yes | No | 1 |
| MSMLE2.6.2 | The change of the revaluation surplus for the reporting period. | Art. 33.2.9 of BAS 6 | Yes | No | 1 |
| MSMLE2.6.3 | Taxation, if any, resulting from the revaluation of the asset. | Art. 33.2.10 of BAS 6 | Yes | No | 1 |
| MSMLE2.6.4 | For non-current tangible assets presented in financial statements at the revalued amount, the carrying amount to be recognised if accounted under the cost method. | Art. 33.2.11 of BAS 6 | Yes | No | 1 |
| MSMLE3 | The financial statements shall disclose, for each class of investment property presented in financial statements at the fair value: | -- | |||
| MSMLE3.1 | The carrying amount at the beginning and at the end of the reporting period. | Art. 33.3.1 of BAS 6 | Yes | Yes | 1 |
| MSMLE3.2 | The value of assets acquired during the reporting period. | Art. 33.3.2 of BAS 6 | Yes | Yes | 1 |
| MSMLE3.3 | The assets disposed or written off: | -- | |||
| MSMLE3.3.1 | The value of assets disposed during the reporting period. | Art. 33.3.3 of BAS 6 | Yes | Yes | 1 |
| MSMLE3.3.2 | The value of assets written off. | Art. 33.3.4 of BAS 6 | Yes | Yes | 1 |
| MSMLE3.5 | The change in the fair value: | -- | |||
| MSMLE3.5.1 | The change in the fair value during the financial year. | Art. 33.3.5 of BAS 6 | Yes | Yes | 1 |
| MSMLE3.5.2 | Gains or losses arising from the changes in the fair value of investment property and recognised in the statement of profit or loss. | Art. 33.3.6 of BAS 6 | Yes | Yes | 1 |
| MSMLE3.5.3 | Significant assumptions and methods on which the measurement of the fair value of investment property is based. | Art. 33.3.7 of BAS 6 | Yes | Yes | 1 |
| Requirements in total | 22 | 16 |
Source: author’s calculations based on Business Accounting Standards. Abbreviations used: Art.= Article; BAS 6= Business Accounting Standard 6 “Explanatory notes” (BAS 6 2015).
Table A2.
Components of disclosure quality index DQI2.
Table A2.
Components of disclosure quality index DQI2.
| DQI Component Code | Requirements, according to BAS 6 (2015) | Reference (According to BAS) | Mandatory Requirement for the Financial Year 2016 | Mandatory Requirement for the Financial Year 2008 | Score |
|---|---|---|---|---|---|
| G | General requirements: | ||||
| G1 | Accounting policies of assets and its change: | ||||
| G1.2 | The minimum cost of non-current tangible assets set by the entity. | Art. 56.3 of BAS 6 | MMLE | 100.5 | |
| G1.3 (MSMLE1.1) | Assets measurement basis (methods) | Art. 28.1 of BAS 6 | MSMLE | MSMLE | 1 |
| G1.4 | Asset depreciation method for each class of non-current tangible assets presented in financial statements at the acquisition cost or revalued amount, and investment property presented in financial statements at the acquisition cost: | Art. 56.1 of BAS 6 | MMLE | 100.9 | |
| G1.5 | The useful life for each class of non-current tangible assets presented in financial statements at the acquisition cost or revalued amount, and investment property presented in financial statements at the acquisition cost: | Art. 56.1 of BAS 6 | MMLE | 100.9 | |
| G1.7 (MSMLE1.2) | Disclosure of the change in the accounting policies of assets. | Art. 31 of BAS 6 | MSMLE | 100.5 | 1 |
| G2 (MSMLE2 + MSMLE3) | Change of the carrying amount of an asset during the reporting period. | Art. 33.2 of BAS 6 | MSMLE | MSMLE | 2008–15; 2016–20 |
| G3 | Other information disclosed: | ||||
| G3.1 | Fully depreciated assets that is still in use, and its acquisition cost. | Art. 56.5 of BAS 6 | MMLE | 100.11 | |
| G3.2 | Assets used as collateral and other restrictions of ownership rights. | Art. 56.4 of BAS 6 | MMLE | 100.7. | |
| G3.3 | In case of the revaluation of assets—reasons for revaluation, periodicity and the result of the revaluation. | Art. 56.2 of BAS 6 | MMLE | 100.10 | |
| G3.4 | In case when one portion of a property is held to earn rentals and/or for capital appreciation and another portion is held for use in the production or supply of goods or services or for administrative purposes, the criteria for determining the significance of these portions, and their sizes and values. | Art. 56.6 of BAS 6 | MMLE | 100.12 | |
| G3.5 | Presentation of the accounting estimates. | Art. 54 of BAS 6 | MMLE |
Source: Author’s calculations based on Business Accounting Standards. Abbreviations used: Art.—Article; BAS 6—Business Accounting Standard 6 “Explanatory notes”; MSMLE—Mandatory MMLE—Mandatory requirement for medium and large enterprises). This disclosure is voluntary for small enterprises.
Table A3.
Components of disclosure quality index DQI3.
Table A3.
Components of disclosure quality index DQI3.
| DQI Component Code | Requirements, According to BAS 6 (2015) and BAS 12 (2015) | Reference (According to BASs) | Mandatory Requirement for the Financial Year 2016 | Mandatory Requirement for the Financial Year 2008 | Score |
|---|---|---|---|---|---|
| G | General requirements: | ||||
| G0 | Definition of non-current tangible assets: | ||||
| G0.1 | Presentation of the definition of non-current tangible assets in explanatory notes. | Part II of BAS 12 | V | V | 1 |
| G0.2 | Presentation of the recognition criteria of non-current tangible assets in explanatory notes. | Art. 7 of BAS 12 | V | V | 1 |
| G1 | Accounting policies of assets and its change: | ||||
| G1.1 | Asset recognition methods. | Art. 11–28 of BAS 12 | V | V | 1 |
| G1.2 | The minimum cost of non-current tangible assets set by the entity. | Art. 56.3 of BAS 6 | MMLE | 100.5 | |
| G1.3 (MSMLE1.1) | Assets measurement basis (methods) | Art. 28.1 of BAS 6 | MSMLE | MSMLE | 1 |
| G1.4 | Asset depreciation method for each class of non-current tangible assets presented in financial statements at the acquisition cost or revalued amount, and investment property presented in financial statements at the acquisition cost: | Art. 56.1 of BAS 6 | MMLE | 100.9 | |
| G1.5 | The useful life for each class of non-current tangible assets presented in financial statements at the acquisition cost or revalued amount, and investment property presented in financial statements at the acquisition cost: | Art. 56.1 of BAS 6 | MMLE | 100.9 | |
| G1.6 | Presentation of the residual value of an asset in explanatory notes. | Art. 56 of BAS 12 | V | V | 1 |
| G1.7 (MSMLE1.2) | Disclosure of the change in the accounting policies of assets. | Art. 31 of BAS 6 | MSMLE | 100.5 | 1 |
| G2 (MSMLE2 + MSMLE3) | Change of the carrying amount of an asset during the reporting period. | Art. 33.2 of BAS 6 | MSMLE | MSMLE | 2008–15; 2016–20 |
| G3 | Other information disclosed: | ||||
| G3.1 | Fully depreciated assets that is still in use, and its acquisition cost. | Art. 56.5 of BAS 6 | MMLE | 100.11 | |
| G3.2 | Assets used as collateral and other restrictions of ownership rights. | Art. 56.4 of BAS 6 | MMLE | 100.7. | |
| G3.3 | In case of the revaluation of assets—reasons for revaluation, periodicity and the result of the revaluation. | Art. 56.2 of BAS 6 | MMLE | 100.10 | |
| G3.4 | In case when one portion of a property is held to earn rentals and/or for capital appreciation and another portion is held for use in the production or supply of goods or services or for administrative purposes, the criteria for determining the significance of these portions, and their sizes and values. | Art. 56.6 of BAS 6 | MMLE | 100.12 | |
| G3.5 | Presentation of the accounting estimates. | Art. 54 of BAS 6 | MMLE |
Source: Author’s calculations based on Business Accounting Standards. Abbreviations used: Art.—Article; BAS 6—Business Accounting Standard 6 “Explanatory notes”; BAS 12—Business Accounting Standard 12 “Non-current Tangible Assets” (BAS 12 2015); V—Voluntary information; MSMLE—Mandatory requirement for all enterprises (small, medium, and large); MMLE—Mandatory requirement for medium and large enterprises). This disclosure is voluntary for small enterprises.
Appendix B
Table A4.
Summary of descriptive statistics of model variables.
Table A4.
Summary of descriptive statistics of model variables.
| Variable | Observations | Minimum | Maximum | Mean | Median | Standard Deviation |
|---|---|---|---|---|---|---|
| Dependent variables: | ||||||
| DQ1Ijt | 111 | 0 | 89 | 63.2883 | 69 | 21.3989 |
| DQI2jt | 111 | 0 | 100 | 69.5946 | 71 | 16.9916 |
| DQI3jt | 111 | 0 | 85 | 55.2342 | 54 | 14.2784 |
| Independent variables: | ||||||
| TEmpjt | 108 | 1 | 8094 | 807.4815 | 330 | 1409.956 |
| lnTAjt | 109 | 13.9163 | 19.9834 | 17.3301 | 17.3002 | 1.0682 |
| lnSjt | 109 | 11.6920 | 20.3964 | 17.3360 | 17.2604 | 1.6392 |
| TL/TAjt | 109 | 0.8758 | 475.9494 | 57.8240 | 53.0134 | 52.7081 |
| LTL/TAjt | 109 | 0 | 94.2828 | 15.3716 | 8.4269 | 18.3849 |
| CA/CLjt | 109 | 0.0486 | 10.6439 | 1.6679 | 1.2427 | 1.5057 |
| lnTLjt | 109 | 13.0901 | 19.7289 | 16.5643 | 16.5059 | 1.2546 |
| TngA/TAjt | 109 | 0 | 96.6773 | 38.8079 | 35.6808 | 27.2196 |
| lnTngAjt | 106 | 10.7265 | 19.0628 | 15.9899 | 16.3062 | 1.6094 |
| ROEjt | 109 | −147.8088 | 606.8884 | 23.5696 | 10.3763 | 83.9899 |
| ROAjt | 109 | −42.6119 | 373.2846 | 10.3466 | 4.7261 | 42.0551 |
| NP/Sjt | 109 | −324.2291 | 2967.951 | 55.0276 | 3.5076 | 336.7586 |
| Control variables: | ||||||
| TL/Sjt | 109 | 0.0252 | 49.8174 | 2.3494 | 0.3943 | 8.7114 |
| TngAperEmpjt | 106 | 0.0000 | 30599.51 | 499.2900 | 20.9876 | 3363.608 |
| SperEmpjt | 106 | 6.7439 | 3239.038 | 260.1253 | 80.8803 | 484.2239 |
| S/TngAjt | 106 | 0.0599 | 248.2497 | 31.1703 | 3.2679 | 121.2327 |
| S/TAjt | 109 | 0.0049 | 14.7294 | 1.7689 | 1.1454 | 2.2504 |
| TL/Ejt | 109 | −35.6602 | 9.6665 | 1.1994 | 1.1025 | 3.9365 |
Abbreviations used: DQI1jt—DQI_M_SMLE—disclosure quality index (DQI) formed by mandatory disclosed information required for all—small, medium, and large—enterprises; DQI2jt—DQI_(M_SMLE+ M_MLE)—disclosure quality index (DQI) formed by (a) mandatory disclosed information required for all—small, medium, and large—enterprises, and (b) additional disclosed information required for medium, and large enterprises; DQI3jt—DQI_(M_SMLE + M_MLE + V)—disclosure quality index (DQI) formed by (a) mandatory disclosed information required for all—small, medium, and large—enterprises, (b) additional disclosed information required for medium, and large enterprises, and (c) voluntarily disclosed information; TEmpjt—Size of enterprise measured as the average annual number of employees; lnTAjt—Size of enterprise measured as the natural logarithm of total assets; lnSjt—Size of enterprise measured as the natural logarithm of sales; TL/TAjt—Debt paying capacity of enterprise (Solvency) measured by the ratio of total liabilities-to-total assets; LTL/TAjt—Debt paying capacity of enterprise (Solvency) measured by the ratio of long-term liabilities-to-total assets; CA/CLjt—Debt paying capacity of enterprise (Liquidity) measured by the ratio of current assets-to-current liabilities; lnTLjt—Indebtedness of enterprise measured as the natural logarithm of total liabilities; TngA/TAjt—Tangible assets of enterprise measured by the ratio of tangible assets-to-total assets; lnTngAjt—Tangible assets of enterprise measured as the natural logarithm of tangible assets; ROEjt—Profitability of enterprise measured by the ratio of net profit-to-equity; ROAjt—Profitability of enterprise measured by the ratio of net profit-to-total assets; NP/Sjt = Profitability of enterprise measured by the ratio of net profit-to-sales; TL/Sjt—Debt turnover of enterprise measured by the ratio of total liabilities-to-sales; TngAperEmpjt—Tangible assets of enterprise measured as tangible assets divided by average annual number of employees; SperEmpjt—Revenue of enterprise measured as sales divided by the average annual number of employees; S/TngAjt = Tangible assets turnover measured by the ratio of sales-to-tangible assets; S/TAjt—Total assets turnover measured by the ratio of sales-to-total assets; TL/Ejt—Own financing of enterprise measured by the ratio of total liabilities-to-equity (see Table 1).
Table A5.
Accounting information disclosure of the tangible assets in the annual financial statements of the enterprises according to disclosure quality index (DQI1) components.
Table A5.
Accounting information disclosure of the tangible assets in the annual financial statements of the enterprises according to disclosure quality index (DQI1) components.
| DQI1 Component Code 1 | Financial Year | |||||
|---|---|---|---|---|---|---|
| 2007 | 2008 | 2016 | ||||
| The Number of Companies That Disclosed DQI Components | ||||||
| Amount | % | Amount | % | Amount | % | |
| MSMLE1.1 | 37 | 100.00 | 37 | 100.00 | 35 | 94.59 |
| MSMLE1.2 | 1 | 2.70 | 3 | 8.11 | 12 | 32.43 |
| MSMLE2.1 | 35 | 94.59 | 35 | 94.59 | 31 | 83.78 |
| MSMLE2.2 | 34 | 91.89 | 34 | 91.89 | 30 | 81.08 |
| MSMLE2.3.1 | 33 | 89.19 | 33 | 89.19 | 30 | 81.08 |
| MSMLE2.3.2 | 33 | 89.19 | 33 | 89.19 | 30 | 81.08 |
| MSMLE2.4.1 | 34 | 91.89 | 34 | 91.89 | 31 | 83.78 |
| MSMLE2.4.2 | 33 | 89.19 | 33 | 89.19 | 31 | 83.78 |
| MSMLE2.5.1 | 5 | 13.51 | 6 | 16.22 | 17 | 45.95 |
| MSMLE2.5.2.1 | n.r. | n.r. | n.r. | n.r. | 0 | 0.00 |
| MSMLE2.5.2.2 | n.r. | n.r. | n.r. | n.r. | 0 | 0.00 |
| MSMLE2.6.1 | n.r. | n.r. | n.r. | n.r. | 8 | 72.73 |
| MSMLE2.6.2 | n.r. | n.r. | n.r. | n.r. | 6 | 60.00 |
| MSMLE2.6.3 | n.r. | n.r. | n.r. | n.r. | 0 | 0.00 |
| MSMLE2.6.4 | n.r. | n.r. | n.r. | n.r. | 2 | 20.00 |
| MSMLE3.1 | 9 | 56.25 | 9 | 60.00 | 0 | 0.00 |
| MSMLE3.2 | 7 | 43.75 | 8 | 53.33 | 0 | 0.00 |
| MSMLE3.3.1 | 3 | 18.75 | 3 | 20.00 | 0 | 0.00 |
| MSMLE3.3.2 | 5 | 31.25 | 5 | 33.33 | 0 | 0.00 |
| MSMLE3.5.1 | 1 | 6.25 | 1 | 6.67 | 0 | 0.00 |
| MSMLE3.5.2 | 0 | 0.00 | 0 | 0.00 | 0 | 0.00 |
| MSMLE3.5.3 | 2 | 12.50 | 3 | 20.00 | 1 | 100.00 |
| N | 37 | |||||
Note: 1 The full name of disclosure index component is presented in Appendix A (Table A1). Three-colour coding is used to differentiate partial grouping of information disclosed by component. Each component divides enterprises into three groups of approximately equal size (into terciles): the top third ……., the middle third ……., and the bottom third ………. Abbreviations used: n—the number of enterprises analysed; n.r.—no requirement.
Summary of results presented in Appendix B, Table A5:
The disclosure of the DQI1 (i.e., disclosure quality index formed by mandatory disclosed information required for all—small, medium, and large—enterprises) components is the following:
1. The most frequent: MSMLE1.1, MSMLE2.1, MSMLE2.2, MSMLE2.3.1, MSMLE2.3.2, MSMLE2.4.1, MSMLE 2.4.2. Hence, the best disclosed is information on (i) assets measurement basis (methods) (MSMLE1.1); (ii) cost or revalued amount at the beginning and at the end of the reporting period (MSMLE2.1) and the value of assets acquired during the reporting period (MSMLE2.2); (iii) the value of assets disposed or written off during the reporting period (MSMLE2.3.1, MSMLE2.3.2), and (iv) depreciation of tangible assets (MSMLE2.4.1, MSMLE 2.4.2).
2. The least frequent: MSMLE1.2, MSMLE3.3.1, MSMLE3.3.2, MSMLE3.5.1, MSMLE3.5.2, MSMLE3.5.3. The least frequent disclosures are the following: (i) The change in the accounting policies of assets (MSMLE1.2); furthermore, regarding the component MSMLE1.2, it should be noted that if the notes do not specify the specific changes in accounting policies, but state that the accounting policies have not changed during the reporting period, then the changes in accounting policies in notes are considered to be disclosed; (ii) the value of the assets (investment property) disposed or written off (MSMLE3.3.1, MSMLE3.3.2), and (iii) the change in the fair value of investment property (MSMLE3.5.1, MSMLE3.5.2, MSMLE3.5.3).
Table A6.
Accounting information disclosure of the tangible assets in the annual financial statements of the enterprises according to disclosure quality index (DQI2) components.
Table A6.
Accounting information disclosure of the tangible assets in the annual financial statements of the enterprises according to disclosure quality index (DQI2) components.
| DQI2 Component Code 1 | Financial Year | |||||
|---|---|---|---|---|---|---|
| 2007 | 2008 | 2016 | ||||
| The Number of Companies That Disclosed DQI Components | ||||||
| Amount | % | Amount | % | Amount | % | |
| G1.2 | 29 | 78.38 | 29 | 78.38 | 27 | 72.97 |
| G1.3 (MSMLE1.1) * | 37 | 100.00 | 37 | 100.00 | 35 | 94.59 |
| G1.4 | 37 | 100.00 | 37 | 100.00 | 33 | 89.19 |
| G1.5 | 30 | 81.08 | 32 | 86.49 | 36 | 97.30 |
| G1.7 (MSMLE1.2) * | 1 | 2.70 | 3 | 8.11 | 12 | 32.43 |
| G3.1 | 20 | 54.05 | 20 | 54.05 | 24 | 64.86 |
| G3.2 | 20 | 54.05 | 21 | 56.76 | 23 | 62.16 |
| G3.3 | 0 | 0.00 | 0 | 0.00 | 1 | 11.11 |
| G3.4 | 0 | 0.00 | 0 | 0.00 | 2 | 22.22 |
| G3.5 | 35 | 94.59 | 35 | 94.59 | 36 | 97.30 |
| n | 37 | |||||
Note: 1 The full name of disclosure index component is presented in Appendix A (Table A2). * This component is included into DQI1. Three-colour coding is used to differentiate partial grouping of information disclosed by component. Each component divides enterprises into three groups of approximately equal size (into terciles): The top third ……., the middle third ……., and the bottom third ………. Abbreviations used: n—the number of enterprises analysed.
Summary of results presented in Appendix B, Table A6:
The disclosure of the DQI2 components is the following:
1. The most frequent are G1.2, G1.3, G1.4, G1.5, and G3.5. The best disclosed is information on (i) the minimum cost of tangible assets set by the entity (G1.2); (ii) assets measurement basis (methods) (G1.3); (iii) asset depreciation method for each class of tangible assets and investment property (G1.4); (iv) the useful life for each class of tangible assets and investment property (G1.5); and (v) presentation of the accounting estimates (G3.5).
2. The least frequent are G1.7, G3.3, and G3.4. The least frequent disclosures are the following: (i) The change in the accounting policies of assets (G1.7), (ii) the reasons for revaluation, periodicity, and the result of the revaluation (G3.3), and (iii) when one portion of a property is held to earn rentals and/or for capital appreciation and another portion is held for use in the production or supply of goods or services or for administrative purposes, the criteria for determining the significance of these portions, and their sizes and values (G3.4).
Table A7.
Accounting information disclosure of the tangible assets in the annual financial statements of the enterprises according to disclosure quality index (DQI3) components.
Table A7.
Accounting information disclosure of the tangible assets in the annual financial statements of the enterprises according to disclosure quality index (DQI3) components.
| DQI3 Component Code 1 | Financial Year | |||||
|---|---|---|---|---|---|---|
| 2007 | 2008 | 2016 | ||||
| The Number of Companies That Disclosed DQI Components | ||||||
| Amount | % | Amount | % | Amount | % | |
| G0.1 | 6 | 16.22 | 5 | 13.51 | 1 | 2.70 |
| G0.2 | 4 | 10.81 | 5 | 13.51 | 3 | 8.11 |
| G1.1 | 14 | 37.84 | 14 | 37.84 | 16 | 43.24 |
| G1.2 ** | 29 | 78.38 | 29 | 78.38 | 27 | 72.97 |
| G1.3 (MSMLE1.1) * | 37 | 100.00 | 37 | 100.00 | 35 | 94.59 |
| G1.4 ** | 37 | 100.00 | 37 | 100.00 | 33 | 89.19 |
| G1.5 ** | 30 | 81.08 | 32 | 86.49 | 36 | 97.30 |
| G1.6 | 9 | 24.32 | 9 | 24.32 | 10 | 27.03 |
| G1.7 (MSMLE1.2) * | 1 | 2.70 | 3 | 8.11 | 12 | 32.43 |
| G3.1 ** | 20 | 54.05 | 20 | 54.05 | 24 | 64.86 |
| G3.2 ** | 20 | 54.05 | 21 | 56.76 | 23 | 62.16 |
| G3.3 ** | 0 | 0.00 | 0 | 0.00 | 1 | 11.11 |
| G3.4 ** | 0 | 0.00 | 0 | 0.00 | 2 | 22.22 |
| G3.5 ** | 35 | 94.59 | 35 | 94.59 | 36 | 97.30 |
| N | 37 | |||||
Note: 1 The full name of the disclosure index component is presented in Appendix A (Table A3). * This component is included in DQI1 and DQI2. ** This component is included in DQI2. Three-colour coding is used to differentiate partial grouping of information disclosed by component. Each component divides enterprises into three groups of approximately equal size (into terciles): The top third ……., the middle third ……., and the bottom third ………. Abbreviations used: n—the number of enterprises analysed.
Summary of results presented in Appendix B, Table A7:
During the investigated period, in the notes, the number of cases of information disclosure on tangible assets had increased according to the following DQI3 components: G1.1, G1.5, G1.6, G1.7, G3.1—G3.5 (Appendix C, Table A18). It can be concluded that in an overall analysis of the frequency of disclosure of tangible assets in notes of enterprises, the disclosure of the DQI3 components is:
1. The most frequent: G1.2, G1.3, G1.4, G1.5, G3.5. It is worth mentioning that these components are included in DQI2. Moreover, the best-disclosed components are equal, as in the case of the DQI2.
2. The least frequent: (i) The G1.7 component included in DQI1 and DQI2, (ii) the G3.3 and G3.4 included in DQI2; and (iii) the definition and recognition criteria of tangible assets (G0.1, G0.2), i.e., new components.
Table A8.
The assessment of normality of the DQI data using Shapiro–Wilk test.
Table A8.
The assessment of normality of the DQI data using Shapiro–Wilk test.
| Statistic | df | Sig. | |
|---|---|---|---|
| DQI12007 | 0.809 | 37 | 0.000 |
| DQI12008 | 0.776 | 37 | 0.000 |
| DQI12016 | 0.757 | 37 | 0.000 |
| DQI22007 | 0.927 | 37 | 0.018 |
| DQI22008 | 0.911 | 37 | 0.006 |
| DQI22016 | 0.867 | 37 | 0.000 |
| DQI32007 | 0.972 | 37 | 0.479 |
| DQI32008 | 0.982 | 37 | 0.803 |
| DQI32016 | 0.908 | 37 | 0.005 |
Abbreviations used: df—degrees of freedom; Sig.—significance.
Summary of results presented in Appendix B, Table A8:
The results of Shapiro–Wilk’s test have shown that the most of data come from a not normally distributed population ((i) DQI1: p = 0.000 in 2007; p = 0.000 in 2008; p = 0.000 in 2016; p < α = 0.05; (ii) DQI2: p = 0.018 in 2007; p = 0.006 in 2008; p = 0.000 in 2016; p < α = 0.05; (iii) DQI3: p = 0.479 in 2007; p = 0.803 in 2008; p > α = 0.05, but p = 0.005 in 2016; p < α = 0.05).
Table A9.
Comparison of DQI samples—Wilcoxon signed-ranks test.
Table A9.
Comparison of DQI samples—Wilcoxon signed-ranks test.
| DQI12007-DQI12008 | DQI12008-DQI12016 | DQI12007-DQI12016 | DQI22007-DQI22008 | DQI22008-DQI22016 | DQI22007-DQI22016 | DQI32007-DQI32008 | DQI32008-DQI32016 | DQI32007-DQI32016 | |
|---|---|---|---|---|---|---|---|---|---|
| Z | −1.724 ab | −2.273 b | −1.533 b | −0.432 a | −2.680 a | −2.638 a | −0.394 a | −2.049 a | −1.926 a |
| Asymp. Sig. | 0.085 | 0.023 | 0.125 | 0.666 | 0.007 | 0.008 | 0.693 | 0.040 | 0.054 |
Abbreviations used: Asymp. Sig.—asymptotic significance, a —based on positive ranks; b—based on negative ranks.
Summary of results presented in Appendix B, Table A9:
The results indicated that DQI1 mean level decreased from 64.47 (SD = 21.24) in 2007 to 58.52 (SD = 22.28) in 2016, as is seen in Table 3. However, this difference was not statistically significant (Z2007–2016 = −1.533, p = 0.125, p > α = 0.05) (Appendix B, Table A9). Results showed the mean difference between two samples in year 2008 compared to year 2007 is equal to zero, too (Z2007–2008 = −1.724, p = 0.085, p > α = 0.05). In contrast, the difference between year 2016 and year 2008 was statistically significant (Z2008–2016 = −2.273, p = 0.023; p < α = 0.05). Consequently, it can be stated that there is no statistically significant difference between DQI1 values in 2007–2016 and 2007–2008. However, there is a statistically significant difference between DQI1 values in 2008–2016, i.e., disclosure of mandatory information (for all enterprises) (measured by DQI1) did not decrease for 2007–2016 and 2007–2008 but decreased for 2008–2016.
The results also showed that DQI2 mean level increased from 66.90 (SD = 15.59) in 2007 to 74.51 (SD = 19.51) in 2016, as is seen in Table 3. Wilcoxson signed-ranks test indicated that this difference was statistically significant (Z2007–2016 = −2.638, p = 0.008, p < α = 0.05) (Appendix B, Table A9). Results also showed that the mean difference between samples in year 2016 compared to year 2008 was significant, too (Z2008–2016 = −2.680, p = 0.007, p < α = 0.05). In contrast, the difference between year 2007 and year 2008 was statistically insignificant (Z2007–2008 = −0.432, p = 0.666; p > α = 0.05). As a result, it can be stated that there is no statistically significant difference between DQI2 values in 2007–2008. However, there is a statistically significant difference between DQI2 values in 2007–2016 and 2008–2016. Hence, disclosure of the information on tangible assets (measured by DQI2) did not increase for 2007–2008. Moreover, the disclosure increased for 2007–2016 and 2008–2016.
Finally, the results revealed that DQI3 mean level increased from 53.60 (SD = 13.80) in 2007 to 57.83 (SD = 16.05) in 2016 as it is seen in Table 3. However, Wilcoxson signed-ranks test indicated that this difference was statistically insignificant (Z2007–2016 = −1.926, p = 0.054, p > α = 0.05) (Appendix B, Table A9). Results also showed that the mean differences between year 2007 to year 2008 were statistically insignificant, too (Z2007–2008 = −0.394, p = 0.693; p > α = 0.05), while the mean difference between samples in year 2016 compared to year 2008 was significant (Z2008–2016 = −2.049, p = 0.040, p < α = 0.05). Therefore, it can be stated that there is no statistically significant difference between DQI3 values in 2007–2016 and 2007–2008, but there is a statistically significant difference between DQI3 values in 2008–2016. Hence, disclosure of information (measured by DQI3) did not increase for 2007–2016 and 2007–2008 and it increased for 2008–2016.
Table A10.
DQI1 factors binary panel regression models.
Table A10.
DQI1 factors binary panel regression models.
| Variable | Model Const. | Coef. | t-Value | p-Stat | Signif. | R | Observ. |
|---|---|---|---|---|---|---|---|
| TEmpjt | 61.1235 | 0.0022 | 1.5251 | 0.1302 | Insig | 0.0215 | 108 |
| lnTAjt | 89.2209 | −1.4649 | −0.7838 | 0.4340 | Insig | 0.0057 | 109 |
| lnSjt | −17.0822 | 4.6676 | 4.1126 | 0.0001 | 99% c.l. | 0.1365 | 109 |
| TL/TAjt | 61.9219 | 0.0331 | 0.8740 | 0.3841 | Insig | 0.0071 | 109 |
| LTL/TAjt | 63.6322 | 0.0132 | 0.1089 | 0.9039 | Insig | 0.0001 | 109 |
| CA/CLjt | 68.2051 | −2.6203 | −2.0074 | 0.0472 | 95% c.l. | 0.0363 | 109 |
| lnTLjt | 42.7069 | 1.2755 | 0.8017 | 0.4245 | Insig | 0.0059 | 109 |
| TngA/TAjt | 57.8450 | 0.1543 | 2.1430 | 0.0344 | 95% c.l. | 0.0412 | 109 |
| lnTngAjt | 34.0217 | 1.9379 | 1.6636 | 0.0992 | 90% c.l. | 0.0259 | 106 |
| ROEjt | 63.4788 | 0.0151 | 0.6349 | 0.5268 | Insig | 0.0038 | 109 |
| ROAjt | 63.5109 | 0.0313 | 0.6589 | 0.5114 | Insig | 0.0040 | 109 |
| NP/Sjt | 64.9945 | −0.0211 | −3.7733 | 0.0003 | 99% c.l. | 0.1147 | 109 |
| TL/Sjt | 66.6258 | −1.1879 | −5.6977 | 0.0000 | 99% c.l. | 0.2479 | 109 |
| TngAperEmpjt | 63.6436 | −0.0003 | −0.5038 | 0.6155 | Insig | 0.0025 | 106 |
| SperEmpjt | 64.8472 | −0.0052 | −1.2414 | 0.2172 | Insig | 0.0146 | 106 |
| S/TngAjt | 66.0583 | −0.0337 | −2.1968 | 0.0303 | 95% c.l. | 0.0443 | 106 |
| S/TAjt | 59.9153 | 2.2158 | 2.5661 | 0.0117 | 95% c.l. | 0.0578 | 109 |
| TL/Ejt | 63.2006 | 0.5288 | 1.0450 | 0.2984 | Insig | 0.0101 | 109 |
Abbreviations used: TEmpjt—Size of enterprise measured as the average annual number of employees; lnTAjt—Size of enterprise measured as the natural logarithm of total assets; lnSjt—Size of enterprise measured as the natural logarithm of sales; TL/TAjt—Debt paying capacity of enterprise (Solvency) measured by the ratio of total liabilities-to-total assets; LTL/TAjt—Debt paying capacity of enterprise (Solvency) measured by the ratio of long-term liabilities-to-total assets; CA/CLjt—Debt paying capacity of enterprise (Liquidity) measured by the ratio of current assets-to-current liabilities; lnTLjt—Indebtedness of enterprise measured as the natural logarithm of total liabilities; TngA/TAjt—Tangible assets of enterprise measured by the ratio of tangible assets-to-total assets; lnTngAjt—Tangible assets of enterprise measured as the natural logarithm of tangible assets; ROEjt—Profitability of enterprise measured by the ratio of net profit-to-equity; ROAjt—Profitability of enterprise measured by the ratio of net profit-to-total assets; NP/Sjt—Profitability of enterprise measured by the ratio of net profit-to-sales; TL/Sjt—Debt turnover of enterprise measured by the ratio of total liabilities-to-sales; TngAperEmpjt—Tangible assets of enterprise measured as tangible assets divided by average annual number of employees; SperEmpjt = Revenue of enterprise measured as sales divided by the average annual number of employees; S/TngAjt—Tangible assets turnover measured by the ratio of sales-to-tangible assets; S/TAjt—Total assets turnover measured by the ratio of sales-to-total assets; TL/Ejt—Own financing of enterprise measured by the ratio of total liabilities-to-equity (see Table 1); Model Const.—Model constant; Coef.—Coefficient; p-Stat—p-Statistics; Signif.—significance; Observ.—Observations; Insig.—Insignificant.
Table A11.
Primary DQI1 factors multivariate panel regression models.
Table A11.
Primary DQI1 factors multivariate panel regression models.
| Variable | Coef. | t-Value | p-Stat | Coef. | t-Value | p-Stat | Coef. | t-Value | p-Stat | Coef. | t-Value | p-Stat |
|---|---|---|---|---|---|---|---|---|---|---|---|---|
| Model I | Model II | Model III | Model IV | |||||||||
| C | 49.4077 | 1.7449 | 0.0840 ** | 65.1374 | 2.2095 | 0.0294 *** | 95.3514 | 3.0691 | 0.0028 **** | 88.5749 | 3.0328 | 0.0031 **** |
| lnSjt | 6.2475 | 4.0173 | 0.0001 **** | 4.9798 | 2.5275 | 0.0131 *** | −3.1927 | −0.8903 | 0.3755 * | −2.1750 | −0.6346 | 0.5272 * |
| CA/CLjt | −2.1637 | −1.5313 | 0.1288 * | −3.2181 | −1.6799 | 0.0961 ** | −1.5644 | −0.8314 | 0.4078 * | −1.1907 | −0.6234 | 0.5345 * |
| lnTLjt | −5.6424 | −2.7408 | 0.0072 **** | −6.7507 | −2.5693 | 0.0117 *** | 1.8429 | 0.5437 | 0.5879 * | −2.555 | −0.9050 | 0.4806 * |
| TngA/TAjt | 0.0936 | 1.3963 | 0.1656 * | −0.0634 | −0.8693 | 0.3868 * | ||||||
| lnTngAjt | 1.9109 | 1.4627 | 0.1467 * | −1.5735 | −0.9050 | 0.3677 * | ||||||
| NP/Sjt | −0.0079 | −1.2672 | 0.2079 * | −0.0103 | −1.6121 | 0.1101 * | −0.0141 | −2.2422 | 0.0272 *** | −0.0134 | −2.1751 | 0.0320 *** |
| TL/Sjt | −1.2588 | −2.9002 | 0.0046 **** | −1.2124 | −2.8871 | 0.0048 **** | ||||||
| S/TngAjt | −0.0415 | −2.7806 | 0.0065 **** | −0.0494 | −2.5463 | 0.0125 *** | ||||||
| S/TAjt | 2.1016 | 2.0153 | 0.0466 *** | 1.7411 | 1.7046 | 0.0915 ** | ||||||
| Model summary | R = 0.2557 | R = 0.1627 | R = 0.2760 | R = 0.2764 | ||||||||
| F-statistic = 7.0767 | F-statistic = 3.8873 | F-statistic = 4.6223 | F-statistic = 4.6332 | |||||||||
| Prob. = 0.0000 | Prob. = 0.0029 | Prob. = 0.0001 | Prob. = 0.0001 | |||||||||
| Observations = 109 | Observations = 106 | Observations = 106 | Observations = 106 | |||||||||
* Insignificant, ** 90% c.l, *** 95% c.l., **** 99% c.l. Abbreviations used: C = Constant; lnSjt—Size of enterprise measured as the natural logarithm of sales; CA/CLjt—Debt paying capacity of enterprise (Liquidity) measured by the ratio of current assets-to-current liabilities; lnTLjt—Indebtedness of enterprise measured as the natural logarithm of total liabilities; TngA/TAjt—Tangible assets of enterprise measured by the ratio of tangible assets-to-total assets; lnTngAjt—Tangible assets of enterprise measured as the natural logarithm of tangible assets; NP/Sjt—Profitability of enterprise measured by the ratio of net profit-to-sales; TL/Sjt—Debt turnover of enterprise measured by the ratio of total liabilities-to-sales; S/TngAjt—Tangible assets turnover measured by the ratio of sales-to-tangible assets; S/TAjt—Total assets turnover measured by the ratio of sales-to-total assets (see Table 1); Coef.—Coefficient; p-Stat—p-Statistics; Prob.—Probability.
Summary of results presented in Appendix B, Table A11:
Whereas certain significant independent variables (showing the tangible assets of enterprise: TngA/TAjt and lnTngAjt) moderately correlate with each other (Corr(TngA/TAjt, lnTngAjt) = 0.6214, they cannot be applied in the same panel regression model. Consequently, four primary multivariate linear regression models with dependent (DQI1) and five independent variables (lnSjt, CA/CLjt, lnTLjt, NP/Sjt, and TngA/TAjt or lnTngAjt) and three selected control variables are created.
Model I includes five independent variables (including TngA/TAjt), Model II includes five independent variables (including lnTngAjt), Model III includes five independent variables (including TngA/TAjt) and three selected control variables, and Model IV includes five independent variables (including lnTngAjt) and three selected control variables.
Table A12.
DQI2 factors binary panel regression models.
Table A12.
DQI2 factors binary panel regression models.
| Variable | Model Const. | Coef. | t-Value | p-Stat | Signif. | R | Observ. |
|---|---|---|---|---|---|---|---|
| TEmpjt | 68.8947 | 0.0012 | 1.0563 | 0.2932 | Insig. | 0.0104 | 108 |
| lnTAjt | 70.8812 | −0.0259 | −0.0185 | 0.9853 | Insig | 0.0000 | 109 |
| lnSjt | 34.7761 | 2.0567 | 2.3044 | 0.0231 | 95% c.l. | 0.0473 | 109 |
| TL/TAjt | 73.1146 | −0.0464 | −1.6526 | 0.1040 | Insig | 0.0249 | 109 |
| LTL/TAjt | 72.1838 | −0.1140 | −1.4114 | 0.1610 | Insig | 0.0183 | 109 |
| CA/CLjt | 69.1524 | 0.7667 | 0.7723 | 0.4416 | Insig | 0.0055 | 109 |
| lnTLjt | 76.7244 | −0.3799 | −0.3182 | 0.7510 | Insig | 0.0009 | 109 |
| TngA/TAjt | 71.6253 | −0.0308 | −0.5596 | 0.5769 | Insig | 0.0029 | 109 |
| lnTngAjt | 73.4152 | −0.1593 | −0.1687 | 0.8663 | Insig | 0.0003 | 106 |
| ROEjt | 70.0848 | 0.0147 | 0.8262 | 0.4104 | Insig | 0.0063 | 109 |
| ROAjt | 70.0158 | 0.0401 | 1.1331 | 0.2597 | Insig | 0.0119 | 109 |
| NP/Sjt | 70.5308 | −0.0018 | −0.4069 | 0.6849 | Insig | 0.0015 | 109 |
| TL/Sjt | 71.4565 | −0.4364 | −2.6162 | 0.0102 | 95% c.l. | 0.0601 | 109 |
| TngAperEmpjt | 71.4145 | −0,0013 | −3.1195 | 0.0023 | 99% c.l. | 0.0856 | 106 |
| SperEmpjt | 72.7314 | −0.0076 | −2.5198 | 0.0133 | 95% c.l. | 0.575 | 106 |
| S/TngAjt | 71.1538 | −0.0092 | −0.7335 | 0.4649 | Insig | 0.0051 | 106 |
| S/TAjt | 69.4981 | 0.5175 | 0.7943 | 0.4288 | Insig | 0.0059 | 109 |
| TL/Ejt | 69.8098 | 0.5181 | 1.3727 | 0.1727 | Insig | 0.0173 | 109 |
Abbreviations used: TEmpjt—Size of enterprise measured as the average annual number of employees; lnTAjt—Size of enterprise measured as the natural logarithm of total assets; lnSjt—Size of enterprise measured as the natural logarithm of sales; TL/TAjt—Debt paying capacity of enterprise (Solvency) measured by the ratio of total liabilities-to-total assets; LTL/TAjt—Debt paying capacity of enterprise (Solvency) measured by the ratio of long-term liabilities-to-total assets; CA/CLjt—Debt paying capacity of enterprise (Liquidity) measured by the ratio of current assets-to-current liabilities; lnTLjt—Indebtedness of enterprise measured as the natural logarithm of total liabilities; TngA/TAjt—Tangible assets of enterprise measured by the ratio of tangible assets-to-total assets; lnTngAjt—Tangible assets of enterprise measured as the natural logarithm of tangible assets; ROEjt—Profitability of enterprise measured by the ratio of net profit-to-equity; ROAjt—Profitability of enterprise measured by the ratio of net profit-to-total assets; NP/Sjt—Profitability of enterprise measured by the ratio of net profit-to-sales; TL/Sjt—Debt turnover of enterprise measured by the ratio of total liabilities-to-sales; TngAperEmpjt—Tangible assets of enterprise measured as tangible assets divided by average annual number of employees; SperEmpjt—Revenue of enterprise measured as sales divided by the average annual number of employees; S/TngAjt—Tangible assets turnover measured by the ratio of sales-to-tangible assets; S/TAjt—Total assets turnover measured by the ratio of sales-to-total assets; TL/Ejt—Own financing of enterprise measured by the ratio of total liabilities-to-equity (see Table 1); Model Const.—Model constant; Coef.—Coefficient; p-Stat—p-Statistics; Signif.—Significance; Observ.—Observations; Insig.—Insignificant.
Summary of results presented in Appendix B, Table A12:
Based on the results of primary binary DQI2 factor models (t-value and p-statistics): (i) Three control variables (debt turnover (TL/Sjt), tangible assets per employee (TngAperEmpjt), and revenue per employee (SperEmpjt)), proved to be significant at the 95% confidence level and are selected for further calculations and (ii) three control variables (turnover of tangible and total assets (S/TngAjt, S/TAjt) and own financing of enterprise (TL/Ejt)) are eliminated from further research as insignificant.
Table A13.
Primary DQI2 factors multivariate panel regression models.
Table A13.
Primary DQI2 factors multivariate panel regression models.
| Variable | Coef. | t-Value | p-Stat | Coef. | t-Value | p-Stat | Coef. | t-Value | p-Stat |
|---|---|---|---|---|---|---|---|---|---|
| Model I | Model II | Model III | |||||||
| C | 61.3916 | 3.0962 | 0.0025 **** | 50.8676 | 2.3985 | 0.0184 *** | 37.4013 | 1.6981 | 0.0927 ** |
| lnSjt | 3.7337 | 3.2082 | 0.0018 **** | 1.4195 | 0.6712 | 0.5037 * | 1.3435 | 0.6468 | 0.5192 * |
| TL/TAjt | −0.0330 | −1.1724 | 0.2437 * | −0.0367 | −1.3071 | 0.1942 * | −0.0301 | −1.0786 | 0.2834 * |
| lnTLjt | −3.1688 | −2.0232 | 0.0456 *** | −0.0503 | −0.0216 | 0.9828 * | 1.0304 | 0.4242 | 0.6723 * |
| TngA/TAjt | −0.0398 | −0.7471 | 0.4567 * | −0.0244 | −0.4544 | 0.6506 * | −0.0632 | −1.1609 | 0.2485 * |
| ROAjt | 0.0249 | 0.7139 | 0.4769 * | 0.0244 | 0.7106 | 0.4790 * | 0.0216 | 0.6329 | 0.5283 * |
| TL/Sjt | −0.2172 | −0.7430 | 0.4592 * | −0.3151 | −1.0693 | 0.2875 * | |||
| TngAperEmpjt | −0.0009 | −2.0866 | 0.0395 *** | ||||||
| SperEmpjt | −0.0084 | −2.5108 | 0.0137 *** | ||||||
| Model summary | R = 0.1226 | R = 0.1627 | R = 0.1783 | ||||||
| F-statistic = 2.8779 | F-statistic = 2.7203 | F-statistic = 3.039 | |||||||
| Prob. = 0.0179 | Prob. = 0.0127 | Prob. = 0.0061 | |||||||
| Observations = 109 | Observations = 106 | Observations = 106 | |||||||
* Insignificant, ** 90% c.l, *** 95% c.l., **** 99% c.l. Abbreviations used: C—Constant; lnSjt = Size of enterprise measured as the natural logarithm of sales; TL/TAjt—Debt paying capacity of enterprise (Solvency) measured by the ratio of total liabilities-to-total assets; lnTLjt—Indebtedness of enterprise measured as the natural logarithm of total liabilities; TngA/TAjt—Tangible assets of enterprise measured by the ratio of tangible assets-to-total assets; ROAjt—Profitability of enterprise measured by the ratio of net profit-to-total assets; NP/Sjt—Profitability of enterprise measured by the ratio of net profit-to-sales; TL/Sjt—Debt turnover of enterprise measured by the ratio of total liabilities-to-sales; TngAperEmpjt—Tangible assets of enterprise measured as tangible assets divided by average annual number of employees; SperEmpjt—Revenue of enterprise measured as sales divided by the average annual number of employees (see Table 1); Coef.—Coefficient; p-Stat—p-Statistics; Prob.—Probability.
Summary of results presented in Appendix B, Table A13:
Whereas certain significant control variables (TngAperEmpjt and SperEmpjt) moderately correlate with each other (Corr(TngAperEmpjt,SperEmpjt) = 0.5870), they cannot be applied in the same panel regression model. Consequently, three primary multivariate linear regression models with dependent (DQI2) and five independent variables (lnSjt, TL/TAjt, lnTLjt, TngA/TAjt, and ROAjt) and two of three selected control variables are created.
Model I includes five independent variables, Model II includes five independent variables two selected control variables (TL/Sjt and TngAperEmpjt), and Model III includes five independent variables and two selected control variables (TL/Sjt and SperEmpjt).
Table A14.
Final DQI2 factors multivarte panel regression models.
Table A14.
Final DQI2 factors multivarte panel regression models.
| Variable | Coef. | t-Value | p-Stat | Coef. | t-Value | p-Stat | Coef. | t-Value | p-Stat |
|---|---|---|---|---|---|---|---|---|---|
| Model I | Model II | Model III | |||||||
| C | 64.0302 | 3.3181 | 0.0012 **** | 72.1795 | 49.1021 | 0.0000 **** | 24.5775 | 1.6460 | 0.1028 * |
| lnSjt | 3.8916 | 3.3894 | 0.0010 **** | 2.8045 | 3.2434 | 0.0016 **** | |||
| lnTLjt | −3.6865 | −2.4575 | 0.0156 *** | ||||||
| TL/Sjt | −0.3589 | −2.1985 | 0.0302 *** | ||||||
| TngAperEmpjt | −0.0012 | −2.7365 | 0.0073 **** | ||||||
| SperEmpjt | −0.0091 | −3.1114 | 0.0024 **** | ||||||
| Model summary | R = 0.0986 | R = 0.1265 | R = 0.1449 | ||||||
| F-statistic = 5.7996 | F-statistic = 7.4615 | F-statistic = 8.7252 | |||||||
| Prob. = 0.0041 | Prob. = 0.0009 | Prob. = 0.0003 | |||||||
| Observations = 109 | Observations = 106 | Observations = 106 | |||||||
* Insignificant, *** 95% c.l., **** 99% c.l. Abbreviations used: C—Constant; lnSjt—Size of enterprise measured as the natural logarithm of sales; lnTLjt—Indebtedness of enterprise measured as the natural logarithm of total liabilities; TL/Sjt—Debt turnover of enterprise measured by the ratio of total liabilities-to-sales; TngAperEmpjt—Tangible assets of enterprise measured as tangible assets divided by average annual number of employees; SperEmpjt—Revenue of enterprise measured as sales divided by the average annual number of employees (see Table 1); Coef.—Coefficient; p-Stat—p-Statistics; Prob.—Probability.
Summary of results presented in Appendix B, Table A14:
After checking all reasonable combinations of variables, the final DQI2 factors’ models are created. Having estimated the statistical characteristics of each independent variable included in the primary Model I, three irrelevant independent variables were eliminated from the model—debt paying capacity of enterprise (measured as TL/TAjt), tangible assets of enterprise (measured as TngA/TAjt), and profitability of enterprise (measured as ROAjt). One additional independent variable (indebtedness of enterprise (lnTLjt)) was eliminated from Model III and two additional variables (indebtedness of enterprise (lnTLjt) and size of enterprise (lnSjt)) were eliminated from Model II. Generally, in all of the three final DQI2 models, the variables—specific factors (enterprise’s characteristics)—are significant at least at the 95% confidence level.
Panel estimation of the AID quality measured by DQI2 in enterprises reveals that: (i) Two out of five selected independent variables (size of enterprise (lnSjt) (in Model I, Model III) and indebtedness of enterprise (lnTLjt) (in Model I) have a statistically significant impact on DQI2; while (ii) in the case of debt-paying capacity of enterprise (measured by the ratio of total liabilities to total assets (TL/TAjt)), tangible assets of enterprise (measured as the ratio of tangible assets to total assets (TngA/TAjt)), and profitability of enterprise (measured as the ratio of net profit to total assets (ROAjt)), no statistically significant impact was found (Model I).
Table A15.
DQI3 factors binary panel regression models.
Table A15.
DQI3 factors binary panel regression models.
| Variable | Model Const. | Coef. | t-Value | p-Stat | Signif. | R | Observ. |
|---|---|---|---|---|---|---|---|
| TEmpjt | 54.5137 | 0.0009 | 0.9602 | 0.3391 | Insig. | 0.0086 | 108 |
| lnTAjt | 60.5923 | −0.2729 | −0.2265 | 0.8213 | Insig. | 0.0005 | 109 |
| lnSjt | 27.5026 | 1.6359 | 2.1262 | 0.0358 | 95% c.l. | 0.0405 | 109 |
| TL/TAjt | 57.7249 | −0.0322 | −1.3245 | 0.1865 | Insig. | 0.0163 | 109 |
| LTL/TAjt | 57.0434 | −0.0768 | −1.1033 | 0.2724 | Insig. | 0.0112 | 109 |
| CA/CLjt | 55.6513 | 0.1266 | 0.1480 | 0.8826 | Insig. | 0.0002 | 109 |
| lnTLjt | 62.8718 | −0.4232 | −0.4127 | 0.6807 | Insig. | 0.0016 | 109 |
| TngA/TAjt | 54.4399 | 0.0367 | 0.7771 | 0.4388 | Insig. | 0.0056 | 109 |
| lnTngAjt | 46.0764 | 0.6401 | 0.7969 | 0.4273 | Insig. | 0.0061 | 106 |
| ROEjt | 55.6221 | 0.0102 | 0.6665 | 0.5065 | Insig. | 0.0041 | 109 |
| ROAjt | 55.6504 | 0.0292 | 0.9573 | 0.3406 | Insig. | 0.0082 | 109 |
| NP/Sjt | 56.1188 | −0.0047 | −1.2271 | 0.2225 | Insig. | 0.0139 | 109 |
| TL/Sjt | 56.9077 | −0.4449 | −3.1465 | 0.0021 | 99% c.l. | 0.0847 | 109 |
| TngAperEmpjt | 56.3497 | −0.0009 | −2.3204 | 0.0223 | 95% c.l. | 0.0492 | 106 |
| SperEmpjt | 57.5594 | −0.0063 | −2.4318 | 0.0169 | 95% c.l. | 0.0538 | 106 |
| S/TngAjt | 56.8449 | −0.0171 | −1.6209 | 0.1081 | Insig. | 0.0246 | 106 |
| S/TAjt | 55.3213 | 0.3059 | 0.5354 | 0.5935 | Insig. | 0.0027 | 109 |
| TL/Ejt | 55.4464 | 0.3869 | 1.0661 | 0.2888 | Insig. | 0.0105 | 109 |
Abbreviations used: TEmpjt—Size of enterprise measured as the average annual number of employees; lnTAjt—Size of enterprise measured as the natural logarithm of total assets; lnSjt—Size of enterprise measured as the natural logarithm of sales; TL/TAjt—Debt paying capacity of enterprise (Solvency) measured by the ratio of total liabilities-to-total assets; LTL/TAjt—Debt paying capacity of enterprise (Solvency) measured by the ratio of long-term liabilities-to-total assets; CA/CLjt—Debt paying capacity of enterprise (Liquidity) measured by the ratio of current assets-to-current liabilities; lnTLjt—Indebtedness of enterprise measured as the natural logarithm of total liabilities; TngA/TAjt—Tangible assets of enterprise measured by the ratio of tangible assets-to-total assets; lnTngAjt—Tangible assets of enterprise measured as the natural logarithm of tangible assets; ROEjt—Profitability of enterprise measured by the ratio of net profit-to-equity; ROAjt—Profitability of enterprise measured by the ratio of net profit-to-total assets; NP/Sjt—Profitability of enterprise measured by the ratio of net profit-to-sales; TL/Sjt—Debt turnover of enterprise measured by the ratio of total liabilities-to-sales; TngAperEmpjt—Tangible assets of enterprise measured as tangible assets divided by average annual number of employees; SperEmpjt—Revenue of enterprise measured as sales divided by the average annual number of employees; S/TngAjt—Tangible assets turnover measured by the ratio of sales-to-tangible assets; S/TAjt—Total assets turnover measured by the ratio of sales-to-total assets; TL/Ejt—Own financing of enterprise measured by the ratio of total liabilities-to-equity (see Table 1); Model Const.—Model constant; Coef.—Coefficient; p-Stat—p-Statistics; Signif.—significance; Observ. =— Observations; Insig.—Insignificant.
Summary of results presented in Appendix B, Table A15:
Based on the results of primary DQI3 regression models (t-value and p-statistics): (i) Three control variables (TL/Sjt, TngAperEmpjt, and SperEmpjt) proved to be significant at the 95% confidence level and are selected for further calculations and (ii) three control variables (S/TngAjt, S/TAjt and TL/Ejt) are eliminated from further research as insignificant.
Table A16.
Primary DQI3 factors multivariate panel regression models.
Table A16.
Primary DQI3 factors multivariate panel regression models.
| Variable | Coef. | t-Value | p-Stat | Coef. | t-Value | p-Stat | Coef. | t-Value | p-Stat |
|---|---|---|---|---|---|---|---|---|---|
| Model I | Model II | Model III | |||||||
| C | 49.7519 | 2.4924 | 0.0143 *** | 47.3085 | 2.2675 | 0.0256 *** | 30.0919 | 1.3904 | 0.1677 * |
| lnSjt | 2.5613 | 2.0146 | 0.0466 *** | 0.5959 | 0.3075 | 0.7501 * | 0.7490 | 0.4081 | 0.6841 * |
| TL/TAjt | −0.0255 | −0.6034 | 0.5476 * | −0.0200 | −0.4747 | 0.6361 * | −0.0392 | −0.9503 | 0.3444 * |
| lnTLjt | −3.0109 | −1.8933 | 0.0612 ** | −0.8749 | −0.4035 | 0.6875 * | 0.6021 | 0.2982 | 0.7662 * |
| lnTngAjt | 0.8156 | 0.8625 | 0.3905 * | 0.9419 | 0.9754 | 0.3319 * | 0.3916 | 0.4155 | 0.6787 * |
| NP/Sjt | −0.0012 | −0.2739 | 0.7847 * | −0.0017 | −0.3975 | 0.6919 * | −0.0008 | −0.1822 | 0.8558 * |
| TL/Sjt | −0.2284 | −0.7896 | 0.4317 * | −0.3235 | −1.1183 | 0.2663 * | |||
| TngAperEmpjt | −0.0007 | −1.6918 | 0.0940 ** | ||||||
| SperEmpjt | −0.0071 | −2.3613 | 0.0202 *** | ||||||
| Model summary | R = 0.0699 | R = 0.1045 | R = 0.1286 | ||||||
| F-statistic = 1.504 | F-statistic = 1.5828 | F-statistic = 2.002 | |||||||
| Prob. = 0.1952 | Prob. = 0.1498 | Prob. = 0.0626 | |||||||
| Observations = 106 | Observations = 106 | Observations = 106 | |||||||
* Insignificant, ** 90% c.l, *** 95% c.l., Abbreviations used: C—Constant; lnSjt—Size of enterprise measured as the natural logarithm of sales; TL/TAjt—Debt paying capacity of enterprise (Solvency) measured by the ratio of total liabilities-to-total assets; lnTLjt—Indebtedness of enterprise measured as the natural logarithm of total liabilities; lnTngAjt—Tangible assets of enterprise measured as the natural logarithm of tangible assets; NP/Sjt—Profitability of enterprise measured by the ratio of net profit-to-sales; TL/Sjt—Debt turnover of enterprise measured by the ratio of total liabilities-to-sales; TngAperEmpjt—Tangible assets of enterprise measured as tangible assets divided by average annual number of employees; SperEmpjt—Revenue of enterprise measured as sales divided by the average annual number of employees (see Table 1); Coef.—Coefficient; p-Stat—p-Statistics; Prob.—Probability.
Summary of results presented in Appendix B, Table A16:
Whereas certain significant control variables (TngAperEmpjt and SperEmpjt) moderately correlate with each other (Corr(TngAperEmpjt,SperEmpjt) = 0.5870), they cannot be applied in the same panel regression model. Consequently, three primary multivariate linear regression models with dependent (DQI3) and five independent variables (lnSjt, TL/TAjt, lnTLjt, lnTngAjt and NP/Sjt) and two of three selected control variables are created.
Model I includes five independent variables, Model II includes five independent variables and two selected control variables (TL/Sjt and TngAperEmpjt), and Model III includes five independent variables and two selected control variables (TL/Sjt and SperEmpjt).
Table A17.
Final DQI3 factors multivariate panel regression models.
Table A17.
Final DQI3 factors multivariate panel regression models.
| Variable | Coef. | t-Value | p-Stat | Coef. | t-Value | p-Stat | Coef. | t-Value | p-Stat |
|---|---|---|---|---|---|---|---|---|---|
| Model I | Model II | Model III | |||||||
| C | 52.4347 | 3.1501 | 0.0021 **** | 57.1989 | 45.2322 | 0.0000 **** | 58.5833 | 41.8748 | 0.0000 **** |
| lnSjt | 3.1997 | 3.2308 | 0.0016 **** | ||||||
| lnTLjt | −3.1418 | −2.4801 | 0.0169 *** | ||||||
| TL/Sjt | −0.3984 | −2.8373 | 0.0662 ** | −0.4414 | −3.2363 | 0.0016 **** | |||
| TngAperEmpjt | −0.3984 | −2.8372 | 0.0055 **** | ||||||
| SperEmpjt | −0.0062 | −2.5097 | 0.0136 *** | ||||||
| Model summary | R = 0.0911 | R = 0.1181 | R = 0.1411 | ||||||
| F-statistic = 5.3116 | F-statistic = 6.8997 | F-statistic = 8.4634 | |||||||
| Prob. = 0.0063 | Prob. = 0.0009 | Prob. = 0.0004 | |||||||
| Observations = 109 | Observations = 106 | Observations = 106 | |||||||
Insignificant, ** 90% c.l, *** 95% c.l., **** 99% c.l. Abbreviations used: C—Constant; lnSjt—Size of enterprise measured as the natural logarithm of sales; lnTLjt—Indebtedness of enterprise measured as the natural logarithm of total liabilities; TL/Sjt—Debt turnover of enterprise measured by the ratio of total liabilities-to-sales; TngAperEmpjt—Tangible assets of enterprise measured as tangible assets divided by average annual number of employees; SperEmpjt—Revenue of enterprise measured as sales divided by the average annual number of employees (see Table 1); Coef.—Coefficient; p-Stat—p-Statistics; Prob.—Probability.
Summary of results presented in Appendix B, Table A17:
After checking all reasonable combinations of variables, the final DQI3 factors’ models are created. Having estimated the statistical characteristics of each independent variable included in the primary Model I, three irrelevant independent variables were eliminated from the model—enterprise debt paying capacity (TL/TAjt), tangible assets of enterprise (lnTngAjt), and profitability of enterprise (NP/Sjt). Two additional independent variables (indebtedness of enterprise (lnTLjt) and size of enterprise (lnSjt)) were eliminated from Model II and Model III. Generally, in all of the three final DQI3 models, the variables—specific factors (enterprise’s characteristics)—are significant at least at 90% confidence level.
Panel estimation of the AID quality measured by DQI3 in enterprises reveals that: (i) Two out of five selected independent variables (size of enterprise (lnSjt) and indebtedness of enterprise (lnTLjt) have a statistically significant impact on DQI3 (Model I); while (ii) in the case of debt-paying capacity of enterprise, tangible assets of enterprise, and profitability of enterprise, no statistically significant impact was found (Model I).
Appendix C
Table A18.
Accounting information disclosure of the tangible assets in the annual financial statements of the enterprises according to DQI components (trend analysis).
Table A18.
Accounting information disclosure of the tangible assets in the annual financial statements of the enterprises according to DQI components (trend analysis).
| DQI Component Code 1 | Number of Companies | Regression Equation | R2 | ||
|---|---|---|---|---|---|
| 2007 | 2008 | 2016 | |||
| DQI1 | |||||
| MSMLE1.1 | 37 | 37 | 35 | y = −x + 38.333 | R2 = 0.75 |
| MSMLE1.2 | 1 | 3 | 12 | y = 5.5x − 5.6667 | R2 = 0.88 |
| MSMLE2.1 | 35 | 35 | 31 | y = −2x + 37.667 | R2 = 0.75 |
| MSMLE2.2 | 34 | 34 | 30 | y = −2x + 36.667 | R2 = 0.75 |
| MSMLE2.3.1 | 33 | 33 | 30 | y = −1.5x + 35 | R2 = 0.75 |
| MSMLE2.3.2 | 33 | 33 | 30 | y = −1.5x + 35 | R2 = 0.75 |
| MSMLE2.4.1 | 34 | 34 | 31 | y = −1.5x + 36 | R2 = 0.75 |
| MSMLE2.4.2 | 33 | 33 | 31 | y = −x + 34.333 | R2 = 0.75 |
| MSMLE2.5.1 | 5 | 6 | 17 | y = 6x − 2.6667 | R2 = 0.81 |
| MSMLE2.5.2.1 | n.r. | n.r. | 0 | ||
| MSMLE2.5.2.2 | n.r. | n.r. | 0 | ||
| MSMLE2.6.1 | n.r. | n.r. | 8 | ||
| MSMLE2.6.2 | n.r. | n.r. | 6 | ||
| MSMLE2.6.3 | n.r. | n.r. | 0 | ||
| MSMLE2.6.4 | n.r. | n.r. | 2 | ||
| MSMLE3.1 | 9 | 9 | 0 | y = −4.5x + 15 | R2 = 0.75 |
| MSMLE3.2 | 7 | 8 | 0 | y = −3.5x + 12 | R2 = 0.64 |
| MSMLE3.3.1 | 3 | 3 | 0 | y = −1.5x + 5 | R2 = 0.75 |
| MSMLE3.3.2 | 5 | 5 | 0 | y = −2.5x + 8.3333 | R2 = 0.75 |
| MSMLE3.5.1 | 1 | 1 | 0 | y = −0.5x + 1.6667 | R2 = 0.75 |
| MSMLE3.5.2 | 0 | 0 | 0 | ||
| MSMLE3.5.3 | 2 | 3 | 1 | y = −0.5x + 3 | R2 = 0.25 |
| DQI2 | |||||
| G1.2 | 29 | 29 | 27 | y = −x + 30.333 | R2 = 0.75 |
| G1.3 (MSMLE1.1) | 37 | 37 | 35 | y = −x + 38.333 | R2 = 0.75 |
| G1.4 | 37 | 37 | 33 | y = −2x + 39.667 | R2 = 0.75 |
| G1.5 | 30 | 32 | 36 | y = 3x + 26.667 | R2 = 0.96 |
| G1.7 (MSMLE1.2) | 1 | 3 | 12 | y = 5.5x − 5.6667 | R2 = 0.88 |
| G3.1 | 20 | 20 | 24 | y = 2x + 17.333 | R2 = 0.75 |
| G3.2 | 20 | 21 | 23 | y = 1.5x + 18.333 | R2 = 0.96 |
| G3.3 | 0 | 0 | 1 | y = 0.5x − 0.6667 | R2 = 0.75 |
| G3.4 | 0 | 0 | 2 | y = x − 1.3333 | R2 = 0.75 |
| G3.5 | 35 | 35 | 36 | y = 0.5x + 34.333 | R2 = 0.75 |
| DQI3 | |||||
| G0.1 | 6 | 5 | 1 | y = −2.5x + 9 | R2 = 0.89 |
| G0.2 | 4 | 5 | 3 | y = −0.5x + 5 | R2 = 0.25 |
| G1.1 | 14 | 14 | 16 | y = x + 12.667 | R2 = 0.75 |
| G1.2 | 29 | 29 | 27 | y = −x + 30.333 | R2 = 0.75 |
| G1.3 (MSMLE1.1) | 37 | 37 | 35 | y = −x + 38.333 | R2 = 0.75 |
| G1.4 | 37 | 37 | 33 | y = −2x + 39.667 | R2 = 0.75 |
| G1.5 | 30 | 32 | 36 | y = 3x + 26.667 | R2 = 0.96 |
| G1.6 | 9 | 9 | 10 | y = 0.5x + 8.3333 | R2 = 0.75 |
| G1.7 (MSMLE1.2) | 1 | 3 | 12 | y = 5.5x − 5.6667 | R2 = 0.88 |
| G3.1 | 20 | 20 | 24 | y = 2x + 17.333 | R2 = 0.75 |
| G3.2 | 20 | 21 | 23 | y = 1.5x + 18.333 | R2 = 0.96 |
| G3.3 | 0 | 0 | 1 | y = 0.5x − 0.6667 | R2 = 0.75 |
| G3.4 | 0 | 0 | 2 | y = x − 1.3333 | R2 = 0.75 |
| G3.5 | 35 | 35 | 36 | y = 0.5x + 34.333 | R2 = 0.75 |
1 The full name of the disclosure index component is presented in Appendix A, (Table A1, Table A2 and Table A3). Abbreviations used: n.r.—no requirement.
Table A19.
Disclosure quality indexes (DQI1, DQI2, DQI3) and its regression equation (trend analysis) of the tangible assets in the annual financial statements of the enterprises.
Table A19.
Disclosure quality indexes (DQI1, DQI2, DQI3) and its regression equation (trend analysis) of the tangible assets in the annual financial statements of the enterprises.
| Company | DQI1 | Regr. eq. | R2 | DQI2 | Regr. eq. | R2 | DQI3 | Regr. eq. | R2 | ||||||
|---|---|---|---|---|---|---|---|---|---|---|---|---|---|---|---|
| 2007 | 2008 | 2016 | 2007 | 2008 | 2016 | 2007 | 2008 | 2016 | |||||||
| X1 | 44 | 78 | 50 | y = 3x + 51.259 | R2 = 0.02 | 79 | 89 | 79 | y = 0.0112x + 82.084 | R2 = 4 × 10⁻⁶ | 70 | 69 | 63 | y = −3.7092x + 74.721 | R2 = 0.88 |
| X2 | 89 | 78 | 64 | y = −12.682x + 102.17 | R2 = 0.99 | 77 | 66 | 77 | y = −0.2473x + 73.994 | R2 = 0.002 | 61 | 53 | 53 | y = −4.2379x + 64.178 | R2 = 0.81 |
| X3 | 78 | 78 | 82 | y = 1.9091x + 75.38 | R2 = 0.71 | 89 | 89 | 100 | y = 5.6433x + 81.189 | R2 = 0.75 | 77 | 77 | 77 | y = −0.073x + 76.769 | R2 = 0.75 |
| X4 | 63 | 63 | 9 | y = −26.955x + 98.773 | R2 = 0.76 | 62 | 62 | 56 | y = −3.4252x + 66.973 | R2 = 0.75 | 52 | 52 | 38 | y = −6.8621x + 61.335 | R2 = 0.75 |
| X5 | 67 | 69 | 64 | y = −1.5x + 69.583 | R2 = 0.39 | 54 | 81 | 88 | y = 16.962x + 40.502 | R2 = 0.89 | 37 | 59 | 68 | y = 15.471x + 23.749 | R2 = 0.94 |
| X6 | 75 | 89 | 73 | y = -x + 80.963 | R2 = 0.01 | 59 | 67 | 66 | y = 3.429x + 57.078 | R2 = 0.68 | 49 | 54 | 45 | y = −2.1193x + 53.6 | R2 = 0.23 |
| X7 | 6 | 6 | 0 | y = −3x + 10.083 | R2 = 0.72 | 56 | 56 | 0 | y = −27.778x + 92.593 | R2 = 0.75 | 38 | 38 | 0 | y = −19.231x + 64.103 | R2 = 0.75 |
| X8 | 50 | 50 | 18 | y = −15.909x + 71.212 | R2 = 0.75 | 68 | 47 | 75 | y = 3.2895x + 57.018 | R2 = 0.05 | 48 | 33 | 50 | y = 0.9259x + 41.975 | R2 = 0.01 |
| X9 | 50 | 63 | 73 | y = 11.364x + 39.015 | R2 = 0.99 | 68 | 69 | 69 | y = 0.4521x + 67.971 | R2 = 0.99 | 56 | 56 | 49 | y = −3.1769x + 59.943 | R2 = 0.69 |
| X10 | 75 | 75 | 64 | y = −5.6818x + 82.576 | R2 = 0.75 | 49 | 49 | 65 | y = 8.2352x + 37.947 | R2 = 0.75 | 42 | 42 | 53 | y = 5.3285x + 34.882 | R2 = 0.75 |
| X11 | 44 | 44 | 67 | y = 11.333x + 28.806 | R2 = 0.74 | 68 | 68 | 48 | y = −9.8665x + 81.342 | R2 = 0.75 | 48 | 48 | 42 | y = −3.136x + 52.059 | R2 = 0.75 |
| X12 | 78 | 89 | 82 | y = 1.9091x + 79.084 | R2 = 0.12 | 77 | 78 | 100 | y = 11.287x + 62.495 | R2 = 0.76 | 53 | 54 | 69 | y = 7.6787x + 43.273 | R2 = 0.77 |
| X13 | 13 | 19 | 18 | y = 2.5909x + 11.462 | R2 = 0.67 | 50 | 60 | 75 | y = 12.326x + 37.223 | R2 = 0.99 | 36 | 43 | 50 | y = 6.9829x + 29.093 | R2 = 0.99 |
| X14 | 78 | 78 | 18 | y = −29.909x + 117.8 | R2 = 0.75 | 89 | 80 | 56 | y = −16.579x + 107.82 | R2 = 0.93 | 69 | 64 | 46 | y = −11.371x + 82.4 | R2 = 0.90 |
| X15 | 75 | 75 | 60 | y = −7.5x + 85 | R2 = 0.75 | 80 | 72 | 79 | y = −0.1805x + 77.353 | R2 = 0.002 | 64 | 59 | 63 | y = −0.2263x + 62.607 | R2 = 0.01 |
| X16 | 56 | 56 | 73 | y = 8.6667x + 44.528 | R2 = 0.76 | 43 | 43 | 69 | y = 12.902x + 26.032 | R2 = 0.75 | 38 | 38 | 49 | y = 5.3193x + 31.137 | R2 = 0.75 |
| X17 | 78 | 78 | 73 | y = −2.6364x + 81.441 | R2 = 0.78 | 59 | 59 | 88 | y = 14.517x + 40.076 | R2 = 0.75 | 49 | 49 | 68 | y = 9.4672x + 36.872 | R2 = 0.75 |
| X18 | 78 | 78 | 64 | y = −7.1818x + 87.502 | R2 = 0.76 | 77 | 77 | 88 | y = 5.5197x + 70.067 | R2 = 0.75 | 61 | 61 | 68 | y = 3.6548x + 56.247 | R2 = 0.75 |
| X19 | 78 | 78 | 73 | y = −2.6364x + 81.441 | R2 = 0.78 | 59 | 59 | 89 | y = 14.589x + 39.98 | R2 = 0.75 | 57 | 57 | 77 | y = 9.9079x + 43.499 | R2 = 0.75 |
| X20 | 78 | 78 | 73 | y = −2.6364x + 81.441 | R2 = 0.78 | 80 | 80 | 100 | y = 10.142x + 66.193 | R2 = 0.75 | 57 | 57 | 68 | y = 5.8597x + 48.897 | R2 = 0.75 |
| X21 | 78 | 78 | 64 | y = −7.1818x + 87.502 | R2 = 0.76 | 66 | 66 | 79 | y = 6.5888x + 57.355 | R2 = 0.75 | 46 | 46 | 63 | y = 8.928x + 33.664 | R2 = 0.75 |
| X22 | 78 | 78 | 64 | y = −7.1818x + 87.502 | R2 = 0.76 | 66 | 66 | 88 | y = 11.163x + 51.256 | R2 = 0.75 | 53 | 53 | 68 | y = 7.5428x + 43.287 | R2 = 0.75 |
| X23 | 78 | 78 | 64 | y = −7.1818x + 87.502 | R2 = 0.76 | 80 | 80 | 90 | y = 4.9714x + 73.088 | R2 = 0.75 | 71 | 78 | 85 | y = 7.1147x + 64.059 | R2 = 0.99 |
| X24 | 44 | 56 | 82 | y = 18.909x + 22.871 | R2 = 0.96 | 36 | 68 | 89 | y = 26.119x + 12.231 | R2 = 0.98 | 26 | 48 | 69 | y = 21.581x + 4.3018 | R2 = 0.99 |
| X25 | 89 | 89 | 73 | y = −7.8333x + 99.407 | R2 = 0.76 | 89 | 80 | 91 | y = 0.913x + 84.709 | R2 = 0.03 | 69 | 64 | 73 | y = 1.8437x + 65.124 | R2 = 0.18 |
| X26 | 89 | 78 | 7 | y = −41.167x + 140.15 | R2 = 0.85 | 80 | 80 | 44 | y = −17.778x + 103.61 | R2 = 0.76 | 57 | 57 | 38 | y = −9.3407x + 69.453 | R2 = 0.77 |
| X27 | 44 | 44 | 60 | y = 8x + 33.25 | R2 = 0.74 | 62 | 62 | 69 | y = 3.5829x + 56.872 | R2 = 0.75 | 45 | 45 | 49 | y = 2.0225x + 41.863 | R2 = 0.75 |
| X28 | 69 | 69 | 64 | y = −2.6818x + 72.492 | R2 = 0.78 | 79 | 79 | 88 | y = 4.5316x + 73.36 | R2 = 0.75 | 71 | 71 | 76 | y = 2.7489x + 67.159 | R2 = 0.75 |
| X29 | 56 | 56 | 55 | y = −0.7273x + 56.822 | R2 = 0.95 | 37 | 37 | 53 | y = 7.9835x + 26.659 | R2 = 0.75 | 34 | 34 | 44 | y = 5.2951x + 26.617 | R2 = 0.75 |
| X30 | 50 | 50 | 73 | y = 11.364x + 34.848 | R2 = 0.75 | 71 | 71 | 88 | y = 8.5187x + 60.07 | R2 = 0.75 | 59 | 59 | 68 | y = 4.9043x + 52.082 | R2 = 0.75 |
| X31 | 63 | 63 | 67 | y = 1.8333x + 60.389 | R2 = 0.65 | 62 | 62 | 79 | y = 8.4877x + 51.089 | R2 = 0.75 | 52 | 52 | 56 | y = 2.0093x + 49.507 | R2 = 0.75 |
| X32 | 78 | 78 | 67 | y = −5.6667x + 85.481 | R2 = 0.76 | 80 | 80 | 79 | y = −0.1779x + 79.953 | R2 = 0.75 | 71 | 71 | 63 | y = −3.8315x + 76.249 | R2 = 0.75 |
| X33 | 78 | 78 | 60 | y = −9x + 89.926 | R2 = 0.76 | 77 | 77 | 69 | y = −4.3058x + 83.168 | R2 = 0.75 | 77 | 77 | 71 | y = −3.0202x + 80.699 | R2 = 0.75 |
| X34 | 78 | 78 | 64 | y = −7.1818x + 87.502 | R2 = 0.76 | 77 | 77 | 65 | y = −6.0144x + 85.446 | R2 = 0.75 | 53 | 53 | 45 | y = −4.2962x + 59.072 | R2 = 0.75 |
| X35 | 11 | 11 | 60 | y = 24.5x − 21.63 | R2 = 0.75 | 22 | 22 | 48 | y = 12.901x + 5.0204 | R2 = 0.75 | 23 | 23 | 41 | y = 9.093x + 10.953 | R2 = 0.75 |
| X36 | 78 | 78 | 67 | y = −5.6667x + 85.481 | R2 = 0.76 | 66 | 66 | 79 | y = 6.6101x + 57.326 | R2 = 0.75 | 46 | 46 | 56 | y = 5.3024x + 38.498 | R2 = 0.75 |
| X37 | 78 | 78 | 82 | y = 1.9091x + 75.38 | R2 = 0.71 | 77 | 77 | 89 | y = 5.5919x + 69.971 | R2 = 0.75 | 69 | 69 | 77 | y = 3.815x + 63.809 | R2 = 0.75 |
…….—increased, …….—decreased. Abbreviations used: Regr. eq.—regression equation.
Summary of results presented in Appendix C, Table A19: Analysis of DQI variation trends in the period of 2007–2016 revealed that:
(i) DQI1 increased in 13 enterprises (35.14%) (X1, X3, X9, X11, X12, X13, X16, X23, X27, X30, X31, X35, X37), a stable growth trend was demonstrated by 11 enterprises (X3, X9, X11, X13, X16, X23, X27, X30, X31, X35, X37, where R2 > 0.6), while 24 enterprises (64.86%) (X2, X4, X5, X6, X7, X8, X10, X14, X15, X17, X18, X19, X20, X21, X22, X24, X25, X26, X28, X29, X32, X33, X34, X36) observes a decrease in the disclosed information estimated by DQI1;
(ii) DQ2 increased in 27 enterprises (72.97%) (X1, X3, X5, X6, X8, X9, X10, X12, X13, X16, X17, X18, X19, X20, X21, X22, X23, X24, X25, X27, X28, X29, X30, X31, X35, X36, X37), a stable growth trend was demonstrated by 24 enterprises (X3, X5, X6, X9, X10, X12, X13, X16, X17, X18, X19, X20, X21, X22, X23, X24, X27, X28, X29, X30, X31, X35, X36, X37, where R2 > 0.6), and decreased in 10 enterprises (27.03%) (X2, X4, X7, X11, X14, X15, X26, X32, X33, X34);
(iii) DQI3 increased in 23 enterprises (62.16%) (X5, X8, X10, X12, X13, X16, X17, X18, X19, X20, X21, X22, X23, X24, X25, X27, X28, X29, X30, X31, X35, X36, X37), a stable growth trend was demonstrated by 21 enterprises (X5, X10, X12, X13, X16, X17, X18, X19, X20, X21, X22, X23, X24, X27, X28, X29, X30, X31, X35, X36, X37, where R2 > 0.6), and decreased in 14 enterprises (37.84%) (X1, X2, X3, X4, X6, X7, X9, X11, X14, X15, X26, X32, X33, X34).
Table A20.
Correlation of disclosure quality index DQI1 and its components.
Table A20.
Correlation of disclosure quality index DQI1 and its components.
| Component Code 1 | MSMLE1.1 | MSMLE1.2 | MSMLE2.1 | MSMLE2.2 | MSMLE2.3.1 | MSMLE2.3.2 | MSMLE2.4.1 | MSMLE2.4.2 | MSMLE2.5.1 | MSMLE2.5.2.1 | MSMLE2.5.2.2 | MSMLE2.6.1 | MSMLE2.6.2 | MSMLE2.6.3 | MSMLE2.6.4 | MSMLE3.1 | MSMLE3.2 | MSMLE3.3.1 | MSMLE3.3.2 | MSMLE3.5.1 | MSMLE3.5.2 | MSMLE3.5.3 | DQI1 | |
|---|---|---|---|---|---|---|---|---|---|---|---|---|---|---|---|---|---|---|---|---|---|---|---|---|
| MSMLE1.1 | Corr. | 1 | −0.137 | 0.194 * | 0.161 | 0.145 | 0.145 | 0.171 | 0.153 | 0.079 | 0.126 | a | 0.426 | 0.408 | a | 0.167 | a | a | a | a | a | a | a | 0.200 * |
| Sig. | 0.151 | 0.041 | 0.091 | 0.130 | 0.130 | 0.073 | 0.110 | 0.412 | 0.459 | 0.167 | 0.242 | 0.645 | 0.000 | 0.000 | 0.000 | 0.000 | 0.000 | 0.000 | 0.036 | |||||
| n | 111 | 111 | 111 | 111 | 111 | 111 | 111 | 111 | 111 | 37 | 37 | 12 | 10 | 11 | 10 | 32 | 32 | 32 | 32 | 32 | 32 | 32 | 111 | |
| MSMLE1.2 | Corr. | −0.137 | 1 | −0.140 | −0.170 | −0.138 | −0.138 | −0.188 * | −0.230 * | −0.002 | −0.224 | a | 0.213 | 0.272 | a | 0.667 * | −0.149 | −0.087 | 0.120 | 0.014 | −0.083 | a | 0.120 | −0.049 |
| Sig. | 0.151 | 0.144 | 0.075 | 0.149 | 0.149 | 0.049 | 0.015 | 0.982 | 0.183 | 0.506 | 0.447 | 0.035 | 0.417 | 0.635 | 0.512 | 0.937 | 0.651 | 0.512 | 0.613 | |||||
| n | 111 | 111 | 111 | 111 | 111 | 111 | 111 | 111 | 111 | 37 | 37 | 12 | 10 | 11 | 10 | 32 | 32 | 32 | 32 | 32 | 32 | 32 | 111 | |
| MSMLE2.1 | Corr. | 0.194 * | −0.140 | 1 | 0.864 ** | 0.796 ** | 0.796 ** | 0.904 ** | 0.828 ** | 0.183 | 0.231 | a | 0.632 * | 0.612 | a | 0.250 | 0.293 | 0.243 | 0.124 | 0.174 | 0.067 | a | 0.124 | 0.779 ** |
| Sig. | 0.041 | 0.144 | 0.000 | 0.000 | 0.000 | 0.000 | 0.000 | 0.055 | 0.169 | 0.027 | 0.060 | 0.486 | 0.104 | 0.181 | 0.499 | 0.341 | 0.717 | 0.499 | 0.000 | |||||
| n | 111 | 111 | 111 | 111 | 111 | 111 | 111 | 111 | 111 | 37 | 37 | 12 | 10 | 11 | 10 | 32 | 32 | 32 | 32 | 32 | 32 | 32 | 111 | |
| MSMLE2.2 | Corr. | 0.161 | −0.170 | 0.864 ** | 1 | 0.839 ** | 0.839 ** | 0.956 ** | 0.874 ** | 0.147 | 0.254 | a | 0.632 * | 0.612 | a | 0.250 | 0.429 * | 0.355 * | 0.182 | 0.255 | 0.098 | a | 0.182 | 0.818 ** |
| Sig. | 0.091 | 0.075 | 0.000 | 0.000 | 0.000 | 0.000 | 0.000 | 0.124 | 0.130 | 0.027 | 0.060 | 0.486 | 0.014 | 0.046 | 0.320 | 0.159 | 0.595 | 0.320 | 0.000 | |||||
| n | 111 | 111 | 111 | 111 | 111 | 111 | 111 | 111 | 111 | 37 | 37 | 12 | 10 | 11 | 10 | 32 | 32 | 32 | 32 | 32 | 32 | 32 | 111 | |
| MSMLE2.3.1 | Corr. | 0.145 | −0.138 | 0.796 ** | 0.839 ** | 1 | 0.923 ** | 0.881 ** | 0.802 ** | 0.169 | 0.254 | a | 0.632 * | 0.612 | a | 0.250 | 0.429 * | 0.355 * | 0.182 | 0.255 | 0.098 | a | 0.182 | 0.788 ** |
| Sig. | 0.130 | 0.149 | 0.000 | 0.000 | 0.000 | 0.000 | 0.000 | 0.076 | 0.130 | 0.027 | 0.060 | 0.486 | 0.014 | 0.046 | 0.320 | 0.159 | 0.595 | 0.320 | 0.000 | |||||
| n | 111 | 111 | 111 | 111 | 111 | 111 | 111 | 111 | 111 | 37 | 37 | 12 | 10 | 11 | 10 | 32 | 32 | 32 | 32 | 32 | 32 | 32 | 111 | |
| MSMLE2.3.2 | Corr. | 0.145 | −0.138 | 0.796 ** | 0.839 ** | 0.923 ** | 1 | 0.881 ** | 0.802 ** | 0.230 * | 0.254 | a | 0.632 * | 0.612 | a | 0.250 | 0.429 * | 0.355 * | 0.182 | 0.255 | 0.098 | a | 0.182 | 0.800 ** |
| Sig. | 0.130 | 0.149 | 0.000 | 0.000 | 0.000 | 0.000 | 0.000 | 0.015 | 0.130 | 0.027 | 0.060 | 0.486 | 0.014 | 0.046 | 0.320 | 0.159 | 0.595 | 0.320 | 0.000 | |||||
| n | 111 | 111 | 111 | 111 | 111 | 111 | 111 | 111 | 111 | 37 | 37 | 12 | 10 | 11 | 10 | 32 | 32 | 32 | 32 | 32 | 32 | 32 | 111 | |
| MSMLE2.4.1 | Corr. | 0.171 | −0.188 * | 0.904 ** | 0.956 ** | 0.881 ** | 0.881 ** | 1 | 0.916 ** | 0.202 * | 0.231 | a | 0.632 * | 0.612 | a | 0.250 | 0.429 * | 0.355 * | 0.182 | 0.255 | 0.098 | a | 0.182 | 0.848 ** |
| Sig. | 0.073 | 0.049 | 0.000 | 0.000 | 0.000 | 0.000 | 0.000 | 0.033 | 0.169 | 0.027 | 0.060 | 0.486 | 0.014 | 0.046 | 0.320 | 0.159 | 0.595 | 0.320 | 0.000 | |||||
| n | 111 | 111 | 111 | 111 | 111 | 111 | 111 | 111 | 111 | 37 | 37 | 12 | 10 | 11 | 10 | 32 | 32 | 32 | 32 | 32 | 32 | 32 | 111 | |
| MSMLE2.4.2 | Corr. | 0.153 | −0.230 * | 0.828 ** | 0.874 ** | 0.802 ** | 0.802 ** | 0.916 ** | 1 | 0.221 * | 0.231 | a | 0.632 * | 0.612 | a | 0.250 | 0.314 | 0.232 | −0.014 | 0.104 | 0.111 | a | 0.207 | 0.782 ** |
| Sig. | 0.110 | 0.015 | 0.000 | 0.000 | 0.000 | 0.000 | 0.000 | 0.020 | 0.169 | 0.027 | 0.060 | 0.486 | 0.080 | 0.202 | 0.940 | 0.569 | 0.545 | 0.256 | 0.000 | |||||
| n | 111 | 111 | 111 | 111 | 111 | 111 | 111 | 111 | 111 | 37 | 37 | 12 | 10 | 11 | 10 | 32 | 32 | 32 | 32 | 32 | 32 | 32 | 111 | |
| MSMLE2.5.1 | Corr. | 0.079 | −0.002 | 0.183 | 0.147 | 0.169 | 0.230 * | 0.202 * | 0.221 * | 1 | 0.174 | a | 0.120 | 0.167 | a | −0.102 | 0.314 | 0.412 * | 0.327 | 0.133 | 0.488 ** | a | 0.327 | 0.284 ** |
| Sig. | 0.412 | 0.982 | 0.055 | 0.124 | 0.076 | 0.015 | 0.033 | 0.020 | 0.302 | 0.711 | 0.645 | 0.779 | 0.080 | 0.019 | 0.068 | 0.470 | 0.005 | 0.068 | 0.003 | |||||
| n | 111 | 111 | 111 | 111 | 111 | 111 | 111 | 111 | 111 | 37 | 37 | 12 | 10 | 11 | 10 | 32 | 32 | 32 | 32 | 32 | 32 | 32 | 111 | |
| MSMLE2.5.2.1 | Corr. | 0.126 | −0.224 | 0.231 | 0.254 | 0.254 | 0.254 | 0.231 | 0.231 | 0.174 | 1 | a | 1.000 ** | 0.356 | a | 0.327 | a | a | a | a | a | a | a | 0.175 |
| Sig. | 0.459 | 0.183 | 0.169 | 0.130 | 0.130 | 0.130 | 0.169 | 0.169 | 0.302 | 0.000 | 0.312 | 0.356 | 0.299 | |||||||||||
| n | 37 | 37 | 37 | 37 | 37 | 37 | 37 | 37 | 37 | 37 | 37 | 12 | 10 | 11 | 10 | 1 | 1 | 1 | 1 | 1 | 1 | 1 | 37 | |
| MSMLE2.5.2.2 | Corr. | a | a | a | a | a | a | a | a | a | a | a | a | a | a | a | a | a | a | a | a | a | a | a |
| Sig. | ||||||||||||||||||||||||
| n | 37 | 37 | 37 | 37 | 37 | 37 | 37 | 37 | 37 | 37 | 37 | 12 | 10 | 11 | 10 | 1 | 1 | 1 | 1 | 1 | 1 | 1 | 37 | |
| MSMLE2.6.1 | Corr. | 0.426 | 0.213 | 0.632 * | 0.632 * | 0.632 * | 0.632 * | 0.632 * | 0.632 * | 0.120 | 1.000 ** | a | 1 | 0.356 | a | 0.327 | a | a | a | a | a | a | a | 0.649 * |
| Sig. | 0.167 | 0.506 | 0.027 | 0.027 | 0.027 | 0.027 | 0.027 | 0.027 | 0.711 | 0.000 | 0.312 | 0.356 | 0.022 | |||||||||||
| n | 12 | 12 | 12 | 12 | 12 | 12 | 12 | 12 | 12 | 12 | 12 | 12 | 10 | 11 | 10 | 0 | 0 | 0 | 0 | 0 | 0 | 0 | 12 | |
| MSMLE2.6.2 | Corr. | 0.408 | 0.272 | 0.612 | 0.612 | 0.612 | 0.612 | 0.612 | 0.612 | 0.167 | 0.356 | a | 0.356 | 1 | a | 0.408 | a | a | a | a | a | a | a | 0.680 * |
| Sig. | 0.242 | 0.447 | 0.060 | 0.060 | 0.060 | 0.060 | 0.060 | 0.060 | 0.645 | 0.312 | 0.312 | 0.242 | 0.030 | |||||||||||
| n | 10 | 10 | 10 | 10 | 10 | 10 | 10 | 10 | 10 | 10 | 10 | 10 | 10 | 10 | 10 | 0 | 0 | 0 | 0 | 0 | 0 | 0 | 10 | |
| MSMLE2.6.3 | Corr. | a | a | a | a | a | a | a | a | a | a | a | a | a | a | a | a | a | a | a | a | a | a | a |
| Sig. | ||||||||||||||||||||||||
| n | 11 | 11 | 11 | 11 | 11 | 11 | 11 | 11 | 11 | 11 | 11 | 11 | 10 | 11 | 10 | 0 | 0 | 0 | 0 | 0 | 0 | 0 | 11 | |
| MSMLE2.6.4 | Corr. | 0.167 | 0.667 * | 0.250 | 0.250 | 0.250 | 0.250 | 0.250 | 0.250 | −0.102 | 0.327 | a | 0.327 | 0.408 | a | 1 | a | a | a | a | a | a | a | 0.410 |
| Sig. | 0.645 | 0.035 | 0.486 | 0.486 | 0.486 | 0.486 | 0.486 | 0.486 | 0.779 | 0.356 | 0.356 | 0.242 | 0.239 | |||||||||||
| n | 10 | 10 | 10 | 10 | 10 | 10 | 10 | 10 | 10 | 10 | 10 | 10 | 10 | 10 | 10 | 0 | 0 | 0 | 0 | 0 | 0 | 0 | 10 | |
| MSMLE3.1 | Corr. | a | −0.149 | 0.293 | 0.429 * | 0.429 * | 0.429 * | 0.429 * | 0.314 | 0.314 | a | a | a | a | a | a | 1 | 0.576 ** | 0.424 * | 0.595 ** | 0.228 | a | 0.101 | 0.727 ** |
| Sig. | 0.000 | 0.417 | 0.104 | 0.014 | 0.014 | 0.014 | 0.014 | 0.080 | 0.080 | 0.001 | 0.016 | 0.000 | 0.210 | 0.583 | 0.000 | |||||||||
| n | 32 | 32 | 32 | 32 | 32 | 32 | 32 | 32 | 32 | 1 | 1 | 0 | 0 | 0 | 0 | 32 | 32 | 32 | 32 | 32 | 32 | 32 | 32 | |
| MSMLE3.2 | Corr. | a | −0.087 | 0.243 | 0.355 * | 0.355 * | 0.355 * | 0.355 * | 0.232 | 0.412 * | a | a | a | a | a | a | 0.576 ** | 1 | 0.511 ** | 0.718 ** | 0.275 | a | −0.130 | 0.703 ** |
| Sig. | 0.000 | 0.635 | 0.181 | 0.046 | 0.046 | 0.046 | 0.046 | 0.202 | 0.019 | 0.001 | 0.003 | 0.000 | 0.128 | 0.477 | 0.000 | |||||||||
| n | 32 | 32 | 32 | 32 | 32 | 32 | 32 | 32 | 32 | 1 | 1 | 0 | 0 | 0 | 0 | 32 | 32 | 32 | 32 | 32 | 32 | 32 | 32 | |
| MSMLE3.3.1 | Corr. | a | 0.120 | 0.124 | 0.182 | 0.182 | 0.182 | 0.182 | −0.014 | 0.327 | a | a | a | a | a | a | 0.424 * | 0.511 ** | 1 | 0.713 ** | −0.124 | a | −0.231 | 0.503 ** |
| Sig. | 0.000 | 0.512 | 0.499 | 0.320 | 0.320 | 0.320 | 0.320 | 0.940 | 0.068 | 0.016 | 0.003 | 0.000 | 0.499 | 0.204 | 0.003 | |||||||||
| n | 32 | 32 | 32 | 32 | 32 | 32 | 32 | 32 | 32 | 1 | 1 | 0 | 0 | 0 | 0 | 32 | 32 | 32 | 32 | 32 | 32 | 32 | 32 | |
| MSMLE3.3.2 | Corr. | a | 0.014 | 0.174 | 0.255 | 0.255 | 0.255 | 0.255 | 0.104 | 0.133 | a | a | a | a | a | a | 0.595 ** | 0.718 ** | 0.713 ** | 1 | −0.174 | a | −0.324 | 0.571 ** |
| Sig. | 0.000 | 0.937 | 0.341 | 0.159 | 0.159 | 0.159 | 0.159 | 0.569 | 0.470 | 0.000 | 0.000 | 0.000 | 0.341 | 0.071 | 0.001 | |||||||||
| n | 32 | 32 | 32 | 32 | 32 | 32 | 32 | 32 | 32 | 1 | 1 | 0 | 0 | 0 | 0 | 32 | 32 | 32 | 32 | 32 | 32 | 32 | 32 | |
| MSMLE3.5.1 | Corr. | a | −0.083 | 0.067 | 0.098 | 0.098 | 0.098 | 0.098 | 0.111 | 0.488 ** | a | a | a | a | a | a | 0.228 | 0.275 | −0.124 | −0.174 | 1 | a | 0.537 ** | 0.313 |
| Sig. | 0.000 | 0.651 | 0.717 | 0.595 | 0.595 | 0.595 | 0.595 | 0.545 | 0.005 | 0.210 | 0.128 | 0.499 | 0.341 | 0.002 | 0.081 | |||||||||
| n | 32 | 32 | 32 | 32 | 32 | 32 | 32 | 32 | 32 | 1 | 1 | 0 | 0 | 0 | 0 | 32 | 32 | 32 | 32 | 32 | 32 | 32 | 32 | |
| MSMLE3.5.2 | Corr. | a | a | a | a | a | a | a | a | a | a | a | a | a | a | a | a | a | a | a | a | a | a | a |
| Sig. | ||||||||||||||||||||||||
| n | 32 | 32 | 32 | 32 | 32 | 32 | 32 | 32 | 32 | 1 | 1 | 0 | 0 | 0 | 0 | 32 | 32 | 32 | 32 | 32 | 32 | 32 | 32 | |
| MSMLE3.5.3 | Corr. | a | 0.120 | 0.124 | 0.182 | 0.182 | 0.182 | 0.182 | 0.207 | 0.327 | a | a | a | a | a | a | 0.101 | −0.130 | −0.231 | −0.324 | 0.537 ** | a | 1 | 0.237 |
| Sig. | 0.000 | 0.512 | 0.499 | 0.320 | 0.320 | 0.320 | 0.320 | 0.256 | 0.068 | 0.583 | 0.477 | 0.204 | 0.071 | 0.002 | 0.191 | |||||||||
| n | 32 | 32 | 32 | 32 | 32 | 32 | 32 | 32 | 32 | 1 | 1 | 0 | 0 | 0 | 0 | 32 | 32 | 32 | 32 | 32 | 32 | 32 | 32 | |
| DQI1 | Corr. | 0.200 * | −0.049 | 0.779 ** | 0.818 ** | 0.788 ** | 0.800 ** | 0.848 ** | 0.782 ** | 0.284 ** | 0.175 | a | 0.649 * | 0.680 * | a | 0.410 | 0.727 ** | 0.703 ** | 0.503 ** | 0.571 ** | 0.313 | a | 0.237 | 1 |
| Sig. | 0.036 | 0.613 | 0.000 | 0.000 | 0.000 | 0.000 | 0.000 | 0.000 | 0.003 | 0.299 | 0.022 | 0.030 | 0.239 | 0.000 | 0.000 | 0.003 | 0.001 | 0.081 | 0.191 | |||||
| n | 111 | 111 | 111 | 111 | 111 | 111 | 111 | 111 | 111 | 37 | 37 | 12 | 10 | 11 | 10 | 32 | 32 | 32 | 32 | 32 | 32 | 32 | 111 | |
Note: 1 The full name of the disclosure index component is presented in Appendix A, (Table A1). * Correlation is significant at the 0.05 level (2-tailed). ** Correlation is significant at the 0.01 level (2-tailed). Abbreviations used: Corr.—correlation coefficient; Sig.—significance; n—number of observations; a—correlation cannot be computed because at least one of the variables is constant.
Summary of results presented in Appendix C, Table A20: If an enterprise discloses one component of the change of the carrying amount of an asset during the reporting period, it discloses other components too.
(1a) It is relevant for the following components of tangible assets presented in financial statements at the acquisition cost or revalued amount, and investment property presented in financial statements at the acquisition cost: Cost or revalued amount at the beginning and at the end of the reporting period (MSMLE2.1), the value of assets acquired during the reporting period (MSMLE2.2), the assets disposed or written off (MSMLE2.3), and depreciation (MSMLE2.4). The conclusion is confirmed by the following statistical results, i.e., during the investigated period, a strong positive relationship (p = 0.000, significant at 99% confidence level) is observed between the following DQI1 components: (1) (i) MSMLE2.1 and MSMLE2.2 (Corr. = 0.864), MSMLE2.3.1 (Corr. = 0.796), MSMLE2.3.2 (Corr. = 0.796), MSMLE2.4.1 (Corr. = 0.904), MSMLE2.4.2 (Corr. = 0.828); (ii) MSMLE2.2 and MSMLE2.3.1 (Corr. = 0.839), MSMLE2.3.2 (Corr. = 0.839), MSMLE2.4.1 (Corr. = 0.956), MSMLE2.4.2 (Corr. = 0.874); (iii) MSMLE2.3.1 and MSMLE2.3.2 (Corr. = 0.923), MSMLE2.4.1 (Corr. = 0.881), MSMLE2.4.2 (Corr. = 0.802); (iv) MSMLE2.3.2 and MSMLE2.4.1 (Corr. = 0.881), MSMLE2.4.2 (Corr. = 0.802); (v) MSMLE2.4.1 and MSMLE2.4.2 (Corr. = 0.916). (1b) Whereas this does not apply to components of MSMLE2.5 and MSMLE2.6 (i.e., impairment losses and revaluation).
(2) It is relevant for the following components of investment property presented in financial statements at the fair value: The value of assets acquired during the reporting period (MSMLE3.2) and the assets disposed or written off (MSMLE3.3). The conclusion is confirmed by the following statistical results, i.e., during the investigated period, a strong positive relationship (p = 0.000, significant at 99% confidence level) is observed between following DQI1 components: (i) MSMLE3.2 and MSMLE3.3.2 (Corr. = 0.718); (ii) MSMLE3.3.1 and MSMLE 3.3.2 (Corr. = 0.713). However, this does not apply to component MSMLE3.5 (i.e., the change in the fair value).
(3) Finally, DQI1 (p = 0.000, significant at 99% confidence level) strongly positively correlates with 8 of 22 components: MSMLE2.1 (Corr. = 0.779), MSMLE2.2 (Corr. = 0.818), MSMLE2.3.1 (Corr. = 0.788), MSMLE2.3.2 (Corr. = 0.800), MSMLE2.4.1 (Corr. = 0.848), MSMLE2.4.2 (Corr. = 0.782), MSMLE3.3.1 (Corr. = 0.727), and MSMLE3.3.2 (Corr. = 0.703).
Table A21.
Correlation of disclosure quality index DQI2 and its components.
Table A21.
Correlation of disclosure quality index DQI2 and its components.
| Component Code 1 | G1.2 | G1.3 | G1.4 | G1.5 | G1.7 | G2 | G3.1 | G3.2 | G3.3 | G3.4 | G3.5 | DQI2 | |
|---|---|---|---|---|---|---|---|---|---|---|---|---|---|
| G1.2 | Corr. | 1 | 0.085 | 0.007 | 0.063 | −0.015 | 0.329 ** | 0.344 ** | 0.172 | 0.096 | 0.150 | 0.393 ** | 0.573 ** |
| Sig. | 0.375 | 0.940 | 0.510 | 0.874 | 0.000 | 0.000 | 0.071 | 0.552 | 0.355 | 0.000 | 0.000 | ||
| n | 111 | 111 | 111 | 111 | 111 | 111 | 111 | 111 | 41 | 40 | 111 | 111 | |
| G1.3 | Corr. | 0.085 | 1 | 0.701 ** | 0.161 | −0.137 | 0.164 | 0.158 | 0.021 | a | a | 0.297 ** | 0.299 ** |
| Sig. | 0.375 | 0.000 | 0.091 | 0.151 | 0.086 | 0.098 | 0.827 | 0.000 | 0.000 | 0.002 | 0.001 | ||
| n | 111 | 111 | 111 | 111 | 111 | 111 | 111 | 111 | 41 | 40 | 111 | 111 | |
| G1.4 | Corr. | 0.007 | 0.701 ** | 1 | 0.080 | −0.058 | 0.100 | 0.128 | 0.128 | 0.025 | a | 0.191 * | 0.287 ** |
| Sig. | 0.940 | 0.000 | 0.405 | 0.544 | 0.296 | 0.181 | 0.181 | 0.877 | 0.000 | 0.045 | 0.002 | ||
| n | 111 | 111 | 111 | 111 | 111 | 111 | 111 | 111 | 41 | 40 | 111 | 111 | |
| G1.5 | Corr. | 0.063 | 0.161 | 0.080 | 1 | 0.070 | 0.098 | −0.029 | 0.198 * | 0.065 | 0.065 | 0.326 ** | 0.383 ** |
| Sig. | 0.510 | 0.091 | 0.405 | 0.467 | 0.307 | 0.766 | 0.037 | 0.684 | 0.689 | 0.000 | 0.000 | ||
| n | 111 | 111 | 111 | 111 | 111 | 111 | 111 | 111 | 41 | 40 | 111 | 111 | |
| G1.7 | Corr. | −0.015 | −0.137 | −0.058 | 0.070 | 1 | −0.185 | −0.012 | −0.064 | −0.044 | −0.076 | 0.089 | 0.254 ** |
| Sig. | 0.874 | 0.151 | 0.544 | 0.467 | 0.052 | 0.903 | 0.507 | 0.783 | 0.639 | 0.352 | 0.007 | ||
| n | 111 | 111 | 111 | 111 | 111 | 111 | 111 | 111 | 41 | 40 | 111 | 111 | |
| G2 | Corr. | 0.329 ** | 0.164 | 0.100 | 0.098 | −0.185 | 1 | 0.383 ** | 0.316 ** | 0.077 | 0.197 | 0.351 ** | 0.529 ** |
| Sig. | 0.000 | 0.086 | 0.296 | 0.307 | 0.052 | 0.000 | 0.001 | 0.631 | 0.223 | 0.000 | 0.000 | ||
| n | 111 | 111 | 111 | 111 | 111 | 111 | 111 | 111 | 41 | 40 | 111 | 111 | |
| G3.1 | Corr. | 0.344 ** | 0.158 | 0.128 | −0.029 | −0.012 | 0.383 ** | 1 | 0.483 ** | 0.126 | 0.218 | 0.253 ** | 0.661 ** |
| Sig. | 0.000 | 0.098 | 0.181 | 0.766 | 0.903 | 0.000 | 0.000 | 0.431 | 0.176 | 0.007 | 0.000 | ||
| n | 111 | 111 | 111 | 111 | 111 | 111 | 111 | 111 | 41 | 40 | 111 | 111 | |
| G3.2 | Corr. | 0.172 | 0.021 | 0.128 | 0.198 * | −0.064 | 0.316 ** | 0.483 ** | 1 | 0.114 | 0.197 | 0.253 ** | 0.599 ** |
| Sig. | 0.071 | 0.827 | 0.181 | 0.037 | 0.507 | 0.001 | 0.000 | 0.478 | 0.223 | 0.007 | 0.000 | ||
| n | 111 | 111 | 111 | 111 | 111 | 111 | 111 | 111 | 41 | 40 | 111 | 111 | |
| G3.3 | Corr. | 0.096 | a | 0.025 | 0.065 | −0.044 | 0.077 | 0.126 | 0.114 | 1 | 1.000 ** | 0.052 | 0.251 |
| Sig. | 0.552 | 0.000 | 0.877 | 0.684 | 0.783 | 0.631 | 0.431 | 0.478 | 0.000 | 0.747 | 0.113 | ||
| n | 41 | 41 | 41 | 41 | 41 | 41 | 41 | 41 | 41 | 15 | 41 | 41 | |
| G3.4 | Corr. | 0.150 | a | a | 0.065 | −0.076 | 0.197 | 0.218 | 0.197 | 1.000 ** | 1 | a | 0.446 ** |
| Sig. | 0.355 | 0.000 | 0.000 | 0.689 | 0.639 | 0.223 | 0.176 | 0.223 | 0.000 | 0.000 | 0.004 | ||
| n | 40 | 40 | 40 | 40 | 40 | 40 | 40 | 40 | 15 | 40 | 40 | 40 | |
| G3.5 | Corr. | 0.393 ** | 0.297 ** | 0.191 * | 0.326 ** | 0.089 | 0.351 ** | 0.253 ** | 0.253 ** | 0.052 | a | 1 | 0.595 ** |
| Sig. | 0.000 | 0.002 | 0.045 | 0.000 | 0.352 | 0.000 | 0.007 | 0.007 | 0.747 | 0.000 | 0.000 | ||
| n | 111 | 111 | 111 | 111 | 111 | 111 | 111 | 111 | 41 | 40 | 111 | 111 | |
| DQI2 | Corr. | 0.573 ** | 0.299 ** | 0.287 ** | 0.383 ** | 0.254 ** | 0.529 ** | 0.661 ** | 0.599 ** | 0.251 | 0.446 ** | 0.595 ** | 1 |
| Sig. | 0.000 | 0.001 | 0.002 | 0.000 | 0.007 | 0.000 | 0.000 | 0.000 | 0.113 | 0.004 | 0.000 | ||
| n | 111 | 111 | 111 | 111 | 111 | 111 | 111 | 111 | 41 | 40 | 111 | 111 | |
Note: 1 The full name of the disclosure index component is presented in Appendix A, (Table A2). * correlation is significant at the 0.05 level (2-tailed). ** Correlation is significant at the 0.01 level (2-tailed). Abbreviations used: Corr.—correlation coefficient; Sig.—significance; n—number of observations; a —correlation cannot be computed because at least one of the variables is constant.
Table A22.
Correlation of disclosure quality index DQI3 and its components.
Table A22.
Correlation of disclosure quality index DQI3 and its components.
| Component Code 1 | G0.1 | G0.2 | G1.1 | D1.2 | G1.3 | G1.4 | G1.5 | G1.6 | G1.7 | G2 | G3.1 | G3.2 | G3.3 | G3.4 | G3.5 | DQI3 | |
|---|---|---|---|---|---|---|---|---|---|---|---|---|---|---|---|---|---|
| G0.1 | Corr. | 1 | 0.439 ** | −0.282 ** | 0.193 * | 0.047 | 0.067 | −0.054 | 0.332 ** | −0.143 | 0.150 | 0.005 | 0.181 | −0.072 | −0.065 | 0.076 | 0.310 ** |
| Sig. | 0.000 | 0.003 | 0.043 | 0.623 | 0.483 | 0.576 | 0.000 | 0.135 | 0.116 | 0.960 | 0.057 | 0.656 | 0.689 | 0.430 | 0.001 | ||
| n | 111 | 111 | 111 | 111 | 111 | 111 | 111 | 111 | 111 | 111 | 111 | 111 | 41 | 40 | 111 | 111 | |
| G0.2 | Corr. | 0.439 ** | 1 | −0.223 * | 0.193 * | 0.047 | −0.088 | −0.054 | 0.265 ** | −0.060 | 0.199 * | −0.054 | 0.122 | −0.044 | 0.698 ** | 0.076 | 0.350 ** |
| Sig. | 0.000 | 0.019 | 0.043 | 0.623 | 0.356 | 0.576 | 0.005 | 0.530 | 0.037 | 0.574 | 0.201 | 0.783 | 0.000 | 0.430 | 0.000 | ||
| n | 111 | 111 | 111 | 111 | 111 | 111 | 111 | 111 | 111 | 111 | 111 | 111 | 41 | 40 | 111 | 111 | |
| G1.1 | Corr. | −0.282 ** | −0.223 * | 1 | −0.204 * | 0.110 | 0.157 | 0.066 | −0.131 | −0.123 | 0.010 | −0.088 | 0.061 | 0.188 | 0.241 | −0.179 | 0.084 |
| Sig. | 0.003 | 0.019 | 0.032 | 0.251 | 0.101 | 0.491 | 0.169 | 0.199 | 0.919 | 0.357 | 0.526 | 0.239 | 0.134 | 0.060 | 0.378 | ||
| n | 111 | 111 | 111 | 111 | 111 | 111 | 111 | 111 | 111 | 111 | 111 | 111 | 41 | 40 | 111 | 111 | |
| D1.2 | Corr. | 0.193 * | 0.193 * | −0.204 * | 1 | 0.085 | 0.007 | 0.063 | 0.321 ** | −0.015 | 0.329 ** | 0.344 ** | 0.172 | 0.096 | 0.150 | 0.393 ** | 0.554 ** |
| Sig. | 0.043 | 0.043 | 0.032 | 0.375 | 0.940 | 0.510 | 0.001 | 0.874 | 0.000 | 0.000 | 0.071 | 0.552 | 0.355 | 0.000 | 0.000 | ||
| n | 111 | 111 | 111 | 111 | 111 | 111 | 111 | 111 | 111 | 111 | 111 | 111 | 41 | 40 | 111 | 111 | |
| G1.3 | Corr. | 0.047 | 0.047 | 0.110 | 0.085 | 1 | 0.701 ** | 0.161 | 0.079 | −0.137 | 0.164 | 0.158 | 0.021 | a | a | 0.297 ** | 0.314 ** |
| Sig. | 0.623 | 0.623 | 0.251 | 0.375 | 0.000 | 0.091 | 0.412 | 0.151 | 0.086 | 0.098 | 0.827 | 0.000 | 0.000 | 0.002 | 0.001 | ||
| n | 111 | 111 | 111 | 111 | 111 | 111 | 111 | 111 | 111 | 111 | 111 | 111 | 41 | 40 | 111 | 111 | |
| G1.4 | Corr. | 0.067 | −0.088 | 0.157 | 0.007 | 0.701 ** | 1 | 0.080 | 0.112 | −0.058 | 0.100 | 0.128 | 0.128 | 0.025 | a | 0.191 * | 0.306 ** |
| Sig. | 0.483 | 0.356 | 0.101 | 0.940 | 0.000 | 0.405 | 0.241 | 0.544 | 0.296 | 0.181 | 0.181 | 0.877 | 0.000 | 0.045 | 0.001 | ||
| n | 111 | 111 | 111 | 111 | 111 | 111 | 111 | 111 | 111 | 111 | 111 | 111 | 41 | 40 | 111 | 111 | |
| G1.5 | Corr. | −0.054 | −0.054 | 0.066 | 0.063 | 0.161 | 0.080 | 1 | 0.083 | 0.070 | 0.098 | −0.029 | 0.198 * | 0.065 | 0.065 | 0.326 ** | 0.334 ** |
| Sig. | 0.576 | 0.576 | 0.491 | 0.510 | 0.091 | 0.405 | 0.389 | 0.467 | 0.307 | 0.766 | 0.037 | 0.684 | 0.689 | 0.000 | 0.000 | ||
| n | 111 | 111 | 111 | 111 | 111 | 111 | 111 | 111 | 111 | 111 | 111 | 111 | 41 | 40 | 111 | 111 | |
| G1.6 | Corr. | 0.332 ** | 0.265 ** | −0.131 | 0.321 ** | 0.079 | 0.112 | 0.083 | 1 | −0.061 | 0.258 ** | 0.204 * | 0.246 ** | −0.096 | 0.225 | 0.126 | 0.558 ** |
| Sig. | 0.000 | 0.005 | 0.169 | 0.001 | 0.412 | 0.241 | 0.389 | 0.524 | 0.006 | 0.032 | 0.009 | 0.552 | 0.163 | 0.187 | 0.000 | ||
| n | 111 | 111 | 111 | 111 | 111 | 111 | 111 | 111 | 111 | 111 | 111 | 111 | 41 | 40 | 111 | 111 | |
| G1.7 | Corr. | −0.143 | −0.060 | −0.123 | −0.015 | −0.137 | −0.058 | 0.070 | −0.061 | 1 | −0.185 | −0.012 | −0.064 | −0.044 | −0.076 | 0.089 | 0.114 |
| Sig. | 0.135 | 0.530 | 0.199 | 0.874 | 0.151 | 0.544 | 0.467 | 0.524 | 0.052 | 0.903 | 0.507 | 0.783 | 0.639 | 0.352 | 0.235 | ||
| n | 111 | 111 | 111 | 111 | 111 | 111 | 111 | 111 | 111 | 111 | 111 | 111 | 41 | 40 | 111 | 111 | |
| G2 | Corr. | 0.150 | 0.199 * | 0.010 | 0.329 ** | 0.164 | 0.100 | 0.098 | 0.258 ** | −0.185 | 1 | 0.383 ** | 0.316 ** | 0.077 | 0.197 | 0.351 ** | 0.558 ** |
| Sig. | 0.116 | 0.037 | 0.919 | 0.000 | 0.086 | 0.296 | 0.307 | 0.006 | 0.052 | 0.000 | 0.001 | 0.631 | 0.223 | 0.000 | 0.000 | ||
| n | 111 | 111 | 111 | 111 | 111 | 111 | 111 | 111 | 111 | 111 | 111 | 111 | 41 | 40 | 111 | 111 | |
| G3.1 | Corr. | 0.005 | −0.054 | −0.088 | 0.344 ** | 0.158 | 0.128 | −0.029 | 0.204 * | −0.012 | 0.383 ** | 1 | 0.483 ** | 0.126 | 0.218 | 0.253 ** | 0.569 ** |
| Sig. | 0.960 | 0.574 | 0.357 | 0.000 | 0.098 | 0.181 | 0.766 | 0.032 | 0.903 | 0.000 | 0.000 | 0.431 | 0.176 | 0.007 | 0.000 | ||
| n | 111 | 111 | 111 | 111 | 111 | 111 | 111 | 111 | 111 | 111 | 111 | 111 | 41 | 40 | 111 | 111 | |
| G3.2 | Corr. | 0.181 | 0.122 | 0.061 | 0.172 | 0.021 | 0.128 | 0.198 * | 0.246 ** | −0.064 | 0.316 ** | 0.483 ** | 1 | 0.114 | 0.197 | 0.253 ** | 0.630 ** |
| Sig. | 0.057 | 0.201 | 0.526 | 0.071 | 0.827 | 0.181 | 0.037 | 0.009 | 0.507 | 0.001 | 0.000 | 0.478 | 0.223 | 0.007 | 0.000 | ||
| n | 111 | 111 | 111 | 111 | 111 | 111 | 111 | 111 | 111 | 111 | 111 | 111 | 41 | 40 | 111 | 111 | |
| G3.3 | Corr. | −0.072 | −0.044 | 0.188 | 0.096 | a | 0.025 | 0.065 | −0.096 | −0.044 | 0.077 | 0.126 | 0.114 | 1 | 1.000 ** | 0.052 | 0.244 |
| Sig. | 0.656 | 0.783 | 0.239 | 0.552 | 0.000 | 0.877 | 0.684 | 0.552 | 0.783 | 0.631 | 0.431 | 0.478 | 0.000 | 0.747 | 0.123 | ||
| n | 41 | 41 | 41 | 41 | 41 | 41 | 41 | 41 | 41 | 41 | 41 | 41 | 41 | 15 | 41 | 41 | |
| G3.4 | Corr. | −0.065 | 0.698 ** | 0.241 | 0.150 | a | a | 0.065 | 0.225 | −0.076 | 0.197 | 0.218 | 0.197 | 1.000 ** | 1 | a | 0.517 ** |
| Sig. | 0.689 | 0.000 | 0.134 | 0.355 | 0.000 | 0.000 | 0.689 | 0.163 | 0.639 | 0.223 | 0.176 | 0.223 | 0.000 | 0.000 | 0.001 | ||
| n | 40 | 40 | 40 | 40 | 40 | 40 | 40 | 40 | 40 | 40 | 40 | 40 | 15 | 40 | 40 | 40 | |
| G3.5 | Corr. | 0.076 | 0.076 | −0.179 | 0.393 ** | 0.297 ** | 0.191 * | 0.326 ** | 0.126 | 0.089 | 0.351 ** | 0.253 ** | 0.253 ** | 0.052 | a | 1 | 0.498 ** |
| Sig. | 0.430 | 0.430 | 0.060 | 0.000 | 0.002 | 0.045 | 0.000 | 0.187 | 0.352 | 0.000 | 0.007 | 0.007 | 0.747 | 0.000 | 0.000 | ||
| n | 111 | 111 | 111 | 111 | 111 | 111 | 111 | 111 | 111 | 111 | 111 | 111 | 41 | 40 | 111 | 111 | |
| DQI3 | Corr. | 0.310 ** | 0.350 ** | 0.084 | 0.554 ** | 0.314 ** | 0.306 ** | 0.334 ** | 0.558 ** | 0.114 | 0.558 ** | 0.569 ** | 0.630 ** | 0.244 | 0.517 ** | 0.498 ** | 1 |
| Sig. | 0.001 | 0.000 | 0.378 | 0.000 | 0.001 | 0.001 | 0.000 | 0.000 | 0.235 | 0.000 | 0.000 | 0.000 | 0.123 | 0.001 | 0.000 | ||
| n | 111 | 111 | 111 | 111 | 111 | 111 | 111 | 111 | 111 | 111 | 111 | 111 | 41 | 40 | 111 | 111 | |
Note: 1 The full name of the disclosure index component is presented in Appendix A, (Table A3). * Correlation is significant at the 0.05 level (2-tailed). ** Correlation is significant at the 0.01 level (2-tailed). Abbreviations used: Corr.—correlation coefficient; Sig.—significance; n—number of observations; a —correlation cannot be computed because at least one of the variables is constant.
Note
| 1 | The titles of the financial items and the annual financial statements are used in accordance with International Financial Reporting Standards (IFRSs). |
References
- Abdullah, Mazni, Lisa Evans, Ian Fraser, and Ioannis Tsalavoutas. 2015. IFRS Mandatory Disclosures in Malaysia: The Influence of Family Control and the Value (Ir)Relevance of Compliance Levels. Accounting Forum 39: 328–48. [Google Scholar] [CrossRef]
- Abudy, Menachem, Simon Benninga, and Efrat Shust. 2016. The Cost of Equity for Private Firms. Journal of Corporate Finance 37: 431–43. [Google Scholar] [CrossRef]
- Adi, Sasono, Dwi Martani, Bambang Pamungkas, and Robert A. Simanjuntak. 2016. Analysis of the Quality of Performance Report of the Local Government on Websites: Indonesian Case. Cogent Business and Management 3: 1–17. [Google Scholar] [CrossRef]
- Ali, Engku Ismail Engku, and Siti Zabedah Saidin. 2016. Developing Mandatory Disclosure Index (MDI) of Financial Statement in Malaysian Local Government. Proceedings of the International Conference on Accounting Studies (ICAS), 332–337. [Google Scholar]
- Ali, Muhammad Jahangir, Kamran Ahmed, and Darren Henry. 2004. Disclosure Compliance with National Accounting Standards by Listed Companies in South Asia. Accounting and Business Research 34: 183–99. [Google Scholar] [CrossRef]
- Almarayeh, Taha Suleiman, Beatriz Aibar-Guzmán, and Modar Abdullatif. 2020. Does Audit Quality Influence Earnings Management in Emerging Markets? Evidence from Jordan. Revista de Contabilidad-Spanish Accounting Review 23: 64–74. [Google Scholar] [CrossRef]
- Andre, Paul, Dionysia Dionysiou, and Ioannis Tsalavoutas. 2018. Mandated Disclosures under IAS 36 Impairment of Assets and IAS 38 Intangible Assets: Value Relevance and Impact on Analysts’ Forecasts. Applied Economics 50: 707–25. [Google Scholar] [CrossRef]
- Bank of Lithuania. 2008. Financial Stability Review. Available online: https://www.lb.lt/lt/media/force_download/?url=/uploads/publications/docs/fsa_2008.pdf. (accessed on 31 January 2020).
- Barako, Dulacha G., Phil Hancock, and H. Y. Izan. 2006. Factors Influencing Voluntary Corporate Disclosure by Kenyan Companies. Corporate Governance: An. International Review 14: 107–25. [Google Scholar] [CrossRef]
- Barber, Brad M., and Terrance Odean. 2008. All That Glitters: The Effect of Attention and News on the Buying Behavior of Individual and Institutional Investors. Review of Financial Studies 21: 785–818. [Google Scholar] [CrossRef]
- Barth, Mary E., Wayne R. Landsman, and Mark H. Lang. 2008. International Accounting Standards and Accounting Quality. Journal of Accounting Research 46: 467–98. [Google Scholar] [CrossRef]
- Business Accounting Standard No. 1 “Financial Statements” (BAS 1). 2015. Approved by Order No. VAS-12 of 13 May 2010 of the Director of the Authority of Audit and Accounting (Revised version of Order No. VAS-26 of 28 May 2015 of the Director of the Authority of Audit and Accounting). Available online: http://www.avnt.lt/assets/Veiklos-sritys/Apskaita/VAS/VAS-angl-kalba/1-BAS-FINANCIAL-STATEMENTS.pdf; http://www.avnt.lt/assets/Apskaita/VAS-2020/1-VAS.pdf (Revised version) (accessed on 31 January 2020).
- Business Accounting Standard No. 6 “Explanatory Notes” (BAS 6). 2015. Approved by Order No. VAS-24 of 21 December 2012 of the Director of the Authority of Audit and Accounting (Revised version of Order No. VAS-19 of 28 May 2015 of the Director of the Authority of Audit and Accounting). Available online: http://www.avnt.lt/assets/Veiklos-sritys/Apskaita/VAS/VAS-angl-kalba/6-BAS-EXPLANATORY-NOTES.pdf; http://www.avnt.lt/assets/Apskaita/VAS-2020/6-VAS.pdf (Revised version) (accessed on 31 January 2020).
- Business Accounting Standard No. 12 “Non-Current Tangible Assets” (BAS 12). 2015. Approved by Order No. VAS-9 of 9 September 2008 of the Director of the Authority of Audit and Accounting (Revised Version of Order No. VAS-49 of 13 October 2015 of the Director of the Authority of Audit and Accounting). Available online: http://www.avnt.lt/assets/Veiklos-sritys/Apskaita/VAS/VAS-angl-kalba/12-BAS-NON-CURRENT-TANGIBLE-http://www.avnt.lt/assets.pdf; http://www.avnt.lt/assets/Apskaita/VAS-2020/12-VAS.pdf (Revised version) (accessed on 31 January 2020).
- Beattie, Vivien, Bill McInnes, and Stella Fearnley. 2004. A Methodology for Analysing and Evaluating Narratives in Annual Reports: A Comprehensive Descriptive Profile and Metrics for Disclosure Quality Attributes. Accounting Forum 28: 205–36. [Google Scholar] [CrossRef]
- Brammer, Stephen, and Andrew Millington. 2006. Firm Size, Organizational Visibility and Corporate Philanthropy: An Empirical Analysis. Business Ethics: A European Review 15: 6–18. [Google Scholar] [CrossRef]
- Bullen, Halsey, and Kimberley Crook. 2005. Revisiting the Concepts. A New Conceptual Framework Project. International Accounting Standards Board. Available online: https://www.actuaries.org/CTTEES_INSACC/Documents/Rio_Item_7c_FASB_Communications_Paper.pdf (accessed on 31 January 2020).
- Bunget, Ovidiu Constantin, Rodica Gabriela Blidisel, Liliana Feleaga, and Irimie Emil Popa. 2014. Empirical Study of Intangible Assets in Romanian Municipalities. E a M: Ekonomie a Management 17: 136–51. [Google Scholar] [CrossRef]
- Burgstahler, David C., Luzi Hail, and Christian Leuz. 2006. The Importance of Reporting Incentives: Earnings Management in European Private and Public Firms. Accounting Review 81: 983–1016. [Google Scholar] [CrossRef]
- Chalmers, Keryn, and Jayne M. Godfrey. 2004. Reputation Costs: The Impetus for Voluntary Derivative Financial Instrument Reporting. Accounting, Organisations and Society 29: 95–125. [Google Scholar] [CrossRef]
- Dargenidou, Christina, Stuart McLeay, and Ivana Raonic. 2006. Expected Earnings Growth and the Cost of Capital: An Analysis of Accounting Regime Change in the European Financial Market. Abacus 42: 388–414. [Google Scholar] [CrossRef]
- Devalle, Alain, Fabio Rizzato, and Donatella Busso. 2016. Disclosure Indexes and Compliance with Mandatory Disclosure—The Case of Intangible Assets in the Italian Market. Advances in Accounting 35: 8–25. [Google Scholar] [CrossRef]
- Dey, Ripon, Syed Hossain, and Zabihollah Rezaee. 2018. Financial Risk Disclosure and Financial Attributes among Publicly Traded Manufacturing Companies: Evidence from Bangladesh. Journal of Risk and Financial Management 11: 50. [Google Scholar] [CrossRef]
- Dilling, Petra F. A., and Sinan Caykoylu. 2019. Determinants of Companies That Disclose High-Quality Integrated Reports. Sustainability (Switzerland) 11: 3744. [Google Scholar] [CrossRef]
- Ebrahim, Ahmed, and Tarek Abdel Fattah. 2015. Corporate Governance and Initial Compliance with IFRS in Emerging Markets: The Case of Income Tax Accounting in Egypt. Journal of International Accounting, Auditing and Taxation 24: 46–60. [Google Scholar] [CrossRef]
- Falkman, Pär, and Torbjorn Tagesson. 2008. Accrual Accounting Does Not Necessarily Mean Accrual Accounting: Factors That Counteract Compliance with Accounting Standards in Swedish Municipal Accounting. Scandinavian Journal of Management 24: 271–83. [Google Scholar] [CrossRef]
- Fischer, Mary, Teresa P. Gordon, and Marla A. Kraut. 2010. Meeting User Information Needs: The Impact of Major Changes in FASB and GASB Standards on Financial Reporting by Colleges and Universities. Journal of Accounting and Public Policy 29: 374–99. [Google Scholar] [CrossRef]
- Fonseka, Mohan, Theja Rajapakse, and Gao Liang Tian. 2019. The Effects of Environmental Information Disclosure and Energy Types on the Cost of Equity: Evidence from the Energy Industry in China. Abacus 55: 362–410. [Google Scholar] [CrossRef]
- Gabrini, Carl Joseph. 2013. The Effect of Internal Audit on Governance: Maintaining Legitimacy of Local Government. Florida: Florida State University. [Google Scholar]
- Garcia, Ana Carcaba, and Jesus Garcia-Garcia. 2010. Determinants of Online Reporting of Accounting Information by Spanish Local Government Authorities. Local Government Studies 36: 679–95. [Google Scholar] [CrossRef]
- Giroux, Gary, and Andrew J. McLelland. 2003. Governance structures and accounting at large municipalities. Journal of Accounting and Public Policy 22: 203–30. [Google Scholar] [CrossRef]
- Gordon, Teresa, Mary Fischer, David Malone, and Greg Tower. 2002. A Comparative Empirical Examination of Extent of Disclosure by Private and Public Colleges and Universities in the United States. Journal of Accounting and Public Policy 21: 235–75. [Google Scholar] [CrossRef]
- Graham, John R., Campbell R. Harvey, and Shiva Rajgopal. 2005. The Economic Implications of Corporate Financial Reporting. Journal of Accounting and Economics 40: 3–73. [Google Scholar] [CrossRef]
- Grullon, Gustavo, George Kanatas, and James P. Weston. 2004. Advertising, Breadth of Ownership, and Liquidity. Review of Financial Studies 17: 439–61. [Google Scholar] [CrossRef]
- Guo, Jun, Pinghsun Huang, and Yan Zhang. 2020. Accounting Conservatism and Corporate Social Responsibility. Advances in Accounting 51: 100501. [Google Scholar] [CrossRef]
- Hall, Thomas, Cesario Mateus, and Irina Bezhentseva Mateus. 2014. What Determines Cash Holdings at Privately Held and Publicly Traded Firms? Evidence from 20 Emerging Markets. International Review of Financial Analysis 33: 104–16. [Google Scholar] [CrossRef]
- Hassan, Omaima. 2018. The Impact of Voluntary Environmental Disclosure on Firm Value: Does Organizational Visibility Play a Mediation Role? Business Strategy and the Environment 27: 1569–82. [Google Scholar] [CrossRef]
- Hassan, Omaima, and Claire Marston. 2010. Omaima Hassan and Claire Marston Disclosure Measurement in the Empirical Accounting Literature: A Review Article. Working Paper No. 18. Uxbridge: Brunel University. Available online: http://www.Qass.Org.Uk/2011-May_Brunel-Conference/Hassan.Pdf (accessed on 31 January 2019).
- Hassan, Mohamat Sabri, Norman Mohd Saleh, and Mara Ridhuan Che Abd Rahman. 2008. Determinants of Financial Instruments Disclosure Quality among Listed Firms in Malaysia. Social Science Research Network, 1–27. [Google Scholar] [CrossRef]
- Hassan, Omaima, Peter Romilly, Gianluigi Giorgioni, and David Power. 2009. The Value Relevance of Disclosure: Evidence from the Emerging Capital Market of Egypt. International Journal of Accounting 44: 79–102. [Google Scholar] [CrossRef]
- Healy, Paul M., and Krishna G. Palepu. 2001. Information Asymmetry, Corporate Disclosure, and the Capital Markets: A Review of the Empirical Disclosure Literature. Journal of Accounting and Economics 31: 405–40. [Google Scholar] [CrossRef]
- Hellman, Niclas, Jordi Carenys, and Soledad Moya Gutierrez. 2018. Introducing More IFRS Principles of Disclosure–Will the Poor Disclosers Improve? Accounting in Europe 15: 242–321. [Google Scholar] [CrossRef]
- Hellstrom, Katerina. 2009. Financial Accounting Quality in a European Transition Economy: The Case of the Czech Republic. Ph.D. thesis, Stockholm School of Economics, Stockholm, Sweden. [Google Scholar]
- Holder, Anthony, Khondkar Karim, Karen (Jingrong) Lin, and Robert Pinsker. 2016. Do Material Weaknesses in Information Technology-Related Internal Controls Affect Firms’ 8-K Filing Timeliness and Compliance? International Journal of Accounting Information Systems 22: 26–43. [Google Scholar] [CrossRef]
- Hope, Ole Kristian, Wayne B. Thomas, and Dushyantkumar Vyas. 2013. Financial Reporting Quality of U.S. Private and Public Firms. Accounting Review 88: 1715–42. [Google Scholar] [CrossRef]
- Houcine, Asma. 2017. The Effect of Financial Reporting Quality on Corporate Investment Efficiency: Evidence from the Tunisian Stock Market. Research in International Business and Finance 42: 321–37. [Google Scholar] [CrossRef]
- IMF. 2011. The World Economic Outlook (WEO) Database. Washington, DC: International Monetary Fund. Available online: http://www.imf.org/external/pubs/ft/weo/2010/01/weodata/index.aspx (accessed on 10 May 2021).
- Ingram, Robert W. 1984. Economic Incentives and the Choice of State Government Accounting Practices University of Chicago Stable. Journal of Accounting Research 22: 126–44. [Google Scholar] [CrossRef]
- International Financial Reporting Standards (IFRSs). 2008. Commission Regulation (EC) No. 1126/2008 of 3 November 2008 Adopting Certain International Accounting Standards in Accordance with Regulation (EC) No. 1606/2002 of the European Parliament and of the Council. Available online: http://eur-lex.europa.eu (accessed on 26 February 2019).
- Kanapickiene, Rasa, and Greta Keliuotyte-Staniuleniene. 2019. Disclosure of Non-Current Tangible Assets Information in Local Government Financial Statements: The Case of Lithuania. Economies 7: 116. [Google Scholar] [CrossRef]
- Kanapickiene, Rasa, and Renatas Spicas. 2019. Credit Risk Assessment Model for Small and Micro-Enterprises: The Case of Lithuania. Risks 7: 67. [Google Scholar] [CrossRef]
- Keizerienė, Eglė. 2016. The Complex Evaluation of the Real Estate Price “Bubble”: Summary of Doctoral Dissertation, Social Sciences, Economics. Kaunas: University of Technology, Klaipėda University, Lithuanian Energy Institute. [Google Scholar]
- Keloharju, Matti, Samuli Knüpfer, and Juhani Linnainmaa. 2012. Do Investors Buy What They Know Product Market Choices and Investment Decisions. Review of Financial Studies 25: 2921–58. [Google Scholar] [CrossRef]
- Kiyak, Deimena, Daiva Labanauskaitė, and Tomas Reichenbachas. 2011. Comparative Analysis of Financial Crisis Types in Lithuania. Regional Formation and Development Studies 2: 57–73. Available online: http://journals.ku.lt/index.php/RFDS/article/viewFile/552/pdf (accessed on 10 May 2021).
- Lambert, Richard, Christian Leuz, and Robert E. Verrecchia. 2007. Accounting Information, Disclosure, and the Cost of Capital. Journal of Accounting Research 45: 385–420. [Google Scholar] [CrossRef]
- Lang, Mark, Jana Smith Raedy, and Michelle Higgins Yetman. 2003. How Representative Are Firms That Are Cross-Listed in the United States? An Analysis of Accounting Quality. Journal of Accounting Research 41: 363–86. [Google Scholar] [CrossRef]
- Laswad, Fawzi, Richard Fisher, and Peter Oyelere. 2005. Determinants of Voluntary Internet Financial Reporting by Local Government Authorities. Journal of Accounting and Public Policy 24: 101–21. [Google Scholar] [CrossRef]
- Leung, Sidney, Lee Parker, and John Courtis. 2015. Impression Management through Minimal Narrative Disclosure in Annual Reports. British Accounting Review 47: 275–89. [Google Scholar] [CrossRef]
- Lin, Ping, Boqiang Lin, and Fu Lei. 2019. Influence of CEO Characteristics on Accounting Information Disclosure Quality—Based on the Mediating Effect of Capital Structure. Emerging Markets Finance and Trade, 1–23. [Google Scholar] [CrossRef]
- Mamun, Syed Abdulla Al, and Hasnah Kamardin. 2014. Corporate Voluntary Disclosure Practices of Banks in Bangladesh. Procedia Social and Behavioral Sciences 164: 258–63. [Google Scholar] [CrossRef][Green Version]
- Martani, Dwi, and Annisa Lestiani. 2012. Disclosure in Local Government Financial Statements: The Case of Indonesia. Global Review of Accounting and Finance 3: 67–84. [Google Scholar]
- Martínez-Ferrero, Jennifer. 2014. Consequences of Financial Reporting Quality on Corporate Performance. Evidence at the International Level. Estudios de Economía 41: 49–88. Available online: http://www.scielo.cl/pdf/ede/v41n1/art02.pdf (accessed on 10 May 2021).
- Mazzi, Francesco, Paul André, Dionysia Dionysiou, and Ioannis Tsalavoutas. 2017. Compliance with Goodwill-Related Mandatory Disclosure Requirements and the Cost of Equity Capital. Accounting and Business Research 47: 268–312. [Google Scholar] [CrossRef]
- Mir, Monir, Harun Harun, and Wahyu Sutiyono. 2019. Evaluating the Implementation of a Mandatory Dual Reporting System: The Case of Indonesian Local Government. Australian Accounting Review 29: 80–94. [Google Scholar] [CrossRef]
- Mnif, Yosra, and Oumaima Znazen. 2020. Corporate Governance and Compliance with IFRS 7: The Case of Financial Institutions Listed in Canada. Managerial Auditing Journal 35: 448–74. [Google Scholar] [CrossRef]
- Moreno-Enguix, Maria, Ester Gras-Gil, and Joaquin Henandez-Fernandez. 2019. Relation between Internet Financial Information Disclosure and Internal Control in Spanish Local Governments. Aslib Journal of Information Management 71: 176–94. [Google Scholar] [CrossRef]
- Moumen, Néjia, Hakim Ben Othman, and Khaled Hussainey. 2015. The Value Relevance of Risk Disclosure in Annual Reports: Evidence from MENA Emerging Markets. Research in International Business and Finance 34: 177–204. [Google Scholar] [CrossRef]
- Nandi, Sunil, and Santanu Kumar Ghosh. 2013. Corporate Governance Attributes, Firm Characteristics and the Level of Corporate Disclosure: Evidence from the Indian Listed Firms. Decision Science Letters 2: 45–58. [Google Scholar] [CrossRef]
- Nguyen, Thi Mai Huong, Ngoc Tien Nguyen, and Hong Thu Nguyen. 2020. Factors Affecting Voluntary Information Disclosure on Annual Reports: Listed Companies in Ho Chi Minh City Stock Exchange. Journal of Asian Finance, Economics and Business 7: 53–62. [Google Scholar] [CrossRef]
- Peek, Erik, Rick Cuijpers, and Willem Buijink. 2010. Creditors’ and Shareholders’ Reporting Demands in Public versus Private Firms: Evidence from Europe. Contemporary Accounting Research 27: 49–91. [Google Scholar] [CrossRef]
- Penman, Stephen H., and Xiao Jun Zhang. 2002. Accounting Conservatism, the Quality of Earnings, and Stock Returns. Accounting Review 77: 237–64. [Google Scholar] [CrossRef]
- Pivac, Snjezana, Tina Vuko, and Marko Cular. 2017. Analysis of annual report disclosure quality for listed companies in transition countries. Economic Research-Ekonomska Istrazivanja 30: 721–31. [Google Scholar] [CrossRef]
- Renkas, Jurij, Olena Goncharenko, and Olena Lukianets. 2015. Quality—Of Financial Reporting: Approaches to Measuring. International Journal of Accounting and Economics Studies 4: 1–5. [Google Scholar] [CrossRef]
- Rep, Ana, Katarina Žager, and Cidália Oliveira. 2019. The Role of Firm Characteristics in Voluntary Disclosure of IC Information and Its Importance for High-Tech Companies. Journal of Information and Organizational Sciences 43: 185–209. [Google Scholar] [CrossRef]
- Riahi-Belkaoui, Ahmed. 2001. Level of Multinationality, Growth Opportunities, and Size as Determinants of Analyst Ratings of Corporate Disclosure. American Business Review 19: 115–20. [Google Scholar]
- Robbins, Walter A., and Kenneth R. Austin. 1986. Disclosure Quality in Governmental Financial Reports: An Assessment of the Appropriateness of a Compound Measure Disclosure Quality in Governmental Financial Reports: An Assessment of the Appropriateness of a Compound Measure. Journal of Accounting Research 24: 412–21. [Google Scholar] [CrossRef]
- Stanley, Trevor, Natalee Jennings, and Janet Mack. 2008. An Examination of the Content of Community Financial Reports in Queensland Local Government Authorities. Financial Accountability and Management 24: 411–38. [Google Scholar] [CrossRef]
- Steccolini, Ileana. 2004. Is the Annual Report an Accountability Medium? An Empirical Investigation into Italian Local Governments. Financial Accountability and Management 20: 327–50. [Google Scholar] [CrossRef]
- Street, Donna L., and Stephanie M. Bryant. 2000. Disclosure Level and Compliance with IASs: A Comparison of Companies with and without U.S. Listings and Filings. International Journal of Accounting 35: 305–29. [Google Scholar] [CrossRef]
- Street, Donna L., and Sidney J. Gray. 2002. Factors Influencing the Extent of Corporate Compliance with International Accounting Standards: Summary of a Research Monograph. Journal of International Accounting, Auditing and Taxation 11: 51–76. [Google Scholar] [CrossRef]
- Susbiyani, Arik, Bambang Subroto, and Bambang Purnomosidhi. 2014. The Compliance with Mandatory Disclosure of Financial Statement: A Study from Local Government in Indonesia. Research Journal of Finance and Accounting 5: 124–31. [Google Scholar]
- Wang, Mao Chang. 2017. The Relationship between Firm Characteristics and the Disclosure of Sustainability Reporting. Sustainability (Switzerland) 9: 624. [Google Scholar] [CrossRef]
- Wang, Kun, Sewon O., and M. Cathy Claiborne. 2008. Determinants and Consequences of Voluntary Disclosure in an Emerging Market: Evidence from China. Journal of International Accounting, Auditing and Taxation 17: 14–30. [Google Scholar] [CrossRef]
- World Bank. 2019. World Bank Country and Lending Groups. Washington, DC: World Bank. Available online: https://datahelpdesk.worldbank.org/knowledgebase/articles/906519-world-bank-country-and-lending-groups (accessed on 10 May 2021).
- Zimmerman, Jerold. 1977. The Municipal Accounting Maze: An Analysis of Political Incentives. Journal of Accounting Research 15: 107–44. [Google Scholar] [CrossRef]
Publisher’s Note: MDPI stays neutral with regard to jurisdictional claims in published maps and institutional affiliations. |
© 2021 by the authors. Licensee MDPI, Basel, Switzerland. This article is an open access article distributed under the terms and conditions of the Creative Commons Attribution (CC BY) license (https://creativecommons.org/licenses/by/4.0/).