Abstract
This study explores how the volatility spillover mechanism and dynamic dependence among the founding BRICS equity markets, namely IBOVESPA, MICEX, Nifty 50, SSE, and JSE, have evolved over time using a multivariate DCC-GARCH model. The analysis is conducted across three distinct regimes: the pre-COVID-19 period (1 January 2010 to 10 March 2020), the COVID-19 crisis (11 March 2020 to 23 February 2022), and the Russia–Ukraine war and sanction period (24 February 2022 to 31 March 2024). The findings indicate that, prior to the COVID-19 pandemic, the BRICS equity markets experienced significant short-term volatility spillovers and significant volatility persistence, indicative of slow financial integration, as opposed to rapid contagion. In comparison, the COVID-19 pandemic resulted in significant structural shifts in the form of increased shock transmission, greater co-movement, and evident financial contagion among the markets. During the post-COVID-19 conflict period, while there was considerable persistence in volatility, the primary drivers of volatility spillovers were geopolitical. Across the three sub-periods, the volatility spillover network shows pronounced structural changes. Before COVID-19, IBOVESPA, MICEX, and SSE act as net transmitters, while Nifty 50 and JSE are net receivers. During the COVID-19 crisis, SSE and JSE become the main shock transmitters, whereas IBOVESPA, MICEX, and Nifty 50 shift to receiver roles. In the post-COVID-19 Russia–Ukraine war period, the network becomes more asymmetric, with JSE and Nifty 50 again emerging as net transmitters, while MICEX and SSE function primarily as net receivers. Overall, this study demonstrates that BRICS equity market interdependence is regime-specific and greatly dependent on exogenous global events.
1. Introduction
Greater financial market globalization has increased interdependence and integration among world economies. The BRICS economies—Brazil, Russia, India, China, and South Africa—are now leading players in the global economy. As emerging economies with high growth potential, these countries as a whole account for a large share of the world’s population, GDP, and trade volume. Although their capital markets differ in shape and sophistication, they are increasingly integrated through cross-border investments, trade connections, financial deregulation, and similar economic policies. The transmission of volatility between these markets is of concern to investors, policymakers, and financial analysts during economic uncertainty or exogenous shocks.
Volatility spillover is the contagion of shocks or instability from one financial market to another, affecting asset prices, risk management, and portfolio diversification strategies (P. Zhang et al., 2021). Such spillovers tend to be most evident at the onset of crises, when there is geopolitical tension or a macroeconomic policy change. For emerging markets such as BRICS, the effects of volatility transmission are significant, owing to their relatively high external shock sensitivity, unstable capital flows, and varying degrees of market efficiency. Owing to their increasing contributions to international finance, a careful study of volatility interlinkages in the BRICS stock markets is critical.
The BRICS nations (Brazil, Russia, India, China, and South Africa) are a significant and expanding force in the global economy. With their large market capitalization and high growth rates, these emerging markets have drawn the attention of foreign investors. The BRICS nations have emerged as major forces behind global economic expansion; as of 2024, they account for 40% of the world’s GDP. Approximately one-quarter of global exports are attributed to this grouping (Putin, 2024). Together, these economies account for more than 41% of the world’s population and rank among the world’s largest and most influential countries in the 21st century (Jütten & Falkenberg, 2024).
The frequency and severity of financial crises in recent years have created a greater emphasis on the dynamic interdependencies among stock markets. The global financial crisis of 2008, the COVID-19 pandemic, and current geopolitical tensions—viz., the Russia–Ukraine conflict—have pushed uncertainty to a historic high, and it is highly important to research how financial markets react to internal and external shocks. For BRICS, as a group focused on multipolar development and delinking from Western economies, it is vital to identify intra financial interlinkages and dependences. Volatility spillovers in BRICS have implications for domestic capital markets, regional cooperation, trade policy, and macroeconomic coordination.
FPIs, speculators, global investors, and regulators are required to understand the dynamics of volatility transmission among the BRICS countries’ stock markets. Today, the world is more financially interconnected and has become a global village; therefore, disruptions in one market can easily spill over into other stock markets. Such an event can be termed a volatility spillover, with serious asset price implications, portfolio diversification risks, and financial stability concerns.
To best describe the dynamic characteristics of volatility and interdependence among the BRICS stock markets, this study employs the Dynamic Conditional Correlation Generalized Autoregressive Conditional Heteroskedasticity (DCC-GARCH) model to simultaneously estimate the conditional volatilities and correlations, as well as capture the evolution over time of volatility spillovers, in a detailed manner.
This study seeks (1) to quantify and compare the magnitude, direction, and persistence of volatility spillovers among the BRICS stock markets across three distinct regimes—the pre-pandemic period, the COVID-19 pandemic, and the Russia–Ukraine conflict (war) period—and (2) to offer information about the possible effects of volatility spillovers on risk management and portfolio diversification.
BRICS’ financial integration is not static but evolves during global crises. While pre-COVID-19 linkages were characterized by stable integration, COVID-19 amplified contagion, and the post-pandemic war period introduced geopolitically driven spillovers with prolonged volatility. These events underscore the necessity of dynamic modeling approaches, such as DCC-GARCH, to understand evolving market interdependence in an increasingly uncertain global environment.
This study offers insights into the risks and potential of investing in BRICS equity markets for global investors and fund managers. A better understanding of cross-market volatility can guide asset allocation decisions, hedging, and portfolio diversification. For researchers and academics, this study makes a methodological contribution through the application of sophisticated volatility modeling methods to a set of nations that are increasingly shaping the future of the world economy.
Across the three sub-periods, the volatility spillover network exhibits clear structural shifts. In the pre-COVID-19 period, IBOVESPA, MICEX, and SSE emerge as net transmitters of volatility, whereas Nifty 50 and JSE function primarily as net receivers. During the COVID-19 crisis period, the pattern changes markedly, with SSE and JSE becoming the dominant transmitters of shocks, while IBOVESPA, MICEX, and Nifty 50 turn into net receivers. In the post-COVID-19 Russia–Ukraine war period, the network becomes more asymmetric and selective, with JSE and Nifty 50 reappearing as net transmitters of volatility, whereas MICEX and SSE are predominantly positioned as net receivers.
The rest of the paper is organized as follows: the following part discusses the pertinent literature. The third section discusses the methodology, and the fourth section discusses the empirical analysis. The concluding remarks are presented in the final section.
2. Review of the Literature
The empirical literature on BRICS volatility spillovers employs a range of econometric techniques, including traditional GARCH models, DCC-GARCH, multivariate GARCH specifications, and connectedness-based frameworks. Researchers are examining the dynamics of diversification in various nations owing to investors’ growing awareness of the advantages of diversifying their holdings across nations. The literature contains a large number of studies that examine volatility spillover between various nations worldwide. Among the various econometric approaches, DCC-GARCH models have gained prominence in recent BRICS-focused research because of their ability to capture time-varying correlations and dynamic volatility transmission. Das et al. (2025) also explicitly demonstrates that the correlations among BRICS stock markets intensify during crises, leading to a sharp decline in diversification benefits. The DCC-GARCH framework enables the identification of such temporal shifts, which static or mean-based models fail to detect. M. Kumar (2024) examined volatility transmission within BRICS countries during the COVID-19 pandemic and the Russia–Ukraine conflict period using the DCC-GARCH method. The findings confirm the presence of contagion effects, with volatility spillovers being more pronounced across countries than within domestic markets. Das et al. (2025) investigated stock market integration, downside risks, and volatility spillovers across BRICS nations during COVID-19 using a combination of value-at-risk measures, DCC-GARCH models, and the Diebold and Yilmaz (2009) spillover index. Their results indicate that volatility persistence and market connectedness intensify significantly during crisis periods, substantially reducing diversification benefits within BRICS. R. K. Singh et al. (2024) examined risk–return linkages and volatility spillovers across the BRICS stock markets using linear and non-linear GARCH models, including ARCH, GARCH, EGARCH, and TGARCH. Their findings confirm significant bidirectional and unidirectional volatility spillovers across the BRICS markets, with asymmetric responses to negative shocks being more pronounced.
Y. Zhang et al. (2025) demonstrate that dynamic correlation processes effectively capture abrupt changes in volatility transmission patterns during global crises, particularly when investor sentiment and uncertainty dominate market behavior. Their findings reinforce the argument that dynamic correlation modeling is essential in understanding contagion effects in emerging market blocs such as BRICS. Yadav et al. (2023) examined the potential for diversification opportunities by assessing the volatility spillover between the Chinese stock market (SHCOMP) and the Brazilian, Mexican, Indonesian, and Indian stock markets. The study concludes with the finding of spillover effects between China and the Brazilian, Mexican, Indonesian, and Indian stock markets, determined using Granger causality and DCC-GARCH. The findings show that investors can benefit from diversification in emerging economies because of market similarities.
Balci (2024) examined how the COVID-19 pandemic and the Russia–Ukraine war affected the volatility spillover effects between the stock exchanges in the US, Europe, Russia, and Turkey. From 2020 to 2023, the diagonal BEKK-GARCH model was employed to study how volatility is transmitted within stock returns. The study’s findings indicate both mild ARCH effects and considerable GARCH impacts. This indicates that the European market had the greatest impact on other markets during the COVID-19 era. According to the analysis, the US market dominated the conflict. The Turkish market was the least affected by the pandemic and war.
The Indian stock market’s return is mainly influenced by its trailing values. According to the DCC-MGARCH model, India has no volatility spillover to any of the economies listed. This finding has implications for both portfolio managers and academics. Sainath et al. (2023) examined the Indian stock market’s dynamic connectivity and volatility spillover effects with the US, Australia, China, Germany, England, Japan, and Taiwan. The study’s findings show that there is considerable volatility spillover between the Indian and foreign stock exchanges. The contagion effect is demonstrated by the positive spillover effect observed from the S&P 500 and FTSE 100 to the Indian markets. There is a considerable degree of interdependence between the markets, as evidenced by the bidirectional spillover between the Indian stock market and Nikkei 225 and Hang Seng. The researchers discovered a lack of thorough research on the volatility spillovers between the Indian stock market (Nifty 50) and the stock markets of the other BRICS nations, including IBOVESPA, MICEX, SSE, and JSE. D. Singh et al. (2024) assessed the volatility spillover between the BRICS stock and foreign exchange markets and applied the GARCH (1, 1) and EGARCH (1, 1) techniques. They found a two-way volatility spillover between the foreign exchange and stock markets in India, South Africa, and China. Joo et al. (2023) analyzed the volatility spillovers among BRICS countries’ stock markets. They employed DCC-GARCH and asymmetric generalized DCC-GARCH to examine the bidirectional volatility spillover. A significant bidirectional spillover effect was observed, indicating a strong relationship between the stock markets of the BRICS countries. Joo et al. (2023) also explored symmetric and asymmetric volatility spillovers among the BRICS countries’ stock markets. The study indicates long-term integration and a significant bidirectional spillover effect (both symmetric and asymmetric), suggesting a close relationship among the stock markets of the BRICS countries.
Bouzguenda and Jarboui (2025) investigated the interconnectedness of stock returns between the US and BRICS economies over the period of 2016–2023, using daily data. They analyzed the data via quantile- and frequency-based methodologies. The findings reveal spillovers during the COVID-19 pandemic and the Russia–Ukraine war, with the US and Brazil identified as the predominant net transmitters of shocks. Their roles, however, fluctuate across time and quantiles, underscoring the evolving and asymmetric nature of global linkages.
Studies on the dynamic connections between India and the BRICS group are scarce, despite the abundance of literature on volatility spillovers between various markets and geographical areas in India. This gap is significant because investors and policymakers interested in market dynamics, portfolio diversification, risk management, and the economic ties of this influential economic bloc must understand these specific economic relationships. Therefore, the following alternative hypotheses are developed based on the aforementioned studies.
H1.
There is a significant long-run volatility spillover exist among certain pairs of BRICS stock markets.
H2.
Significant short-run volatility spillovers exist among all pairs of BRICS stock markets.
Research Gaps
Although prior studies have examined volatility spillovers and dynamic correlations in international stock markets using DCC-GARCH models, limited research has systematically compared the evolution of interdependence among the founding BRICS stock markets across three distinct regimes, i.e., pre-COVID-19, the COVID-19 crisis, and the Russia–Ukraine war period, within a unified empirical framework. The existing literature either focuses on single crisis episodes or analyzes short time windows, thereby failing to capture structural shifts in volatility transmission and correlation dynamics over multiple crisis regimes. This study addresses this gap by providing a comprehensive regime-based comparison of volatility spillovers and time-varying correlations among the BRICS markets using a consistent DCC-GARCH approach across all three periods.
3. Methodology
This study employed daily return series data from IBOVESPA, MICEX, Nifty 50, SSE, and JSE. The entire dataset was divided into three phases. The first phase was the pre-COVID-19 era, which ran from 1 January to 10 March 2020. The second phase was during COVID-19, lasting from 11 March 2020 until 23 February 2022 (Petropoulou et al., 2024). The third phase was the post-COVID-19 era, spanning from 24 February to 31 March 2024, also known as the Russia–Ukraine war period (Lin et al., 2023).
Since data pertaining to the Russian stock markets from 14 June 2024 were not available in the Refinitiv database, it was decided not to carry out any analysis after 31 March 2024 to ensure consistency in the data analysis.
We utilized the log returns on IBOVESPA (Brazil), MICEX (Russia), Nifty 50 (India), SSE (China), and JSE (South Africa) to determine the volatility spillovers and dynamic connectedness among the markets. Across a broad spectrum, the GARCH (1, 1) model is applied to record volatility clustering in series (Brooks, 2008). The return series is calculated as
logarithmic returns Rt = ln (Pt) − ln (Pt − 1)
3.1. GARCH Model
One of the most unique contributions to financial econometrics was that of Engle (1982), who devised a stochastic approach to Autoregressive Conditional Heteroscedasticity (ARCH) to measure the conditional mean and variance. Later, Bollerslev (1986) developed an advanced ARCH model in the form of GARCH, or Generalized Autoregressive Conditional Heteroscedasticity.
The GARCH models have been proven successful in analyzing the volatility of an asset. Dynamic volatility is well known to spread across interconnected assets and markets (Soni et al., 2023). Following the Dynamic Conditional Correlation (DCC-GARCH) framework proposed by Engle and Sheppard (2001), the conditional covariance matrix is decomposed into time-varying standard deviations and a dynamic correlation structure.
3.2. Time-Varying Conditional Correlation Model
The DCC-GARCH model is a very powerful econometric model for time-varying correlation and volatility pattern modeling between multiple financial assets or markets. Compared to static correlation models, the DCC-GARCH model allows for the more advanced modeling of changing relationships over time, providing better insight into how volatility in one market affects others. This is particularly relevant in the context of the BRICS economies, where financial markets are characterized by high volatility, frequent structural shifts, and ongoing regulatory reforms, leading to time-varying patterns of cross-market dependence.
The model is a non-linear combination of univariate GARCH models and is formulated as follows.
The conditional variance–covariance matrix is decomposed as
where is the conditional covariance matrix, is a diagonal matrix containing conditional standard deviations, and is the time-varying conditional correlation matrix.
The diagonal matrix of conditional standard deviations is represented as
or in matrix form as
where represents the conditional variance of asset at time .
Each conditional variance follows a univariate GARCH (1, 1) process
where , , and , with the stationarity condition .
The matrix Rt represents the correlation matrix of standard errors ut, and the conditional correlation matrix Rt takes the form of a symmetric matrix as follows:
Two fundamental requirements need to be met in order to create the conditional correlation matrix Rt:
- Since the covariance matrix Ht is positive definite, Rt also needs to be positive definite;
- The conditional correlation matrix Rt’s members must all be less than or equal to 1.
To verify that the two conditions are satisfied in the conditional correlation matrix, it can be split as follows:
where
denotes an N × N symmetric positive definite matrix stated as
where
is an N × N unconditional covariance matrix.
Here, is the standard error, where are the non-negative parameter scalars so that < 1 to ensure that the covariance is positive.
also guarantees that a diagonal matrix with the square root elements of the principal diagonal matrix is Qt.
Source: (Alshenawy & Abdo, 2023).
3.3. Dynamic Connectedness Approach
The Vector Impulse Response Function (VIRF) measures how a shock or innovation in one variable impacts another variable, which is helpful in performing Generalized Forecast Error Variance Decomposition (GFEVD) to understand the contributions of a variable to the forecast error of another variable. This decomposition provides the contributions of each variable to the forecast error variance of the target variable.
To facilitate comparisons, these decompositions (shares) are then normalized to make the results more interpretable and comparable. This ensures that the combined influences of all variables sum to 100% for each forecast error variance decomposition, making it easier to compare across variables (i) and periods. The calculation is conducted as follows:
where and .
measures how much of the uncertainty (forecast error variance) in market is explained by shocks originating from market , relative to the total system-wide shocks.
The total connectedness index (TCI) is calculated as
The spillovers that variable i communicates with variables j, which are known as total directional connected TO others, are calculated as
Meanwhile, the spillovers that variable i receives from the variables j, which are described as total directional connectedness FROM others, are evaluated as
The net total directional connectedness explains the impact that variable i has on the analyzed network:
If any variable i is a net transmitter of innovation or shocks, it indicates that the NET of variable i is positive or that the network is being driven by variable i. Conversely, if any variable i is a net receiver of innovation or shocks, this implies that the NET of variable i is negative and it is driven by the network. Lastly, the pairwise directional connectedness (NET) (NPDC) between variable i and variable j is evaluated as follows:
A positive value of NPDCij suggests that variable i dominates variable j, and a negative value implies that variable i is dominated by variable j.
4. Empirical Results
The research outcomes are presented in three sections: descriptive statistics are covered in the first section, followed by unconditional correlations in the second section; the third section highlights the DCC-GARCH model; and, finally, the Diebold and Yilmaz connectedness approach is applied. The central tendency metrics of the return series, such as the mean, median, skewness, kurtosis, and standard deviation of Nifty 50, MICEX, IBOVESPA, JSE, and SSE, are shown in Table 1.

Table 1.
Descriptive statistics.
Nifty 50, MICEX, IBOVESPA, JSE, and SSE have a kurtosis score greater than three in all periods, indicating a leptokurtic distribution, which means that the series could have extremely high or extremely low returns (Yadav et al., 2023). The fact that all returns do not follow a normal distribution is supported by the Jarque–Bera test. Additionally, we verified the ARCH effect and discovered that all of them fit the DCC-GARCH estimation. The augmented Dickey–Fuller test, given by Dickey and Fuller (1979), confirms the stationarity of all return series.
The log returns of Nifty 50, IBOVESPA, SSE, MICEX, and JSE are presented in Figure 1 for the pre-COVID-19, COVID-19, and post-COVID-19 (Russia–Ukraine war) periods. All return series display clear volatility clustering, marked by alternating periods of high and low volatility, indicating the presence of conditional heteroskedasticity. The magnitude of volatility increases noticeably during crisis periods, reflecting the impacts of global health and geopolitical shocks on the financial markets. These characteristics justify the use of ARCH/GARCH-type models and provide strong motivation for the application of multivariate volatility and connectedness frameworks to analyze spillover dynamics across markets (S. Kumar et al., 2022).
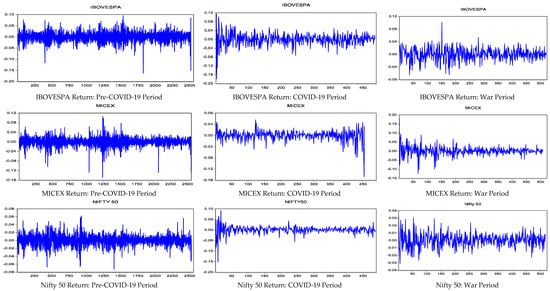
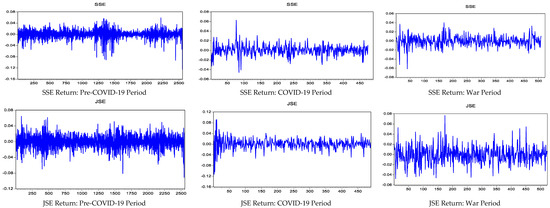
Figure 1.
Plots of IBOVESPA, MICEX, Nifty 50, JSE, and SSE return series in pre-COVID-19, COVID-19, and post-COVID-19 (war) periods. Source: Figure created by authors from compiled data using E-Views 9.5 software.
4.1. Unconditional Correlations
Table 2, Table 3 and Table 4 present the unconditional correlations among all possible sets of pairs, such as Nifty 50–IBOVESPA, Nifty 50–MICEX, Nifty 50–SSE, IBOVESPA–MICEX, IBOVESPA–SSE, IBOVESPA–JSE, MICEX–SSE, MICEX–JSE, and SSE–JSE, for all three periods. The unconditional correlation analysis reveals clear regime-dependent shifts in intermarket co-movement among the BRICS stock indices. During the pre-COVID-19 period, correlations across all market pairs were uniformly low, generally close to zero, indicating weak contemporaneous linkages and substantial diversification potential. Even India-related pairs (Nifty 50–IBOVESPA, Nifty 50–MICEX, and Nifty 50–SSE) exhibit minimal correlations, suggesting that market interactions were largely segmented under normal economic conditions. In contrast, the COVID-19 period is characterized by a pronounced surge in correlations across most pairs, reflecting heightened market synchronization and crisis-induced contagion. Notably, correlations involving Nifty 50 rise sharply with IBOVESPA (0.3075), SSE (0.0003), and especially JSE (0.4100), while strong co-movement is also observed between IBOVESPA and JSE (0.3832) and between SSE and JSE (0.2089). These elevated correlations underscore the erosion of diversification benefits during the pandemic, which is consistent with global risk aversion and synchronized sell-offs. During the war period, correlations declined markedly relative to COVID-19, but they remain higher than pre-COVID-19 levels for several pairs, particularly those involving Nifty 50 and JSE. However, correlations involving MICEX become negative with multiple markets, reflecting market segmentation, sanction effects, and structural disruptions in the Russian market.
Table 2.
Unconditional correlations among IBOVESPA, MICEX, Nifty 50, SSE, and JSE in pre-COVID-19 period.
Table 3.
Unconditional correlations among IBOVESPA, MICEX, Nifty 50, SSE, and JSE during COVID-19 period.
Table 4.
Unconditional correlations among IBOVESPA, MICEX, Nifty 50, SSE, and JSE in war period.
4.2. DCC-GARCH Model
This study employs a bivariate DCC-GARCH framework to examine the evolution of volatility spillovers and dynamic correlations among the founding BRICS stock markets across three distinct sub-periods: (i) pre-COVID-19, (ii) the COVID-19 crisis, and (iii) the Russia–Ukraine war and sanction period. The DCC-GARCH model is significant because it reveals volatility dynamics and time-varying correlations between two financial series. The α1, β1, α2, β2, values in Table 5, Table 6 and Table 7 show that the prior variance and previous residuals in the short run anticipate the current volatility. θ1 and θ2 are generally known as the DCC alpha and beta coefficients, respectively. θ1 and θ2 are used to verify whether volatility spillovers exist in the long run.
Table 5.
Bivariate DCC-GARCH estimates among Nifty 50, IBOVESPA, MICEX, SSE, and JSE in pre-COVID-19 period (2010–2019).
Table 6.
Bivariate DCC-GARCH estimates among Nifty 50, IBOVESPA, MICEX, SSE, and JSE during COVID-19 crisis (2020–2021).
Table 7.
Bivariate DCC-GARCH estimates among Nifty 50, IBOVESPA, MICEX, SSE, and JSE for Russia–Ukraine war and sanction period (2022–2025).
4.3. Volatility Spillovers (ARCH Effects: α1 and α2)
4.3.1. Pre-COVID-19 Period (1 January 2010 to 31 March 2020)
The estimated ARCH coefficients (α1 and α2) are predominantly positive and statistically significant across most BRICS market pairs, indicating the presence of short-run volatility spillovers under normal conditions. However, the magnitude of these coefficients remains relatively moderate (generally in the range of 0.06–0.09), suggesting that shocks were transmitted across markets in a controlled manner rather than through abrupt contagions. Some pairs (e.g., SSE–JSE) do not display any statistically significant ARCH effects, suggesting fewer immediate shock transmissions and, therefore, greater segmentation between China and South Africa during this time frame. Thus, this supports the notion that interdependence among the BRICS markets prior to COVID-19 was primarily due to gradual financial integration rather than spillover effects resulting from crises.
4.3.2. COVID-19 Crisis Period (11 March 2020 to 23 February 2022)
The ARCH coefficients increased significantly in both magnitude and statistical significance for multiple pairs of markets (e.g., Nifty 50–SSE, Nifty 50–JSE, and SSE–JSE) during the pandemic, suggesting an increase in sensitivity to new information and an increase in the rate at which shocks could be transmitted across markets globally, consistent with global financial contagion. The increase in the ARCH effect magnitudes reflects panic-driven volatility, liquidity stress, and synchronous market selling, experienced by all markets worldwide during COVID-19. These results are also supported by previous empirical research on how major global crises tend to increase cross-border volatility spillovers, specifically among emerging markets.
4.3.3. Post-COVID-19/Russia–Ukraine War Period (24 February 2022 to 31 March 2024)
For the post-pandemic time frame, the ARCH effects decreased for most of the India-based pairings (Nifty 50–IBOVESPA, Nifty 50–MICEX, Nifty 50–SSE), indicating that India has become significantly less susceptible to immediate shock transmission. However, the post-pandemic time frame continues to demonstrate significant shock spillovers for several pairings—IBOVESPA–MICEX, MICEX–JSE, and SSE–JSE—indicating that the primary driver of volatility transmission during this time frame was geopolitical, as opposed to being related to the pandemic. Therefore, the transition indicates that global uncertainty regarding war, sanctions, and energy markets has been the primary driver of volatility dynamics within BRICS.
4.3.4. Volatility Persistence (GARCH Effects: β1 and β2)
As expected, across all three time frames, the GARCH coefficients (β1 and β2) were very large, positive, and statistically significant, confirming the presence of volatility clustering among the BRICS stock markets. The difference in the evolution of the β values across time frames provides important structural insights. During the pre-pandemic time frame, the β values were generally very close to 0.90 (i.e., 0.86–0.93), which represents a persistent but relatively stable volatility level.
In the COVID-19 period, although volatility surged dramatically, persistence marginally declined for some pairs (e.g., Nifty 50–IBOVESPA), suggesting slightly faster mean reversion once the panic subsided.
In contrast, during the Russia–Ukraine war period, the β coefficients increased substantially for several pairs, especially Nifty 50–IBOVESPA, Nifty 50–MICEX, and IBOVESPA–MICEX, where the values exceeded 0.94. This suggests that post-pandemic volatility was not only high but also more prolonged, reflecting sustained geopolitical uncertainty, rather than short-lived crisis shocks. Overall, these results indicate that volatility in the BRICS markets became more persistent during the war than during COVID-19.
4.3.5. Dynamic Conditional Correlations (DCC α: θ1—Shock Effect)
In all periods, the DCC shock parameter (θ1) is mostly statistically insignificant across market pairs, implying that short-term shocks did not cause abrupt changes in correlations. This suggests that the BRICS markets were integrated but not contagion-prone under normal economic conditions.
4.3.6. Correlation Persistence (DCC β: θ2—Long-Run Co-Movement)
The DCC persistence parameter (θ2) is high and statistically significant across nearly all market pairs in the pre-COVID-19 period, mostly ranging between 0.81 and 0.99. This confirms strong long-run financial integration among the BRICS stock markets, limiting the diversification benefits in the long term.
During COVID-19, θ2 remained significant but slightly declined for some pairs, indicating more unstable correlations amid crisis conditions. This suggests that, while the markets remained interconnected, the strength of their co-movement fluctuated because of heightened uncertainty.
In the post-COVID-19 war period, θ2 increased again for most pairs, particularly Nifty 50–IBOVESPA (~0.97), Nifty–MICEX (~0.93), and MICEX–SSE (~0.93), indicating renewed structural interdependence driven by geopolitical risks rather than by pandemic risks. However, weaker persistence is observed for IBOVESPA–JSE and SSE–JSE, suggesting potential diversification opportunities within BRICS.
4.4. Network Connectedness
The Diebold and Yilmaz (2012) connectedness framework is utilized to identify the interconnectedness among IBOVESPA, MICEX, Nifty 50, SSE, and JSE. This is one of the most popular methods used to study connectedness (Sawarn & Dash, 2023; Gökgöz et al., 2026; Syed, 2025). Table 8, Table 9 and Table 10 exhibit the sources of shocks, i.e., where volatility begins, and the application of shocks indicates where volatility is transmitted. The size of each node indicates the relative importance of the given market as a receiver or transmitter of shocks in the network (refer to Figure 2). The yellow color indicates receivers of shocks and the blue color indicates transmitters of shocks.
Table 8.
Net receivers and transmitters, pre-COVID-19 period.
Table 9.
Net receivers and transmitters during COVID-19 period.
Table 10.
Net receivers and transmitters, post-COVID-19 period.
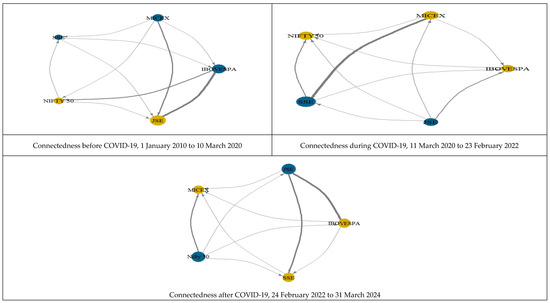
Figure 2.
Pairwise network connectedness among IBOVESPA, MICEX, Nifty 50, SSE, and JSE.
The Diebold–Yilmaz connectedness networks provide strong visual and quantitative confirmation of the regime-dependent volatility dynamics identified through the DCC-GARCH framework. In the pre-COVID-19 period, IBOVESPA, MICEX, and SSE emerge as net transmitters of volatility, as indicated by their blue coloration and relatively larger node sizes, while Nifty 50 and JSE act as net receivers. This structure is consistent with the DCC-GARCH results, showing moderate but statistically significant ARCH effects and high GARCH persistence, alongside largely insignificant DCC shock parameters. Together, these findings suggest that pre-pandemic spillovers were driven by gradual financial integration rather than abrupt contagion, allowing India and South Africa to retain their diversification benefits by absorbing, rather than exporting, volatility.
During the COVID-19 crisis, the connectedness structure shifts dramatically, reinforcing the crisis-driven patterns observed in the DCC-GARCH estimates. SSE and JSE become the dominant transmitters of shocks, reflected by their blue nodes and expanded sizes, while IBOVESPA, MICEX, and Nifty 50 turn into net receivers. This role reversal mirrors the DCC-GARCH evidence of heightened ARCH effects and statistically significant DCC shock parameters, indicating rapid correlation adjustments and systemic contagion. The thick directional links from SSE and JSE to other markets visually corroborate the collapse of diversification benefits implied by sharply rising dynamic correlations during the pandemic.
In the post-COVID-19 Russia–Ukraine war period, the network becomes more asymmetric and selective. JSE and Nifty 50 reappear as net transmitters, while MICEX and SSE are primarily receivers. This configuration aligns closely with the DCC-GARCH results, showing declining short-run shock transmission for India-related pairs but exceptionally high GARCH persistence, indicating prolonged volatility driven by geopolitical uncertainty rather than panic. Sanctions, capital controls, and reduced market integration plausibly explain Russia’s diminished outward spillovers, while South Africa’s commodity exposure elevates its systemic role.
Overall, the connectedness analysis complements the DCC-GARCH findings by revealing not only the magnitude and persistence of spillovers but also their direction and transmission channels, underscoring that BRICS market interdependence evolves sharply across crisis regimes.
5. Conclusions
This study investigates the volatility spillovers and dynamic connectedness among the founding BRICS stock markets, IBOVESPA, MICEX, Nifty 50, SSE, and JSE, using a bivariate DCC-GARCH framework across three distinct regimes: pre-COVID-19 (1 January 2010 to 10 March 2020), the COVID-19 crisis (11 March 2020 to 23 February 2022), and the Russia–Ukraine war or post-COVID-19 period (24 February 2022 to 31 March 2024). The empirical results reveal that the nature, intensity, and channels of interdependence among the BRICS markets are highly regime-dependent and shaped by the prevailing global risk environment.
During the pre-COVID-19 period, volatility spillovers were present but moderate, as reflected in the statistically significant yet relatively small ARCH coefficients.
The results also suggest that, instead of being shocked suddenly as part of an event-related contagion (such as in a crisis), the shocks were transferred over time; therefore, the results are indicative of gradual structural financial integration, as opposed to crisis-induced interdependence. All GARCH coefficient estimates are significantly positive and at a high level, supporting the view that volatility in the BRICS markets is persistent. Furthermore, the DCC shock parameter (Theta 1) is largely insignificant for all pairs examined, while the persistence parameter (Theta 2), which captures how much volatility will continue to be transmitted from one period to another, is highly significant for all pairs, further supporting the notion that, prior to COVID-19, the co-movement among BRICS equity returns was due to long-term integration as opposed to short-term contagion.
In stark contrast, the COVID-19 crisis represented a clear structural shift. In this regard, the ARCH terms increased significantly for many of the market pairs, including Nifty 50–SSE, Nifty 50–JSE, and SSE–JSE, representing greater sensitivity to new information and quicker cross-border transmission of shocks. Furthermore, the DCC shock parameter (Theta 1) is significantly different from zero for several pairs, providing very strong evidence of crisis-induced contagion, which is consistent with the widespread panic, liquidity shortages, and concurrent market declines experienced globally during the pandemic. While volatility persistence continued to be high, it decreased for some pairs, suggesting a faster return to the mean after extreme levels of market stress were dissipated.
In the post-COVID-19 Russia–Ukraine war environment, the volatility dynamics were once again altered. For most India-related pairs, the ARCH effects decreased, indicating that India had become less sensitive to immediate shock transmission. However, significant spillovers continued to occur among IBOVESPA–MICEX, MICEX–JSE, and SSE–JSE, indicating that volatility transmission was driven primarily by geopolitical risks, sanctions, and energy market uncertainty and not by the panic associated with the pandemic. The GARCH coefficients increased again, often above 0.97 for key pairs, indicating greater volatility persistence than observed during the COVID-19 period. Additionally, the DCC shock parameter continued to be significant only for the IBOVESPA–MICEX and IBOVESPA–JSE pairs, indicating stronger bilateral relationships between Brazil and Russia.
Overall, correlation persistence (Theta 2) remained high for most pairs, confirming sustained long-run interdependence among the BRICS markets, albeit with selective diversification potential in certain pairings, such as IBOVESPA–JSE and SSE–JSE.
Taken together, these findings demonstrate that BRICS’ financial integration is not static but evolves during global crises. While pre-COVID-19 linkages were characterized by stable integration, COVID-19 amplified contagion, and the post-pandemic war period introduced geopolitically driven spillovers with prolonged volatility. These results underscore the necessity of dynamic modeling approaches, such as DCC-GARCH, to understand evolving market interdependence in an increasingly uncertain global environment.
Across the three sub-periods, the volatility spillover network exhibits clear structural shifts. In the pre-COVID-19 period, IBOVESPA, MICEX, and SSE emerge as net transmitters of volatility, whereas Nifty 50 and JSE function primarily as net receivers. During the COVID-19 crisis period, the pattern changes markedly, with SSE and JSE becoming the dominant transmitters of shocks, while IBOVESPA, MICEX, and Nifty 50 turn into net receivers. In the post-COVID-19 Russia–Ukraine war period, the network becomes more asymmetric and selective, with JSE and Nifty 50 reappearing as net transmitters of volatility, whereas MICEX and SSE are predominantly positioned as net receivers.
From an investment perspective, this study provides critical information to those who invest in emerging market indices, including portfolio managers, institutional investors, multinationals, and financial regulators working within or outside the BRICS countries.
However, the study focuses exclusively on equity market indices and does not incorporate other channels of transmission, such as exchange rates, commodity prices, interest rates, or cross-border capital flows, which may jointly influence volatility dynamics in BRICS economies. Including these variables could provide a more comprehensive view of the underlying economic mechanisms driving spillovers.
6. Managerial Implications
From a diversification perspective, the high and persistent dynamic correlations identified in the study across most BRICS pairs (especially in both the pre-COVID-19 and COVID-19 periods) suggest that diversified portfolios will likely be limited to those exposures based solely within BRICS. Therefore, investors looking for risk reductions would do well to add diversified exposures to their portfolios, either by including developed market securities or by incorporating alternative investment vehicles such as commodities, gold, or digital assets. However, even under normal circumstances, investors can selectively diversify their portfolios, especially between China and South Africa, which have demonstrated less correlated movements than all other BRICS pairs.
The extreme contagion effects identified in this study as a result of the COVID-19 crisis demonstrate the importance of developing crisis-sensitive risk management techniques.
Finally, from a policy and regulatory standpoint, this study emphasizes the necessity of BRICS countries to developing enhanced cross-border financial regulatory frameworks.
Therefore, investors and policymakers must utilize dynamic and forward-thinking approaches rather than relying on historical correlation data, as market interdependencies evolve in response to changing global economic and geopolitical factors.
Author Contributions
Conceptualization, P.K.A. and M.K.; methodology, A.A.S., A.S. and P.K.A.; software, M.K.; validation, A.A.S.; formal analysis, P.K.A.; investigation, M.K.; resources, A.S.; data curation, P.K.A.; writing—original draft preparation, P.K.A., A.A.S., A.S. and M.K.; writing—review and editing, A.A.S.; visualization, A.S.; supervision, P.K.A. All authors have read and agreed to the published version of the manuscript.
Funding
This research received no external funding.
Institutional Review Board Statement
Not applicable.
Informed Consent Statement
Not applicable.
Data Availability Statement
The raw data supporting the conclusions of this article will be made available by the authors on request.
Conflicts of Interest
The authors declare no conflicts of interest.
References
- Alshenawy, F. Y., & Abdo, D. A. (2023). Using multivariate dynamic conditional correlation GARCH model to analyze financial market data. Journal of Business Research, 45(4), 34–64. [Google Scholar] [CrossRef]
- Balci, N. (2024). Volatility spillover effects between stock markets during the crisis periods: Diagonal BEKK approach. Pamukkale University Journal of Social Sciences Institute, (65), 229–246. [Google Scholar] [CrossRef]
- Bollerslev, T. (1986). Generalized autoregressive conditional heteroskedasticity. Journal of Econometrics, 31(3), 307–327. [Google Scholar] [CrossRef]
- Bouzguenda, M., & Jarboui, A. (2025). Understanding crisis spillovers: US-BRICS market interdependence in times of turmoil. Modern Finance, 3(4), 46–65. [Google Scholar] [CrossRef]
- Brooks, C. (2008). Introductory econometrics for finance. Cambridge University Press. [Google Scholar]
- Das, N. M., Rout, B. S., & Bal, G. R. (2025). Stock market integration, risk and spillovers across BRICS nations: An assessment during COVID-19. Management and Labour Studies, 50(3), 337–356. [Google Scholar] [CrossRef]
- Dickey, D. A., & Fuller, W. A. (1979). Distribution of the estimators for autoregressive time series with a unit root. Journal of the American Statistical Association, 74(366a), 427–431. [Google Scholar] [PubMed]
- Diebold, F. X., & Yilmaz, K. (2009). Measuring financial asset return and volatility spillovers, with application to global equity markets. The Economic Journal, 119(534), 158–171. [Google Scholar]
- Diebold, F. X., & Yilmaz, K. (2012). Better to give than to receive: Predictive directional measurement of volatility spillovers. International Journal of Forecasting, 28(1), 57–66. [Google Scholar] [CrossRef]
- Engle, R. F. (1982). Autoregressive conditional heteroscedasticity with estimates of the variance of United Kingdom inflation. Econometrica, 50(4), 987–1007. [Google Scholar] [CrossRef]
- Engle, R. F., & Sheppard, K. (2001). Theoretical and empirical properties of dynamic conditional correlation multivariate GARCH. National Bureau of Economic Research. Available online: https://www.nber.org/system/files/working_papers/w8554/w8554.pdf (accessed on 25 September 2025).
- Gökgöz, H., Syed, A. A., Gheorghe, C., & Jeribi, A. (2026). Quantile-frequency dependence between US sector stock indices and macro-financial indicators: A quantile coherence approach. The North American Journal of Economics and Finance, 81, 102552. [Google Scholar]
- Joo, B. A., Ghulam, Y. A., & Mir, S. I. (2023). Symmetric and asymmetric volatility spillover among BRICS countries’ stock markets. Decision, 50(4), 473–488. [Google Scholar] [CrossRef]
- Jütten, M., & Falkenberg, D. (2024). Briefing (PE 760.368). European Parliamentary Research Service. Available online: https://www.europarl.europa.eu/RegData/etudes/BRIE/2024/760368/EPRS_BRI(2024)760368_EN.pdf (accessed on 19 January 2026).
- Kumar, M. (2024). From pandemic to war: Dynamics of volatility spillover between BRICS exchange and stock markets. Journal of Economic Studies, 51(3), 528–545. [Google Scholar] [CrossRef]
- Kumar, S., Singh, G., & Kumar, A. (2022). Volatility spillover among prices of crude oil, natural gas, exchange rate, gold, and stock market: Fresh evidence from exponential generalized autoregressive conditional heteroscedastic model analysis. Journal of Public Affairs, 22(4), e2594. [Google Scholar] [CrossRef]
- Lin, F., Li, X., Jia, N., Feng, F., Huang, H., Huang, J., Fan, S., Ciais, P., & Song, X. P. (2023). The impact of Russia-Ukraine conflict on global food security. Global Food Security, 36, 100661. [Google Scholar] [CrossRef]
- Petropoulou, K., Angelaki, E., Rompogiannakis, I., Passas, I., & Garefalakis, A. (2024). Digital transformation in SMEs: Pre and post-COVID-19 era: A comparative bibliometric analysis. Sustainability, 16(23), 10536. [Google Scholar] [CrossRef]
- Putin, V. (2024, December 18). BRICS countries drive global economic growth, exceed GDP of G7 nations: Putin. DD News. Available online: https://ddnews.gov.in/en/brics-countries-drive-global-economic-growth-exceed-gdp-of-g7-nations-putin (accessed on 25 September 2025).
- Sainath, A. R., Gnanendra, M., Mohanasundaram, T., James, L., & Misra, S. (2023). Dynamic connectedness and volatility spillover effects of Indian stock market with international stock markets: An empirical investigation using DCC GARCH. Scientific Papers of the University of Pardubice. Series D, Faculty of Economics and Administration, 31(1), 1691. [Google Scholar]
- Sawarn, U., & Dash, P. (2023). Time and frequency uncertainty spillover among macro uncertainty, financial stress and asset markets. Studies in Economics and Finance, 40(3), 500–526. [Google Scholar] [CrossRef]
- Singh, D., Theivanayaki, M., & Ganeshwari, M. (2024). Examining volatility spillover between foreign exchange markets and stock markets of countries such as BRICS countries. Global Business Review, 25(5), 1269–1289. [Google Scholar] [CrossRef]
- Singh, R. K., Singh, Y., Kumar, S., Kumar, A., & Alruwaili, W. S. (2024). Mapping risk–return linkages and volatility spillover in BRICS stock markets through the lens of linear and non-linear GARCH models. Journal of Risk and Financial Management, 17(10), 437. [Google Scholar] [CrossRef]
- Soni, R. K., Nandan, T., & Chatnani, N. N. (2023). Dynamic association of economic policy uncertainty with oil, stock, and gold: A wavelet-based approach. Journal of Economic Studies, 50(7), 1501–1525. [Google Scholar] [CrossRef]
- Syed, A. A. (2025). Resilience of artificial intelligence index against conventional financial market shocks: Evidence from NARDL. Journal of Economic and Administrative Sciences, 1–22. [Google Scholar] [CrossRef]
- Yadav, M. P., Sharma, S., & Bhardwaj, I. (2023). Volatility spillover between Chinese stock market and selected emerging economies: A dynamic conditional correlation and portfolio optimization perspective. Asia-Pacific Financial Markets, 30(2), 427–444. [Google Scholar] [CrossRef]
- Zhang, P., Sha, Y., & Xu, Y. (2021). Stock market volatility spillovers in G7 and BRIC. Emerging Markets Finance and Trade, 57(7), 2107–2119. [Google Scholar] [CrossRef]
- Zhang, Y., Zhou, L., Liu, Z., & Wu, B. (2025). Spillover of fear among the US and BRICS equity markets during the COVID-19 crisis and the Russo–Ukrainian conflict. North American Journal of Economics and Finance, 75, 102308. [Google Scholar] [CrossRef]


Disclaimer/Publisher’s Note: The statements, opinions and data contained in all publications are solely those of the individual author(s) and contributor(s) and not of MDPI and/or the editor(s). MDPI and/or the editor(s) disclaim responsibility for any injury to people or property resulting from any ideas, methods, instructions or products referred to in the content. |
© 2026 by the authors. Licensee MDPI, Basel, Switzerland. This article is an open access article distributed under the terms and conditions of the Creative Commons Attribution (CC BY) license.