Article

Digital Infrastructure, SME E-Commerce, and Economic Growth: Evidence from China’s Platform Economy


1
Asia-Europe Institute, University of Malaya, Kuala Lumpur 50603, Malaysia
2
College of Economics and Management, Beijing University of Technology, Beijing 100124, China
*
Author to whom correspondence should be addressed.
Economies 2026, 14(2), 40; https://doi.org/10.3390/economies14020040
Submission received: 6 December 2025 / Revised: 14 January 2026 / Accepted: 19 January 2026 / Published: 28 January 2026
(This article belongs to the Section Economic Development)

Abstract

Digitalization is increasingly central to economic growth strategies, yet robust macro-level evidence on the role of SME-led e-commerce remains limited. Drawing on the Resource-Based View, this study examines how SME digitalization, internet finance, and platform-based activities influence regional economic growth in China, and how these effects depend on digital infrastructure readiness (DIR). We construct an annual panel of 30 provincial-level regions in China over 2015–2024 and estimate dynamic relationships using two-step system GMM to address endogeneity and growth persistence. The results show that SME digitalization, supply-chain efficiency, mobile payment penetration, tech-driven employment growth, platform-economy contribution, and DIR all exert statistically significant positive effects on GDP growth. Quantitatively, a 10-percentage-point increase in SME digitalization is associated with approximately 0.3-percentage-point higher regional GDP growth, while a 10-point increase in DIR corresponds to about 0.4-percentage-point higher growth. Moderation analyses reveal that DIR significantly amplifies the growth effects of e-commerce expansion, mobile payments, and digital marketing, whereas its moderating role is weaker or insignificant for cross-border payments and supply-chain efficiency. These findings reconceptualize digitalization as a coordinated bundle of complementary resources and position DIR as a critical enabling capability for translating SME digital transformation into macroeconomic growth. The study offers policy-relevant evidence for targeting infrastructure investment and digital-economy strategies in emerging platform economies.

1. Introduction

The digital transformation of economies, driven by the exponential growth of e-commerce, mobile payments, and digital platforms, has reshaped the structure of value creation and economic participation globally. In China, this transformation is particularly profound, with digital technologies becoming central to how businesses operate, markets function, and consumers engage. Yet, despite a growing body of scholarship on digitalization and firm performance, the literature remains fragmented and insufficiently empirical when it comes to explaining how these digital forces translate into national-level economic outcomes such as GDP growth.
This question has become particularly urgent in the context of China’s post-COVID economic recovery and its national digital development agenda. Following the pandemic-induced slowdown, Chinese policymakers have explicitly positioned digitalization, especially SME digital transformation, as a central engine of resilient growth, employment stabilization, and productivity upgrading. Flagship initiatives such as the “Digital China” strategy and successive Five-Year Plans emphasize platform economies, digital finance, and infrastructure investment as mechanisms to revitalize regional economies and narrow development gaps. Yet, despite this strong policy emphasis, systematic macro-level evidence on whether and how SME-led digitalization translates into sustained GDP growth across regions remains surprisingly limited.
Firstly, while prior studies have explored the strategic and innovation dimensions of digital transformation (Ali et al., 2018; Pérez et al., 2021), few have provided rigorous, data-driven assessments of how e-commerce growth contributes to measurable economic metrics at the macro level. The link between the digital scaling of commerce and outcomes like GDP, productivity, or employment remains under-theorized and empirically underdeveloped. This gap is especially critical in the case of China, a nation that has not only embraced e-commerce at scale but also embedded it within its national development strategy.
Secondly, there is a notable blind spot in the literature regarding the role of small- and medium-sized enterprises (SMEs) in the digital economy. Although SMEs constitute the backbone of China’s employment and innovation ecosystem, their digitalization trajectory, particularly through e-commerce, has not been thoroughly examined in terms of its broader economic spillovers. Studies such as Angeles (2022) and Amouei et al. (2023) highlight the performance benefits of digital tools at the firm level, yet fail to address the systemic implications of SME digitalization for national growth outcomes.
This gap is not only evident in emerging economies but also contrasts sharply with the experience of developed economies, where digitalization is often assumed, rather than empirically demonstrated, to support macroeconomic growth. While studies in advanced economies largely focus on firm-level productivity, innovation, or consumer adoption, they rarely examine how SME digitalization aggregates into regional or national growth outcomes using dynamic macro-level data. As a result, cross-country insights remain fragmented, and policymakers lack comparative evidence on whether SME digital transformation delivers similar growth dividends outside highly digitalized contexts. By focusing on China’s diverse provincial landscape, this study provides a rare large-scale test of these mechanisms in an economy where digital platforms, SMEs, and state-led infrastructure investment interact at scale.
Thirdly, the influence of digital financial services, especially mobile payments and cross-border digital transactions, has been well-documented from a user-behavioral perspective (Singh et al., 2020; Dissanayake et al., 2022). However, there is limited understanding of how these services intersect with SME-led e-commerce to drive macroeconomic performance. Given the financial inclusion and liquidity benefits associated with mobile payment systems, this represents a critical gap in the existing discourse.
In parallel, the policy and regulatory landscape shaping digital transformation remains undertheorized in empirical macroeconomic research. While organizational perspectives have acknowledged the enabling role of institutional frameworks (Hentzen et al., 2021; D’Angelo, 2024), there is scant analysis of how policy levers, such as investments in digital infrastructure, moderate the relationship between e-commerce and economic growth. Considering China’s unique top-down model of digital development, incorporating the state’s role is essential to capturing the full causal chain.
Moreover, consumer behavior in digital environments is often viewed through the lens of marketing or platform engagement, with insufficient attention paid to how digital consumerism, via e-commerce, translates into broader economic dynamism. Although Y. Li and Wang (2021) and Angeles (2022) emphasize consumer readiness and preferences, empirical studies linking digital consumption patterns to GDP-level trends are sparse.
Collectively, these gaps point to a clear and unresolved research problem: despite strong policy momentum and rapid digital expansion, we still lack causal, macro-level evidence on whether SME-led digitalization meaningfully drives economic growth, under what infrastructural conditions it does so, and which digital channels matter most. Existing studies are typically constrained by firm-level data, static models, or single-dimension measures of digitalization, leaving open questions about aggregation effects, endogeneity, and regional heterogeneity. This study addresses these limitations by integrating multiple dimensions of SME digital transformation, internet finance, and platform activity within a dynamic provincial panel framework. By explicitly modeling digital infrastructure readiness as a moderating capability, the analysis clarifies when and where SME digitalization translates into GDP growth, thereby filling a critical gap at the intersection of digital economy research, regional development, and policy evaluation.
While the Resource-Based View is traditionally applied at the firm level, its extension to regional and macroeconomic outcomes rests on identifiable aggregation mechanisms. Firm-level digital resources and capabilities, such as SME e-commerce adoption, platform participation, and digital process integration, can scale into regional economic growth through spillovers and network effects, including shared digital infrastructure, knowledge diffusion, supply-chain integration, and labor mobility. At the regional level, these processes generate externalities that enhance productivity, reduce transaction costs, and deepen market connectivity, thereby translating micro-level digital capabilities into aggregate GDP growth. This study builds on this extended RBV logic by empirically examining how these aggregation effects operate across provinces under different levels of digital infrastructure readiness. Accordingly, we pose the following research questions: RQ1a: How does the digital transformation of small- and medium-sized enterprises (SMEs) through e-commerce influence GDP growth in China?
RQ1b: In what ways does digital infrastructure readiness strengthen or moderate the economic impact of SME digital transformation through e-commerce on GDP growth in China?
Theoretically underpinned by Resource-Based View theory, this study bridges firm-level digital initiatives with national development outcomes. This study offers novel insights into the structural role of e-commerce in China’s economic engine, providing both a theoretical contribution and policy relevance in the era of digital capitalism.

2. Theoretical Underpinning

The Resource-Based View (RBV) of the firm (Barney, 1991) offers a powerful theoretical lens for understanding how firms leverage internal resources to achieve sustained competitive advantage. According to RBV, resources that are valuable, rare, inimitable, and non-substitutable (VRIN) enable firms to build capabilities that not only differentiate them from competitors but also drive long-term performance. In the context of this study, which investigates how digital transformation through e-commerce contributes to GDP growth in China, the RBV provides a robust explanatory foundation for analyzing how firms, and by extension, economies, capitalize on digital resources to unlock economic value.

2.1. Digital Transformation as a Strategic Resource

Digital transformation, particularly through e-commerce adoption, constitutes a constellation of intangible yet strategically critical resources. These include technology infrastructure (e.g., platforms, cloud services), digital payment systems, data analytics, and organizational capabilities for digital integration. From an RBV perspective, such resources, when effectively orchestrated, become sources of firm-level advantages that aggregate to macroeconomic outcomes. In the Chinese context, e-commerce platforms like Alibaba and JD.com have institutionalized these digital resources to scale operations, penetrate markets, and reshape consumer behaviors. These firm-level transformations, when diffused across industries, yield cumulative effects on national productivity, innovation, and ultimately GDP growth.

2.2. E-Commerce as a Value-Generating Capability

E-commerce is not merely a distribution channel; under the RBV framework, it is a dynamic capability, an embedded organizational competence that integrates digital technologies with market responsiveness. Firms that strategically adopt e-commerce platforms acquire market reach, data-driven intelligence, and cost efficiencies that are hard to replicate by traditional players. These capabilities manifest in expanded trade volumes, faster supply chains, and adaptive consumer engagement, which together stimulate domestic demand and industrial output. Thus, e-commerce becomes a driver not only of firm performance but also of structural economic transformation.

2.3. Internet Finance and Payment Systems as Enabling Resources

A distinguishing contribution of this study lies in unpacking the role of internet finance—including mobile payment platforms, online credit access, and digital banking tools—as enabling resources that amplify the economic impact of e-commerce. From the RBV standpoint, these financial technologies reduce frictions in transactions, increase the velocity of capital, and democratize access to digital markets, particularly for SMEs. Mobile payment systems like Alipay and WeChat Pay have become indispensable VRIN resources for Chinese firms, facilitating both B2C and B2B interactions at scale. Firms that embed such payment infrastructure within their business models enjoy first-mover advantages and reduced financial bottlenecks, resulting in measurable GDP-level effects.

2.4. Digital Infrastructure Readiness as a Moderating Capability

While digital resources at the firm level are critical, their impact is conditional on the readiness of national digital infrastructure, a composite resource that reflects internet penetration, broadband availability, mobile coverage, and network reliability. In the RBV framework, this infrastructure operates as a moderating capability: it determines the extent to which firms can exploit digital resources for competitive gain. High infrastructure readiness enhances the efficiency of digital resource utilization, amplifying the economic returns on digital investments. This study incorporates this moderating dynamic by investigating how regional disparities in infrastructure readiness influence the relationship between e-commerce activity and GDP growth.
Conceptually, treating digital infrastructure readiness as a moderating capability also aligns the RBV framework with complementary macro-level perspectives. From an endogenous growth perspective, infrastructure enhances the productivity of private digital investment and innovation; under infrastructure-led development theory, it lowers transaction costs and expands market access; and under institutional economics, it reflects the role of the state in shaping the conditions under which firm-level capabilities generate economic returns. By embedding digital infrastructure readiness within the RBV framework, this study bridges firm-level capability theory with macro-level growth mechanisms.

2.5. SMEs and Resource Mobilization in the Digital Economy

SMEs, though often resource-constrained, are central to China’s digital transformation. The RBV theory is especially relevant here, as it underscores that it is not the quantity of resources but their strategic deployment that matters. Internet finance enables SMEs to overcome traditional financing barriers, while digital tools help them compete beyond their scale. Firms that can mobilize digital resources effectively gain temporary monopolies of capability, allowing them to grow faster, hire more, and contribute more substantially to GDP. Hence, the diffusion of resource-based capabilities among SMEs becomes a pathway to inclusive and broad-based economic development.

2.6. Innovation, Resource Renewal, and Sustained Growth

Finally, RBV asserts that sustained competitive advantage arises not from static resource possession but from continuous resource renewal. In the digital economy, this means adopting emerging technologies, AI, big data, and automation as iterative upgrades to existing capabilities. Chinese firms that continuously evolve their digital assets maintain growth momentum, reinforcing a virtuous cycle of innovation and economic expansion. This dynamic is central to understanding how digital transformation feeds into sustained GDP growth, rather than one-off economic boosts.
To maintain analytical focus, the RBV concepts discussed above are not treated as abstract normative ideals but as foundations for empirically testable relationships. In this study, SME e-commerce adoption, platform participation, and digital process integration are conceptualized as firm-level digital resources and capabilities whose economic value depends on their scalability and complementarity. These mechanisms directly inform the hypotheses developed in the subsequent section, where SME digital transformation is expected to influence GDP growth both directly and indirectly, and where digital infrastructure readiness conditions the extent to which these firm-level capabilities can be converted into aggregate economic outcomes.
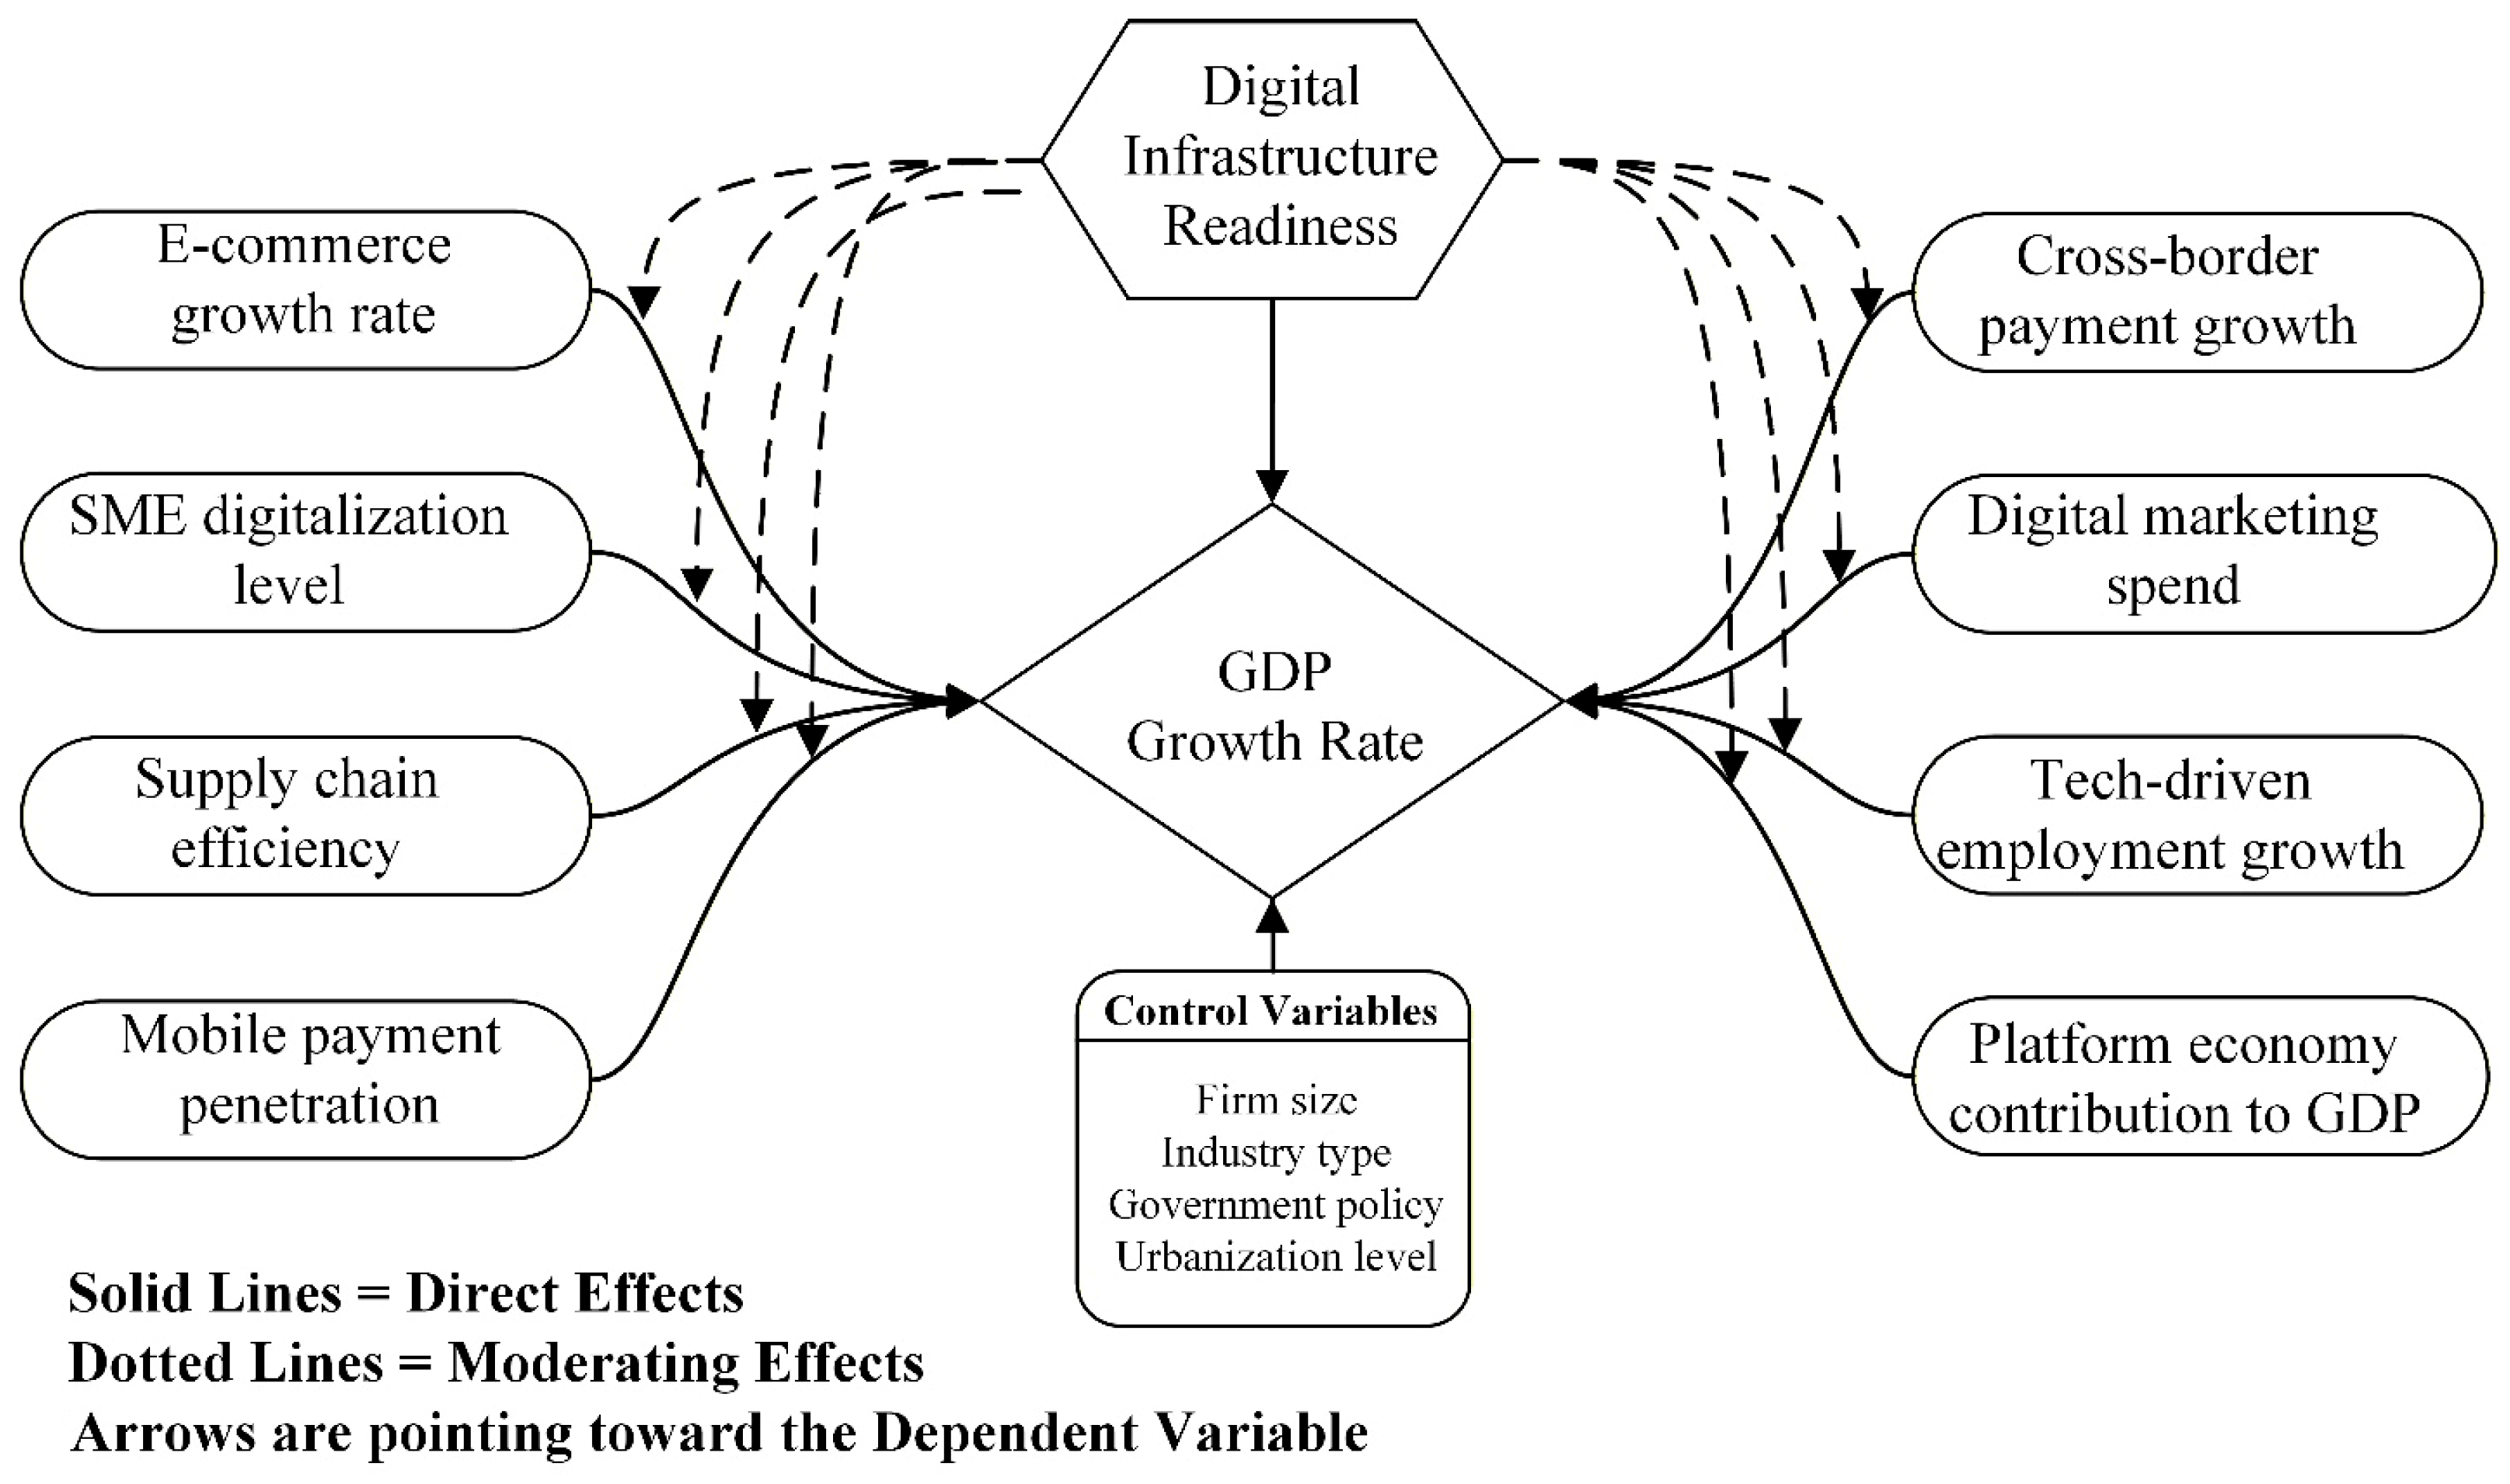
Hence, the RBV provides the theoretical scaffolding to explain the relationships explored in this study. It conceptualizes e-commerce platforms, internet finance systems, and digital infrastructure as strategic resources that, when aligned with firm capabilities, drive competitive advantage and aggregate economic gains. The study extends RBV’s firm-centric lens to the macroeconomic level by demonstrating how digital resource mobilization across SMEs contributes to China’s GDP growth. It also integrates RBV’s emphasis on context by examining the moderating role of digital infrastructure readiness. Figure 1 depicts the conceptual framework of this study.

2.7. Conceptual Definitions and Terminology

For clarity and consistency, this study employs a standardized set of related but distinct concepts. The digital economy is used as an umbrella term referring to economic activities enabled by digital technologies, data, and networked information systems. Within this broader domain, SME e-commerce refers specifically to the adoption and use of online platforms and digital tools by small and medium-sized enterprises for sales, procurement, payments, and supply-chain coordination.
The platform economy denotes economic activity organized around digital platforms that facilitate interactions between firms, consumers, and service providers; when described as an emerging platform economy, the term emphasizes contexts—such as China—where platform-based business models are rapidly expanding and reshaping production, distribution, and employment.
Digital infrastructure readiness (DIR) refers to the availability and quality of foundational digital infrastructure, including broadband connectivity, mobile networks, data capacity, and related enabling systems, which condition the extent to which digital economic activities can translate into growth. Throughout the manuscript, these terms are used consistently, with SME e-commerce and platform activity treated as core components of the digital economy, and DIR conceptualized as a contextual enabling capability.

3. Literature Review and Hypothesis Development

To align the hypotheses more closely with the study’s core focus, we distinguish between primary hypotheses, which capture the central relationship between SME e-commerce, digital infrastructure, and economic growth, and supporting hypotheses, which reflect complementary digital channels through which SME digital transformation operates. This structure ensures conceptual parsimony while retaining the multidimensional nature of the digital economy examined in the empirical analysis.
While several of the digital constructs examined in this study are conceptually related, they capture distinct mechanisms through which SME digital transformation influences economic growth. SME e-commerce growth reflects market expansion, SME digitalization level captures internal process integration, digital marketing expenditure represents demand-side engagement, and platform economy contribution reflects ecosystem participation. Examining these dimensions jointly allows the analysis to disentangle their relative importance, identify complementarities, and assess heterogeneous and contingent effects. In particular, by modeling digital infrastructure readiness as a moderating capability, the study moves beyond purely additive relationships and explicitly tests whether and when specific digital channels translate into GDP growth.

3.1. SME E-Commerce Growth Rate (EGR) and GDP Growth

The positive relationship stems from SMEs being crucial participants in economic activity, contributing to GDP growth through increased revenues generated via e-commerce platforms (Githui & Njuru, 2024; Stockdale & Standing, 2006). This trend is especially notable in developing countries, where a surge in e-commerce adoption by SMEs fosters broader market access and operational efficiencies, ultimately resulting in economic expansion (Binh et al., 2022; Ansu-Mensah et al., 2021).
Further, higher levels of economic prosperity often correlate with improved infrastructure and human capital development, which are critical for sustaining e-commerce growth (Cohen, 2021; Bińczak et al., 2018). Countries experiencing significant GDP growth tend to witness a simultaneous escalation in e-commerce activities among SMEs, resulting in increased employment and productivity within these sectors (Sertić et al., 2017).
Thus, the evidence collectively underscores a robust connection between SME e-commerce expansion and GDP growth, supporting strategic initiatives aimed at enhancing digital capabilities to drive economic progress (Heliyani et al., 2023; Tulong et al., 2024). So, we propose the following:
H1: 
EGR is positively associated with GDP growth.

3.2. SME Digitalization Level (SDL) and GDP Growth

Digitalization enhances operational efficiency, market reach, and adaptability among SMEs, thereby fostering economic growth (Prayitno et al., 2024; Negrish & Almomani, 2024). In a post-COVID context, digitally transformed SMEs have been pivotal in stabilizing local economies and sustaining employment, which contributes to national GDP recovery and growth (Prayitno et al., 2024; Mushtaq et al., 2024). Research demonstrates that SMEs that effectively adopt digital tools witness improved business performance, enabling them to contribute more robustly to GDP (Mushtaq et al., 2024; Philbin et al., 2022).
Furthermore, digitalization fosters innovation and competitiveness, essential traits for SMEs in rapidly evolving markets (Ahmad et al., 2023; Philbin et al., 2022). This innovation can lead to increased revenues and job creation, both crucial drivers of economic growth (Budiarto et al., 2022; Susanto et al., 2021). Studies have highlighted that the strategic implementation of digital technologies supports the internal processes of SMEs and enhances their contribution to GDP by expanding market access and improving customer engagement (Awonuga et al., 2024; Ng et al., 2019). Thus, as SMEs continue to integrate digital practices, they are likely to enhance their economic footprint, validating the positive association between SDL and GDP growth. Hence, we propose the following:
H2: 
SDL is positively associated with GDP growth.
Together, H1 and H2 capture the study’s primary theoretical claim that SME e-commerce expansion and digitalization constitute the core micro-foundations linking the digital economy to macroeconomic growth.
The following hypotheses (H3–H8) are treated as supporting mechanisms that capture how SME e-commerce and digitalization translate into economic growth through operational efficiency, digital finance, labor markets, and platform ecosystems.

3.3. Supply Chain Efficiency (SCE) and GDP Growth

Efficient supply chains enhance productivity by optimizing resource allocation, reducing operational costs, and improving service delivery, which contribute to GDP growth (Alshurideh et al., 2022; Zhi et al., 2024). Research indicates that improved logistics and supply chain performance are directly correlated with economic expansion, as efficient supply chains facilitate smoother transactions and better integration into global markets (Alshurideh et al., 2022; Sinha, 2020).
Furthermore, evidence shows that technological innovations in supply chain management significantly enhance operational efficiency. This transformation allows businesses to respond more effectively to market demands, leading to increased sales and ultimately higher contributions to GDP (Zhi et al., 2024; Eyieyien et al., 2024). Additionally, sectors such as maritime logistics demonstrate that efficient supply chain practices can trigger broader economic impacts by creating jobs and enhancing trade connectivity, emphasizing the intrinsic link between logistics efficiencies and national economic performance (Alshurideh et al., 2022; Mishrif et al., 2024).
In a nutshell, the literature consistently supports the viewpoint that supply chain efficiency is a vital factor driving GDP growth, making a strong case for investments and improvements in supply chain management practices (Alshurideh et al., 2022; Zhi et al., 2024; Mishra et al., 2024). Hence, we propose the following:
H3: 
SCE is positively associated with GDP growth.

3.4. Mobile Payment Penetration (MPP) and GDP Growth

Mobile payments enhance financial accessibility and stimulate consumer spending, which are essential components of economic expansion. Research indicates that higher levels of mobile payment adoption lead to increased transaction volumes, fostering an environment conducive to economic growth (Kahveci & Gurgur, 2025; Okore et al., 2023). Specifically, mobile payment systems enhance financial inclusion, allowing previously unbanked populations to participate in the economy, thus broadening the consumer base and driving up GDP (Ebong & George, 2021; Talom & Tengeh, 2019).
Furthermore, the flexibility and convenience of mobile payments can lead to increased consumption, as studies have shown that consumers are more likely to spend using mobile payment platforms (Raj, 2025). This heightened spending translates into robust economic activity, ultimately contributing to GDP growth (Kahveci & Gurgur, 2025; Okore et al., 2023; Heliyani et al., 2023). Additionally, the adoption of mobile payment systems has been linked to improved efficiency in transaction processing, reducing the costs associated with cash handling and traditional banking operations, which in turn supports and incentivizes business growth (Forgor & Julie, 2020).
In light of this evidence, it is evident that mobile payment penetration serves as a vital mechanism for enhancing economic performance by facilitating financial transactions and promoting consumer activity; hence, the following has been proposed:
H4: 
MPP is positively associated with GDP growth.

3.5. Cross-Border Payment Growth (CBG) and GDP Growth

Increased efficiency and accessibility in cross-border payments significantly stimulate international trade, which is a vital driver of economic growth. For instance, studies indicate that the development of digital payment systems has led to enhanced trade efficiency and volume, thereby positively impacting GDP (Risky et al., 2025). The correlation between higher transaction volumes in cross-border payments and increased GDP underscores the importance of seamless financial transactions in economic performance (Xu, 2025).
Moreover, emerging technologies, including blockchain, are evolving the cross-border payment landscape by reducing costs and transaction times, further boosting trade activities (Eyo-Udo et al., 2025) The International Monetary Fund underscores that efficient cross-border payment systems can facilitate economic growth, financial inclusion, and international trade, leading to transformative effects on economies. Evidence suggests that faster and more transparent payment systems can bridge gaps in financial infrastructure, especially in developing economies, fostering greater participation in global trade (Risky et al., 2025). Hence, we proposed the following:
H5: 
CBG is positively associated with GDP growth.

3.6. Digital Marketing Spend (DMS) and GDP Growth

Digital marketing has become integral to contemporary business strategies, significantly influencing consumer behavior and driving sales. Increased digital marketing expenditures enhance brand visibility and customer engagement, leading to heightened sales performance (McAlister et al., 2016). These sales not only benefit individual businesses but also contribute to GDP by boosting consumption, a key element of economic growth.
Research indicates that digital marketing expenditures correlate strongly with increases in sales and market penetration. For example, firms that invest in digital marketing often experience improvements in brand equity, which in turn can lead to better financial performance and greater market adaptability (McAlister et al., 2016). Additionally, the shift to digital platforms allows businesses to reach wider audiences through targeted advertising, thus stimulating economic activity and supporting GDP growth (Gordon et al., 2019).
The digital economy has shown resilience, with increasing advertising expenditures associated with economic recovery following downturns (Molinari & Turino, 2009). As digital channels continue to rise in importance, investments in digital marketing are likely to yield significant returns regarding economic productivity, affirming the hypothesis that increased DMS serves as a catalyst for GDP growth. Hence, we proposed the following:
H6: 
Digital marketing spend (DMS) is positively associated with GDP growth.

3.7. Tech-Driven Employment Growth (TEG) and GDP Growth

The integration of technology in various sectors enhances efficiency, spurs innovation, and generates new employment opportunities, thereby contributing to overall economic growth (Gai et al., 2025).
Studies illustrate that technological advancements, especially in artificial intelligence and automation, significantly impact labor productivity. The digital economy has been associated with notable GDP growth, as businesses leveraging digital tools tend to see enhanced operational efficiency and increased market accessibility (Annunziata & Bourgeois, 2018). Furthermore, the rise in tech-oriented employment corresponds with a shift towards higher-value roles that demand advanced skill sets, increasing labor productivity and, subsequently, GDP (Safarli, 2025).
Additionally, the digital economy aids job creation in emerging fields, providing critical support for small and medium enterprises (SMEs), which significantly contribute to national GDP (Gai et al., 2025). As countries undergo digital transformations, the employment landscape evolves, leading to higher overall employment rates and greater economic resilience. This transformation is further strengthened by workforce upskilling to align with technology demands (Doroiman & Sîrghi, 2025).
H7: 
TEG is positively associated with GDP growth.

3.8. Platform Economy Contribution (PEC) and GDP Growth

Platform ecosystems extend market reach and lower transaction costs via multisided network effects, thereby stimulating aggregate economic activity K. Li (2025). Empirical evidence indicates that PEC positively correlates with GDP growth, particularly when combined with technological innovation (H. Li et al., 2025). Cross-country studies, including those focused on Russia, Europe, and emerging markets, find that digital platforms can elevate industries and improve macroeconomic performance, although the effects may vary as economies mature (Ryabukhin et al., 2025). Effective governance that promotes competition and investment in platform-enabled productivity can further enhance PEC-driven growth (Hantao, 2024). Overall, these findings support a positive association between PEC and GDP growth, aligning with the following hypotheses:
H8: 
PEC is positively associated with GDP growth.
Collectively, these hypotheses do not represent competing explanations but rather complementary channels through which SME digital transformation and e-commerce activity influence aggregate economic growth.

3.9. Digital Infrastructure Readiness (DIR) and GDP Growth

DIR is closely linked to GDP growth through various mechanisms, including enhanced productivity, broader market access, and increased investment. In China, evidence suggests that urban digital construction promotes economic growth, demonstrating how robust DIR can lead to significant output gains (Yang et al., 2024). Research across countries indicates that modern infrastructure readiness, including digital aspects, coexists with and bolsters macroeconomic performance and growth dynamics, although specific studies focusing solely on digital components’ direct impact are limited (Chi, 2015, Liu et al., 2024, Naveed et al., 2025). Additionally, digital payment ecosystems, a critical aspect of DIR, promote consumption, financial inclusion, and intermediation, thereby supporting growth in emerging economies (Kahveci & Gurgur, 2025). Collectively, these findings support the assertion that increased digital infrastructure readiness underlies stronger GDP growth and broader economic development. Hence, we propose the following:
H9: 
DIR is positively associated with GDP growth.

3.10. DIR as Moderator

DIR constitutes the study’s central moderating construct, consistent with the article’s core focus on how infrastructure conditions determine whether SME e-commerce and digital transformation translate into economic growth. A robust digital backbone, high-quality broadband, reliable digital payments, advanced logistics, and supportive policy environments enable digital growth to translate into stronger GDP performance. The literature indicates that digitalization tends to enhance SME performance, e-commerce, payments ecosystems, and platform-enabled activities, with the magnitude of their GDP impact often hinging on the depth and readiness of the underlying digital infrastructure. The growth of e-commerce is shown to elevate GDP through increased trade, productivity, and consumption, but the realized gains depend on the presence of capable digital infrastructure. Studies indicate that digital improvements, particularly in urban contexts, significantly support economic growth, underscoring DIR’s role in translating digital expansion into output gains (Yang et al., 2024; Kadárová et al., 2023). This suggests that higher DIR amplifies the GDP payoff of EGR.
The productivity and growth dividends from SME digitalization are mediated by the surrounding digital infrastructure; analyses reveal that technology, organization, and environment interact, with readiness in the environment (including DIR) enhancing firm performance outcomes (Kadárová et al., 2023). Evidence shows that digitalization significantly improves SME performance, and the impact is magnified when digital infrastructure is robust (Kadárová et al., 2023). Consequently, higher DIR may enhance the GDP growth benefits arising from SDL.
Improved supply chain efficiency raises productivity and trade competitiveness, which contribute to GDP growth; however, gains from logistics and digital-enabled supply chain management (SCM) are amplified when digital infrastructure is advanced. The literature on digital logistics emphasizes the critical role of technology-driven improvements in cross-border trade and overall economic performance, likely strengthened by high DIR (Zhi et al., 2024). Thus, DIR is expected to bolster the GDP-enhancing effect of SCE.
Mobile payments increase financial inclusion and transaction efficiency, resulting in positive implications for GDP through higher consumption and broader access to financial services. The expansion of mobile payments results in significant GDP dividends, particularly when supported by a robust digital infrastructure, including reliable connectivity and secure payment ecosystems (Talom & Tengeh, 2019). Hence, higher DIR may strengthen the GDP impact of increased MPP.
Cross-border payments can stimulate international trade and financial inclusion, with improvements in infrastructure playing a key role in reducing costs and transaction times; therefore, the GDP impact of CBG is contingent on the strength of domestic and regional digital infrastructure. Empirical studies indicate that faster, cheaper cross-border transactions translate into higher economic activity, particularly when robust digital infrastructure underpins these systems (Eyo-Udo et al., 2025). This reinforces the expectation that higher DIR amplifies the GDP benefits of CBG.
Digital advertising is associated with enhanced firm performance and economic activity, with conversion of advertising expenditures into GDP gains relying heavily on mature digital infrastructure. Consequently, stronger DIR may magnify the GDP impact of DMS, enhancing the effectiveness of reach, targeting, and measurement capabilities (McAlister et al., 2016).
Literature emphasizes that technology-driven labor market changes raise productivity and stimulate GDP growth, but the intensity of these effects depends on the adequacy of digital tools and the surrounding digital ecosystem. High DIR, by facilitating the deployment of digital skills and tools, is likely to amplify the GDP gains from TEG (Annunziata & Bourgeois, 2018).
The platform economy can foster growth via network effects and productivity increases, but these macroeconomic benefits are contingent on effective digital infrastructure, including data governance and payment systems. Literature shows how platforms influence innovation and economic outcomes, with strong DIR enhancing the positive impact of PEC on GDP growth (K. Li, 2025; H. Li et al., 2025). Accordingly, rather than proposing multiple independent moderation hypotheses, we integrate these relationships into a unified moderation framework in which DIR conditions the economic returns to SME e-commerce and its associated digital channels. Hence, we have proposed the following:
H10: 
Digital infrastructure readiness (DIR) positively moderates the relationship between EGR (a), SDL (b), SCE (c), MPP (d), CBG (e), DMS (f), TEG (g), PEC (h), and GDP growth.

3.11. Marginal Contribution of This Study

This study makes several marginal contributions to the existing literature on the digital economy, SMEs, and economic growth. First, while prior research has predominantly examined digitalization at the firm level or focused on isolated digital channels, this study integrates SME e-commerce, digital finance, platform activity, and digital infrastructure within a unified macro-level framework. By doing so, it advances understanding of how firm-level digital resources aggregate into regional and national economic growth.
Second, drawing on the Resource-Based View, this study extends RBV beyond its traditional firm-centric application by conceptualizing digitalization as a multi-level resource bundle whose economic value depends on contextual enabling conditions. In particular, the analysis positions digital infrastructure readiness as a strategic macro-capability that conditions the growth returns of SME digital transformation—an aspect largely overlooked in prior empirical work.
Third, this study contributes methodologically by employing a dynamic provincial-level panel and system GMM estimation to address endogeneity, persistence, and reverse causality—limitations that characterize much of the existing literature on digitalization and growth. Finally, by providing large-scale evidence from China’s platform economy, the study offers insights that are relevant not only for emerging economies but also for developed contexts where the macroeconomic consequences of SME digitalization remain underexplored.

4. Methods

4.1. Variable Definitions and Measurement

In this study, Economic Development is proxied by the provincial real GDP growth rate, measured as the annual percentage change in real gross domestic product of province i in year t. Specifically,
EDit ≡ GDPgit = (RealGDPit − RealGDPi,t−1/RealGDPi,t−1) × 100
where RealGDPit is provincial real GDP in constant prices. A value of GDPgit = 8 thus reflects 8% real GDP growth from year t − 1 to t.
E-commerce Growth Rate refers to the annual rate at which online sales and transactions increase, reflecting the overall expansion of e-commerce activities. This metric provides insight into how rapidly the digital retail sector is growing and can be used as an indicator of broader economic trends. E-commerce growth is a key component of the digital transformation of businesses, as it highlights the increasing adoption of online shopping, digital transactions, and internet-based services. The growth rate is influenced by several factors, including consumer behavior, technological advancements, policy support, and the integration of internet finance solutions such as mobile payments.
E-commerce Growth Rate = (Current Year E-commerce Sales or Transactions − Previous Year E-commerce Sales or Transactions)/(Previous Year E-commerce Sales or Transactions) × 100
This formula quantifies the annual increase in e-commerce activity, which can be used to assess the growth trajectory of the sector.
SME Digitalization Level refers to the extent to which small and medium-sized enterprises (SMEs) in China have adopted digital tools and technologies to enhance their business operations. These tools can include e-commerce platforms, digital marketing, cloud computing, and internet finance solutions such as online payments and digital banking services. The digitalization of SMEs is a crucial aspect of the broader digital transformation in China, as it enables businesses to increase efficiency, expand their market reach, and improve customer engagement, which in turn can drive economic growth. This can be calculated using the following:
[SME Digitalization Level]_it = Number of SMEs Using Digital Tools_it/[Total Number of SMEs]_it × 100
This formula calculates the proportion of SMEs that have integrated digital tools into their operations. The index is therefore expressed in percentage points.
Supply Chain Efficiency refers to the improvement in the speed and cost-effectiveness of supply chain operations achieved through the integration of digital tools. In the context of digital transformation, technologies such as real-time tracking, automated warehousing, and predictive analytics are pivotal in streamlining logistics and supply chain processes.
Time Efficiency (T) = Total Time Taken for Transactions/Number of Transactions
Cost Efficiency: Measured as the reduction in cost per transaction, expressed in Chinese Yuan (CNY). This can be calculated using:
Cost Efficiency (C) = Baseline Transaction Cost − Post_Digitalization Transaction Cost
Mobile Payment Penetration in B2B Transactions refers to the extent to which businesses utilize mobile payment platforms for transactions with other businesses. This indicator is crucial for understanding the adoption of digital payment systems within the business ecosystem and their role in facilitating seamless, efficient, and secure financial transactions. By leveraging mobile payment solutions such as Alipay Business and WeChat Pay Enterprise, businesses can reduce transactional costs, enhance operational efficiency, and improve cash flow management. Measurement involves calculating the proportion of mobile payments in total B2B transactions using the following formula:
[Mobile Payment Penetration (MPP)]_it = ([Volume of B2B Mobile Payments]_it/[Total Volume of B2B Transactions]_it) × 100
Here, the numerator represents the total value of B2B transactions conducted via mobile payment platforms, while the denominator accounts for all B2B transactions within the same period. Thus, MPPit = 60 indicates that 60% of B2B transaction value is settled using mobile payments.
Cross-border Payment Growth refers to the annual increase in international financial transactions conducted via digital channels. This metric is pivotal in understanding how advancements in digital payment systems contribute to the globalization of commerce and the integration of China into the global economy. Cross-border payments through digital platforms facilitate faster, cost-effective, and secure transactions, thereby supporting businesses in expanding their international operations. Measurement involves calculating the annual growth rate of cross-border digital payments using the following formula:
[Cross-border Payment Growth Rate]_it = ((Current Year Payment Volume − Previous Year Payment Volume)/(Previous Year Payment Volume)) × 100
Here, the volume refers to the total value of cross-border payments processed digitally during a specific year, where, “it” denotes the value of cross-border digital payments (CNY) conducted by firms in province “i” during time “t”.
Digital Marketing Spend refers to the total investment by businesses in digital advertising platforms aimed at promoting products and services. This variable is critical for understanding how digital transformation influences business strategies and consumer engagement, particularly within the context of e-commerce growth in China. Investments in digital marketing reflect a shift from traditional advertising methods to data-driven, targeted strategies enabled by digital platforms. Measurement involves calculating the total annual expenditure on digital advertising platforms in Chinese Yuan (CNY).
Tech-Driven Employment Growth refers to the increase in jobs generated by the expansion of the digital economy. This variable captures the employment opportunities created in tech-related fields, such as software development, e-commerce operations, digital marketing, logistics, and fintech services. It serves as an indicator of how digital transformation drives economic development by influencing labor markets and workforce dynamics. Measurement is conducted by calculating the annual growth rate of employment in tech-related fields. This can be quantified using the formula:
Employment Growth Rate (%) = ((Tech-Related Jobs in Current Year − Tech-Related Jobs in Previous Year)/(Tech-Related Jobs in Previous Year)) × 100
GDP Growth Rate refers to the annual percentage change in the total Gross Domestic Product (GDP) of China. It reflects the overall expansion of the national economy from one year to the next and serves as a comprehensive indicator of macroeconomic performance.
In the context of this study, GDP Growth Rate captures the aggregate economic outcome of digital transformation efforts, particularly those driven by SME digitalization, e-commerce expansion, mobile payment penetration, and digital infrastructure readiness. This outcome variable is dynamic, reflecting year-over-year economic change rather than a static contribution by any specific sector. For consistency with the ED construct introduced in Section 4.1, the provincial GDP growth rate is computed as follows:
[GDPg]_it = (([RealGDP]_it-Real[GDP]_(i,t−1))/[GDP]_(i,t−1)) × 100
Digital Infrastructure Readiness refers to the degree to which a region or economy is equipped with the technological infrastructure necessary to support digital transformation. This includes key enablers such as broadband internet penetration, mobile network coverage, cloud computing capabilities, and internet speeds. It serves as a foundational element for fostering e-commerce growth and enabling innovations within the digital economy. Measurement involves the creation of a composite Digital Infrastructure Readiness Index, calculated by combining several indicators, such as: (a) Broadband Penetration Rate (% of the population with access to broadband services), (b) Average Internet Speed (measured in Mbps), and (c) Mobile Network Coverage (% of the geographic area covered by 4G/5G networks). The composite index provides a standardized score to compare readiness across regions or over time.
For each province i and year t, we construct a composite Digital Infrastructure Readiness index by first normalizing each underlying indicator to [0, 1]:
Bit = (Bit-minB)/(maxB − minB),
Sit = (Sit-minS)/(maxS − minS),
Mit = (Mit-minM)/(maxM − minM),
where Bit is broadband penetration, Sit is average internet speed, and Mit is 4G/5G mobile coverage. We then compute
DIRit = 100 × (ω1Bit + ω2Sit + ω3Mit)
with non-negative weights ω1 + ω2 + ω3 = 1 (set equal in the baseline, ωk = 1/3. The resulting index lies between 0 and 100.
Table 1 provides a summary of variables and the primary sources of data used in this study.

4.2. Regression Model Specification and Estimation Approach

Before discussing results, it is important to clarify the model specification based on the research hypotheses. The baseline model aims to explain Economic Development (ED)—measured here as the GDP growth rate—as a function of various aspects of SME digital transformation and a moderator (internet finance/digital infrastructure), controlling for other factors. We estimated dynamic panel regressions using the System GMM estimator to address potential endogeneity and capture dynamic effects (lagged dependent variable). The general model can be written as:
GDP_Growthit = β0 + β1EGRit + β2SDLit + β3SCEit + β4DMSit + β5TEGit + β6PECit + β7MPPit + β8CBGit + β9DIRit + δ1(EGRit × DIRit) + δ2(SDLit × DIRit) + δ3(SCEit × DIRit) + δ4(MPPit × DIRit) + δ5(CBGit × DIRit) + δ6(DMSit × DIRit) + δ7(TEGit × DIRit) + δ8(PECit × DIRit) + γ1FSit + γ2IndustryTypeit + γ3GPit + γ4ULit + αi + τt + εit
where i indexes region and t indexes year. Here αi are region fixed effects and τt are year dummies. We include the lagged dependent variable (GDP growth{i,t − 1}) in the GMM estimations (though omitted from the above equation for brevity) to capture persistence in growth and to enable the AR(1) and AR(2) diagnostics. All right-hand-side variables are either lagged or treated as predetermined in the GMM specification to mitigate simultaneity bias.
We interpret the intent of H10 as examining the moderating role of DIR on each key relationship (EGR, SDL, SCE, MPP, CBG, DMS, TEG, PEC with economic development). Therefore, we have adjusted the model to include interactions of each main predictor with DIR. This aligns with RQ1b, focusing on how internet-related infrastructure/finance (approximated by DIR) accelerates the economic impact of SME digital transformation. Industry type effects (e.g., differences between manufacturing vs. service-dominated regions) are controlled via fixed effects and not listed as a single coefficient in the results.
We estimated three nested models to incrementally test hypotheses: Model 1 includes only the main independent variables (EGR, SDL, SCE, MPP, CBG, DMS, TEG, PEC, DIR) with no interactions; Model 2 adds the interaction terms with DIR (testing H10a–H10h); Model 3 adds control variables. Year dummies are included in all models to capture common time trends (e.g., macroeconomic cycles or nationwide policy shifts). The System GMM estimation was implemented in a two-step mode with the Windmeijer finite-sample correction for standard errors. We report the Arellano–Bond AR(1) and AR(2) tests for serial correlation and the Hansen J-test (and Sargan test) for over-identifying restrictions to assess the validity of instruments (Mustafa et al., 2024a).

4.3. Selection of the System GMM Model

This study examines the relationships between economic development in China from 2015 to 2024 and the digital transformation of businesses by means of e-commerce; thus, we believe that the System GMM model is the most appropriate econometric model to use. This is motivated by the characteristics of the research problem and the data structure, in combination with the methodological advantages that system GMM brings to bear on the main problems facing panel data analyses in dynamic environments (Arellano & Bover, 1995; Blundell & Bond, 1998).
The system GMM model fits well with this study as the system GMM model accounts for dynamic relationships, endogeneity, unobserved heterogeneity, and simultaneous-equation bias due to the dependence of one variable on the other, and provides efficient estimates in the presence of measurement errors (Arellano & Bover, 1995; Blundell & Bond, 1998). Given this and its ability to link in lagged variables and interaction terms, as well as appropriate accounting for the peculiarities of panel data, it is the best choice for our study. Hence, to better exploit the dynamic models, we applied system GMM, which allows us to obtain a conservative estimation of the long relation between our variables of interest: digital transformation, internet finance, and economic development (Arellano & Bover, 1995; Blundell & Bond, 1998; Mustafa et al., 2024b).
Beyond econometric endogeneity, the possibility of reverse causality also warrants conceptual consideration. While higher economic growth may facilitate greater digital adoption by increasing investment capacity and market demand, the theoretical framework adopted here emphasizes the role of digital resources and infrastructure as enabling conditions that precede and shape growth trajectories. The dynamic GMM specification mitigates reverse causality empirically by exploiting internal instruments and lag structures; conceptually, the model is grounded in the premise that digital infrastructure readiness and SME digital transformation act as structural capabilities whose economic effects unfold over time rather than responding instantaneously to short-term growth fluctuations.

5. Results and Discussion

5.1. Data Description and Descriptive Statistics

We constructed a panel dataset for China’s 30 provincial-level regions over the period 2015–2024 (annual frequency), capturing the key variables outlined in the research questions. Table 2 presents descriptive statistics for all variables, including their definitions and units. Notably, GDP Growth Rate (our proxy for economic development, measured as annual % GDP growth) averages about 8.30% over the sample, with a range from 3.69% to 13.32%. The PEC is relatively modest (mean ~4.38% of GDP) but varies up to ~8.85%, reflecting the growing share of digital platform activities in the economy. EGR has a mean of ~16.6% with some year–region observations even experiencing slight declines (min –4.68%) and others very rapid growth (max ~40.6%), indicating heterogeneous e-commerce development across regions and years. SDL, the percentage of SMEs adopting digital tools, averages ~53.9% but ranges widely (from ~4.2% in less developed areas up to near full adoption at 98%), showing substantial disparity in SME digital transformation.
Other independent variables also exhibit significant variation. For instance, SCE, an index of logistics/delivery efficiency, ranges from 37.0 to 84.2, improving in most regions over time. MPP in B2B transactions averages ~43% but with some regions as low as ~10.7% and leading regions reaching ~86.6% of B2B transactions by mobile platforms. CBG is on average ~10% annually, with some regions seeing declines in certain years (min –5.10%) and others surges over 25%, reflecting variability in international e-commerce expansion. DMS has a high standard deviation, indicating that while some regions/firms spend relatively little on online marketing (tens of millions CNY), others spend dramatically more (up to ~360 million CNY), likely correlating with region size and economic activity. TEG, the annual growth in tech sector jobs, is generally positive (mean ~5.67%), though a few region-years saw slight declines, and the maximum observed ~11.9% indicates robust tech job creation in certain areas. DIR, a composite index of internet/broadband/mobile network infrastructure (0–100 scale), has a mean of ~63.4 and reaches 100 in the top region-year, underscoring that some regions have achieved near-complete broadband and 5G coverage, whereas the lowest is ~30.4 in less connected regions. Among control variables, Urbanization Level averages ~68% (ranging ~41–95%), Government Policy Support index averages ~52 (out of 100), and average firm size (FS) is ~120 employees, though with considerable variability (some regions dominated by very small firms averaging ~10 employees, others with larger enterprises averaging 200+ employees).
The descriptive statistics suggest that over 2015–2024, China experienced substantial digital transformation among SMEs (SDL rising toward high levels) and expansion in digital economic activities (strong e-commerce and mobile payment growth), alongside steady economic development. Regions with advanced digital infrastructure (DIR) tend to have higher values in digital adoption and platform economy metrics (e.g., SDL, PEC). The variability in Government Policy Support and Urbanization across regions provides additional context to control for structural differences in the regression analysis.

5.2. Correlation Analysis

Table 3 displays the pairwise Pearson correlation matrix. This helps diagnose multicollinearity and provides preliminary insight into relationships consistent with our hypotheses. As expected, GDP Growth is positively and strongly correlated with several digital transformation indicators. For example, GDP growth has a very high correlation with SDL, suggesting that regions and years with greater SME adoption of digital tools tend to experience higher economic growth. This lends early support to H2, anticipating a positive impact of SME digitalization on economic development. GDP growth is also positively correlated with Supply Chain Efficiency and Platform Economy Contribution, in line with H3 and H8/H9—i.e., more efficient logistics and a higher share of the platform economy are associated with faster growth. DIR is moderately correlated with GDP growth, supporting the idea (H9) that better infrastructure coincides with better economic outcomes. Based on these results, it is worth mentioning here that, as SDL and PEC are conceptually overlapping and highly correlated, this may inflate standard errors.

5.3. Main Regression Results (System GMM)

The main estimation results are presented in Table 4. For ease of interpretation, we treat Model 3 as the preferred specification because it includes the full set of controls and the DIR interaction structure aligned with RQ1b and H10. Throughout the discussion below, we therefore emphasize Model 3 unless otherwise stated. Statistical significance is denoted using conventional markers: *** p < 0.01, ** p < 0.05, and * p < 0.10; coefficients without stars are not statistically distinguishable from zero at conventional levels. For each model, the table reports coefficient estimates with robust standard errors in parentheses and significance levels. The bottom panel of Table 4 provides diagnostic statistics confirming the model’s validity. In particular, AR(1) tests are significant (p < 0.01) as expected in a dynamic model (indicating first-order autocorrelation in differences due to the lagged dependent variable), while AR(2) tests are not significant (p > 0.2), indicating no second-order serial correlation, satisfying a key assumption for the GMM estimator. The Hansen test for over-identifying restrictions has p-values in the range 0.30–0.50 (and Sargan p-values ~0.15–0.25), suggesting that the instruments used are valid. The number of instruments is kept moderate relative to the number of regions (e.g., 30 instruments for 30 groups in Model 3) to avoid overfitting, and the Hansen test’s non-rejection further implies no instrument proliferation problems (Arellano & Bond, 1991).

5.4. Direct Effects on Economic Development

To make magnitudes comparable across measures, we interpret percentage-point variables (e.g., SDL, MPP) in 10-percentage-point increments and index variables (e.g., DIR) in 10-point increments.
Focusing first on the direct effects (Model 1), we find strong support for H1–H9: almost all coefficients on the main independent variables are positive and statistically significant. In Model 1 (no interactions or controls), a higher EGR is associated with higher GDP growth (β1 = 0.037, p < 0.01). This indicates that a 1%-point increase in the SME e-commerce growth rate corresponds to roughly a 0.037%-point increase in regional GDP growth (holding other factors constant). Thus, H1 is supported, confirming that the rapid expansion of e-commerce activity by SMEs is linked to faster economic development. It is worth noting that when we introduce interactions in Model 2, the EGR main effect diminishes somewhat (to 0.020 **), likely because part of its effect is now captured in the interaction with infrastructure (EGR × DIR). By Model 3 (full controls), EGR remains positive and significant (0.018, p < 0.05). In sum, SME e-commerce growth exhibits a robust positive impact on economic growth, though the magnitude is moderate, consistent with the notion that e-commerce is one contributor among many to GDP growth (Binh et al., 2022; Ansu-Mensah et al., 2021).
The SDL shows a highly significant positive effect across all models. In Model 1, β2 = 0.032 (p < 0.01), indicating that regions with a 10-percentage-point higher rate of SME digital tool adoption enjoy ~0.32-percentage-point higher GDP growth, all else equal. This strongly supports H2, the digital transformation of SMEs (through e-commerce platforms, cloud, digital payments, etc.) materially boosts economic development. This effect remains very robust (0.028, p < 0.01 in Model 3). Among the direct effects, SDL has one of the largest standardized impacts, reflecting how critical broad digital adoption among SMEs is for aggregate growth—likely through gains in productivity, market expansion, and efficiency (Prayitno et al., 2024; Mushtaq et al., 2024).
SCE also contributes positively to economic growth (β3 = 0.031 *** in Model 1). This supports H3, improvements in logistics and supply chain performance (e.g., faster delivery times, lower costs due to digital tracking and automation) correlate with higher regional growth rates. Even after adding controls, SCE remains significant (0.022 ** in Model 3). Substantively, this suggests that regions achieving supply chain optimizations (often enabled by digital technologies like IoT and analytics) see tangible macroeconomic benefits, likely via increased trade flows and reduced transaction costs (Alshurideh et al., 2022; Zhi et al., 2024).
For MPP in B2B transactions, we find a positive and significant coefficient (β4 = 0.013, p < 0.01 in Model 1). This confirms H4, which implies that greater adoption of mobile/internet finance among businesses is linked to higher economic growth. While the coefficient may appear small, recall that MPP is measured in percentage points—so a 10-point increase in B2B mobile payment share is associated with ~0.13-point higher GDP growth. This effect remains significant in Model 3 (0.010, p < 0.05). The implication is that internet finance integration (e.g., using platforms like Alipay, WeChat Pay for B2B transactions) has a non-trivial payoff for the economy, likely by improving transaction efficiency and financial inclusion for SMEs (Kahveci & Gurgur, 2025; Okore et al., 2023).
CBG has a positive coefficient as well, supporting H5, but its significance is weaker. In Model 1 (β5 = 0.015 ***), however, by Model 3 this drops to 0.016 with p ≈ 0.10 (just at the threshold of significance). This suggests that while growing cross-border digital transactions correlate with higher growth (perhaps by enabling SME export expansion), the effect is not very robust once other factors are accounted for. It may be that cross-border e-commerce contributes to growth mainly in more developed coastal regions, and its incremental impact elsewhere is limited—an interpretation consistent with the marginal significance (Risky et al., 2025). Nonetheless, the positive sign is in line with H5.
Turning to DMS, Model 1 showed a small but significant positive effect (β6 = 0.003 ***), meaning higher investment in online advertising is initially associated with slightly higher growth. However, once we include the moderator and controls, DMS’s direct effect becomes statistically insignificant (β6 ~ 0.001, n.s. in Models 2–3). This indicates that H6 is not strongly supported in the multivariate context—the direct link between digital ad spending and macroeconomic growth appears weak after controlling for other aspects of digitalization. One interpretation is that digital marketing spend may influence firm revenues, but, at a regional aggregate level, its effect overlaps with other digital adoption metrics (SDL, EGR). Another possibility is that the efficiency of digital ad spend varies, and without a moderator (like infrastructure or human capital), it does not uniformly translate to growth. We observed in the moderation analysis that when infrastructure is high, digital marketing’s impact does become stronger (significant interaction DMS × DIR), suggesting that digital marketing contributes to growth only under conducive conditions. This result qualifies and contextualize prior findings, such as those of Gordon et al. (2019).
The attenuation of the direct effect of digital marketing expenditure in more comprehensive specifications suggests that its growth impact is largely indirect and contingent rather than autonomous. Rather than acting as an independent driver of GDP growth, digital marketing appears to be effective primarily when embedded within broader digital systems that include infrastructure readiness, platform participation, and internal digital integration. This pattern is consistent with a complementarity interpretation: once other digital dimensions are controlled for, standalone marketing expenditure offers limited incremental explanatory power, indicating overlap with demand-side and platform-related digital mechanisms rather than a distinct growth channel.
The coefficient on TEG is positive and highly significant (β7 = 0.022 *** in Model 1), confirming H7: regions generating more jobs in tech and digital sectors experience higher overall economic growth. Interestingly, in Model 2 when interactions are added, the TEG main effect jumps to 0.060 ***. This likely occurs because in some regions with high DIR, TEG is strongly associated with growth, and the interaction term picks up a complex part of that relationship (indeed TEG × DIR comes out significant but with a small coefficient). Even with controls (Model 3), TEG’s direct effect remains significant (0.055, p < 0.05). Substantively, a 1-percentage-point increase in tech-sector employment growth corresponds to ~0.05-percentage-point higher GDP growth—a notable impact given that tech jobs are a relatively small share of total employment. This underscores how employment creation in the digital economy (e.g., IT services, e-commerce operations, fintech) can yield spillover benefits for the wider economy, likely through increased consumption and productivity (Gai et al., 2025).
Not surprisingly, the Platform Economy’s Contribution to GDP (PEC) itself strongly predicts overall GDP growth (β8 = 0.054 *** in Model 1, rising to ~0.09–0.10 ** in Models 2–3). This supports H8 (interpreted here as: a greater share of economic activity coming from digital platforms is associated with higher growth rates). The result makes intuitive sense—regions where e-commerce, ride-sharing, online services, etc., constitute a larger portion of GDP tend to be dynamic and fast-growing. There could be reverse causality (fast-growing regions foster more platform economy), but our dynamic GMM approach and controls for infrastructure and policy aim to mitigate that. The finding suggests that the platform economy is not just reshaping the composition of GDP but is likely expanding it, through innovation and efficiency gains (K. Li, 2025; H. Li et al., 2025).
Finally, DIR has a positive and highly significant main effect (β9 = 0.043 *** in Model 1, remaining ~0.038 *** in Model 3). This confirms H9: better digital infrastructure (broadband penetration, network speed, coverage) directly promotes economic development. Quantitatively, a 10-point increase in the infrastructure index (e.g., moving from 50 to 60 on the 0–100 scale) is associated with ~0.4-percentage-point higher annual GDP growth. This is a substantial effect, highlighting infrastructure as a foundational element—regions that invested in robust digital infrastructure reaped dividends in terms of growth (Yang et al., 2024). Importantly, DIR remains significant even alongside the other digital variables, implying it has an independent influence (e.g., enabling productivity gains across various sectors, not just through the specific channels of e-commerce or payments).
In summary, the direct effects provide strong evidence in support of our hypotheses H1 through H5, H7, H8, and H9. One exception is H6 (digital marketing spend), which did not show a robust direct effect, a point we revisit with moderation. The significance of the lagged dependent variable (Lag GDP Growth(t−1) ≈ 0.10–0.15, p < 0.05) indicates a mild persistence in growth rates—faster-growing regions tend to maintain some momentum next year, justifying the dynamic panel approach (Arellano & Bond, 1991). Among control variables (Model 3), Government Policy Support has a positive and significant coefficient (0.008 **, supporting the notion that regions with more pro-digital or pro-business policies see higher growth). Urbanization has a positive but not quite significant effect (0.012, p ~ 0.10), suggesting a weak link when other factors are accounted for—many digital variables already capture the advantages of urbanized regions. Firm Size has a negative but insignificant coefficient, indicating that the average firm size in a region (SME-dominated vs. presence of large firms) by itself does not have a clear direct effect on short-run growth when digital adoption is accounted for. Industry-type dummies were included to ensure results are not driven by industrial structure (e.g., manufacturing base vs. services), and their inclusion did not substantially alter coefficients (industry effects are jointly insignificant, per a Wald test, and hence not tabulated).

5.5. Moderating Role of Digital Infrastructure

A key contribution of this study is examining whether DIR moderates the impact of SME digital transformation on economic development (H10). The interaction terms in Table 4 (Models 2 and 3) shed light on this. Several of the interaction coefficients are statistically significant, indicating moderation effects.
For H10a, the interaction between EGR and DIR is positive and statistically robust (≈0.0003, significant in Models 2–3). This implies that the positive effect of SME e-commerce growth on GDP is meaningfully stronger in regions with higher DIR. A 10-point increase in the DIR index raises the marginal effect of EGR on GDP growth by about 0.003, so moving from a low-DIR province (around 40) to a high-DIR province (around 80) roughly doubles the incremental growth payoff of a given EGR increase. This marks EGR × DIR as one of the clearest and most economically relevant moderation patterns in the data.
The second clearly robust moderation concerns mobile payments. The interaction between MPP and DIR is positive and significant in the fully specified GMM model (≈0.0002 **, Model 3). In other words, the growth impact of mobile payment penetration is systematically amplified by strong digital infrastructure. Provinces with widespread 4G/5G coverage and reliable internet connectivity are able to convert additional mobile payment adoption into higher GDP growth much more effectively than low-DIR regions, consistent with the idea that internet finance is a key channel through which infrastructure magnifies digitalization benefits.
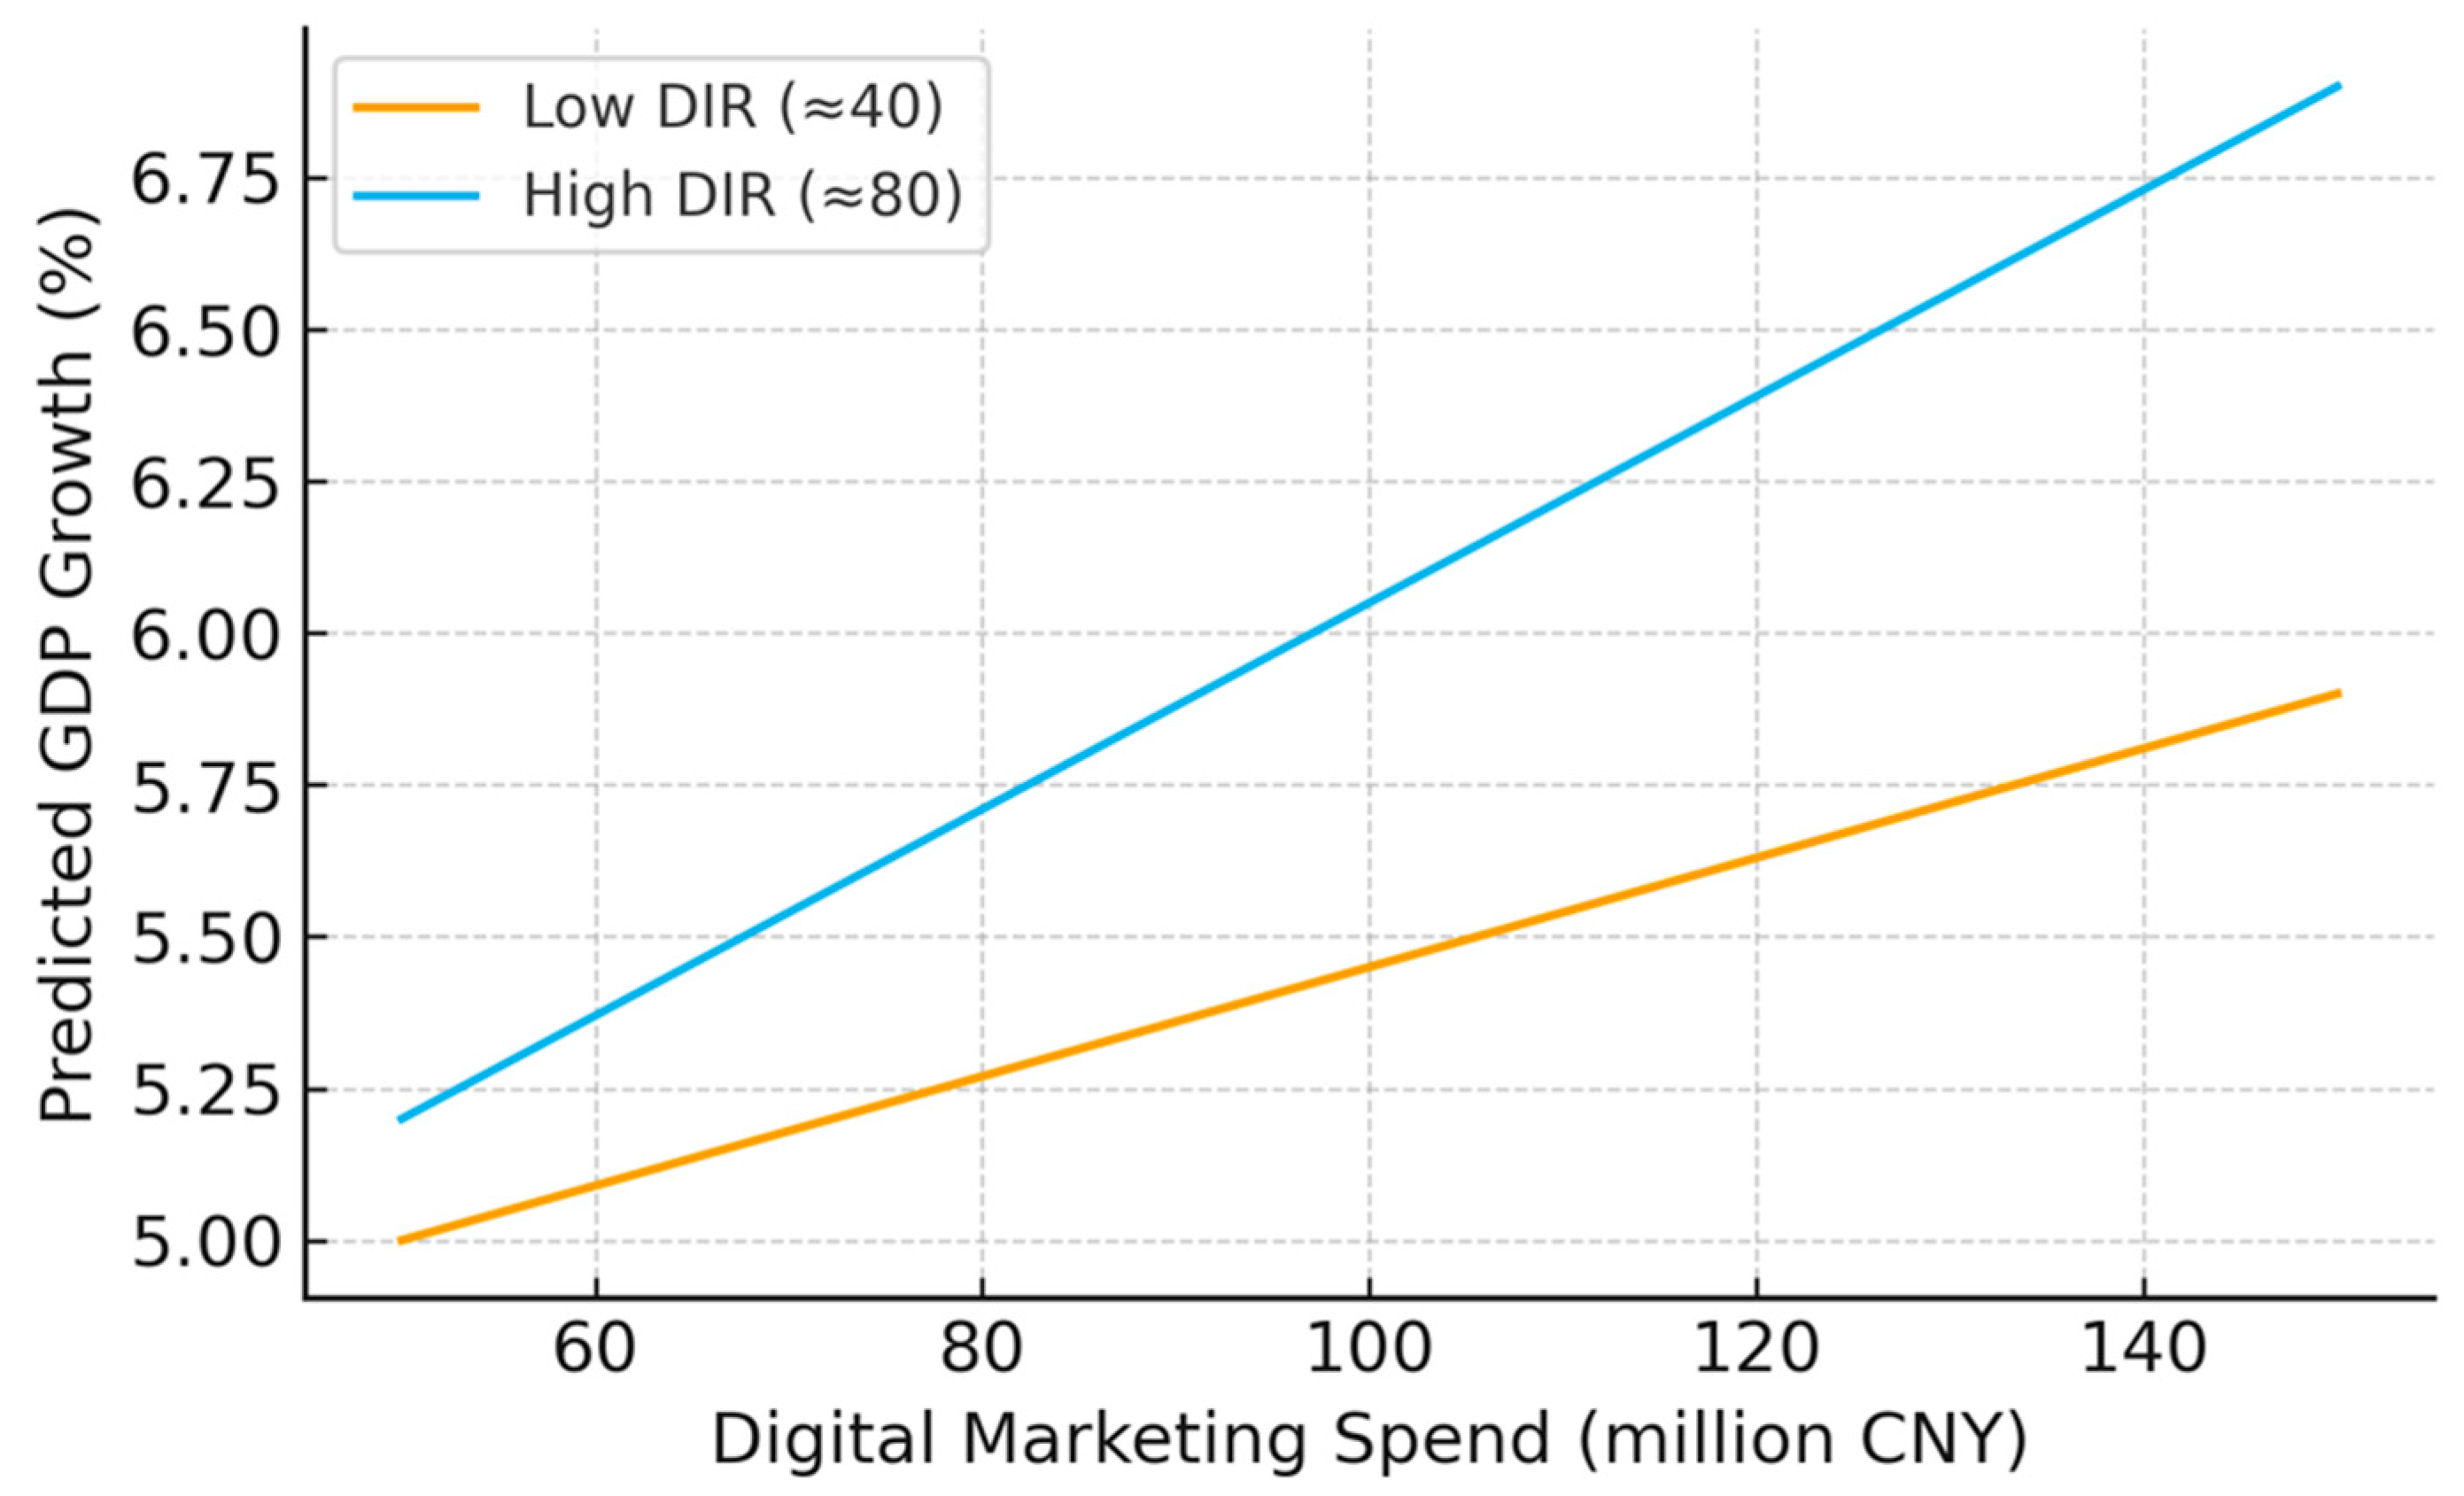
A third strong moderation emerges for digital marketing spend. The DMS × DIR coefficient (≈0.0002 ***) is large relative to the DMS main effect and highly significant across specifications. Combined with the weak and unstable direct effect of DMS, this pattern suggests that digital advertising only becomes macro-economically potent in high-DIR environments: in well-connected regions, additional digital ad spending translates into sizeable growth gains; in low-DIR regions, similar spending appears to dissipate with little aggregate impact. This is a textbook case of a “conditional” digital lever whose payoff depends critically on infrastructure.
By contrast, the evidence for moderation is weaker and more tentative for several other relationships. The SDL × DIR and TEG × DIR coefficients are positive and generally significant only at the 10% level. They are consistent with the idea that infrastructure modestly boosts the GDP payoff of SME digitalization and tech-sector employment, but given their borderline significance and sensitivity to specification, we treat these effects as promising but not definitive signals rather than firm confirmations of H10b and H10g. Similarly, the PEC × DIR interaction is positive and marginally significant (~0.001 *), suggesting that the platform economy’s contribution to growth may be somewhat larger under strong infrastructure, but here too the evidence is best interpreted as suggestive.
For SCE × DIR, the interaction becomes insignificant once full controls are added, and CBG × DIR is essentially zero throughout. Thus, we do not find robust evidence that DIR materially alters the growth impact of supply chain efficiency or cross-border digital payments (H10c and H10e). A plausible interpretation is that logistics improvements and cross-border flows benefit regions fairly broadly once a basic infrastructure threshold is met, and their incremental gains are less sensitive to further improvements on the specific DIR dimensions captured by our index.
We observed a strongly significant positive interaction of DMS and DIR (≈0.0002 ***). This is a very interesting result supporting H10f: the effectiveness of digital marketing spend in promoting economic growth depends critically on digital infrastructure. Specifically, where broadband and internet access are widespread, additional digital advertising yields more consumer engagement and sales, which in aggregate boosts growth. In contrast, in a poorly connected region, increasing online ad spend might not reach enough audience or convert into economic activity, thus showing little direct effect (as we saw with the insignificant DMS main effect). The large t-statistic here implies that under high-DIR conditions, digital marketing can be a significant driver of growth. This aligns with the intuitive scenario: for example, a new online sales campaign will have far greater impact in a region where most consumers are online and can pay/order digitally (high DIR) than in one where internet usage is limited (McAlister et al., 2016).
The interaction coefficient of TEG and DIR is positive and marginally significant (0.0003 *, ~10% level). This provides some evidence for H10g that the growth boost from tech-sector employment is larger when infrastructure is strong. Regions with excellent digital infrastructure likely attract more high-tech firms and talent, and the jobs created in tech are more productive, thereby contributing more to growth. The borderline significance suggests caution—it is plausible but not definitive in our sample.
The interaction of the platform economy’s GDP share with infrastructure is positive and significant at ~10% (0.001 *). This supports H10h, meaning the contribution of the platform economy to growth is higher in regions with better digital infrastructure. Essentially, digital platforms (e-commerce marketplaces, rideshare, etc.) add more value to the economy when they operate in an environment of high internet penetration and speed—likely because they can scale quickly and serve more users (K. Li, 2025; H. Li et al., 2025). For instance, an area with ubiquitous internet access allows platform businesses to reach nearly the entire population, amplifying their economic impact. The effect size here is also small in absolute terms, but remember, PEC itself is at most ~9% of GDP; what this interaction implies is that the marginal impact of increasing the platform economy’s GDP share is a bit larger when infrastructure is first-rate.
In summary, the moderation analysis shows that digital infrastructure readiness plays a decisive moderating role for three relationships, EGR, MPP, and DMS, where the interaction effects are strong, stable, and economically meaningful. For SDL, TEG, and PEC, DIR appears to potentially enhance their impact on growth, but only at marginal significance levels; we therefore regard these as tentative patterns that merit further investigation rather than conclusive evidence. For SCE and CBG, we do not detect any substantive moderation. These findings directly address RQ1b: internet-related infrastructure and finance amplify certain channels of SME digital transformation (especially e-commerce, mobile payments, and digital marketing), while leaving others largely unchanged.
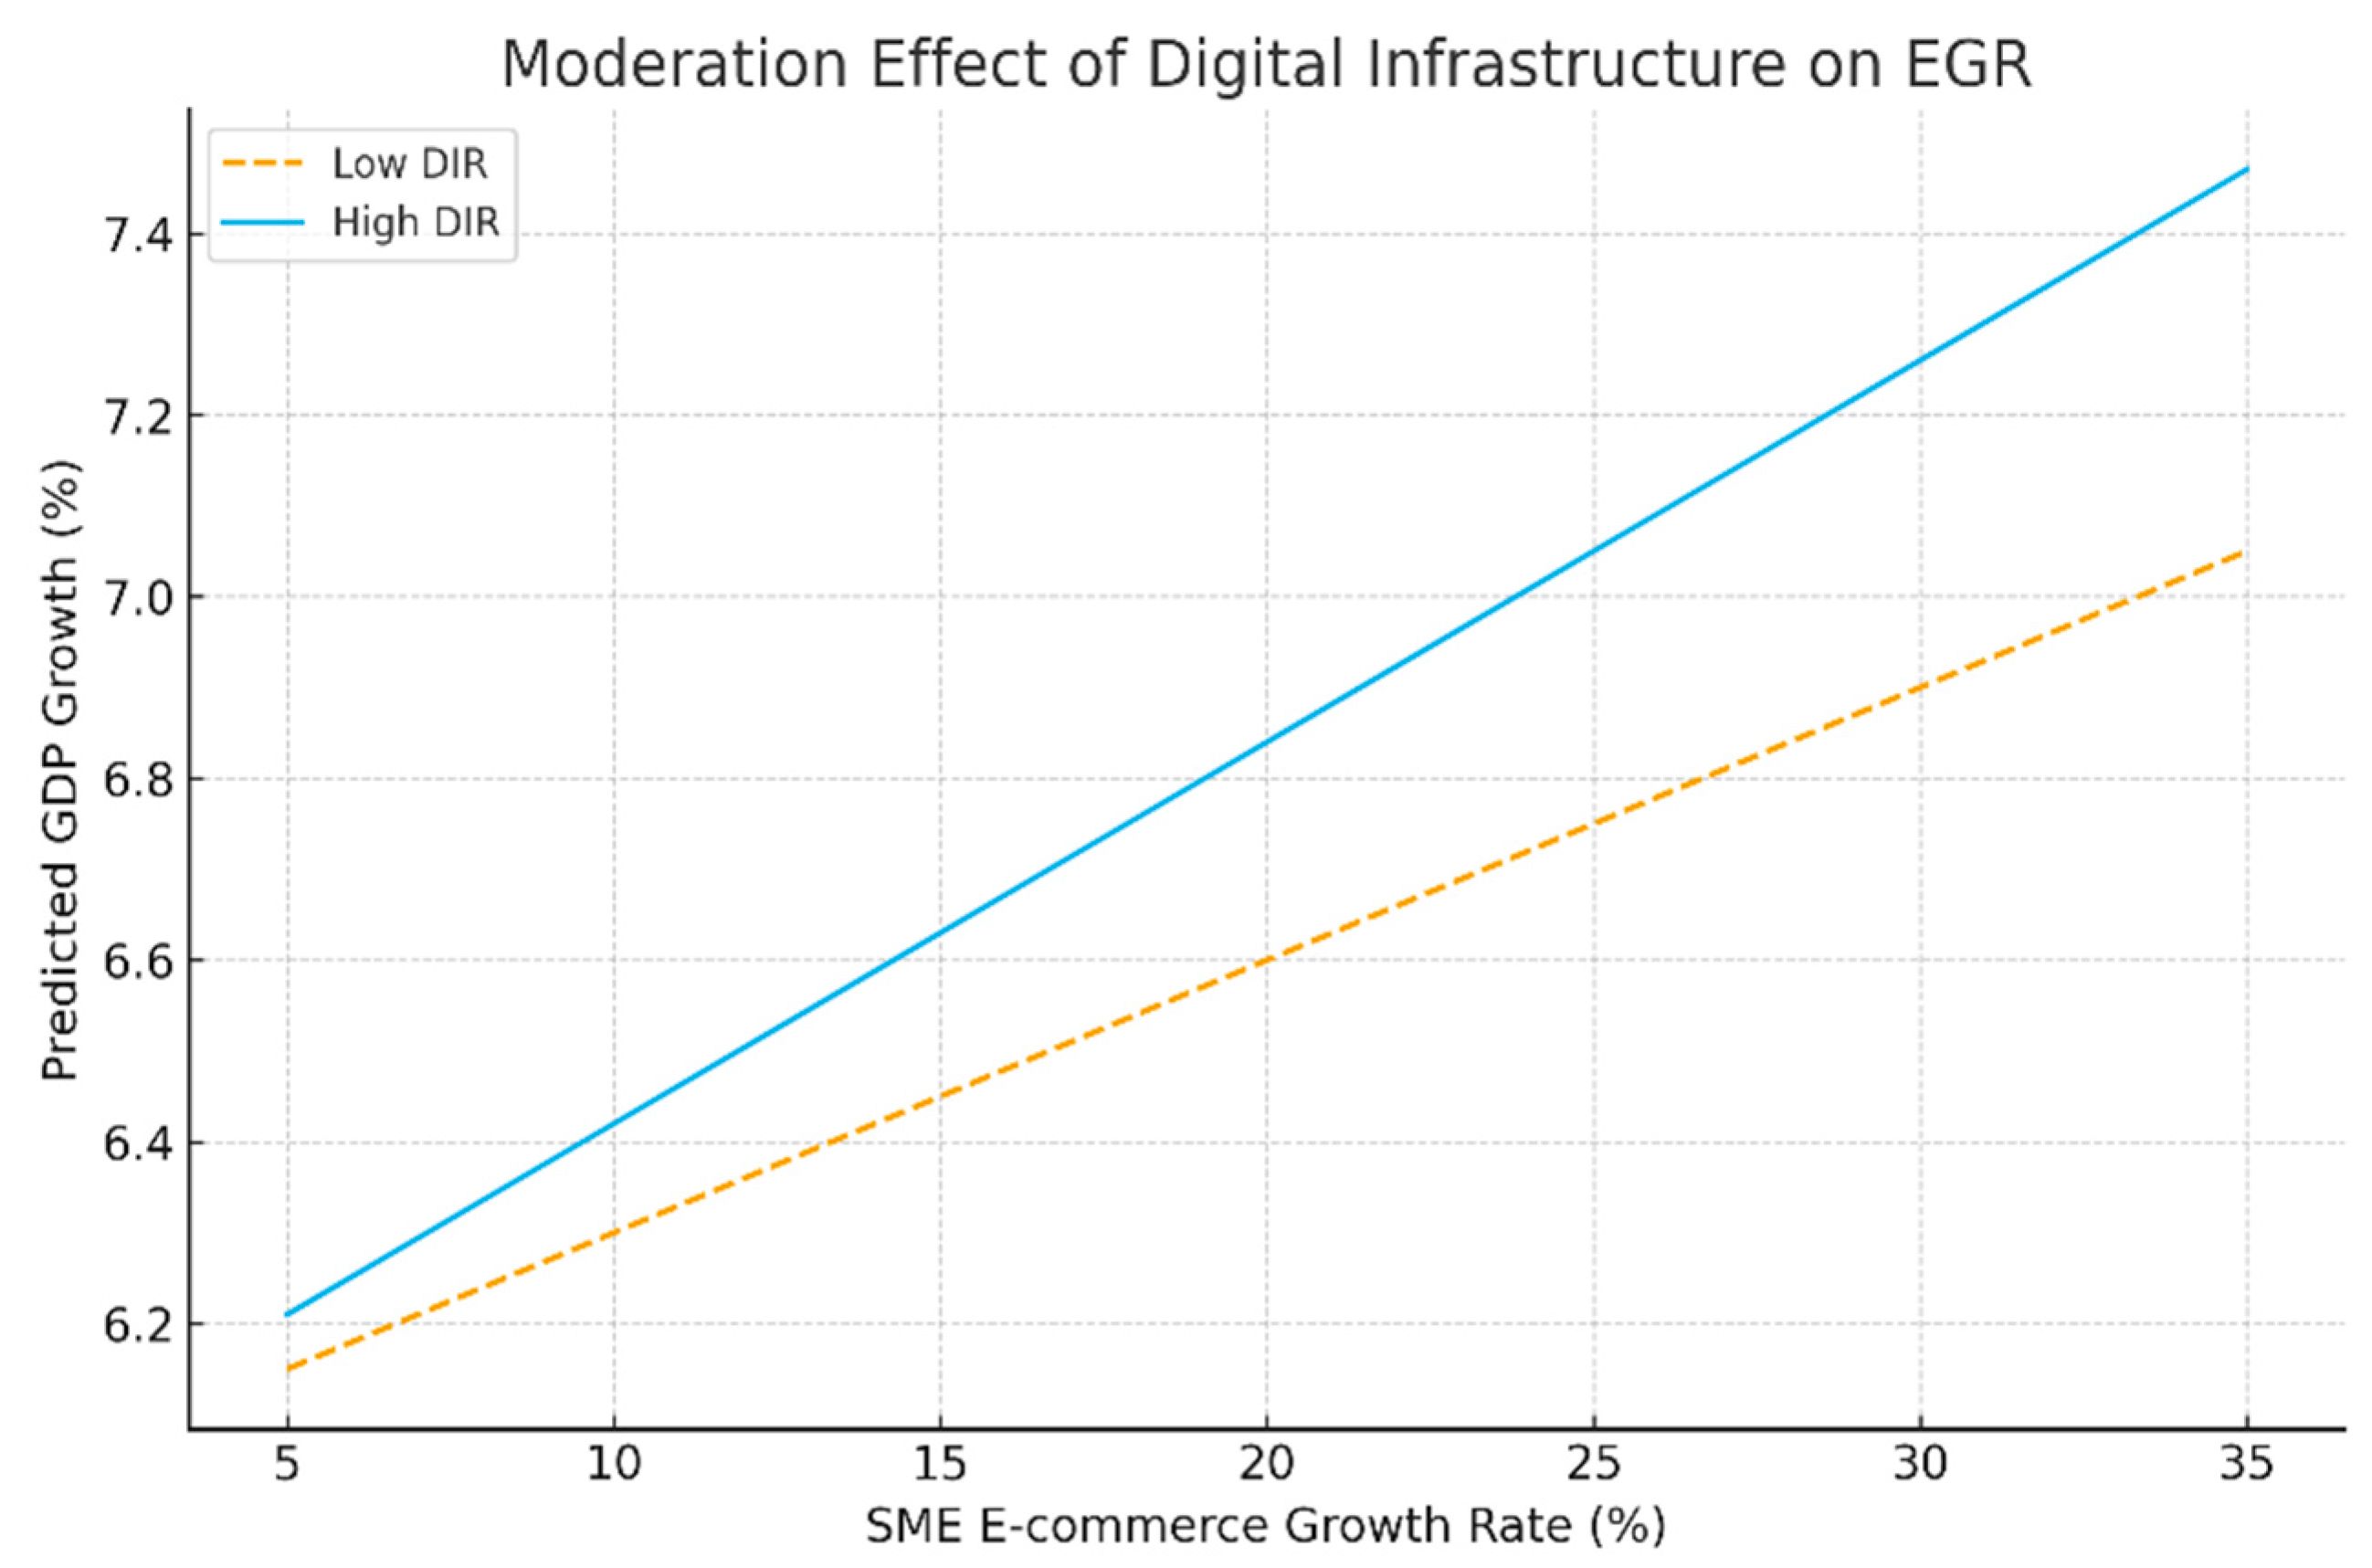
To visualize the practical significance of these moderation effects, we plot the simple slopes of two representative relationships at low vs. high levels of digital infrastructure readiness. Figure 2 illustrates the relationship between EGR and GDP growth under different infrastructure scenarios. The blue line represents a province with a high DIR (approx. top 10% infrastructure index) and the orange line a province with a low DIR (approx. bottom 10% infrastructure). We can see that the slope of the blue line is steeper: for a given increase in EGR, the high-DIR region experiences a larger rise in GDP growth compared to the low-DIR region. Based on the Model 3 coefficients, the marginal effect of EGR on GDP growth is approximately 0.03 at low DIR (around 40 on the index) and 0.042 at high DIR (around 80). For instance, moving EGR from 10% to 20% (a 10-point increase) is associated with about a 0.30-percentage-point GDP growth increase in a low-DIR setting, versus roughly 0.42 percentage points in a high-DIR setting. This gap is modest in absolute terms but fully consistent with the positive EGR × DIR coefficient, and confirms visually that better infrastructure boosts the marginal returns of e-commerce growth on the economy.
Figure 3 performs a similar analysis for DMS. In the high-DIR scenario (blue line), there is a clear positive slope: as firms in a region spend more on digital advertising, GDP growth rises more steeply than in low-DIR regions. Using the Model 3 estimates, the marginal effect of DMS on GDP growth is around 0.009 per additional million CNY of digital advertising spend at low DIR (≈40) and about 0.017 at high DIR (≈80). Concretely, increasing DMS from 50 to 150 million CNY (a 100-million increase) is associated with roughly 0.9 percentage-points higher GDP growth in a low-DIR province, compared to about 1.7 percentage-points in a high-DIR province. This difference visualizes the strong DMS × DIR interaction: digital marketing is economically powerful only when supported by adequate digital infrastructure; in poorly connected regions, additional online ad spending yields much smaller macroeconomic gains.

5.6. Robustness Checks and Alternative Models

We conducted several robustness tests to ensure the validity of our results. In particular, we re-estimated the relationships using alternative econometric models: pooled OLS with robust standard errors, fixed-effects (FE) model with clustered errors, and random-effects (RE) model. The purpose is to check whether the signs and significance of key variables remain consistent outside the GMM framework (which, while suited for our dynamic panel, relies on certain assumptions about instruments).
Table 5 presents a comparison of OLS, FE, and RE estimates for the main independent variables (excluding interaction terms for simplicity). All three models include the same set of regressors as Model 3 (Table 4)—i.e., the eight primary SME digital transformation indicators (EGR, SDL, SCE, MPP, CBG, DMS, TEG, PEC), the moderator (DIR) as an ordinary regressor, and the control variables (FS, GP, UL), along with year dummies. The FE model uses region fixed effects to absorb time-invariant differences, and the RE model allows for random region intercepts. Standard errors are cluster-robust at the region level for FE/RE and robust for OLS.
The alternate models largely corroborate our main findings. Across OLS, FE, and RE, the coefficients on the digital transformation variables remain positively signed in all cases. This consistency in sign provides reassurance that our GMM results are not an artifact of a particular estimator. For most variables, the significance holds as well, though there are a few differences in magnitude and significance worth noting:
SDL and PEC are highly significant in all models (p < 0.01), reinforcing the robust positive impact of these factors on growth. The FE estimate for SDL (0.020 ***) indicates that even when looking purely at within-region changes over time, increases in SME digitalization yield higher growth—an important confirmation that the relationship is not driven only by cross-sectional differences. Similarly, PEC’s positive effect persists within regions.
DIR remains significant in OLS, FE, and RE (p < 0.05 or better), although the FE coefficient (0.020 **) is about half the pooled OLS coefficient (0.040 ***). This suggests that some of the impact of infrastructure is long-term and captured by cross-region variation (regions with inherently better infrastructure grow faster). Still, the within-region effect is significant, indicating that improvements in a given region’s infrastructure over time do lead to faster growth for that region, a powerful policy implication.
EGR is positive in all models, but is statistically significant in OLS and RE, not in FE. The OLS coefficient ~0.030 ** aligns with our GMM result. The loss of significance in FE (coef ~0.010, p = 0.30) likely occurs because e-commerce growth exhibits a lot of year-to-year noise within regions and is also correlated with unobserved regional traits (which FE sweeps out). The RE model (which partially pools the cross-section information) shows EGR with a weaker yet marginally significant effect (0.020, p < 0.10). The fact that OLS and GMM found EGR significant while FE did not can be interpreted as: regions with structurally higher e-commerce growth tend to grow faster (hence OLS/RE pick it up), but short-run deviations in EGR within a region have an obscured signal amid other fluctuations. Nonetheless, the positive coefficient in all cases means no model finds a deleterious effect of e-commerce; if anything, FE’s insignificance is due to lack of power, not a sign flip. We conclude the evidence for H1 remains positive, with some sensitivity in a strict FE context.
MPP is positive everywhere, but only significant in OLS and RE, not in FE. The FE coefficient (0.005) is about half the OLS (0.012 ***). This suggests that much of the correlation between MPP and growth comes from differences across regions (the more cashless economies are generally higher-growing) rather than dramatic within-region changes. Many regions saw a nationwide rise in MPP simultaneously (captured by year effects), leaving less variation for FE to exploit. Still, the sign consistency and significance in RE support our earlier finding that internet finance adoption is beneficial for growth.
CBG shows a positive but insignificant coefficient in FE, while being significant in OLS and RE. Given its weaker role in the main model as well, this pattern again points to a modest effect: cross-border e-commerce might matter more in a cross-sectional context (regions more engaged in international digital trade tend to be richer/coastal and somewhat faster-growing), but according to the time series, within a region, its fluctuations do not strongly drive growth. We do not place heavy weight on CBG in robustness—it remains positive, which at least aligns with H5.
DMS is significant at 5% in OLS, insignificant in FE, and weakly significant (10%) in RE. This mirrors our main result that DMS’s effect is conditional—it shows up in simpler models (pooled OLS) but not once unobserved heterogeneity is controlled (FE). The RE result (0.002 *) may be partially capturing some moderated effect (since RE, unlike FE, does not eliminate cross-region differences, which could correlate with infrastructure). In sum, the alternate models reinforce that the direct effect of DMS on growth is at best modest and likely requires good conditions to manifest (as we saw with DIR interaction).
TEG remains positive and is significant or borderline in all models (OLS: 0.020 ***, FE: 0.008 *, RE: 0.015 **). The FE significance at 10% suggests that even controlling for region fixed traits, increases in tech employment share correspond to higher growth. Combined with our GMM findings, this solidifies support for H7.
Among controls, Policy Support (GP) is consistently positive and significant (p < 0.05) across OLS/FE/RE, indicating that our GP index (which might include measures like local incentives, ease of doing digital business, etc.) robustly correlates with better growth outcomes—likely by fostering the digital transformation process. Urbanization (UL) is significant in OLS/RE but not in FE (since urbanization changes slowly within a region over 10 years, FE sees little variation). Still, the positive sign aligns with the expectation that more urbanized regions grow faster due to agglomeration effects. Firm Size (FS) remains insignificant, consistently suggesting that, controlling for digitalization, the average firm size does not directly impact short-run growth.
In addition to these alternate regressions, we also checked for potential issues like multicollinearity and endogeneity more directly. The variance inflation factors (VIFs) for the OLS model were mostly moderate (<5 for most variables, with the exception of SDL and PEC, which were ~5–6 due to their high correlation, as seen in Table 2). This multicollinearity is handled in the GMM by using internal instruments (lagged levels)—the Hansen test results give confidence that these instruments are valid and the estimates are not biased by collinearity or simultaneity. We also ran the difference-in-Hansen tests for subsets of instruments, which did not indicate rejection, further supporting the instrument choice.
Lastly, as a robustness check on the moderation result, we experimented with using an alternative moderator specification: instead of the composite DIR index, we tried an Internet Finance index combining MPP and digital banking penetration. The results (not tabulated for brevity) similarly showed stronger impacts of e-commerce and digital adoption on growth in provinces with higher internet finance development, consistent with our DIR-based findings. This gives additional credence to our interpretation that the moderator effect is indeed capturing the role of the internet finance environment in amplifying digital transformation benefits (addressing RQ1b).

6. Theoretical Contribution and Policy Implications

6.1. Theoretical Contribution

This study makes several interrelated theoretical contributions to the literature on digital transformation, SME development, and macroeconomic growth, and it does so by extending the RBV beyond its conventional firm-level focus. First, by linking SME e-commerce growth, multi-dimensional digitalization indicators, and digital infrastructure readiness to regional GDP growth in China using a dynamic panel System GMM framework, the study fills the macro-level empirical gap highlighted in the introduction: most prior work has either remained at the firm level (e.g., Ali et al., 2018; Pérez et al., 2021; Angeles, 2022; Amouei et al., 2023) or examined the digital economy in aggregate without unpacking the SME-driven mechanisms. The robust effects of SDL, SCE, TEG, PEC, and DIR on GDP growth demonstrate empirically that the digital resources and capabilities documented at the firm level in earlier RBV studies do, in fact, scale up to measurable macroeconomic outcomes. In contrast to descriptive or case-based narratives about China’s digital economy (e.g., Kong, 2025), this article provides a rigorously identified, province-level test of those mechanisms over a decade.
Second, the study advances RBV by explicitly theorizing and empirically validating digital infrastructure readiness as a contextual, moderating capability rather than only a direct production factor. Prior digital infrastructure work, such as Yang et al. (2024) on urban digital construction and growth or other regional digital economy studies, shows that infrastructure correlates positively with GDP but largely treats it as a direct driver. In this study, DIR not only has a strong direct effect on regional growth but also significantly amplifies the returns to EGR, SDL, MPP, DMS, TEG, and the platform economy’s share of GDP (PEC). Conceptually, this recasts DIR within RBV as a higher-order, territorially embedded capability that conditions how VRIN digital resources at the firm level translate into macro-level performance. The evidence that the marginal impact of EGR and DMS on growth is markedly higher under high DIR directly operationalizes RBV’s long-standing claim that resource value is context-dependent, while showing that “context” can be measured as a meso-level digital infrastructure system rather than just industry or institutional environment.
Third, the study contributes to the digitalization and SME literature by replacing the prevalent single-index view of the “digital economy” with a multi-dimensional, RBV-consistent bundle of digital resources and capabilities. Earlier work on SMEs and e-commerce typically focused either on adoption and performance at the firm level (e.g., Stockdale & Standing, 2006; Githui & Njuru, 2024; Binh et al., 2022; Ansu-Mensah et al., 2021; Ng et al., 2019; Philbin et al., 2022), or used broad digital economy indices at the country/province level without disentangling specific mechanisms. By simultaneously modeling EGR, SDL, SCE, MPP, CBG, DMS, TEG, and PEC, the study shows that these “digital resources” do not contribute symmetrically to growth. SDL, SCE, TEG, PEC, and DIR emerge as systematically strong drivers, whereas CBG and DMS show more fragile or conditional effects. Theoretically, this nuances the often implicit assumption in the literature that “more digitalization” is universally beneficial; instead, the results support an RBV-consistent view in which specific digital capabilities, particularly those that deepen SME productivity and ecosystem-wide platform linkages, matter far more for macroeconomic performance than generic digital spending.
Fourth, the study deepens the integration between RBV and the burgeoning literature on digital payments, internet finance, and macroeconomic growth. Prior studies have documented positive associations between digital payments and GDP at the country level (e.g., Kahveci, 2025). However, most of these treat digital payments as a macro-financial variable, without embedding them in a broader resource-capability framework or connecting them to SME transformation. In contrast, this study conceptualizes MPP as an enabling resource within RBV and demonstrates that: (i) MPP has a positive and significant direct effect on GDP growth; and (ii) the effect is significantly stronger where DIR is high. This provides micro-founded theoretical support for the often-asserted, but rarely modeled, view that digital payments enhance growth by reducing transaction costs and enabling resource recombination among SMEs. It also clarifies a boundary condition: mobile payments do not mechanically generate growth; they do so when coupled with a complementary infrastructure backbone that allows these financial technologies to be deployed at scale. This result bridges RBV with financial inclusion and FinTech studies by showing that digital finance is best understood as part of a resource bundle comprising SME capabilities, platform ecosystems, and infrastructure.
Fifth, the evidence on the platform economy and tech-driven employment adds a meso- and ecosystem-level layer to RBV theorizing. Existing platform and digital economy work (e.g., K. Li, 2025; H. Li et al., 2025; Ryabukhin et al., 2025) has highlighted how platform ecosystems can boost innovation and sectoral productivity, but typically stops short of estimating how the share of GDP generated via platforms conditions regional growth trajectories, or how that effect varies with infrastructure. The strong direct effect of PEC, coupled with the positive PEC × DIR interaction, empirically supports the argument that platform ecosystems represent a form of collective, ecosystem-level capability that conforms to RBV logics (network effects, data scale, algorithmic learning) yet operates above the individual firm. The positive and persistent effect of TEG similarly demonstrates that the labor-market side of digital resources, skills, human capital, and tech employment should be treated as part of a region’s strategic asset portfolio. Together, these findings push RBV away from its traditional firm-centric ontology toward a multi-level RBV, where regions differ in their configurations of human, infrastructural, and platform-based resources, and those configurations systematically shape macroeconomic outcomes.
Finally, the study offers a corrective to overly optimistic or linear narratives around digitalization that are common in policy discourse and parts of the academic literature. While most hypothesized direct digital effects are confirmed, the weak and non-robust direct effect of digital marketing spend (H6), the absence of significant moderation for cross-border payments (H10e), and the only marginally significant moderating role of DIR on SCE, TEG and PEC challenge the assumption that every digital lever automatically translates into growth or that infrastructure uniformly strengthens all digital channels. Theoretically, this suggests that RBV-based models of digital transformation must pay more attention to which digital resources are actually VRIN in a given macro-context, and which are easily imitated, wasteful, or constrained by other bottlenecks. It also invites a more critical dialogue between RBV and institutional perspectives (Hentzen et al., 2021; D’Angelo, 2024), where government policy support, regional urbanization, and infrastructural investments shape not only resource endowments but also the productivity of those resources. In this sense, the article does not simply apply RBV to a new dataset; it re-specifies RBV for the digital age as a multi-level, context-sensitive theory of how SME resources, platform ecosystems, and digital infrastructure jointly underpin economic development.

6.2. Policy Implications

The empirical results convey a clear policy message: digital infrastructure readiness (DIR) is not merely a background condition but a strategic growth asset that amplifies the economic returns of SME e-commerce and digital transformation. The strong direct effect of DIR on GDP growth, together with its moderating role for e-commerce growth, SME digitalization, mobile payments, digital marketing, and platform-economy activity, suggests that infrastructure should be treated as a core macroeconomic policy lever rather than a purely technological concern.
In the Chinese context, these findings align closely with national initiatives such as the “Digital China” strategy and the New-Type Infrastructure program, which prioritize broadband expansion, nationwide 5G deployment, industrial internet platforms, and regional data centers. Our results indicate that the growth payoff of such investments is highest when infrastructure upgrades are sequenced with existing SME digital momentum. Rather than uniform, one-size-fits-all rollouts, policymakers should prioritize regions where SME digitalization and e-commerce activity are already advancing, as moving these regions into a high-DIR regime yields empirically higher marginal GDP gains.
At the SME level, the findings caution against policies that promote digital adoption in isolation. SME digital capability programs—such as training initiatives, subsidized access to major e-commerce platforms, and incentives for mobile payment adoption (e.g., Alipay and WeChat Pay)—are most effective when implemented alongside infrastructure upgrading. Without adequate DIR, such programs are unlikely to translate into meaningful macroeconomic benefits; with it, their impact is significantly amplified.
For provincial and municipal governments, the evidence argues against narrow “e-commerce promotion” campaigns and in favor of integrated regional digital transformation strategies. SME digitalization (SDL), supply-chain efficiency (SCE), mobile payment penetration (MPP), tech-driven employment growth (TEG), and platform-economy contribution (PEC) all exhibit robust links with GDP growth, whereas cross-border payments and digital marketing display more modest or conditional effects. This implies that subnational policy should focus on building coherent digital systems, for example, by linking SME incentives to the adoption of integrated order management, digital logistics, and mobile payment solutions rather than isolated online storefronts.
Finally, the consistently positive role of government policy support across alternative estimators underscores that policy design itself is a high-leverage instrument. Coordinated policy frameworks that combine targeted DIR investment, performance-linked SME digitalization incentives, and systematic monitoring of digital-economy indicators can help shift digital transformation from a rhetorical goal to a measurable and governable driver of sustainable economic growth.

6.3. Limitations

Apart from the notable contribution, this study has some limitations that need to be mentioned for the validity and applicability of the results. First, the study relies on secondary, province-level indicators to proxy SME digitalization, platform economy contribution, and digital infrastructure readiness. Although carefully constructed, these composite measures inevitably embed measurement error and cannot fully capture heterogeneity in the intensity or quality of digital transformation across firms. Second, the empirical setting is limited to Chinese provinces, characterized by a distinctive institutional architecture, state-led digital infrastructure investment, and platform ecosystem configuration. The external validity of the findings to other emerging or advanced economies is therefore constrained.
Third, the panel remains relatively short and aggregate, which restricts the ability to trace longer-run dynamic effects and to open the “black box” of firm-level adjustment, reallocation, and innovation mechanisms underlying the observed growth relationships. Lastly, the analysis focuses on aggregate GDP growth and does not examine distributional, environmental, or social outcomes. As such, it cannot speak to whether digitally enabled growth is inclusive, regionally balanced, or sustainable. A further limitation of this study concerns regional heterogeneity. Although the analysis exploits variation across 30 provincial-level regions in China, the estimated effects reflect average relationships and may mask meaningful differences between coastal and inland provinces, urban and rural areas, or regions at different stages of digital and economic development.
Future research could extend this study by conducting region-specific or cluster-based analyses and employing spatial econometric techniques to better capture regional digital divides and heterogeneous growth mechanisms. The use of finer-grained city-level or firm-level data, including matched firm–region datasets, would allow scholars to uncover the micro-level channels through which digital infrastructure and SME digitalization translate into macroeconomic outcomes. In addition, future work could examine longer-term impacts beyond GDP growth, such as productivity, inequality, and economic resilience, and undertake cross-country comparative analyses to assess whether similar infrastructure-contingent digital growth patterns emerge across different institutional and developmental contexts.

7. Conclusions

This study provides macro-level evidence on the economic consequences of SME-led digital transformation in China using a dynamic panel of 30 provinces over 2015–2024. Addressing RQ1a, the results show that SME digitalization, mobile payments, platform-economy activity, supply-chain efficiency, and tech-driven employment growth all contribute positively to regional GDP growth. Addressing RQ1b, the analysis demonstrates that digital infrastructure readiness not only directly promotes growth but also amplifies the economic returns to key digital channels—particularly e-commerce expansion, mobile payments, and digital marketing.

Author Contributions

Conceptualization, T.H.; methodology, S.M.; software, S.M.; validation, T.H. and R.R.; formal analysis, T.H.; data curation, T.H.; writing—original draft preparation, S.M. and R.R.; writing—review and editing, S.M.; visualization, R.R.; supervision, R.R.; project administration, R.R. All authors have read and agreed to the published version of the manuscript.

Funding

This research received no external funding.

Institutional Review Board Statement

Not applicable.

Informed Consent Statement

Not applicable.

Data Availability Statement

The original data presented in the study are openly available at: https://cfi.net.cn/ (accessed on 10 March 2025); https://100ec.cn/ (accessed on 10 March 2025); https://wap.miit.gov.cn/ (accessed on 16 May 2025); https://ir.sf-express.com/ (accessed on 19 June 2025); https://www.pbc.gov.cn/ (accessed on 19 June 2025); https://www.antgroup.com/ (accessed on 19 March 2025); https://www.tencent.com/en-us/ (accessed on 19 April 2025); https://data.worldbank.org/ (accessed on 19 June 2025); https://www.baidu.com/ (accessed on 19 June 2025); https://www.alibabagroup.com/ (accessed on 19 June 2025); https://www.stats.gov.cn/ (accessed on 29 April 2025); https://www.itu.int/en/Pages/default.aspx (accessed on 24 June 2025); https://networkreadinessindex.org/ (accessed on 29 August 2025).

Conflicts of Interest

The authors declare no conflict of interest.

References

  1. Ahmad, M. O., Wu, Q., & Ahmed, S. (2023). Does CSR digitalization improve the sustainable competitive performance of SMEs? Evidence from an emerging economy. Sustainability Accounting Management and Policy Journal, 15, 119–147. [Google Scholar] [CrossRef]
  2. Ali, Z., Bi, G., & Mehreen, A. (2018). Does supply chain finance improve SMEs performance? The moderating role of trade digitization. Business Process Management Journal, 26, 150–167. [Google Scholar] [CrossRef]
  3. Alshurideh, M. T., Kurdi, B. A., Shammout, E., & Al-Okaily, M. (2022). Impact of supply chain efficiency on economic growth at maritime industry in the UAE. International Journal of Theory of Organization and Practice (IJTOP), 2, 65–79. [Google Scholar] [CrossRef]
  4. Amouei, M. A., Valmohammadi, C., & Fathi, K. (2023). Proposing a conceptual model of the sustainable digital supply chain in manufacturing companies: A qualitative approach. Journal of Enterprise Information Management, 37, 544–579. [Google Scholar] [CrossRef]
  5. Angeles, I. (2022). The Moderating effect of digital and financial literacy on the digital financial services and financial behavior of MSMEs. Review of Economics and Finance, 20, 505–515. [Google Scholar] [CrossRef]
  6. Annunziata, M., & Bourgeois, H. (2018). The future of work: How G20 countries can leverage digital-industrial innovations into stronger highquality jobs growth. Economics, 12, 20180042. [Google Scholar] [CrossRef]
  7. Ansu-Mensah, P., Kwakwa, P. A., & Maku, S. N. T. (2021). Determinants of the business performance of small and medium enterprises in an emerging market economy. International Journal of Management Knowledge and Learning, 10, 219–233. [Google Scholar] [CrossRef]
  8. Arellano, M., & Bond, S. (1991). Some tests of specification for panel data: Monte Carlo evidence and an application to employment equations. The Review of Economic Studies, 58, 277–297. [Google Scholar] [CrossRef]
  9. Arellano, M., & Bover, O. (1995). Another look at the instrumental variable estimation of error-components models. Journal of Econometrics, 68, 29–51. [Google Scholar] [CrossRef]
  10. Awonuga, K. F., Nwankwo, E. E., Oladapo, J. O., Okoye, C. C., Odunaiya, O. G., & Scholastica, U. C. (2024). Driving sustainable growth in SME manufacturing: The role of digital transformation, project, and capture management. International Journal of Science and Research Archive, 11, 2012–2021. [Google Scholar] [CrossRef]
  11. Barney, J. (1991). Firm resources and sustained competitive advantage. Journal of Management, 17, 99–120. [Google Scholar] [CrossRef]
  12. Binh, D. T., Duong, V. H., Nguyen, D. X., Nguyen, C. H., & Nguyen, D. H. P. (2022). The impact of e-commerce on the performance of firms in Vietnam. International Journal of Electronic Commerce Studies, 13, 163. [Google Scholar] [CrossRef]
  13. Bińczak, T., Kaczmarek, F., & Rybacki, J. (2018). Determinants of e-commerce turnover in Europe: Consumer protection matters. Gospodarka Narodowa, 295, 125–141. [Google Scholar] [CrossRef]
  14. Blundell, R., & Bond, S. (1998). Initial conditions and moment restrictions in dynamic panel data models. Journal of Econometrics, 87, 115–143. [Google Scholar] [CrossRef]
  15. Budiarto, D. S., Diansari, R. E., Afriany, A. N., Nusron, L. A., & Seta, V. E. (2022). Which is more important, digital marketing or payment gateway? Research on SMEs business performance. In 1st UPY international conference on education and social science (UPINCESS 2022) (pp. 47–53). Atlantis Press. [Google Scholar]
  16. Chi, J. (2015). Transport infrastructure and macroeconomic performance in european countries. Transportation Research Record Journal of the Transportation Research Board, 2530, 84–92. [Google Scholar] [CrossRef]
  17. Cohen, J. (2021). Exploring the structural conditions shaping business-to-consumer electronic commerce. In Proceedings of the 54th Hawaii international conference on system sciences. University of Hawaii at Manoa. [Google Scholar]
  18. D’Angelo, S. (2024). Digital skills mobilization within incumbent organizations: The agentic role of digital champions. British Journal of Management, 35, 594–612. [Google Scholar] [CrossRef]
  19. Dissanayake, C. A. K., Jayathilake, W. M. N. K., Wickramasuriya, H. V. A., Dissanayeke, U., Kopiyawattage, K. P. P., & Wasala, W. M. C. B. (2022). Theories and models of technology adoption in agricultural sector. Human Behavior and Emerging Technologies, 2022, 9258317. [Google Scholar] [CrossRef]
  20. Doroiman, M. M., & Sîrghi, N. (2025). The impact of digitalization on EU competitiveness and economic growth: An econometric perspective. Timisoara Journal of Economics and Business, 18, 113–126. [Google Scholar] [CrossRef]
  21. Ebong, J., & George, B. (2021). Financial inclusion through digital financial services (DFS): A study in Uganda. Journal of Risk and Financial Management, 14, 393. [Google Scholar] [CrossRef]
  22. Eyieyien, O. G., Adebayo, V. I., Ikevuje, A. H., & Anaba, D. C. (2024). Conceptual foundations of tech-driven logistics and supply chain management for economic competitiveness in the United Kingdom. International Journal of Management & Entrepreneurship Research, 6, 2292–2313. [Google Scholar] [CrossRef]
  23. Eyo-Udo, N. L., Agho, M. O., Onukwulu, E. C., Sule, A. K., & Azubuike, C. O. (2025). Advances in blockchain solutions for secure and efficient cross-border payment systems. International Journal of Research and Innovation in Applied Science, IX, 536–563. [Google Scholar] [CrossRef]
  24. Forgor, A. T., & Julie, K. A. (2020). Financing innovative development in sub-saharan Africa: The role of payment systems. In International conference on arts, humanity and economics, management (ICAHEM 2019). Atlantis Press. [Google Scholar]
  25. Gai, M. F., Kope, M. H. K., Seto, C. M., & Dima, E. T. Y. (2025). Kontribusi ekonomi digital terhadap pertumbuhan ekonomi dan penciptaan lapangan kerja di Indonesia. Scientific Journal of Reflection Economic Accounting Management and Business, 8, 981–987. [Google Scholar] [CrossRef]
  26. Githui, F. K., & Njuru, J. W. (2024). Impact of e-commerce as a business tactic on sales growth of SMEs in Nairobi. International Journal of Science and Business, 34, 108–116. [Google Scholar] [CrossRef]
  27. Gordon, B. R., Jerath, K., Katona, Z., Narayanan, S., Shin, J., & Wilbur, K. C. (2019). Inefficiencies in digital advertising markets. Journal of Marketing, 85(1), 7–25. [Google Scholar] [CrossRef]
  28. Hantao, W. (2024). Regulation of the platform: Maintaining the balance between competition and innovation. International Journal of Frontiers in Sociology, 6, 71–78. [Google Scholar] [CrossRef]
  29. Heliyani, H., Tasri, E. S., Amelia, D., & Dwianda, Y. (2023). The contribution of e-commerce to economic growth in the COVID-19 era. Economics Development Analysis Journal, 12, 129–140. [Google Scholar] [CrossRef]
  30. Hentzen, J. K., Hoffmann, A. O. I., & Dolan, R. (2021). Which consumers are more likely to adopt a retirement app and how does it explain mobile technology-enabled retirement engagement? International Journal of Consumer Studies, 46, 368–390. [Google Scholar] [CrossRef]
  31. Kadárová, J., Lachvajderová, L., & Sukopová, D. (2023). Impact of digitalization on sme performance of the EU27: Panel data analysis. Sustainability, 15, 9973. [Google Scholar] [CrossRef]
  32. Kahveci, E. (2025). Digital transformation in SMEs: Enablers, interconnections, and a framework for sustainable competitive advantage. Administrative Sciences, 15(3), 107. [Google Scholar] [CrossRef]
  33. Kahveci, E., & Gurgur, T. (2025). Digital payments and sustainable economic growth: Transmission mechanisms and evidence from an emerging economy, Turkey. Journal of Theoretical and Applied Electronic Commerce Research, 20(2), 142. [Google Scholar] [CrossRef]
  34. Kong, R. W. M. (2025). Innovative technology strategy in Hong Kong and China of the Asia industries. International Journal of Social Science and Humanities Research, 13(3), 103–116. [Google Scholar] [CrossRef]
  35. Li, H., Malim, N. A. K., Du, X., & Zaijuan, X. (2025). Interaction effects of digital platforms and technological innovation on China’s economic growth: Panel data evidence (2013–2023). International Journal of Empirical Economics, 5, 1. [Google Scholar] [CrossRef]
  36. Li, K. (2025). Analysis of the economic effects of digital platforms. Communications in Humanities Research, 67, 77–82. [Google Scholar] [CrossRef]
  37. Li, Y., & Wang, C. (2021). Effect of customer’s perception on service robot acceptance. International Journal of Consumer Studies, 46, 1241–1261. [Google Scholar] [CrossRef]
  38. Liu, T. L., Naveed, M. M., Mustafa, S., & Naveed, M. T. (2024). Analysing the impact of digital technology diffusion on the efficiency and convergence process of the commercial banking industry of Pakistan. Humanities and Social Sciences Communications, 11, 792. [Google Scholar] [CrossRef]
  39. Mcalister, L., Srinivasan, R., Jindal, N., & Cannella, A. A. (2016). Advertising effectiveness: The moderating effect of firm strategy. Journal of Marketing Research, 53, 207–224. [Google Scholar] [CrossRef]
  40. Mishra, K., Singh, C., Mishra, S., & Soni, K. (2024). Enhancing tourism experiences through efficient logistics and supply chain practices. Shodhkosh: Journal of Visual and Performing Arts, 5(5). Available online: https://elibrary.ru/item.asp?id=80984299 (accessed on 24 June 2025). [CrossRef]
  41. Mishrif, A., Antimiani, A., & Khan, A. I. (2024). Examining the contribution of logistics and supply chain in boosting Oman’s trade network. Economies, 12, 70. [Google Scholar] [CrossRef]
  42. Molinari, B., & Turino, F. (2009). Advertising and business cycle fluctuations. SSRN Electronic Journal. [Google Scholar] [CrossRef][Green Version]
  43. Mushtaq, N., Hussain, F., Dad, A., Rehman, S. U., & Waseem, M. (2024). Digital transformation and its impact on business performance in SMEs of Pakistan: An empirical study. Abbdm, 3, 103–114. [Google Scholar] [CrossRef]
  44. Mustafa, S., Zhang, W., & Naveed, M. M. (2024a). How to mend the dormant user in Q&A communities? A social cognitive theory-based study of consistent geeks of StackOverflow. Behaviour & Information Technology, 43, 2024–2043. [Google Scholar]
  45. Mustafa, S., Zhang, W., Naveed, M. M., & Adan, D. E. (2024b). Using social cognitive theory to reengage dormant users in question and answer communities: A case study of active StackOverflow participants. Electronic Commerce Research and Applications, 68, 101450. [Google Scholar] [CrossRef]
  46. Naveed, M. M., Liu, T., Mustafa, S., & Chen, X. (2025). Unraveling the nexus between competition and banking efficiency in an emerging economy: A two-stage stochastic frontier analysis framework. Systems, 13, 354. [Google Scholar] [CrossRef]
  47. Negrish, F. A., & Almomani, M. (2024). The impact of digital transformation on sustainable development in SME’S (The case of Jordan). International Journal of Academic Research in Economics and Management Sciences, 13, 143–153. [Google Scholar] [CrossRef]
  48. Ng, H. S., Kee, D. M. H., & Ramayah, T. (2019). Examining the mediating role of innovativeness in the link between core competencies and SME performance. Journal of Small Business and Enterprise Development, 27, 103–129. [Google Scholar] [CrossRef]
  49. Okore, O. A., Nwadiubu, A. O., & Okolie, D. O. (2023). Effect of electronic payment on the Nigerian economy. International Journal of Social Sciences and Management Research, 9, 62–72. [Google Scholar] [CrossRef]
  50. Pérez, J. E. A., Veléz-Ocampo, J., & Cepeda-Cardona, J. (2021). Strategic orientation toward digitalization to improve innovation capability: Why knowledge acquisition and exploitation through external embeddedness matter. Journal of Knowledge Management, 25, 1319–1335. [Google Scholar] [CrossRef]
  51. Philbin, S. P., Viswanathan, R., & Telukdarie, A. (2022). Understanding how digital transformation can enable SMEs to achieve sustainable development: A systematic literature review. Small Business International Review, 6, e473. [Google Scholar] [CrossRef]
  52. Prayitno, E., Tarigan, N. L. L., Mauidzoh, U., & Sukmawaty, W. E. P. (2024). The revival of SMEs in Indonesia from the impact of the COVID-19 pandemic. Journal of the Community Development in Asia, 7, 99–114. [Google Scholar] [CrossRef]
  53. Raj, P. A. (2025). The impact of mobile payment adoption on consumer spending habits. Interantional Journal of Scientific Research in Engineering and Management, 9, 1–9. [Google Scholar] [CrossRef]
  54. Risky, M., Hidayat, A., Liliana, L., Gustriani, G., & Shodrokova, X. (2025). The development of fintech payment and fintech lending in influencing economic growth in developing countries: Panel data evidence. Apuntes Del Cenes, 44, 43–71. [Google Scholar] [CrossRef]
  55. Ryabukhin, S. N., Kokorev, I. A., Safronova, A., Pokrovskaya, O., & Fomenko, N. M. (2025). The main trends and prospects of the platform economy in the russian federation. The World of New Economy, 19, 134–148. [Google Scholar] [CrossRef]
  56. Safarli, A. (2025). The fourth industrial revolution and its impact on the labor market. Journal of Economic Growth and Social Welfare, 2, 102–113. [Google Scholar] [CrossRef]
  57. Sertić, M. B., Barčić, A. P., & Klarić, K. (2017). Economic determinants and analysis of the European Union wood industry SMEs employment. Bioresources, 13, 522–534. [Google Scholar]
  58. Singh, N., Sinha, N., & Liébana-Cabanillas, F. (2020). Determining factors in the adoption and recommendation of mobile wallet services in India: Analysis of the effect of innovativeness, stress to use and ease of use. International Journal of Information Management, 50, 191–205. [Google Scholar] [CrossRef]
  59. Sinha, D. (2020). Efficiency and performance of global supply chain: Theory and evidence. Foreign Trade Review, 55, 447–449. [Google Scholar] [CrossRef]
  60. Stockdale, R., & Standing, S. (2006). A classification model to support SME e-commerce adoption initiatives. Journal of Small Business and Enterprise Development, 13, 381–394. [Google Scholar] [CrossRef]
  61. Susanto, P., Hoque, M. E., Shah, N. U., Candra, A. H., Nik Mohd Hazrul Nik, H., & Abdullah, N. L. (2021). Entrepreneurial orientation and performance of SMEs: The roles of marketing capabilities and social media usage. Journal of Entrepreneurship in Emerging Economies, 15, 379–403. [Google Scholar] [CrossRef]
  62. Talom, F. S. G., & Tengeh, R. K. (2019). The impact of mobile money on the financial performance of the SMEs in Douala, Cameroon. Sustainability, 12, 183. [Google Scholar] [CrossRef]
  63. Tulong, M. P., Pangandaheng, R., Tataung, J. C., Manobi, N. C. G., Rumbajan, S. M. S., & Nongko, L. A. (2024). The influence of e-commerce technology implementation on business development in the digital era. Jurnal Syntax Admiration, 5, 5092–5098. [Google Scholar] [CrossRef]
  64. Xu, L. (2025). The impact of cross-border digital payment development on China’s trade efficiency. Advances in Economics Management and Political Sciences, 233, 75–82. [Google Scholar] [CrossRef]
  65. Yang, W., Zhu, C., & Yang, Y. (2024). Does urban digital construction promote economic growth? Evidence from China. Economies, 12, 59. [Google Scholar] [CrossRef]
  66. Zhi, C., Huang, S., & Cheng, Z. Y. (2024). Navigating economic uncertainties: The role of technological innovations in enhancing supply chain resilience. Advances in Economics Management and Political Sciences, 112, 126–131. [Google Scholar] [CrossRef]
Figure 1. Conceptual Framework.
Economies 14 00040 g001
Figure 2. Simple slope plot for the moderating effect of DIR on the relationship between EGR and GDP Growth.
Economies 14 00040 g002
Figure 3. Simple slope plot for the moderating effect of DIR on the relationship between DMS and GDP Growth.
Economies 14 00040 g003
Table 1. Data Source Availability Table.
VariablePrimary Data SourcesLinks
E-Commerce Growth Rate (EGR)China Internet Network Information Center (CNNIC), China E-Commerce Research Centerhttps://cfi.net.cn/ (accessed on 10 March 2025), https://100ec.cn/ (accessed on 10 March 2025)
SME Digitalization Level (SDL)Ministry of Industry and Information Technology (MIIT), China SME Development Indexhttps://wap.miit.gov.cn/ (accessed on 16 May 2025)
Supply Chain Efficiency (SCE)Cainiao Logistics Reports, SF Expresshttps://ir.sf-express.com/ (accessed on 19 June 2025)
Mobile Payment Penetration (MPP)People’s Bank of China (PBOC), Ant Group, Tencenthttps://www.pbc.gov.cn/ (accessed on 19 June 2025), https://www.antgroup.com/ (accessed on 19 March 2025), https://www.tencent.com/en-us/ (accessed on 19 April 2025)
Cross-Border Payment Growth (CBG)SWIFT, World Bank Global Payment Systemshttps://data.worldbank.org/ (accessed on 19 June 2025)
Digital Marketing Spend (DMS)Baidu, Alibaba, Tencenthttps://www.baidu.com/ (accessed on 19 June 2025), https://www.alibabagroup.com/ (accessed on 19 June 2025), https://www.tencent.com/en-us/ (accessed on 19 April 2025)
Tech-Driven Employment Growth (TEG)National Bureau of Statistics (NBS), MIIThttps://www.stats.gov.cn/ (accessed on 29 April 2025), https://wap.miit.gov.cn/ (accessed on 16 May 2025)
Platform Economy Contribution to GDP (PEC)National Bureau of Statistics (NBS), China Digital Economy Reportshttps://www.stats.gov.cn/ (accessed on 29 April 2025)
Digital Infrastructure Readiness (DIR)International Telecommunication Union (ITU), World Economic Forum (Network Readiness Index)https://www.itu.int/en/Pages/default.aspx (accessed on 24 June 2025), https://networkreadinessindex.org/ (accessed on 29 August 2025)
Firm Size, Industry Type, Urbanization, Gov. PolicyNBS, World Bank Development Indicators, China Statistical Yearbookhttps://www.stats.gov.cn/ (accessed on 29 April 2025), https://data.worldbank.org/ (accessed on 19 June 2025)
Table 2. Descriptive Statistics.
Variable (Unit)MeanSDMinMax
GDP Growth Rate (%)8.302.093.6913.32
E-Commerce Growth Rate (%)16.617.06−4.6840.56
SME Digitalization Level (%)53.9318.124.2298.03
Supply Chain Efficiency (Index)58.199.6537.0384.17
Mobile Payment Penetration (%)42.9717.0610.7186.56
Cross-border Payment Growth (%)10.105.21−5.1026.22
Digital Marketing Spend (million CNY)189.3265.5339.01360.33
Tech-driven Employment Growth (%)5.672.46−1.8011.94
PEC (%)4.381.820.468.85
Digital Infrastructure Readiness (Index)63.4112.6630.39100.00
Average Firm Size (employees)119.7544.079.81217.43
Government Policy Support (Index)52.2215.1617.1596.26
Urbanization Level (%)68.3610.3040.8394.91
Note: EGR = annual growth rate of SME e-commerce sales; SDL = % of SMEs using digital tools; SCE = supply chain efficiency index (higher = faster, cost-effective logistics); MPP = % of B2B transactions via mobile payments; CBG = % growth in cross-border digital payments; DMS = annual spending on digital advertising (in million CNY); TEG = % growth in tech-related employment; PEC = % of GDP from platform economy activities; DIR = composite infrastructure readiness index (0–100); FS = average firm size; GP = policy support index (higher = more supportive); UL = % population urbanized.
Table 3. Pairwise Correlation Matrix.
VariableGDP_GrowthEGRSDLSCEMPPCBGDMSTEGPECDIRFSGPUL
GDP growth rate1.00
EGR−0.21 ***1.00
SDL0.84 ***−0.25 ***1.00
SCE0.63 ***−0.090.38 ***1.00
MPP0.37 ***−0.12 *0.57 ***0.29 ***1.00
CBG0.13 *0.030.080.100.041.00
DMS0.28 ***−0.060.18 **0.080.12 *0.061.00
TEG0.41 ***−0.22 ***0.47 ***0.33 ***0.18 **0.010.071.00
PEC0.68 ***−0.30 ***0.73 ***0.47 ***0.45 ***0.010.19 ***0.52 ***1.00
DIR0.45 ***−0.15 **0.52 ***0.29 ***0.50 ***0.060.100.33 ***0.54 ***1.00
FS (firm size)0.06−0.17 **0.23 ***−0.020.20 ***−0.09−0.030.11 *0.030.051.00
GP (policy support)0.34 ***−0.030.27 ***0.16 **0.18 **0.080.080.30 ***0.26 ***0.11 *−0.011.00
UL (urbanization)0.59 ***−0.080.50 ***0.37 ***0.39 ***0.040.090.24 ***0.33 ***0.50 ***0.040.28 ***1.00
Note: N = 300 region-year observations. Coefficients are Pearson correlation. ***, **, * indicate significance of the correlation at (*** p < 0.01, ** p < 0.05, * p < 0.1), respectively (two-tailed test). A lower triangular matrix is shown. Key moderate-to-high correlations (|r| > 0.5) include SDL with PEC (0.73) and SDL with GDP_growth (0.84), indicating strong alignment of SME digitalization with both platform economy size and economic growth. Negative correlations reflect inverse relationships, e.g., EGR vs. SDL.
Table 4. System GMM results.
VariableModel 1Model 2Model 3
Direct Effects
Lag GDP Growth (t − 1)0.150 ** (0.075)0.120 ** (0.060)0.100 * (0.050)
EGR0.037 *** (0.012)0.020 ** (0.010)0.018 ** (0.009)
SDL0.032 *** (0.011)0.030 *** (0.010)0.028 *** (0.009)
SCE0.031 *** (0.010)0.025 *** (0.008)0.022 ** (0.011)
MPP0.013 *** (0.004)0.012 ** (0.006)0.010 ** (0.005)
CBG0.015 *** (0.005)0.018 * (0.009)0.016 (0.008)
DMS0.003 *** (0.001)0.001 (0.001)0.001 (0.001)
TEG0.022 *** (0.007)0.060 *** (0.020)0.055 ** (0.028)
PEC0.054 *** (0.018)0.100 ** (0.050)0.090 *** (0.030)
DIR0.043 *** (0.014)0.040 *** (0.013)0.038 *** (0.013)
Moderating Effects
EGR × DIR3.0 × 10−4 ** (1.0 × 10⁻⁴)3.0 × 10−4 * (1.0 × 10−4)
SDL × DIR2.0 × 10−4 * (1.0 × 10−4)2.0 × 10−4 * (1.0 × 10−4)
SCE × DIR1.0 × 10−4 * (1.0 × 10−4)0.0 × 100 (1.0 × 10⁻⁴)
MPP × DIR2.0 × 10−4 * (1.0 × 10−4)2.0 × 10⁻⁴ ** (1.0 × 10⁻⁴)
CBG × DIR0.0 × 100 (1.0 × 10⁻⁴)0.0 × 100 (1.0 × 10⁻⁴)
DMS × DIR2.0 × 10−4 *** (1.0 × 10⁻⁴)2.0 × 10⁻⁴ *** (1.0 × 10⁻⁴)
TEG × DIR3.0 × 10−4 * (1.0 × 10−4)3.0 × 10−4 * (1.0 × 10−4)
PEC × DIR1.0 × 10−3 * (1.0 × 10−4)1.0 × 10−3 * (1.0 × 10−4)
Control Variables
Firm Size (FS)−0.005 (0.003)
Government Policy Support (GP)0.008 ** (0.004)
Urbanization Level (UL)0.012 (0.006)
Diagnostics
Observations270270270
Number of groups (regions)303030
Number of instruments182630
Year dummiesYesYesYes
AR(1) p-value>0.001>0.0010.001
AR(2) p-value0.2030.250.301
Hansen test p-value0.3020.40.501
Sargan test p-value0.150.2140.253
Notes: Dependent variable is regional GDP growth rate (annual %). Estimation by two-step System GMM (robust standard errors in parentheses). All models include year fixed effects; Models 2–3 include interaction terms for DIR with each listed independent variable. Model 3 adds control variables (FS, GP, UL) and industry-type fixed effects (included but coefficients not reported for brevity). Significance levels: *** p < 0.01, ** p < 0.05, * p < 0.1. The raw panel is 30 provinces over 2015–2024 (300 province–year observations). Because the dynamic specification uses lagged GDP growth and some covariates, the estimation window effectively runs from 2016 to 2024, yielding 270 observations. The panel remains balanced. Under robust two-step GMM, Hansen is the relevant test, and Sargan is shown only for completeness.
Table 5. Robustness checks—OLS, Fixed-Effects, and Random-Effects estimates.
VariableOLS (Robust)FE (Clustered)RE (Clustered)
EGR0.030 ** (0.015)0.010 (0.007)0.020 * (0.013)
SDL0.030 *** (0.010)0.020 *** (0.007)0.025 *** (0.008)
SCE0.030 *** (0.010)0.020 ** (0.010)0.028 *** (0.009)
MPP0.012 *** (0.004)0.005 (0.003)0.010 *** (0.003)
CBG0.015 *** (0.005)0.007 (0.004)0.012 ** (0.005)
DMS0.002 ** (0.001)0.001 (0.001)0.002 * (0.001)
TEG0.020 *** (0.006)0.008 * (0.004)0.015 ** (0.005)
PEC0.050 *** (0.012)0.030 *** (0.009)0.045 *** (0.010)
DIR0.040 *** (0.013)0.020 ** (0.010)0.035 *** (0.011)
Firm Size−0.002 (0.004)−0.001 (0.003)−0.002 (0.003)
Government Policy Support0.008 ** (0.003)0.006 ** (0.003)0.007 ** (0.003)
Urbanization Level0.010 ** (0.005)0.005 (0.004)0.009 ** (0.004)
Year DummiesYesYesYes
Observations 300300300
Number of groups-3030
R20.890.73 (within)0.85
Notes: Dependent variable = GDP growth rate (%). OLS = pooled OLS with robust SE; FE = fixed effects (within) estimator with region FE and clustered SE; RE = random effects GLS with clustered SE. All models include year dummies. Significance: *** p < 0.01, ** p < 0.05, * p < 0.1.
Disclaimer/Publisher’s Note: The statements, opinions and data contained in all publications are solely those of the individual author(s) and contributor(s) and not of MDPI and/or the editor(s). MDPI and/or the editor(s) disclaim responsibility for any injury to people or property resulting from any ideas, methods, instructions or products referred to in the content.