Abstract
This study seeks to identify the factors driving household food insecurity in Cameroon during the COVID-19 pandemic, examine the effects of coping strategies on household resilience, and explore complementarities among these strategies. We used data from the COVID-19 panel surveys conducted by the National Institute of Statistics of Cameroon. Three models are estimated: an ordered logit model for food insecurity factors, a logit model for the impact of coping strategies, and a multivariate probit model for complementarities. The findings reveal that food insecurity is exacerbated by conflict, socio economic shocks (e.g., loss of employment, crop theft), and price hikes. About 28.59% of households are resilient, mainly due to past savings, cash transfers, free food, and in-kind transfers. The study emphasizes the importance of social and governmental support to mitigate food insecurity during crises, and underscores the need for monitoring socio-economic conditions during pandemics and other crises.
1. Introduction
In March 2020, the World Health Organization declared COVID-19 a pandemic, prompting public health measures that led to social and economic disruptions (Onyeaka et al., 2021). Food supply chains were affected by containment and social distancing policies, hindering the movement of farmers, agricultural inputs, and food products (Banque Mondiale, 2021). Sub-Saharan African countries, reliant on food imports, were especially vulnerable due to trade restrictions. Global food insecurity alerts arose from food shortages, price hikes, and income loss tied to rising unemployment. The World Food Programme projected that 265 million people would face acute food insecurity, doubling pre-pandemic levels (WFP et al., 2020).
The COVID-19 pandemic caused financial and health shocks, reducing household welfare due to business closures and government containment measures like isolation and travel restrictions. These efforts, including quarantines and facility closures, had serious socio-economic impacts, especially on rural farmers in low- and middle-income countries (Ekwebelem et al., 2020). Mobility restrictions limited access to food from daily markets and vendors, while job losses in formal and informal sectors worsened food insecurity (Kansiime et al., 2021). This exacerbated unemployment, poverty, transportation issues, and chronic malnutrition, further harming vulnerable households’ health.
The Cameroonian government implemented several COVID-19-preventive steps as early as 18 March 2020, 12 days after discovering its first COVID-19-positive patient (OMS-Cameroun, 2020). At first, food security was a problem for households in Cameroon (Tambe et al., 2021). The percentage of people experiencing food insecurity increased from 12.8% in 2019 to 20.4% in 2020. The regions most impacted by food insecurity are the North-West (40.0%), South-West (30.7%), Littoral (25.1%), Far Nord (24.8%), Adamaoua (22.1%), and West (20.5%), all of which are grappling with distinct humanitarian crises. Severe food insecurity affects nearly 5% of people in the North-West (4.4%), South-West (6.9%), and Far-North (5.4%) regions (MINADER/PAM/FAO, 2020). While the reduction in purchasing power, loss of livelihoods and earning possibilities, and restricted access to food and essential services persisted in 2022, food insecurity deepened in 2021. Recently, the conflict between Russia and Ukraine has made matters worse by having a detrimental effect on the cost of food, energy (gas and oil), and fertilizer.
Considering how crucial food is for human survival, food insecurity is a serious problem that cannot be ignored. The impact of the COVID-19 pandemic on food insecurity in Cameroon has not been thoroughly studied empirically. Tambe et al. (2021) evaluated the food security and diversity of diets of adult Cameroonians during the COVID-19 pandemic using an online survey. According to their findings, over 50% of the participants mostly ate fats and oils, cereals, vegetables, roots, and tubers. The average dietary diversity in the nation appears to be poor, and food insecurity is widespread. The COVID-19 pandemic’s transmission routes and their effects on food security in Cameroonian urban families were discussed and examined by Mvodo (2021). According to Mvodo’s empirical findings, there are three primary ways in which the COVID-19 epidemic causes inadequate access to food, namely, restrictions on food imports, a slowdown in the country’s economic activity, and a loss of foreign funding. Using a telephone survey, Foka-Nkwenti et al. (2020) investigated the relationship between COVID-19 and declining food prices, which have resulted in food insecurity in Cameroon. Their findings demonstrate how serious tensions and food shortages were brought about in Cameroon as the coronavirus outbreak spread through interruptions to the country’s food supply networks, as well as the loss of revenue and remittances.
Suh et al. (2023) found that rural male-headed families were substantially more vulnerable to food insecurity than their semi-urban female-headed counterparts when examining the connection between food security and coping methods in Cameroon during the COVID-19 period. Furthermore, their analysis revealed that, in comparison to male-headed and semi-urban homes, female-headed and semi-urban households reported a positive and statistically significant correlation with coping techniques, with cheaper and less popular food consumption being the most common coping mechanism.
Prior research on food insecurity in Cameroon exhibits three major limitations. First, previous studies (Tambe et al., 2021; Mvodo, 2021) rely on cross-sectional data, preventing a dynamic understanding of temporal effects, particularly during COVID-19. Second, the samples used (Foka-Nkwenti et al., 2020), often restricted to online surveys or urban areas, exclude rural households and regions without internet access, thereby skewing national representativeness. Third, analyses of adaptation strategies remain fragmented; no Cameroonian study has simultaneously explored the determinants of food insecurity, the efficacy of adaptation strategies, and their synergies (Suh et al., 2023), limiting policy recommendations.
Our study introduces four innovations. First, it provides a longitudinal analysis in Cameroon, tracking 2680 households across two critical phases of the pandemic, revealing delayed shock effects. Second, an integrated modeling approach combines an ordered logit (determinants of food insecurity), a binary logit (resilience), and a multivariate probit (interactions between adaptation strategies), offering a holistic perspective. Third, it synthesizes cumulative crises by integrating the combined impacts of COVID-19 and armed conflicts, an approach rarely adopted in African studies (Tabe-Ojong et al., 2023). Finally, representative data, including understudied areas such as conflict-affected Northwest regions and rural zones, ensure a balanced urban–rural analysis, addressing past methodological biases. These advancements better inform food security policies in a context of multidimensional crises.
Furthermore, the analysis of socio-economic characteristics influencing the adoption of these adaptation strategies provides critical insights for targeted and effective assistance. In summary, this study expands the food insecurity paradigm by incorporating the effects of pandemics and armed conflicts and by examining in detail the adaptation strategies deployed by households, governments, and civil society, as well as the socio economic characteristics governing their adoption. In a context marked by intertwined health, economic, and security crises, this study addresses the following question: what factors explain the worsening food insecurity among Cameroonian households during COVID-19, and how do adaptation strategies influence their resilience?
This study aimed to achieve the following:
- ✔
- Identify the factors driving household food insecurity in Cameroon during the COVID-19 pandemic;
- ✔
- Analyze the effects of adaptation strategies on household resilience to food insecurity;
- ✔
- Examine complementarities between adaptation strategies.
To achieve these objectives, we formulated three hypotheses:
Hypothesis 1 (H1):
Socio-economic shocks (armed conflicts, job losses, price surges) significantly exacerbated food insecurity among Cameroonian households during the pandemic.
This hypothesis is grounded in the conceptual framework of multidimensional crises (HLPE, 2017; Barrett, 2020) which posits that the interaction of simultaneous shocks creates critical threshold effects for food systems. In Cameroon, the convergence of armed conflicts in Anglophone regions and the COVID-19 pandemic suggests an intensification of vulnerabilities.
Hypothesis 2 (H2):
Individual adaptation strategies (prior savings) and institutional strategies (cash transfers) enhance household resilience to food insecurity.
Inspired by empirical evidence on crisis mitigation in fragile contexts (Tabe-Ojong et al., 2023), this hypothesis contrasts two resilience mechanisms: individual strategies (e.g., precautionary savings), of which the efficacy depends on initial precarity levels; and institutional interventions (e.g., targeted cash transfers), of which the impact is modulated by geographic coverage and deployment speed (Gentilini, 2022). We posit that institutional transfers may compensate for inequalities in access to savings, particularly for rural households excluded from formal financial systems.
Hypothesis 3 (H3):
Adaptation strategies are complementary (e.g., cash transfers + food aid).
This hypothesis extends the work of Suh et al. (2023) by empirically testing the complementarity paradigm in a heterogeneous national context. For instance, emergency food aid could neutralize short-term shock effects, while cash transfers support productive investments in the medium term.
2. Brief Review of the Literature
The literature identifies three pathways through which the COVID-19 pandemic has affected the economy: direct consumption decreases, financial system shocks, and supply side disruptions (Carlsson-Szlezak et al., 2020; Dandonougbo et al., 2021). These disruptions impacted food demand and supply, leading to increased food insecurity due to various factors such as lack of transportation and social support (HLPE, 2017; Barrett, 2020; Ozili, 2020). In Nigeria, food insecurity surged, with severe cases rising during the pandemic (Orjiakor et al., 2023). Indonesian households also experienced increased food insecurity in 2020–2021 (Amrullah et al., 2023). In Guatemala, income losses and reduced dietary diversity were observed due to the pandemic (Ceballos et al., 2020). Similarly, poor households in Kenya and Uganda were more vulnerable to income shocks and reduced food consumption (Kansiime et al., 2021).
COVID-19 led to job losses, reduced incomes, and hindered food production due to mobility restrictions and suspended agricultural activities (Mouloudj et al., 2020). The pandemic intensified food insecurity by disrupting food supply chains, livelihoods, and social protection programs, further reducing consumer confidence (HLPE, 2017). Various household characteristics, such as income, education, and household size, increased the risk of food insecurity during the pandemic (Ansah et al., 2019; Firoz et al., 2021). Livestock ownership helped cushion some households from falling into severe food insecurity (Balana et al., 2023).
Several studies also explored coping strategies during the pandemic. In Africa, households relied on government support, social networks, and foraging to mitigate food insecurity (Tabe-Ojong et al., 2022; Fung Uy et al., 2023). Despite limitations in data, the pandemic’s causal link to food insecurity is evident, with social protection programs in Ethiopia reducing the likelihood of food insecurity (Abay et al., 2023). However, research gaps remain, particularly regarding household food insecurity drivers, adaptation strategies, and coping mechanisms in Cameroon during the pandemic (Mvodo, 2021; Tambe et al., 2021; Foka-Nkwenti et al., 2020; Suh et al., 2023). This study aims to address these gaps and enhance the understanding of COVID-19-related food insecurity.
3. Methodology
This section presents the data, the theoretical framework, the specification of the econometric model, and the justification of the variables.
3.1. Data Source
The data were derived from the EPICOVID-19 (2021a, 2021b) panel surveys conducted by Cameroon’s National Institute of Statistics (INS) across two phases (February and June–July 2021). The initial sample of 2680 households was constructed using the Random Digit Dialling (RDD) method, covering the networks of major mobile operators (MTN, Orange, Viettel) and all regions of the country. Despite a 30.6% attrition rate between phases (1861 households remaining in Round 2), statistical adjustments (inverse probability weighting) were applied to mitigate potential non-response biases. The geographical representativeness and longitudinal structure of the data enable the analysis of temporal variations in food insecurity, including access to basic services, socio-economic shocks (job loss, income reduction), and household coping strategies.
The dataset includes key indicators for each wave: food security (availability, access, and dietary diversity), compliance with government health measures, and exposure to economic shocks. Comparisons between the two rounds provide a dynamic perspective critical for assessing the evolution of vulnerabilities during the pandemic. Stratified analyses by region and mobile operator accounted for infrastructural disparities (e.g., absence of Camtel respondents).
We used the data for two rounds for at least four reasons. The pandemic caused fluctuating socio-economic disruptions (confinements, reopenings, variations in food prices). Two rounds of data collection (February and June–July 2021) allowed us to capture the following: immediate effects (e.g., sudden job losses during the first confinement), medium-term adaptations (e.g., adoption of coping strategies such as in-kind transfers or savings). In addition, the second round identified households that have regained food security (“resilient”) or have fallen back into insecurity. This makes it possible to test the effectiveness of coping strategies. Inter-round comparisons provide information on the urgency of targeted interventions (e.g., increased support for conflict zones where insecurity has worsened).
3.2. Food Insecurity Index and Threshold Definition
The two conceptual steps necessary to create a multidimensional index are the identification of relevant dimensions to be included in the analysis and their aggregation (Sen, 1976, 1999). The construction of our multidimensional index draws inspiration from the Food Insecurity Experience Scale (FIES) developed by the FAO, which assesses food insecurity through eight standardized questions on household experiences (Ballard et al., 2013). These questions, identical to those in the FIES, capture key dimensions recognized internationally. Unlike the standard FIES (which typically uses scoring or Rasch models), we employed Multiple Correspondence Analysis (MCA) to aggregate the binary (‘yes/no’) responses to the eight questions (see Appendix A Table A1). MCA is the most appropriate method of multivariate analysis, as households answered yes or no to each of the above questions. The resulting indicator is a sub-index (index)1 with a form free of any unit of measurement. Normalization using the min-max method allowed for the index to be centered between the extreme values of the sample. The sub-index, thus normalized, lies between 0 and 1, and the rankings of all entities were made regarding the relative dispositions of the indicator within this range. Algebraically, the food insecurity index (INDEX) obtained by the min–max method is written as follows:
where represents the household () and the dimension of food insecurity (e.g., access, availability, stability).
To facilitate interpretation, we have defined four empirical thresholds in Table 1 below.

Table 1.
Empirical Thresholds for Food Insecurity Levels Based on Normalized Index Intervals.
These thresholds were selected to reflect progressive intensity levels, aligned with the observed distribution in our sample. The 30%, 60%, and 100% thresholds are not part of the standard FIES framework but provide a gradation tailored to the Cameroonian context and the distribution of our composite index. While the FIES supplied the foundational questions, our aggregation via MCA and normalized thresholds constituted an innovative adaptation to address the specificities of the EPICOVID-19 dataset.
3.3. Model Specifications
To achieve our three objectives, we mobilized three econometric models: an ordered logit model to identify food insecurity factors, a logit model to analyze the impact of coping strategies on household resilience to food insecurity, and a multivariate probit model to analyse the complementarities among coping strategies.
3.3.1. Random-Effects-Ordered Logit Model
Here, the focus was on methodological aspects, that is, the appropriateness of the ordered logit model for SRH, by comparing the results obtained using this method with those from the OLS model. SRH has often been measured as an ordinal variable. In this study, food insecurity was categorized into a 4-point scale: 1 = No food insecurity, 2 = Mild food insecurity, 3 = Moderate food insecurity, and 4 = Severe food insecurity. The analytical approach to handling this type of variable, however, is often logit regression (Min, 2013). The use of the binary logit regression model is inappropriate when the dependent variable has more than two categories and ordered outcomes is an appropriate way. Moreover, the independent variables include not only continuous variables (such as household size), but also categorical variables (socio-economic shocks). This study modeled the determinants of food insecurity by applying a discrete choice model approach, knowing that the EPICOVID-19 databases code the food security index into four categories (no food insecurity = 1, mild food insecurity = 2, moderate food insecurity = 3, severe food insecurity = 4). On the other hand, we employed panel data and, in this case, an ordered logit model with random effects seemed to be the most appropriate approach. The parameters of the random-effects-ordered logit model, as stated in Equation (2), were estimated using maximum likelihood:
for i = 1, …, n panels, where t = 1, …, ni, νi are independent and identically distributed , and κ is a set of cutpoints κ1, κ2 and k3, where K is the number of possible outcomes; is the vector of explanatory variables for household i at period t (e.g., internet access, socio-economic shocks); and H(·) is the logistic cumulative distribution function. Furthermore, xi is a column vector of explanatory variables, and β is a row vector of parameters to be estimated.
We express the model in terms of a latent linear response, where the observed ordinal responses yit are generated from the latent continuous responses, such that
The errors are distributed as logistic with mean zero and variance , and are independent of . For an ordered logit model with random effects, the marginal effects equation can be expressed as follows:
Using the chain derivation rule, we can write this as
where H′(⋅) is the derivative of the logistic distribution function concerning its argument and Kk is the categorization threshold.2
3.3.2. Binary Logit Model
To investigate the impact of coping strategies on household resilience to food insecurity, we used a binary Logit model. According to the European Union, resilience is the ability of an individual or household to resist, adapt to, and recover swiftly from shocks (Serfilippi & Ramnath, 2018). Resilience to food insecurity, therefore, refers to a household’s capacity to transition from food insecurity to food security or to maintain food security between two survey periods. Resilience to food insecurity (RFI) is the observed dependent variable and its latent counterpart is denoted by , which determines the probability Pi that a household i is resilient to food insecurity. The model is specified as follows:
where (a latent variable) is the logit index that determines the probability of (food insecurity) being observed.
The observed binary result is defined as follows:
Thus, if the household is resilient to food insecurity, i.e., if it remains food secure or moves from food insecurity to food security between two study periods. otherwise. The probability that household i is resilient is given by
with X being the vector of coping strategies, Z the household characteristics, and the error term. represents the intercept, and are the coefficients of coping strategies and household characteristics, respectively, that characterize the logit index (), and, more importantly, that are to be estimated to predict the probability of food insecurity depicted in (9). The coefficients were estimated by the MLE. After the estimation, the marginal effects of X and Z on the probability of resilience (Pi) can be computed using the general approach specified in Equation (6).
3.3.3. Multivariate Probit Model
Households reported adopting several types of strategies to deal with food insecurity. The utility that the household obtained by adopting one or another adaptation strategy is not observable. It does, however, depend on the household’s socio economic and demographic characteristics and socio-economic shocks , and can therefore be represented by the latent variable () as follows:
where is the latent utility of household to adapt strategy ; is the vector of socio economic characteristics of household (e.g., household size, sector of activity); is the vector of shocks experienced by household (e.g., job loss, crop or livestock theft); is the vector of parameters to be estimated; and is the error term specific to strategy s.
This study looked at four coping strategies: using past savings, borrowing, direct cash transfer, and free food. Households tend to adopt several coping strategies at the same time to deal with the food insecurity problem. Multivariate probit is an extension of the bivariate probit model that uses Monte Carlo simulation techniques to simultaneously estimate the system of multivariate probit regression equations (Greene, 2000). Simultaneous adoptions for the four adaptation strategies can be modeled by a system of four dichotomous adoption equations as follows:
The multivariate probit regression model was adopted to estimate the probability of the adoption of coping strategies (Equation (11)) to account for any correlation between the error terms of the different binary adoption equations (Greene, 2000). The empirical model estimated with the variables included in the estimates is as follows:
where is the unobservable utility obtained from a coping strategy, , which also determines the probability of observing this strategy, e.g., .
Notice that in this setup, the latent dependent variables are the s (rather than the , i.e., past savings, borrowing, direct cash transfer and free food). These four are the observed dependent variables, with s as its determinants, which are, in turn, driven by the explanatory variables in Equation (12). Equation (6) shows how the marginal effects of these explanatory variables on the probability of observing are computed.
3.4. Choice and Justification of Variables
In the literature, the debate on the determinants of food insecurity involves two types of variables, namely an explained variable and explanatory variables. The explained variable here is food insecurity captured by the food insecurity indicator, which takes 04 modalities, namely no food insecurity, mild food insecurity, moderate food insecurity and severe food insecurity. To investigate the household-level drivers of food insecurity during the pandemic, we considered explanatory variables that have been reported in the literature as important factors influencing food security, particularly in the context of Cameroonian households. We considered three main categories of variables that apply to households:
- (i)
- Household characteristics with occupation, level of education, gender, marital status of the head of household, household size, insurance and mutual insurance (Dzanku, 2019; Firoz et al., 2021).
- (ii)
- Shocks lead to increased food insecurity at individual and household level (Ansah et al., 2019). In the literature, there are two types of shock. Social shocks are linked to the ability of households to maintain an active workforce (Dzanku, 2019). Social shocks include the death and illness of a household member (Chagomoka et al., 2016; Ansah et al., 2019), armed conflict (HLPE, 2017; Mvodo, 2021), theft of livestock and crops. There are also economic shocks, generally associated with market volatility and unstable incomes (Ozili, 2020; Balana et al., 2023). Economic shocks include higher input prices and loss of employment (Carlsson-Szlezak et al., 2020; Barrett, 2020), and increased food consumption. In addition, shocks such as natural disasters (floods, droughts) have not been included, as they are less prevalent in the period studied (2020–2021) according to the available data.
- (iii)
- Coping strategies, e.g., use of savings, stored food, borrowing, government and NGO assistance, remittances received, other borrowing, etc., highlighted in the literature as measures frequently used to cope with food shortages during crises (Chagomoka et al., 2016). In addition, access to small credit is associated with an increase in household food security and calorie intake (Islam et al., 2016).
Based on this literature and data availability, the following explanatory variables were selected. As food insecurity factors, we have the following variables: age, household size, internet access, sector of activity (unemployed, working in the informal sector, working in the formal private sector, working in public administration), area of residence (armed conflict zone, refugee zone, IDP zone, refugee zone and IDP zone), social and economic shocks (death or disability of a member, death of a benefactor, illness of an active member, loss of an important contact, job loss, bankruptcy of the family business, theft of crops, money and livestock or property, increase in the price of inputs, drop in the selling price of production, increase in the price of foodstuffs, poor harvest due to lack of laboratory, or rodent or insect invasion, other shocks), causes of job loss (currently has a job, COVID-19, other). As household coping strategies, we have the following variables: past savings, stored food, loans, source of assistance or social protection (government/community organization/social safety nets, NGO/international organization, religious and others), forms of assistance or social protection (direct cash transfer, free food, transfer in kind excluding food), social security (insurance or mutual).
4. Results and Discussion
4.1. Descriptive Statistics
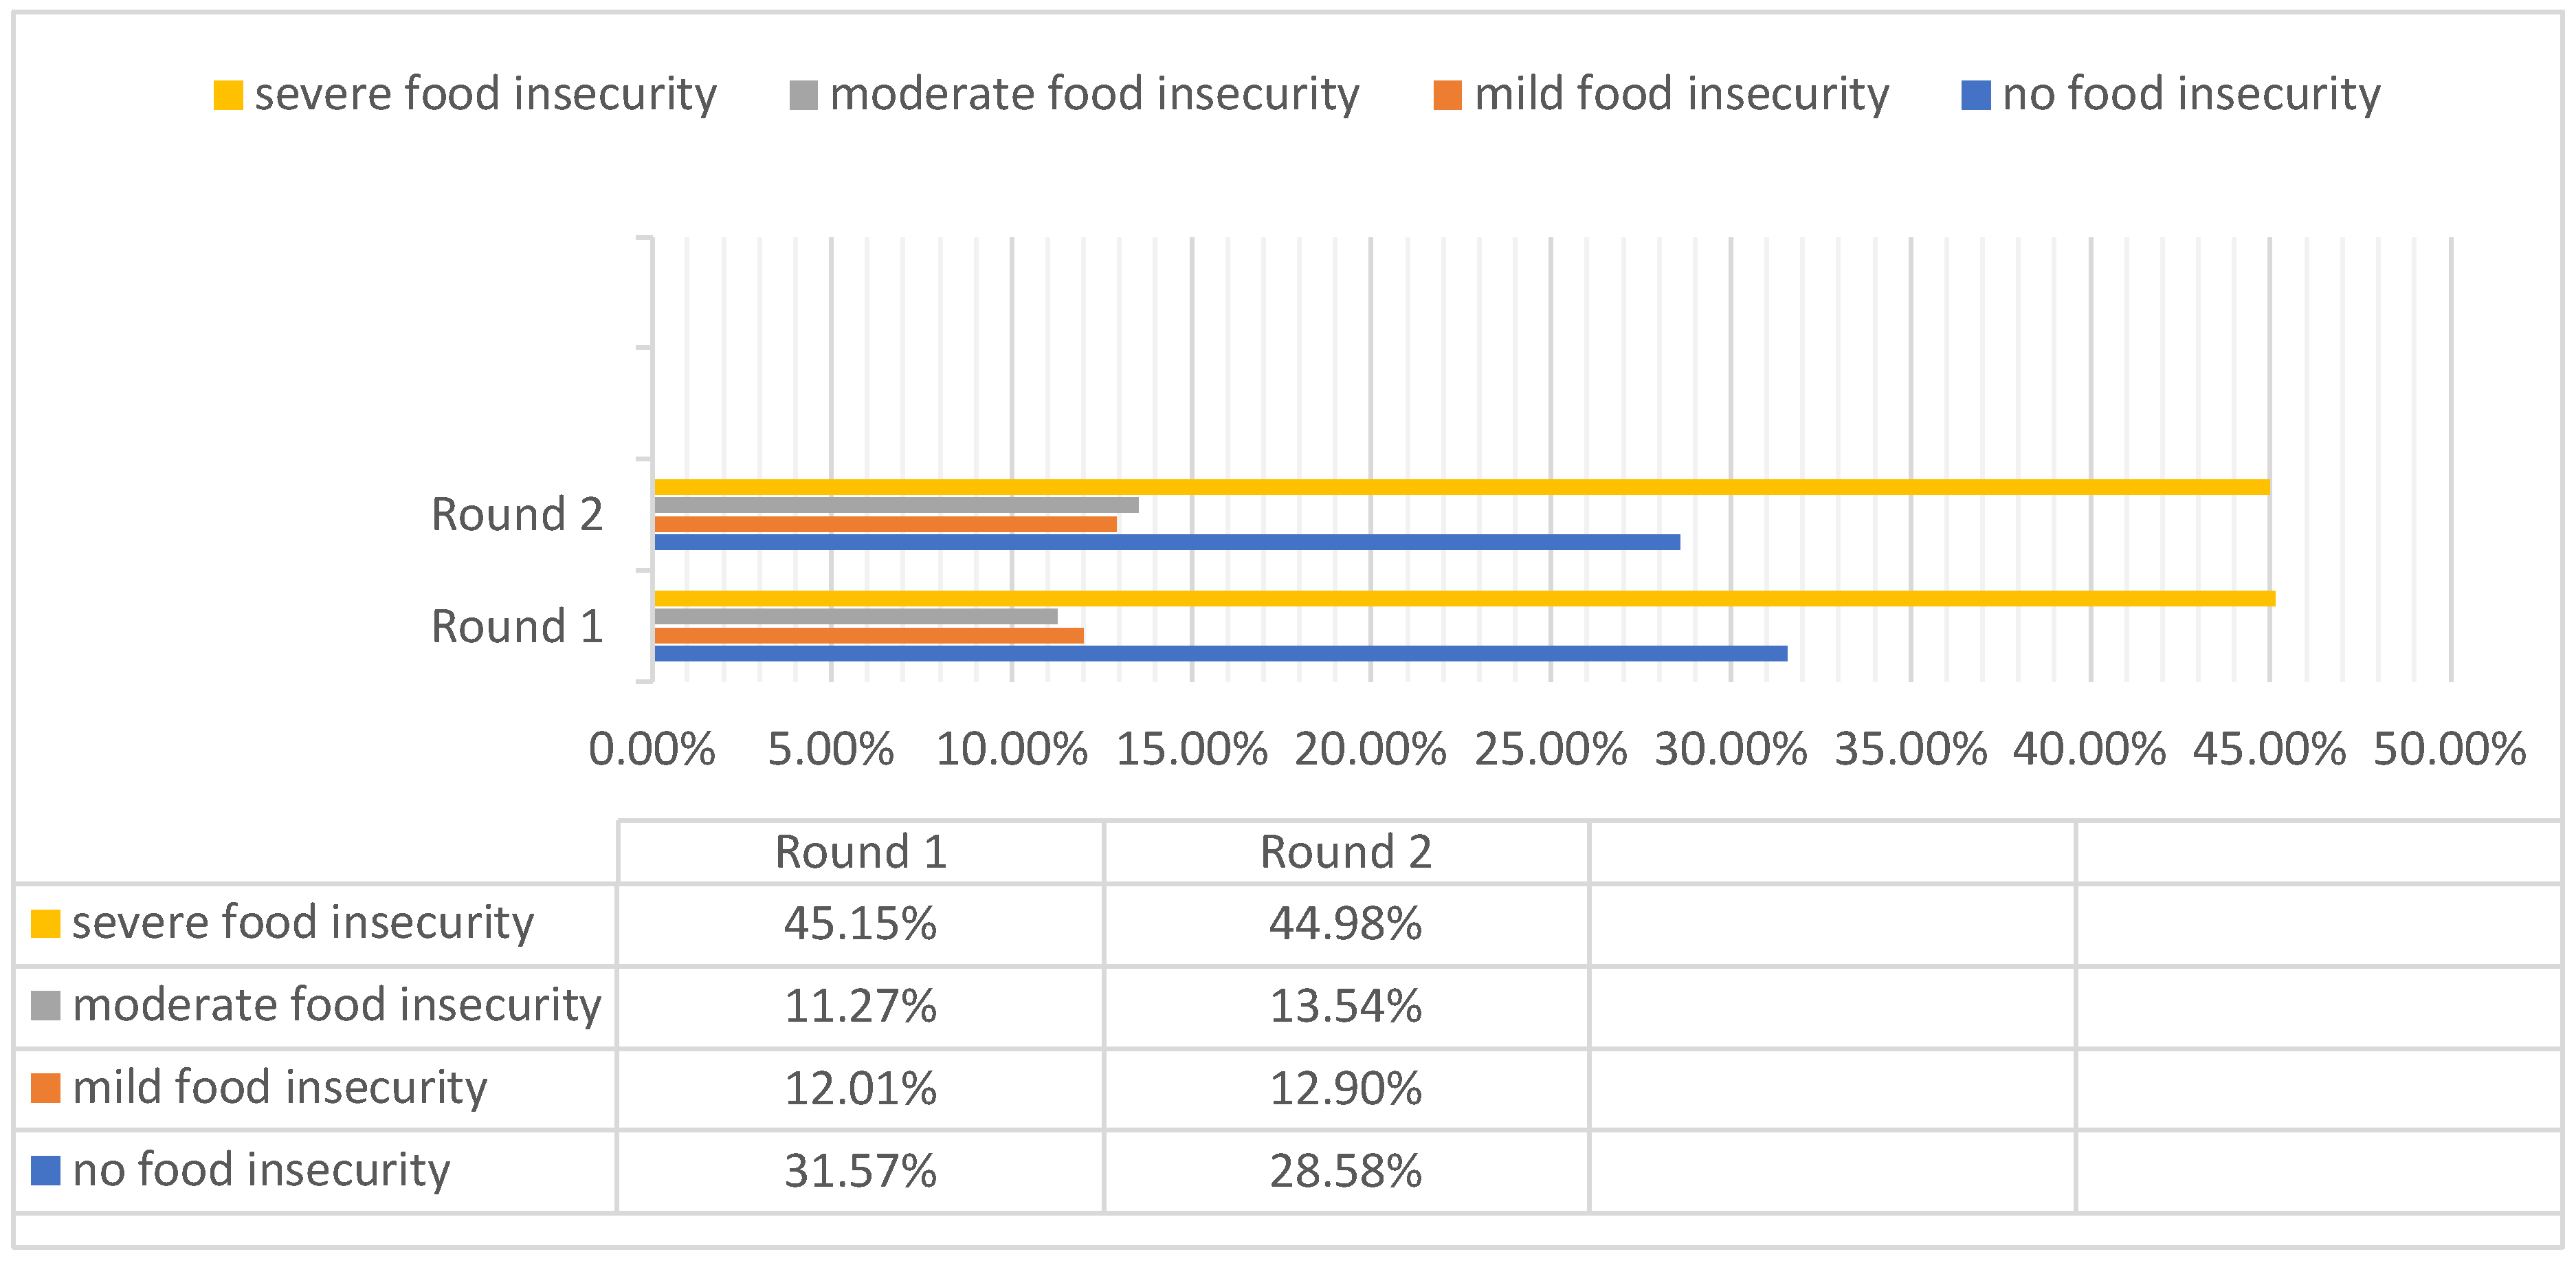
According to Figure 1, in rounds 1 and 2, 31.57% and 28.58% of households, respectively, are not food insecure Also, in rounds 1 and 2, 45.15% and 44.98% of the households reported experiencing acute food insecurity. These data demonstrate that a sizable fraction of Cameroonian households lack consistent, dependable access to enough food. With 31.57% and 45.15% in the first round, and 28.58% and 44.98% in the second, respectively, no food insecurity and severe food insecurity are the highest categories of food insecurity, according to Table 2, which also displays the means and standard deviations of the independent variables.

Figure 1.
Food insecurity status proportions in rounds 1 and 2 of the survey. Source: authors from EPICOVID-19 (2021a, 2021b).
Table 2.
Descriptive statistics of the explanatory variables.
Table 2 displays the descriptive statistics for a few key variables included in the empirical model. As shown, 56% and 94% of households, respectively, in rounds 1 and 2 report not receiving any help or support from social protection during the COVID-19 period. Nevertheless, in rounds 1 and 2, 26% and 21%, respectively, were given complimentary food. In rounds 1 and 2, respectively, 41% and 39% of households consumed food that had been saved, and 5% were not prepared for coping mechanisms. Furthermore, just 13% and 17% employed past savings as a coping mechanism.
Three more traits are particularly noticeable from the summary statistics shown in Table 2: (i) the informal sector employs 75% of households, whereas the formal private sector employs 12% of them. Moreover, 7.0% of people are unemployed, while 4.7% work in public administration. (ii) Job losses can occur for a variety of causes. 11.56% of job losses are due to causes other than the COVID-19 pandemic, whereas 3.6% are caused by it. (iii) Approximately 69% of homes have an internet connection.
Compared to the two rounds, unemployment rose from 7.16% (Round 1) to 9.52% (Round 2), reflecting the intensification of job losses with the prolongation of the pandemic. A rise in food prices from 10.14% to 3.43% between rounds indicated post-confinement volatility. The use of previous savings increased from 13.28% to 16.81%, showing increased reliance on internal resources. The North-West and South-West regions saw a worsening of food insecurity (from 40.0% to 44.98%), linked to the ongoing destruction of agricultural infrastructure. Transfers in kind fell from 26% to 21%, impacting vulnerable households (Table 2).
The sample sizes involved in the two rounds are distinctly different. In round 1, we had a sample size of 2680. This sample was reduced to 1861 in round 2, with an attrition rate of 30.85%. In our study, some of the initial households dropped out before the end of the study, creating a potential attrition bias. We divided our initial sample into two groups: those who completed the study (group 1) and those who dropped out (group 2). We performed the difference-in-means t-test. We compared the means of the food insecurity index. Table A3 (Appendix A) shows that the p-value associated with the observed difference (Pr(|T| > |t|)) is 0.0212. Since this p-value is below the significance level of 0.05, it suggests that the difference observed between the two periods is statistically significant. This means that there is statistical evidence to suggest that there is a significant difference in food insecurity scores between the first passage and the second passage, suggesting that there may be attrition bias in our study. An examination of the characteristics of the households that left the study compared with those that stayed is necessary. The results, reported in Table A3, show that the two groups have estimated coefficients with the same signs. A household with a government worker reduces food insecurity in both groups, as does living in a refugee area. In both groups, living in a conflict zone increases food insecurity. The two groups differ from one another as well. The difference in food insecurity for households that took part in both passages can be explained by having internet access and working in the private sector. Greater household sizes account for the variation in food insecurity amongst homes that left the study. We utilized an unbalanced panel that included all of the study families to account for these similarities and discrepancies.
4.2. Estimation Results and Discussion
4.2.1. Factors Affecting Food Insecurity
We employed a random effects ordered logit model to estimate the parameters of the explanatory variables for the household food insecurity model in Cameroon during the COVID-19 pandemic crisis. This decision was made for several reasons, including the uncertain Hausman test results, the narrow temporal dimension (two periods), and the fixed effects model’s lower performance compared to the random effects model. The random effects approach appears adequate in this instance (Hausman, 1978).
The statistical significance of the coefficients related to age, internet connection, residential area, socio-economic shocks, and job loss is demonstrated by the results in Table A2 (Appendix A). The first category, food security, was used to determine the coefficients’ signs. The link between the dependent variable and the independent variables can only be partially understood by analyzing the signs and significance of the ordered logit coefficients. Table 3 provides the marginal effects of the random-effects- ordered logit model, enabling a more thorough examination in terms of sign and significance, enabling further exploration of this relationship. The table of the marginal effects results provides a comprehensive analysis of how various socio-economic characteristics and external shocks impact food insecurity levels in households categorized as not food insecure, mildly food insecure, moderately food insecure, and severely food insecure.
Table 3.
Marginal effects of the explanatory variables on food insecurity.
Compared to a household without an internet connection, one with access is 32.74% less likely to experience food insecurity. This implies that impoverished households benefit more from the internet connection. This result supports the observation that having access to the internet can make it easier to obtain financial, educational, and informational resources that support increased food security. Although the result is innovative, it remains undocumented in previous African studies, but consistent with McGovern et al. (2021), on the role of digital in crises.
The findings of our investigation show a substantial correlation between the sector of activity and the condition of food insecurity. Specifically, we note that formal corporate and public sector workers are more likely to experience food insecurity than the unemployed. These findings highlight the critical role that formal work has in mitigating food insecurity in times of crisis like the COVID-19 pandemic. Jobs in the public and private sectors provide regular incomes and economic stability, which can help guarantee that people have enough food and other necessities.
Households in Armed conflict areas are strongly associated with increased food insecurity (55.28% higher). This is due to some factors, including manpower shortages that lower production capacity and the devastation of agricultural infrastructure. Frequently, distribution channels are destroyed or restricted, which raises costs and results in food losses. This result is in line with that of Mvodo (2021) in Cameroon. On the other hand, people living in refugee and IDP areas are linked to either a decrease in severe food insecurity or an increase in food security. Food is frequently given to residents of refugee areas by humanitarian organizations and international organizations like the UNHCR. When it comes to socio-economic shocks, more of one shock causes more food insecurity. The findings indicate that social shocks including a member’s death or handicap, the loss of a benefactor, and an active member’s illness raise the severity of food insecurity.
A few more economic shocks include losing one’s work, filing for bankruptcy of a family business, theft, harvesting, money, cattle, or property; a bad harvest because of a labor shortage; an infestation of rodents or insects; rising input costs; and a rise in food prices. Severe food insecurity is caused in part by COVID-19-related job loss as well as numerous other factors. Unlike Foka-Nkwenti et al. (2020), who attribute food insecurity mainly to import disruptions, this study shows that local shocks (crop theft, conflicts) dominate.
4.2.2. Adaptation Strategies and Household Resilience to Food Insecurity
Resilience, as defined by the European Union, is the capacity of an individual, a household, a community, a nation, or a region to endure shocks, adjust, and bounce back swiftly. Resilience analysis reveals actors’ coping mechanisms in the face of shocks as well as their underlying capacities (absorptive, adaptive, and transformative) (Serfilippi & Ramnath, 2018). Within the framework of our research, the food insecurity status transition matrix from the first to the second pass allows us to observe households’ stability or ability to move from one condition to another.
Table 4 illustrates how, during the two research periods, the circumstances of certain homes improved, while those of other households either worsened or stayed the same. According to the data, 43% of food-secure households were maintained (capable of adapting), 12% have gone through mild food insecurity, 13% through moderate food insecurity, and 32% through severe food insecurity. Of the households who were little food insecure, 34% went from that state to food security (transformative capability), 16% went from that state to moderate food insecurity, 39% went to severe food insecurity, and 11% stayed in that state. Of households that were moderately food insecure, 29% became food secure (transformative capability), 17% went from mild to severe food insecurity, 40% remained in that state, and 15% stayed in that state. Of the households who experienced severe food insecurity, 29% transitioned to mild food insecurity, 13% to moderate food insecurity, 14% to intermediate food insecurity, and 45% stayed in a state of severe food insecurity (transformative potential).
Table 4.
Food insecurity status transition matrix 1.
In the context of food insecurity, resilience is frequently assessed using a composite indicator made up of multiple variables that are not included in our database. We constructed a variable resilience to food insecurity by applying the capacity method. This variable includes homes with the ability to maintain food security (adaptive capacity) and households with the ability to change their food insecurity condition into food security (transformative capacity) between the two research periods. According to our findings, 71% of households lack resilience. Between the two survey periods, these households either stayed food insecure or went from food security to food insecurity. Additionally, we have 28.59% of resilient individuals in our sample. These findings also demonstrate the variety of coping mechanisms households employ to address food insecurity, highlighting the necessity of researching the complementarity of coping mechanisms.
The outcomes of the logistic regression analysis are displayed in Table 5. Numerous coping mechanisms that support household resilience are revealed by an analysis of coping mechanisms used by households in Cameroon during the COVID-19 pandemic in the face of food shortages. First, prior savings stand out as a critical component, emphasizing the value of budgeting and accumulating money for emergencies in order to lessen the impact of calamities. The resilience of households with savings has a 41.3% higher probability of being food insecure resilience relative to households without savings. Likewise, readily accessible and affordable strategies are important and provide households with an avenue for adaptability, but more research is needed to determine their long-term effects. Another method that is working well is direct cash transfer, which provides quick and adaptable support to households in need of food. Cash transfers increase resilience by 8.9% (Table 5). This result corroborates that of Tabe-Ojong et al. (2023) in Kenya. Free food and in-kind transfers (except food), are also becoming important strategies for helping vulnerable households directly and in a supplementary way. Lastly, it is important to note that institutional social protection mechanisms play a critical role in managing and averting food emergencies, as membership in insurance or mutual insurance schemes is linked to increased resilience. These findings demonstrate the variety of coping mechanisms households employ to address food insecurity, highlighting the necessity of researching the complementarity of coping mechanisms.
Table 5.
Determinants of resilience to food insecurity: binary logit results.
4.2.3. Complementarities Among Coping Strategies
It is also feasible to take into consideration the interdependencies between the various coping mechanisms that households used to deal with food insecurity throughout the COVID-19 period thanks to the multivariate probit estimator. Table 6 presents these connections. There are many relationships between various coping mechanisms that are probably complementary. Additionally, we discovered a negative but negligible coefficient for government assistance throughout the pandemic. Households do not employ this method very often, which may be explained by the fact that during the COVID-19 pandemic, the government and even certain humanitarian organizations were not logistically or adequately equipped to respond favorably to household food needs. In addition, it might be challenging to identify vulnerable households in a corrupt environment, and government help may be provided to non-necessary households.
Table 6.
Adaptation strategy correlation matrix.
The correlation coefficients presented in Table 6 illustrate the linear relationships between different strategies, S1 (savings), S2 (cash transfer), S3 (free food), and S4 (transfer in kind except for food), that are associated with household resilience to food insecurity.
A correlation of −0.004 between S2 and S1 indicates that there is virtually no linear relationship between these two strategies, meaning that households that rely on their previous savings (S1) are no more likely to use credit (S2). In contrast, a correlation of 0.041 between S3 and S2 shows that a 1% increase in S3 is associated with a 4.1% increase in S2 and vice versa, i.e., there is no causation involved. A coefficient of 0.041 is very close to zero, which quantitatively indicates a very weak positive linear relationship between S2 and S3. However, the positive correlation suggests that direct cash transfers (S3) are slightly more common among households that have obtained credit (S2) and are willing to spend it on food. A correlation of 0.059 between S4 and S1 shows that households using their previous savings (S1) are slightly more likely to receive free food (S4). Finally, a correlation of −0.186 between S4 and S3 reveals that households opting for direct cash payments (S3) are less likely to receive free food (S4). Furthermore, the low correlation values indicate that the strategies are not complementary. Rather, they operate independently or somewhat substitutive in the case of S4 and S3.
4.2.4. Discussion
The comparative analysis highlights converging and diverging trends in the impact of multidimensional crises on food insecurity. With regard to the effects of armed conflict, Cameroon is experiencing a +55.3% rise in food insecurity in the North-West and South-West regions, an impact seen even more markedly in the countries of the Sahel region. Surazu and Stefanović-štambuk (2023) point out that armed conflicts exacerbate the food insecurity situation, exacerbating socio economic tensions in these countries. This disparity between Cameroon and other countries in the region can be explained by a unique combination of protracted conflict, low humanitarian coverage and increased reliance on subsistence agriculture in Cameroon.
On the effectiveness of cash transfers, Cameroon’s results (+8.9% resilience) are more modest than those observed in Kenya and Uganda in the study by Kansiime et al. (2021), reflecting structural shortcomings such as less precise targeting, limited funding and extended deployment times. Nevertheless, these transfers remain a vital tool for households excluded from formal financial systems, particularly in rural areas, providing crucial support to reduce insecurity.
Internet access is emerging as a key factor in resilience to food insecurity. In Nigeria, a study showed that access to ICTs, including the Internet, was associated with a 42% reduction in food insecurity among farming households (Oluwatayo & Ojo, 2019). In comparison, in Cameroon, the effect of Internet access translates into a 32.7% reduction in food insecurity. This gap between the two countries can be attributed to the pivotal role of digital platforms during COVID-19 in Cameroon, which enabled greater access to information and online commerce, although rural ICT penetration still remains low.
5. Conclusions
This study’s objectives were to identify the factors that explain household food in security in Cameroon during the COVID-19 pandemic, analyze the effects of adaptation (coping) strategies on household resilience to food insecurity, and identify the complementarities among adaptation strategies. Data from the Socio-Economic Impact Assessment Panel of COVID-19 (EPICOVID-19) surveys on household living conditions in Cameroon conducted in 2020–2021 by the National Institute of Statistics of Cameroon were used in the estimations of three models: an ordered logit model to identify food insecurity factors, a logit model to analyze the impact of coping strategies on household resilience to food insecurity, and a multivariate probit model to analyze the complementarities among adaptation strategies. The results reveal that socio-economic shocks (armed conflict, job losses, price rises) exacerbated food insecurity, particularly in the North-West and South-West regions (+55.3%). Some 28.59% of households demonstrated resilience, mainly through previous savings, cash transfers and food aid. However, coping strategies proved substitutable rather than complementary, as evidenced by the negative correlation between cash transfers and food aid (ρ = −0.186).
In view of these results, it appears that this study partially confirms the hypotheses formulated. Firstly, hypothesis H1 on the aggravation of food insecurity by socio-economic shocks (conflicts, job losses, inflation) is validated: regions in crisis (North-West, South-West) saw their food insecurity increase underlining the cumulative effect of multidimensional crises. Secondly, hypothesis H2 is partially confirmed: while individual (prior savings) and institutional (cash transfers) strategies improve resilience, their effectiveness remains uneven due to limited access to formal financial systems in rural areas. Finally, the H3 hypothesis on strategy complementarity is invalidated: analyses reveal negative correlations (e.g., cash transfers vs. food aid), indicating that households favor substitutable rather than complementary strategies, probably constrained by limited resources. These results enrich the literature by showing that the effectiveness of resilience mechanisms is closely dependent on the socio-economic and geopolitical context, particularly in developing countries facing overlapping crises.
The results of this study call for an integrated and coordinated approach to strengthening food security in Cameroon. Firstly, the expansion of digital infrastructures in rural areas is essential, as Internet access has reduced food insecurity by 32.7%, by facilitating access to online markets, agricultural information and digital financial services. At the same time, it is crucial to optimize institutional social safety nets: targeted cash transfers and free food aid need to be expanded, particularly in conflict-affected regions, relying on partnerships with local NGOs to improve targeting of vulnerable households. At the same time, securing agricultural areas must become a priority through investments in infrastructure protection (warehouses, roads) and input subsidies, in order to limit the impact of local shocks (crop theft, insecurity). To sustain these efforts, the promotion of preventive savings must be encouraged through financial education programs and products tailored to low-income households, strengthening their ability to absorb future shocks. Finally, multi-sector coordination is essential: close collaboration between ministries (Agriculture, Health, Security), international humanitarian actors and local communities would harmonize responses to overlapping crises (health, economic, security), while avoiding redundancies. This combination of measures, anchored in Cameroon’s socio-economic realities, would provide a sustainable framework for building food resilience in a context of multidimensional crises.
However, certain limitations should be noted. Telephone data (EPICOVID-19) exclude households without access to mobile telephony, which under-represents isolated rural areas. This could lead to an underestimation of food insecurity rates in these areas. The two cycles cover a period of 5 months, which is insufficient to assess the lasting effects of adaptation strategies.
The limitations of this study suggest a move toward post-pandemic longitudinal studies, which would follow households over several years to analyze the sustainability of resilience strategies. Future studies could also combine surveys and interviews to explore dynamics within households (for example, the role of gender in access to transfers). In addition, future studies could extend to neighboring countries (Chad, Nigeria) in order to identify common patterns in conflict zones.
Ultimately, this study highlights the fact that food security in multidimensional crises depends not only on isolated resources, but also on coordinated governance. In Cameroon, combining targeted institutional support, digital inclusion and local capacity building is essential to transform vulnerability into sustainable resilience.
Author Contributions
Conceptualization, A.Y. and S.M.E.B.; methodology, A.Y.; software, A.Y.; validation, A.Y. and S.M.E.B.; formal analysis, A.Y.; investigation, A.Y. and S.M.E.B.; resources, A.Y. and S.M.E.B.; data curation, A.Y.; writing—original draft preparation, A.Y. and S.M.E.B.; writing—review and editing, A.Y. and S.M.E.B.; visualization, A.Y. and S.M.E.B.; supervision, A.Y.; project administration, A.Y.; funding acquisition, A.Y. and S.M.E.B. All authors have read and agreed to the published version of the manuscript.
Funding
This research was funded by AFRICAN ECONOMIC RESEARCH CONSORTIUM (AERC), grant number RC22513 (www.aercafrica.org) And the APC was funded by AFRICAN ECONOMIC RESEARCH CONSORTIUM.
Data Availability Statement
The data will be available upon request from the National Institute of Statistics (INS) in Cameroon.
Conflicts of Interest
No conflicts of interest were reported by the authors.
Abbreviations
The following abbreviations are used in this manuscript:
| FIES | Food Insecurity Experience Scale |
| IDP | Internally Displaced People |
| INS | National Institute of Statistics |
| MCA | Multiple Correspondence Analysis |
| NGO | Non-governmental organization |
| UNHCR | United Nations High Commissioner for Refugees |
Appendix A
Table A1.
Food Insecurity Experience Scale questions.
Table A1.
Food Insecurity Experience Scale questions.
| Number | Question |
|---|---|
| 1 | Fear of running out of food for lack of money or other resources |
| 2 | Not being able to eat healthy and nutritious food due to a lack of money or other resources |
| 3 | Eating a poor variety of food because of a lack of money or other resources |
| 4 | Skipping a meal because of a lack of money or other resources to buy food |
| 5 | Having eaten less than they thought they should because of a lack of money or other resources |
| 6 | Having run out of food because there was not enough money or other resources |
| 7 | Being hungry and not eating because there was not enough money or other resources to buy food |
| 8 | Going a whole day without eating because of a lack of money or other resources |
Sources: (Ballard et al., 2013).
Table A2.
Difference-in-means test for group of households that participated in both runs and group of households that participated in the first run only.
Table A2.
Difference-in-means test for group of households that participated in both runs and group of households that participated in the first run only.
| Group | Obs. | Mean | Std. Err. | Std. Dev. | [95% Conf. Interval] |
|---|---|---|---|---|---|
| Participation during all periods | 1861 | 0.510557 | 0.009747 | 0.4204792 | 0.4914412 0.5296736 |
| No participation | 819 | 0.469754 | 0.014876 | 0.4257387 | 0.4405542 0.4989554 |
| Combined | 2680 | 0.498088 | 0.00816 | 0.4224324 | 0.4820877 0.5140888 |
| Diff | 0.040802 | 0.017699 | 0.0060966 0.0755086 |
diff = mean (participate) − mean (no participate) t = 2.3053; Ho: diff = 0 degrees of freedom = 2678; Ha: diff < 0 Ha: diff ! = 0 Ha: diff > 0; Pr(T < t) = 0.9894 Pr(|T| > |t|) = 0.0212 Pr(T > t) = 0.0106.
Table A3.
Results of random effects of ordered logit (unbalanced (1), balanced (2)).
Table A3.
Results of random effects of ordered logit (unbalanced (1), balanced (2)).
| VARIABLE | (1) | (2) |
|---|---|---|
| Food Insecurity Category | Food Insecurity Category | |
| Socio-demographic characteristics of the household | ||
| Age: 20 to 34 | 0.31 | 0.31 |
| (0.20) | (0.23) | |
| 35 to 49 | 0.32 | 0.36 |
| (0.20) | (0.23) | |
| 50 and older | 0.16 | 0.27 |
| (0.21) | (0.23) | |
| Household size: 2–4 members | −0.07 | −0.09 |
| (0.09) | (0.10) | |
| 5–6 members | −0.06 | −0.14 |
| (0.11) | (0.12) | |
| Greater than 6 members | 0.01 | 0.01 |
| (0.10) | (0.12) | |
| Internet access | −0.33 *** | −0.40 *** |
| (0.08) | (0.09) | |
| Informal sector | −0.13 | −0.08 |
| (0.14) | (0.15) | |
| Formal private sector | −0.61 *** | −0.62 *** |
| (0.16) | (0.18) | |
| Public administration | −0.98 *** | −0.90 *** |
| (0.21) | (0.22) | |
| Armed conflicts | 0.55 *** | 0.60 *** |
| (0.13) | (0.14) | |
| Refugee area | −0.31 *** | −0.18 |
| (0.11) | (0.12) | |
| Internally displaced | −0.05 | 0.04 |
| (0.10) | (0.11) | |
| Refugee area and internally displaced area | −0.39 *** | −0.25 |
| (0.14) | (0.16) | |
| Social and economic shocks | ||
| Death or disability of a member | 1.15 *** | 0.99 *** |
| (0.22) | (0.25) | |
| Benefactor deaths | 1.33 *** | 1.32 *** |
| (0.24) | (0.27) | |
| Active member illness | 0.91 *** | 0.90 *** |
| (0.15) | (0.17) | |
| Loss of important contact | 0.36 | 0.26 |
| (0.23) | (0.25) | |
| Job loss | 1.02 *** | 0.83 *** |
| (0.15) | (0.17) | |
| Family business bankruptcy | 1.18 *** | 1.43 *** |
| (0.26) | (0.29) | |
| Theft, harvesting, money, livestock or property | 0.50 ** | 0.56 ** |
| (0.25) | (0.27) | |
| Input price increase | 1.00 *** | 1.18 *** |
| (0.34) | (0.42) | |
| Production sales price drop | 0.60 * | 0.48 |
| (0.32) | (0.35) | |
| Increase in food prices | 0.47 ** | 0.37 * |
| (0.19) | (0.20) | |
| Poor harvest due to lack of labor | 0.34 * | 0.45 ** |
| (0.19) | (0.22) | |
| Rodent or insect invasion | 0.96 *** | 0.99 *** |
| (0.11) | (0.12) | |
| Other shocks | 0.89 *** | 0.83 *** |
| (0.14) | (0.15) | |
| Job loss causes | ||
| COVID-19 causes | 0.77 *** | 0.96 *** |
| (0.22) | (0.23) | |
| Others causes | 0.14 | 0.11 |
| (0.13) | (0.15) | |
| /cut1 | −0.85 *** | −0.86 *** |
| (0.26) | (0.29) | |
| /cut2 | −0.16 | −0.18 |
| (0.26) | (0.29) | |
| /cut3 | 0.47 * | 0.49 * |
| (0.26) | (0.29) | |
| sigma2_u | 1.01 *** | 0.99 *** |
| (0.16) | (0.16) | |
| Observations | 4541 | 3722 |
Source: authors from EPICOVID-19 (2021a, 2021b). Standard errors in parentheses. *** p < 0.01, ** p < 0.05, * p < 0.1.
Table A4.
Results of the Multivariate Probit model.
Table A4.
Results of the Multivariate Probit model.
| VARIABLE | Round 1 | Round 2 | ||||||
|---|---|---|---|---|---|---|---|---|
| (M1) | (M2) | (M3) | (M4) | (M1) | (M2) | (M3) | (M4) | |
| Pastsavings | Ready | Direct Cash Transfer | Free Food | Past Savings | Ready | Direct Cash Transfer | Free Food | |
| COVID-19 | 0.478 ** | 0.922 ** | 0.273 | 0.328 ** | 0.226 | 0.050 | 0.273 | 0.015 |
| (0.228) | (0.443) | (0.171) | (0.162) | (0.289) | (0.339) | (0.272) | (0.223) | |
| Internet Access | 0.375 *** | 0.037 | −0.102 | 0.110 * | 0.100 | 0.281 * | 0.097 | 0.015 |
| (0.103) | (0.117) | (0.077) | (0.058) | (0.121) | (0.166) | (0.088) | (0.078) | |
| Insurance or mutual | 0.009 | 0.255 ** | 0.219** | 0.289 *** | 0.027 | 0.086 | −0.098 | 0.015 |
| (0.115) | (0.127) | (0.107) | (0.084) | (0.152) | (0.180) | (0.120) | (0.105) | |
| Size Than 6 members | 0.040 | −0.113 | 0.046 | −0.039 | −0.032 | 0.100 | −0.123 | −0.243 |
| (0.090) | (0.108) | (0.074) | (0.056) | (0.461) | (0.538) | (0.323) | (0.288) | |
| Informal sector | 0.006 *** | 0.017 *** | 0.174 ** | 0.040 | 0.0205 *** | 0.140 *** | 0.035 | 0.0195 *** |
| (0.096) | (0.126) | (0.081) | (0.062) | (0.104) | (0.133) | (0.080) | (0.070) | |
| Armed conflicts | 0.050 | −0.066 | −0.092 | −0.159 ** | 0.163 | 0.027 | −0.057 | −0.335 *** |
| (0.127) | (0.154) | (0.109) | (0.081) | (0.130) | (0.160) | (0.106) | (0.104) | |
| Refugee area | 0.084 | 0.196 | −0.081 | 0.160 ** | 0.107 | 0.050 | 0.154 | 0.070 |
| (0.119) | (0.135) | (0.099) | (0.070) | (0.131) | (0.169) | (0.102) | (0.086) | |
| Death or disability of a member | 0.144 | 0.562 ** | 0.005 | 0.352 ** | 0.137 | 0.248 | 0.241 | 0.704 ** |
| (0.251) | (0.227) | (0.193) | (0.160) | (0.367) | (0.492) | (0.269) | (0.352) | |
| Job loss | 0.268 * | −0.584 ** | 0.017 | 0.316 *** | 0.231 | −0.137 | 0.257 | 0.168 |
| (0.154) | (0.287) | (0.128) | (0.104) | (0.313) | (0.380) | (0.229) | (0.204) | |
| Constant | −0.279 *** | −0.875 *** | −1.211 *** | −0.730 *** | −0.056 | −1.23 *** | −1.09 *** | −0.623 *** |
| (0.106) | (0.122) | (0.099) | (0.077) | (0.124) | (0.168) | (0.106) | (0.091) | |
| Observations | 2680 | 2680 | 2680 | 2680 | 1861 | 1861 | 1861 | 1861 |
Source: authors from EPICOVID-19 (2021a, 2021b). Standard errors in parentheses. *** p < 0.01, ** p < 0.05, * p < 0.1.
Notes
| 1 | The value of the sub-index was multiplied by −1 before proceeding to the normalisation, because when performing an MCA on Stata 16 with binary coded variables (0 or 1) Stata systematically places 0 (no) on the positive side and 1 (yes) on the negative side. |
| 2 | In the context of food insecurity analysis, the marginal effect helps us assess the influence of explanatory variables (such as age of head of household, household size, internet access, area of residence, and socioe-conomic shocks, etc.) on household insecurity status. It allows us to understand how these factors contribute to a household’s food insecurity status and can help policymakers, researchers, and organizations understand the drivers of food insecurity and tailor interventions to address specific vulnerabilities and promote food security in different segments of the population. |
References
- Abay, K. A., Berhane, G., Hoddinott, J., & Tafere, K. (2023). COVID-19 and food security in Ethiopia: Do social protection programs protect? Economic Development and Cultural Change, 71(2). [Google Scholar] [CrossRef]
- Amrullah, E. R., Tokuda, H., Rusyiana, A., & Ishida, A. (2023). Effect of COVID-19 pandemic on food insecurity in Indonesian households. International Journal of Social Economics. ahead-of-print. [Google Scholar] [CrossRef]
- Ansah, I. G. K., Gardebroek, C., & Ihle, R. (2019). Resilience and household food security: A review of concepts, methodological approaches and empirical evidence. Food Security, 11(6), 1187–1203. [Google Scholar] [CrossRef]
- Balana, B. B., Ogunniyi, A., Oyeyemi, M., Fasoranti, A., Edeh, H., & Andam, K. (2023). COVID-19, food insecurity and dietary diversity of households: Survey evidence from Nigeria. Food Security, 15(1), 219–241. [Google Scholar] [CrossRef]
- Ballard, T. J., Kepple, A. W., & Cafiero, C. (2013). The food insecurity experience scale: Developing a global standard for monitoring hunger worldwide. Technical Paper. Available online: http://www.fao.org/economic/ess/ess-fs/voices/en/ (accessed on 3 March 2025).
- Banque Mondiale. (2021). Cameroun-vue d’ensemble. Banque Mondiale. [Google Scholar]
- Barrett, C. B. (2020). Actions now can curb food systems fallout from COVID-19. Nature Food, 1(6), 319–320. [Google Scholar] [CrossRef] [PubMed]
- Carlsson-Szlezak, P., Reeves, M., & Swartz, P. (2020). What coronavirus could mean for the global economy. Harvard Business Review, 3(10), 1–10. [Google Scholar]
- Ceballos, F., Kannan, S., & Kramer, B. (2020). Impacts of a national lockdown on smallholder farmers’ income and food security: Empirical evidence from two states in India. World Development, 136, 105069. [Google Scholar] [CrossRef]
- Chagomoka, T., Unger, S., Drescher, A., Glaser, R., Marschner, B., & Schlesinger, J. (2016). Food coping strategies in northern Ghana. A socio-spatial analysis along the urban–rural continuum. Agriculture & Food Security, 5(1), 4. [Google Scholar] [CrossRef]
- Dandonougbo, Y., Tossou, Y., Atake, E. H., & Ekouevi, D. K. (2021). Effets de la COVID-19 sur la variation du revenu et la sécurité alimentaire des ménages au Togo. African Development Review, 33, S194–S206. [Google Scholar] [CrossRef]
- Dzanku, F. M. (2019). Food security in rural sub-Saharan Africa: Exploring the nexus between gender, geography and off-farm employment. World Development, 113, 26–43. [Google Scholar] [CrossRef]
- Ekwebelem, O. C., Ofielu, E. S., Nnorom-Dike, O. V., Iweha, C., Ekwebelem, N. C., Obi, B. C., & Ugbede-Ojo, S. E. (2020). Threats of COVID-19 to achieving United Nations sustainable development goals in Africa. American Journal of Tropical Medicine and Hygiene, 104(2), 457. [Google Scholar] [CrossRef] [PubMed]
- Firoz, A., Islam, A., Pakrashi, D., Rahman, T., & Siddique, A. (2021). Determinants and dynamics of food insecurity during COVID-19 in rural Bangladesh. Food Policy, 101, 102066. [Google Scholar] [CrossRef]
- Foka-Nkwenti, C., Nguendo, Y. H. B., Noela, A. M., & Nganou-Mouafo, M. (2020). COVID-19 and food insecurity in Cameroon. GSC Advanced Research and Reviews, 5(2), 111–117. [Google Scholar] [CrossRef]
- Fung Uy, W., Crespo-Bellido, M., Gray, H., Wright, L., Himmelgreen, D., & Martinez Tyson, D. (2023). Coping with food insecurity among people seeking food assistance during the COVID-19 pandemic. Journal of Nutrition Education and Behavior, 55(7), 16. [Google Scholar] [CrossRef]
- Gentilini, U. (2022). Cash transfers in pandemic times (No. 37700). The World Bank Group. [Google Scholar]
- Greene, W. H. (2000). Econometric analysis (4th ed.). Prentice Hall. [Google Scholar]
- Hausman, J. A. (1978). Specification tests in econometrics. Econometrica: Journal of the Econometric Society, 1251–1271. [Google Scholar] [CrossRef]
- HLPE. (2017). Nutrition and food security (A report by the high-level panel of experts on food security and nutrition). Committee on World Food Security. [Google Scholar]
- INS EPICOVID-19. (2021a). Enquêtes d’évaluation de l’impact socioéconomiques de la COVID-19 sur les conditions de vies des ménages au Cameroun, deuxième passage-volet ménages, rapport d’analyse des données. EPICOVID-19. [Google Scholar]
- INS EPICOVID-19. (2021b). Enquêtes d’évaluation de l’impact socioéconomiques de la COVID-19 sur les conditions de vies des ménages au Cameroun, premier passage-volet ménages, rapport d’analyse des données. EPICOVID-19. [Google Scholar]
- Islam, A., Maitra, C., Pakrashi, D., & Smyth, R. (2016). Microcredit programme participation and household food security in rural Bangladesh. Journal of Agricultural Economics, 67(2), 448–470. [Google Scholar] [CrossRef]
- Kansiime, M. K., Tambo, J. A., Mugambi, I., Bundi, M., Kara, A., & Owuor, C. (2021). COVID-19 implications on household income and food security in Kenya and Uganda: Findings from a rapid assessment. World Development, 137, 105199. [Google Scholar] [CrossRef]
- McGovern, T. M., Gogan, J. L., & Bui, T. X. (2021, January 5–8). Can digital badging help universities flexibly support students and faculty during crises? A proposal and call for research. 54th Hawaii International Conference on Social Sciences (pp. 6339–6348), Kauai, HI, USA. [Google Scholar]
- Min, H. (2013). Ordered Logit regression modeling of the self-rated health in Hawai‘i, with comparisons to the OLS model. Journal of Modern Applied Statistical Methods, 12(2), 23. [Google Scholar] [CrossRef]
- MINADER/PAM/FAO. (2020). SUIVI DE LA SECURITE ALIMENTAIRE, Bulletin Nr. 4, République du Cameroun (Octobre 2020, Données de Février 2020). Available online: https://docs.wfp.org/api/documents/WFP-0000120753/download/ (accessed on 3 March 2025).
- Mouloudj, K., Bouarar, A. C., & Fechit, H. (2020). The impact of COVID-19 pandemic on food security. Les cahiers du CREAD, 36(3), 159–184. [Google Scholar]
- Mvodo, Y. F. (2021). Insécurité alimentaire post-covid des ménages urbains au Cameroun. Revue Française d’Economie et de Gestion, 2(11), 308–332. [Google Scholar]
- Oluwatayo, I. B., & Ojo, A. O. (2019). Effect of access to ICT on food insecurity among farming households in Nigeria. The Journal of Developing Areas, 53(2), 155–168. [Google Scholar] [CrossRef]
- OMS-Cameroun. (2020). COVID-19 infos: Bulletin d’information de l’OMS Cameroun (n°1—janvier à juin 2020). OMS-Cameroun. [Google Scholar]
- Onyeaka, H., Anumudu, C. K., Al-Sharify, Z. T., Egele-Godswill, E., & Mbaegbu, P. (2021). COVID-19 pandemic: A review of the global lockdown and its far-reaching effects. Science Progress, 104(2), 00368504211019854. [Google Scholar] [CrossRef] [PubMed]
- Orjiakor, E. C., Adediran, A., Ugwu, J. O., & Nwachukwu, W. (2023). Household living conditions and food insecurity in Nigeria: A longitudinal study during COVID-19 pandemic. BMJ Open, 13(1), e066810. [Google Scholar] [CrossRef] [PubMed]
- Ozili, P. K. (2020). COVID-19 pandemic and economic crisis: The Nigerian experience and structural causes. Journal of Economic and Administrative Sciences, 37(4), 401–418. [Google Scholar] [CrossRef]
- Sen, A. (1976). Poverty and famines: An essay on entitlement and deprivation. Oxford University Press. [Google Scholar]
- Sen, A. (1999). Development as freedom. Oxford University Press. [Google Scholar]
- Serfilippi, E., & Ramnath, G. (2018). Resilience measurement and conceptual frameworks: A review of the literature. Annals of Public and Cooperative Economics, 89(4), 645–664. [Google Scholar] [CrossRef]
- Suh, N. N., Nyiawung, R. A., & Abay, C. F. (2023). Food security and coping strategies for COVID-19 disruptions among farming households in Cameroon. Food and Humanity, 1, 614–625. [Google Scholar] [CrossRef]
- Surazu, M. M., & Stefanović-štambuk, J. (2023). The cause of diplomatic failure in the Sahel region and the rising coups. International Journal of Research and Innovation in Social Science, 7(12), 1005–1012. [Google Scholar] [CrossRef]
- Tabe-Ojong, M. P., Jr., Gebrekidan, B. H., Nshakira-Rukundo, E., Börner, J., & Heckelei, T. (2022). COVID-19 in rural Africa: Food access disruptions, food insecurity and coping strategies in Kenya, Namibia, and Tanzania. Agricultural Economics, 53(5), 719–738. [Google Scholar] [CrossRef]
- Tabe-Ojong, M. P., Jr., Nshakira-Rukundo, E., & Haile Gebrekidan, B. (2023). COVID-19 and food insecurity in Africa: A review of the emerging empirical evidence. European Review of Agricultural Economics, 50(3), 853–878. [Google Scholar] [CrossRef]
- Tambe, B. A., Tchuenchieu, A. K., Tchuente, B. T., Edoun, F. E., Mouafo, H. T., Kesa, H., & Medou, G. N. (2021). The state of food security and dietary diversity during the COVID-19 pandemic in Cameroon. Journal of Medicine and Health Research, 6(1), 1–11. [Google Scholar]
- WFP, UNICEF & FAO. (2020). Interim guidance note: Mitigating the effects of the COVID-19 pandemic on food and nutrition of schoolchildren. Food and Agriculture Organization of the United Nations. [Google Scholar]
Disclaimer/Publisher’s Note: The statements, opinions and data contained in all publications are solely those of the individual author(s) and contributor(s) and not of MDPI and/or the editor(s). MDPI and/or the editor(s) disclaim responsibility for any injury to people or property resulting from any ideas, methods, instructions or products referred to in the content. |
© 2025 by the authors. Licensee MDPI, Basel, Switzerland. This article is an open access article distributed under the terms and conditions of the Creative Commons Attribution (CC BY) license (https://creativecommons.org/licenses/by/4.0/).