Abstract
The COVID-19 pandemic intensified existing structural challenges in Africa, including poverty, weak healthcare systems, and fragile agricultural supply chains. Consequently, examining its effects remains a critical area of study. This research investigates the effect of food prices on the prevalence of malnutrition in the context of the COVID-19 pandemic in sub-Saharan Africa. The findings indicate a significant long-term relationship between the number of COVID-19 cases, food prices, and the prevalence of undernourishment. Specifically, increases in food prices are associated with a rise in undernourishment rates over the long term. These results are corroborated by estimations using Fully Modified Ordinary Least Squares (FMOLS). To mitigate malnutrition in the face of potential future health shocks, governments could create and operationalize food price stabilization funds to cushion against sharp increases in food prices. These funds can be used to subsidize key staples during periods of price volatility, ensuring affordability for vulnerable populations.
JEL Classification:
C32; C54; I15
1. Introduction
The world has set the challenge of achieving Zero Hunger by 2030 through the adoption of the Sustainable Development Goals (SDGs) in July 2015. Hunger1 can take on several aspects, and one of its best-known manifestations is malnutrition, which is defined as an imbalance in the quantity and/or quality of food intake. This curse was exacerbated by the COVID-19 pandemic, which spread rapidly and widely across the world from late 2019, while around 733 million people faced hunger in 2023, equivalent to one in eleven people globally and one in five in Africa (FAO et al., 2024). According to the World Bank (2020), the COVID-19 pandemic triggered a global economic recession that dramatically decreased livelihoods and incomes worldwide.
The resulting decline in purchasing power for those who lost their income had a major impact on food security and nutrition, especially for populations that were already vulnerable, including those working in the informal economy. Approximately 45 percent of all deaths among children below five years of age globally are attributable to malnutrition, either to acute malnutrition or the increased vulnerability to deadly infections and other illnesses that are caused by malnutrition (Bread for the World, 2020). In sub-Saharan Africa, there were an estimated 282 million people who were undernourished in 2022, which is more than 38% of the world’s undernourished population (FAO et al., 2023).
While the acute phase of the COVID-19 pandemic has largely subsided, its socio-economic impacts, particularly on food systems and nutrition in sub-Saharan Africa, continue to persist and evolve. The pandemic’s disruptions to global supply chains, local food production, and markets have triggered prolonged consequences for food prices, exacerbating existing vulnerabilities in a region already grappling with food insecurity and malnutrition. Food price volatility during the pandemic was driven by lockdowns, trade restrictions, and disruptions to agricultural inputs and labor. These factors not only increased food costs but also reduced household incomes, further limiting access to nutritious food. Even post-pandemic, recovery has been uneven, as inflation, debt burdens, and external economic shocks (e.g., climate events and geopolitical conflicts) continue to exacerbate food affordability challenges in the region. This lingering impact has made it difficult for many families to regain food security, particularly among the most vulnerable populations, such as children, women, and rural communities. The combined effects of rising food prices and reduced purchasing power have deepened the risk of malnutrition, both acute and chronic, across sub-Saharan Africa. Children under five remain especially vulnerable to stunting, wasting, and micronutrient deficiencies, which have long-term consequences for health, education, and economic productivity. Addressing this issue requires understanding not only the immediate impacts of COVID-19 but also the enduring shocks it triggered within food systems, livelihoods, and health outcomes.
Given the pandemic’s role in exacerbating existing structural challenges, such as poverty, weak healthcare systems, and fragile agricultural supply chains, it remains highly relevant to studying these effects. Doing so provides critical insights into how external shocks, like pandemics, affect food security and malnutrition. More importantly, it highlights the need for robust, forward-looking policies to build resilience in sub-Saharan Africa’s food systems and ensure sustainable recovery.
In order to better assess COVID-19’s economic effects, it is essential to examine the pathways through which economic shocks influence the economy. Carlsson-Szlezak et al. (2020) identify three primary transmission channels. The first involves supply disruptions, where halting production due to the pandemic negatively affects supply chains, labor demand, and employment, leading to prolonged job losses and rising unemployment. The second channel pertains to demand, as reduced incomes result in decreased consumption of goods and services. Moreover, the prolonged pandemic and social distancing measures may lower consumer confidence, causing individuals to become more cautious and pessimistic about the economy’s future. The third channel synthesizes the indirect effects of financial market shocks on the real economy, as portrayed by declining incomes, which may force households to stop saving or rely on their assets to meet daily needs. Additionally, the pandemic might trigger an “anticipation shock”, leading economic agents to adopt a wait-and-see approach, altering their spending or transaction behaviors (Baldwin & Tomiura, 2020).
The main research question of this study was the extent to which the COVID-19 pandemic affected surging malnutrition in an environment of rising food prices. The specific questions were as follows: (i) Were those effects nurtured by the interactions between the prevalence of undernourishment, food price inflation, and the number of COVID-19 cases? (ii) How different are the short-term effects from the long-run ones? Therefore, the study specifically sought to (i) determine the interactions between the prevalence of undernourishment, food price inflation, and the number of COVID-19 cases, and (ii) evaluate the short- and long-term effects of COVID-19 on malnutrition. The specific hypotheses were the following: H1: undernourishment, COVID-19, and surging food prices have ambiguous relations. H2: The long-run relationship between the number of COVID-19 cases, surging food prices, and the prevalence of undernourishment outweighs the short-term relationship between those variables.
Overall, the aim of the analysis was to inform policymakers and development practitioners about targeted interventions needed to mitigate malnutrition and stabilize food prices in the aftermath of COVID-19 and future global health crises. While global analyses of COVID-19’s impacts on food prices and malnutrition exist, there is a significant gap in region-specific studies for sub-Saharan Africa, where food insecurity is deeply intertwined with poverty, institutional weaknesses, and external shocks. By focusing on that region, this study fills an important knowledge gap and highlights context-specific interactions between pandemic-related factors, food affordability, and nutritional outcomes. Unlike Agyei et al. (2021), who only examined food price increases during COVID-19, our study explicitly links these increases to malnutrition outcomes. While Mohamed et al. (2021) focused on food security broadly, our study quantifies the short- and long-term effects on undernourishment using a panel ARDL model.
Following the introduction, Section 2 reviews the literature on this subject matter. Section 3 sheds light on the conceptual framework. The methodology is also presented in Section 3, and the results are presented and discussed in Section 4. Section 5 concludes the paper with research and policy recommendations.
2. Literature Review
The COVID-19 pandemic significantly impacted global health, with food prices rising due to product shortages and market closures, along with the Ukraine war. Early research indicates that the impact of COVID-19-related measures on food prices was uneven, with the underlying causal mechanisms still not fully understood. While international food prices remained relatively stable after the pandemic’s onset (Barrett, 2020; Béné, 2020; Devereux et al., 2020), studies in low- and middle-income countries (LMICs) show that prices increased, particularly in food-insecure regions. For example, in Ethiopia, approximately 90% of households reported higher food prices as the primary challenge when unable to purchase sufficient food (Wieser et al., 2020). Similarly, in Mali, 45% of respondents without access to staple foods identified rising prices as the main barrier (World Bank, 2020). However, the effects of COVID-19 policy responses are unlikely to have been uniform, as market characteristics may influence how restrictions impact food prices. Evidence from Mali suggests that urban households faced greater food security challenges compared to rural households (Adjognon et al., 2021). Lu et al. (2020) note that the outbreak and the severity of COVID-19 had different impacts on food prices in China. They found no significant impact on rice and wheat flour prices, whereas there was a significantly positive impact on cabbages prices and various impacts on pork prices. The outbreak may have had large impacts on pork and cabbage prices due to social panic, with some negative impacts in the former case, perhaps due to reduced demand for pork during the quarantine. Agyei et al. (2021) investigated the impact of the COVID-19 outbreak on prices of maize, sorghum, imported rice, and local rice in sub-Saharan Africa. The study found that restrictions on movements or lockdowns in the wake of COVID-19 were associated with an increase in the price of maize only.
Lockdown measures following the outbreak caused significant disruptions in supply chains, impacting food availability and quality (Barrett, 2020). The shutdown of restaurants and food service establishments drastically reduced the demand for certain perishable items, such as dairy products, potatoes, and fresh fruits, along with specialized products like chocolate and premium meat cuts (Terazono & Munshi, 2020). Farmers lacking sufficient storage capabilities, particularly cold storage, were unable to sell their products, resulting in unsellable food surpluses. Figure 1 illustrates the dynamics of COVID-19’s effects on nutrition. Governments implemented various measures to curb the virus’s spread, such as social distancing, mobility restrictions, and widespread lockdowns. These actions severely affected food security, nutrition, and food systems. Along supply chains, major disruptions were observed in the wake of lockdown measures, which affected the availability, pricing, and quality of food (Barrett, 2020). The closure of restaurants and other food service facilities led to a sharp decline in demand for certain perishable foods, including dairy products, potatoes, and fresh fruits, as well as dedicated goods such as chocolate and some high-value cuts of meat (Terazono & Munshi, 2020). Farmers without adequate storage facilities, including cold storage, found themselves with food that they could not sell. Disruptions to food supply chains, income losses, increased inequality, and compromised social protection programs altered food environments and caused uneven food prices in localized areas (Clapp & Moseley, 2020; Laborde et al., 2020). Consequently, these disruptions led to heightened poverty and food insecurity.
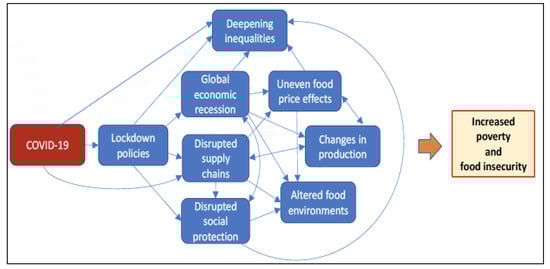
Figure 1.
The potential effects of COVID-19 on food security and nutrition. Source: High-Level Panel of Experts on Food Security and Nutrition (HLPE, 2020).
While initial findings have shed light on the impact of COVID-19 policies, they fail to connect these disruptions to measurable health outcomes like malnutrition or undernourishment. This paper focuses specifically on the interaction between food price inflation, malnutrition, and COVID-19 confirmed cases. The study provides empirical insights into how food price changes related to malnutrition during the COVID-19 pandemic. By linking food prices and undernourishment explicitly to COVID-19’s impacts, it bridges a crucial gap that Ezirigwe et al. (2021) do not address, especially the empirical measurement of short- and long-term effects of the pandemic on malnutrition. While Mohamed et al. (2021) focus broadly on food security and the economic fallout of the pandemic, Agyei et al. (2021) focus exclusively on food price changes without connecting these fluctuations to malnutrition outcomes. This study narrows down to food price inflation dynamics and their direct implications for malnutrition outcomes, providing measurable interactions between COVID-19 cases, food prices, and undernourishment. This research article moves beyond general observations to empirically assess the compounded effects of food price surges and COVID-19 on malnutrition, a specific and underexplored area.
3. Methodology
3.1. Empirical Strategy
This study aimed at assessing the effects of food prices on malnutrition in a COVID-19 environment in sub-Saharan Africa. A descriptive analysis was undertaken to understand the interactions between the key variables. Subsequently, econometric analyses were conducted using an annual panel dataset. A first estimation, conducted without the COVID-19 dummy, identified the general determinants of malnutrition. The second estimation assessed the pandemic’s impact on malnutrition and its influence on these determinants. Interaction terms between COVID-19 and key economic indicators—food production index, household consumption, and GDP—captured indirect effects.
Finally, a panel autoregressive distributive lag model (ARDL) was used to evaluate the short-and long-term effects of COVID-19 on malnutrition. In this regression, COVID-19 was measured by the number of confirmed positive cases. The rationale behind the ARDL model is that the COVID-19 pandemic’s effects could differ depending on the time horizon. In the very short term, the crisis came as a surprising shock to many countries, whereas in the long term, response mechanisms were implemented worldwide. The variables in the model were selected based on their monthly availability. The methodology consisted of performing unit root tests to identify the order of integration of these variables. Then, cointegration tests (Pedroni and Westerlund) were conducted. The model was estimated using the Pooled Mean Group (PMG) estimator. The choice of the PMG over the DFE estimator was motivated by the fact that sub-Saharan African countries exhibit significant structural and institutional differences in their economies, including variations in governance, financial development, and labor markets. The PMG estimator accounts for country-specific short-run dynamics, whereas the DFE estimator imposes homogeneity in both the short and long run, which may not be appropriate for a heterogeneous region like SSA.
Fully modified OLS (FMOLS) and dynamic OLS (DOLS) were employed to ensure result robustness. FMOLS is particularly useful for obtaining consistent parameters in small samples in the short term (Stock & Watson, 1993) and addressing endogeneity and serial correlation issues, allowing for parameter heterogeneity. Similarly, DOLS is effective in small samples and short-term scenarios, providing unbiased and asymptotically efficient estimates despite endogeneity.
3.2. Specification of the Models
The annual panel data model was built on the following generic equation:
where is the matrix of exogenous variables. is a country-fixed effect, which allows for controlling country heterogeneities. is the ith stochastic disturbance in the tth period.
is the specified outcome being modeled, which in this study is the prevalence of undernourishment (World Bank, 2020; FAO, 2021). It defines a national-level model-based indicator used to understand access to food in terms of dietary energy inadequacy.
The explanatory variables are as follows:
- -
- Real per-capita gross domestic product (PCGDP) and household consumption expenditures (Conso) are used to express the average income’s effect and the ability of households to afford sufficient food. Economic well-being is a strong determinant of food security. Higher per-capita GDP reflects greater household income, allowing better access to nutritious food. Household consumption measures spending on food, health, and other essential needs. A higher percentage of GDP allocated to consumption suggests better food security conditions. Previous research (Sassi, 2015; Kaur & Kaur, 2017) finds that income growth reduces undernourishment, particularly in low-income countries. The COVID-19-induced recession and job losses negatively impacted per-capita GDP, reducing the household consumption capacity.
- -
- Consumer price index inflation rate (Inflation), capturing the effect of changes in price on access to food, is supposed to positively affect the prevalence of undernourishment. Increased food price inflation reduces purchasing power, particularly in low-income households, leading to dietary compromises and nutrient deficiencies. Empirical studies (Agyei et al., 2021; Reardon et al., 2020) confirm that price surges due to supply chain disruptions worsen food insecurity.
- -
- Food production index, a measure of food availability, is expected to have a negative effect on the prevalence of undernourishment. A robust local food production system can cushion countries from global price shocks and supply disruptions. Empirical evidence (FAO, 2021) suggests that countries with higher agricultural output experience lower malnutrition rates.
- -
- Population growth (pop growth): The expression of the effect of the demographic pressure is expected to positively affect the prevalence of undernourishment through per-capita food availability. Higher population growth rates are often associated with increased demand for food, which may outpace supply, leading to higher food prices and malnutrition. Previous studies (Saccone, 2021) find that demographic pressures exacerbate food insecurity, particularly in regions with low agricultural productivity.
- -
- Employment in agriculture (employ) measures the contribution of labor in the production of food. Agriculture is a key sector in SSA, employing a significant portion of the labor force A higher share of agricultural employment may indicate greater household self-sufficiency in food production, reducing reliance on volatile food markets. However, if agricultural employment is associated with low wages and subsistence farming, its effect on food security may be limited, hence drive a mitigated effect.
- -
- COVID-19 is introduced as a dummy variable taking the value 0 for the years before the pandemic and 1 in the years ever since COVID-19 surfaced. The purpose is to seize the changes in the effects of the determinants of undernourishment in the context of COVID-19.
The model is finally expressed as follows:
The generic formulation of the autoregressive model of order in the explanatory factors and an autoregressive model of order in the dependent variable is as follows:
where is the dependent variable, namely the proportion of undernourished people. is a vector of explanatory variables, represents the fixed-effects, is the coefficient of the lagged dependent variable, is coefficient vector of independent variables, is the error term, is the number of cross-sections, and denotes the temporal dimension. The expression of the error-corrected form of the re-parameterized model is
The number of confirmed COVID-19 cases is the variable of interest for evaluating the short- and long-run effects of the pandemic on malnutrition. In addition, food price inflation rate is introduced to estimate the effect of changes in food prices. Indeed, food prices rose across the world as supply chains shut down or were disrupted due to the pandemic. Price increases occurred in some countries and markets due to a combination of reduced supply resulting from government restrictions to combat COVID-19 and panic buying, which reduced the availability of certain food items and sometimes non-food products such as hydro-alcoholic gels and toilet paper (Erokhin & Gao, 2020). Countries in sub-Saharan Africa faced some of the sharpest food price increases in the world due to the COVID-19 pandemic. Between February 2020 and July 2021, food prices increased by 38.3% in Mozambique, 21% in Uganda, 17.1% in Sudan, and 10.9% in the DRC (FAO, 2021).
The number of explanatory variables is due to the paucity of monthly data. The corresponding model, following Erokhin and Gao (2020), is expressed as follows:
The long-run coefficients and the speed of adjustment are the coefficients of interest in the analysis. But the Pooled Mean Group (PMG) estimator developed by Pesaran et al. (1999), which allows all error variances and coefficients to differ across the groups, makes it possible to also look at the short-run coefficients for each country in the sample.
3.3. Data Sources
Annual data are used to estimate the determinants of malnutrition. These are drawn from different sources, including the World Development Indicators and the International Financial Statistic Food and Agriculture Organization (FAO, 2021). The data cover the period of 2000–2021, where 2000–2019 represents the period before COVID-19 and 2020–2021 represents the period during COVID-19. A sample of 34 countries representative of all regions in Africa is considered (Appendix A Table A1). The sample size and period coverage are determined by data availability, given the constraints of existing data sources. The reliability of data on the prevalence of undernourishment makes it difficult to expand the study period to include the pre-2000 years. But, because of some differences with current data, the FAO slightly revised the technique used to quantify undernourishment with the definition of Agenda 2030 and the related indicators. As a result, pre-2000 figures are no longer reported.
As concerns the prevalence of undernourishment (PoU), it has been calculated daily for almost every country in the world over decades by the FAO, thus allowing for standardized comparisons over time and within and across countries. The FAO platform provides a daily overview of the evolution of COVID-19, aggregating caseloads by country income groups and regions, alongside a summary of how food security changes using remote near-real-time monitoring systems. Data for estimating the ARDL panel model covered 16 months from December 2020 to the end of March 2022. The data were obtained from the WFP’s Hunger Map portal2 (https://hungermap.wfp.org/) and from the Trading Economics portal (https://tradingeconomics.com/countries (accessed on 2 April 2022)). The sample comprised nineteen (19) countries for which monthly data on the considered variables were available (Appendix A Table A4).
4. Results and Discussion
4.1. Interactions Between the Prevalence of Undernourishment, Food Price Inflation, and the Number of COVID-19 Confirmed Cases
Figure 2 and Figure 3 are constructed from the sample of nineteen (19) countries based on monthly data. The interaction between the prevalence of undernourishment and the food production index indicates a declining trend between the two variables, reinforcing the notion that agricultural production is a key determinant of malnutrition. Regarding the relationship between food price inflation and the prevalence of undernourishment, Figure 2 displays a slightly increasing trend, indicating that as food prices increase, the number of people undernourished rises. Inflation is on the rise throughout the world, with food prices driving the trend in sub-Saharan Africa more than anything else. In Zimbabwe, the situation is worrying with high levels of food inflation.
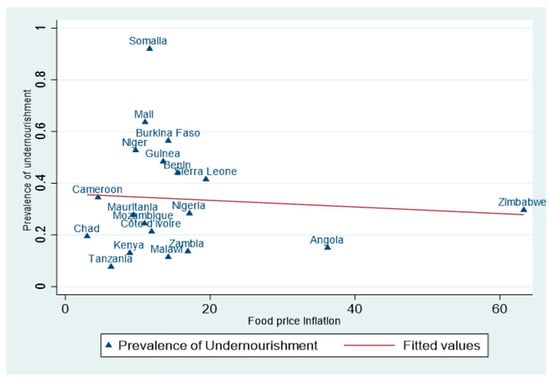
Figure 2.
Prevalence of undernourishment measured as a percentage of population (y axis) and food price inflation (x axis) from December 2020 to March 2022. Source: authors’ construction.
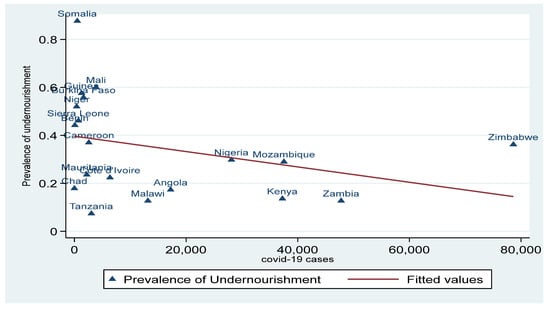
Figure 3.
Prevalence of undernourishment measured as a percentage of population (y axis) and COVID-19 confirmed cases (x axis) from December 2020 to March 2022. Source: authors’ construction.
Regarding the relationship between the prevalence of undernourishment and confirmed COVID-19 cases from December 2020 to March 2022 (Figure 3), Somalia, Burkina Faso, and Mali exhibit both a high prevalence of undernourishment and a low number of confirmed COVID-19 cases. Conversely, Zambia demonstrates a low prevalence of undernourishment alongside a high number of confirmed cases. The remaining countries display a high prevalence of undernourishment coupled with a relatively high number of confirmed COVID-19 cases.
However, all these relationships remain descriptive, thus requiring a deeper analysis based on econometric evaluations.
4.2. Determinants of Malnutrition in a COVID-19 Environment
Table 1 displays the descriptive statistics of the variables of the annual panel model. From 2001 to 2021, the highest prevalence of undernourishment on average is observed in the Central African Republic, followed by the Democratic Republic of Congo and Liberia. Malnutrition is a major public health challenge in the Central African Republic, where individuals affected by violent conflicts require substantial protection. In both the Democratic Republic of Congo and Liberia, hunger and violence are mutually reinforcing, with the former experiencing prolonged armed conflict and displacement for 25 years, while the latter saw worsening malnutrition during its civil conflict, further exacerbated by the 2014–2016 Ebola outbreak (Kumeh et al., 2020). The lowest values of the prevalence of undernourishment are observed in South Africa and Mauritania.

Table 1.
Descriptive characteristics of the variables.
The correlation matrix was used to test for the presence of multicollinearity among the regressors, which could affect the reliability of the results. In Table 2, the results imply that the presence of multicollinearity among the regressors is low, using the general benchmark of 0.7 as the cut-off point.
Table 2.
Correlation matrix.
Table 3 presents the estimation results alongside the Hausman test outcome, which justified the selection of the fixed-effects model over the random-effects model. In Model 1, all explanatory variables are included except the COVID-19 dummy variable. Model 2 incorporates the COVID-19 dummy, while Model 3 introduces an interaction term. Model 4 examines regional differences within Africa.
Table 3.
Estimation results of the determinants of malnutrition in a COVID-19 environment.
The coefficients of per-capita real GDP, food production index, and population growth rate are significant across the first four specifications. The negative coefficients of per-capita GDP suggest that a one percent increase in income per capita leads to a decrease in the prevalence of undernourishment by 0.17% to 0.22% (models 1 to 4). As expected, as populations’ wealth rises, they have more access to food and are less food insecure. These findings are in line with those of Sassi (2015) and Kaur and Kaur (2017), who found that income has a significant impact on nutrition, and that the higher a household’s income, the greater its access to food. The logarithm of per-capita GDP is a measure of the level of development in countries; therefore, the persistent significant coefficient across the four equations confirms that it represents a strong reducing factor of malnutrition (Dia Kamgnia, 2011).
The coefficients of the food production index also indicate that a one percent increase in food production index decreases the prevalence of undernourishment by 0.66%. This finding is consistent with the conclusions of Kaur and Kaur (2017), Sassi (2015), and Sacks and Levi (2010), who also showed that food produced locally is more accessible to the population, and that greater domestic food production will help promote access to food and reduce food insecurity in SSA.
The coefficient of population growth is positive and significant, indicating that demographic pressure is indeed a factor that increases the prevalence of undernourishment, as found by Saccone (2021).
The COVID-19 dummy in model 2 is not significant. However, when interaction variables are introduced in the regression, only the coefficient of the interaction between COVID-19 and household consumption expenditures is positive and significant (model 3). The coefficient of household consumption is still negative. This indicates that consumption has a decreasing effect on the prevalence of undernourishment, yet at a lower rate. The overall effect of household consumption in the presence of COVID-19 is obtained as follows:
The sign of that effect indicates that COVID-19 hinders the ability of household consumption to reduce the prevalence of undernourishment. In model 4, the coefficients of central and eastern Africa were revealed to be positive. Compared to the West African region, Central and Eastern African countries are in more distress regarding hunger. According to the 2020 Africa Regional Overview of Food Security and Nutrition, the prevalence of undernourishment has for the past years been highest in Eastern Africa and Central Africa, indicating persistent constraints in terms of availability and access to food. However, over the 2014–2018 period, the trend in the prevalence of hunger worsened the most in Western and Central Africa, for the most part due to conflicts, climate extremes, and economic slowdowns, sometimes combined.
4.3. Short- and Long-Term Effects of COVID-19 on Malnutrition
One of the key transmission channels through which COVID-19 affected malnutrition was food prices, which rose due to a decline in food supply coupled with sustained pressure on food demand. Consequently, food price inflation was included as a second variable of interest in the model. The descriptive characteristics of the considered variables are presented in Table 4.
Table 4.
Descriptive characteristics of the variables.
Firstly, properties like the presence of the unit root in panel data were checked using suitable stationarity tests of the variables (Table 5). Then, a cross-sectional dependence test was performed as many cross-sections were grouped together in the panel data (Table 6). Assuming cross-sectional independence is indeed an extreme hypothesis. The first generation of panel unit root tests (LLC, IPS) assumed that countries were independent, while some heterogeneity across countries was admitted. Of course, first-generation panel unit root tests can perform poorly with cross-sectional dependence (CD). Thus, a cross-sectional dependence test was performed, using the most common test, which is Pesaran’s CD test. The null hypothesis H0 was that there was cross-sectional independence. The results in Table 5 show that the null hypothesis was rejected for variables related to the number of COVID-19 confirmed cases and the prevalence of undernourishment, whereas food price inflation was found to be cross-sectionally independent. Thereafter, the second generation of panel unit root tests, admitting some dependence among individuals, was performed.
Table 5.
First-generation unit root tests.
Table 6.
Cross-sectional dependence test.
The first-generation unit root tests indicated that the variables in the model were stationary at that level; however, these tests assumed cross-country independence. To account for potential cross-sectional dependence, the cross-sectionally augmented Dickey–Fuller (CADF) test by Pesaran (2007), a second-generation panel unit root test, was conducted (Table 7). The results suggested that all variables in the model were integrated of order one, thereby allowing for an assessment of cointegration (long-run relationship) among the considered variables.
Table 7.
Second-generation Pesaran’s unit root test.
The long-run relationship between the variables was examined using the Pedroni (1999, 2004) and Westerlund (2005) cointegration tests, which account for cross-sectional dependence in the cointegration equation. Both tests share a common null hypothesis of no cointegration, while the alternative hypothesis of the Pedroni test asserts that the variables are cointegrated across all panels. The test statistics consistently rejected the null hypothesis of no cointegration (Table 8 and Table 9), indicating the presence of a long-run relationship between the prevalence of malnutrition, the number of confirmed COVID-19 cases, and food price inflation.
Table 8.
Pedroni cointegration test.
Table 9.
Westerlund test for cointegration.
Once the variables were confirmed to be cointegrated, the next step involved estimating the long-run coefficients using the Pooled Mean Group (PMG) estimator, followed by estimation with the Dynamic Fixed Effects (DFE) estimator. The PMG estimator, introduced by Pesaran et al. (1999), imposes homogeneity on the long-run slope coefficients across countries while allowing the short-run coefficients (including the speed of adjustment) and the regression intercept to vary by country. In contrast, the DFE estimator assumes homogeneity in the speed of adjustment, slope coefficients, and short-run dynamics across countries.
A key aspect to note is that the autoregressive distributed lag (ARDL) approach, particularly the PMG estimator, mitigates endogeneity concerns by incorporating lags for all variables (Pesaran et al., 1999). Table 10 presents the results of the PMG and DFE estimations. The short-run coefficients are not significant across the four specifications. This may be due to the analysis period, which covers a few months. Indeed, since the analysis was conducted with monthly data, the effects of COVID-19 on the prevalence of malnutrition may not be immediately noticeable. It is only after a few months that the effects of COVID-19 on variables such as undernutrition and nourishment can be felt. Arguments can be put forward to justify this finding. According to the High-Level Panel on Food Security and Nutrition (HLPE, 2020), the pandemic initially created a demand spike owing to panic buying and hoarding of food by consumers, which increased short-term food demand. Therefore, in the very short term, the pandemic may not have had negative effects on nutrition. However, over time, due to containment policies, business closures, and the resulting loss of jobs and income, the finding of negative effects on individuals’ ability to adequately feed themselves can be expected. Despite the similarities in the performance of both estimations, the Hausman test pointed to the PMG estimation as the best model.
Table 10.
ARDL estimation output.
The PMG estimator allows for short-run coefficients (including the speed of adjustment) and the regression intercept to be country-specific. Table A3 in Appendix A lists these coefficients. Food prices increase the prevalence of undernourishment in Angola, Benin, Cameroon, Chad, and Tanzania. In some countries like Angola, food prices were already high before the pandemic (AfDB, 2023). Mwamkonko (2023) demonstrated that fuel price increases significantly drove food inflation during and after the pandemic in Tanzania and Angola, largely due to COVID-19-induced movement restrictions and lockdowns. In countries such as Burkina Faso, Côte d’Ivoire, Guinea, Kenya, Malawi, Mali, Mauritania, Mozambique, Niger, Nigeria, Sierra Leone, Zambia, and Zimbabwe, the short-term coefficients are not significant. This finding can be attributed to several structural and contextual factors. In countries such as Angola, Benin, Cameroon, Chad, and Tanzania, food systems are more fragile and highly sensitive to disruptions in production, supply chains, and markets. The combined impact of rising food prices and COVID-19 cases likely exacerbates undernourishment in these countries because their food systems lack the resilience to absorb such shocks. Another critical factor is the varying levels of food price inflation across countries. In countries where food price inflation is already high, even small additional shocks, such as an increase in COVID-19 cases, can severely limit access to food, especially for low-income households. Policy responses to the pandemic further shaped these outcomes. Countries like Côte d’Ivoire and Nigeria implemented proactive measures such as food price controls, subsidies, or social protection programs, which cushioned the impact of food price increases during the pandemic. In contrast, countries like Angola and Benin, with limited government interventions or delayed responses, experienced more pronounced short-term effects on undernourishment. Finally, the baseline levels of undernourishment and the availability of data can explain these findings. Countries with more reliable and extensive data may have produced more precise estimates, whereas limited data availability in other countries could have obscured potential effects.
The DOLS and FMOLS regressions were performed for robustness checks. For each estimation, the first column presents the coefficients of the two explanatory variables of the model, and the second column displays the results when an interaction variable between food price and COVID-19 confirmed cases is introduced (Table 11).
Table 11.
FMOLS and DOLS estimation results.
The coefficient for COVID-19 confirmed cases is positive across most specifications, suggesting that an increase in COVID-19 cases is associated with higher malnutrition levels. The positive coefficient, ranging from 0.03 to 0.237, may reflect the disruptions caused by the pandemic, including supply chain interruptions, healthcare system strain, and economic downturns, which reduce food availability and affordability (Zurayk, 2020; Torero, 2020; Ihle et al., 2020). The positive coefficient for food price inflation over all the regressions indicates that rising food prices exacerbate malnutrition, as higher prices make food less accessible to vulnerable populations. An increase in food prices reduces consumers’ purchasing power and affects their ability to afford sufficient food (Durevall et al., 2013). The negative coefficient (−0.352 in the ARDL model) suggests that the compounded effect of food price inflation and COVID-19 reduces the isolated impact of either variable on malnutrition. This could imply a mitigating factor, possibly through heightened government interventions or international aid in response to the dual crises. However, in some specifications (FMOLS/DOLS), the interaction term’s lack of significance suggests that its role might not be robust across different contexts or estimation techniques. This study highlights the significant impact of food price inflation on malnutrition in sub-Saharan Africa, a finding that aligns with previous research (Reardon et al., 2020).
In the long term, addressing the structural issues that underpin food insecurity in sub-Saharan Africa is crucial. Barrett (2020) argued that building resilient food systems requires a multifaceted approach, including technological innovations, policy reforms, and international cooperation. Furthermore, ensuring stable food prices through market regulations and strategic food reserves can mitigate the impact of price volatility on malnutrition. Dekker (2020) suggested that stabilizing food prices should be a priority for governments, particularly in low-income countries where households spend a significant portion of their income on food. Since it has been revealed that food availability and access are key determinants to malnutrition, governments and stakeholders should invest in modern agricultural techniques, irrigation systems, and climate-resilient crops to boost food production. They should support smallholder farmers through subsidies, access to credit, and supply chain improvements. Furthermore, enhancing storage and distribution infrastructure to reduce post-harvest losses could be a way to address food shortage.
This study expands on food security theories by linking pandemic-induced economic shocks to undernourishment in SSA. It supports supply-side vs. demand-side theories of food insecurity by showing that price surges affect both availability and access. As practical implications from the findings, governments should implement food price stabilization mechanisms to buffer against future crises. Social protection programs (e.g., cash transfers) must be adaptive to economic shocks. Future research can explore subnational variations in food security by using geospatial data and household-level surveys. This study also highlights the need for real-time food price tracking to improve policy responses in crises. Future work could use machine learning techniques to predict food price fluctuations. The long-term impact of economics shocks on nutritional security should be explored, particularly on vulnerable populations such as children, pregnant women, and the elderly. Studies using the effects of income disruptions on food choices, meal frequency, and reliance on lower-quality diets in Africa to help design targeted interventions have been performed by Eftimov et al. (2020) and Timpanaro and Cascone (2022). Additionally, work examining the resilience and adaptation of food systems to crisis-induced disruptions is crucial, particularly the role of local food production, digital food markets, and community-based initiatives, in ensuring food security.
5. Conclusions
Malnutrition remains a widespread phenomenon throughout sub-Saharan Africa and is a real challenge for governments. It was exacerbated by the COVID-19 pandemic, which spread rapidly and widely worldwide from late 2019. The results from this study indicated that a rise in the number of COVID-19 cases led to a significant increase in the prevalence of undernourishment. This study contributes to the existing literature by examining the potential effects of the COVID-19 pandemic on hunger and malnutrition in sub-Saharan Africa amidst rising food prices. The analysis is based on a panel model using annual data and a monthly panel autoregressive distributed lag (ARDL) model, over the period of 2000–2021. Several significant findings emerged from this research.
First, this study confirms that the primary determinants of undernourishment prevalence in sub-Saharan Africa are food availability and access. This is evidenced by the significantly negative effect of the food production index across all estimations. Similarly, per-capita income and household consumption expenditures, which influence food accessibility, exhibit significant negative effects. The findings further indicate that the COVID-19 pandemic, through mobility restrictions and their adverse impact on economic activities, poses a substantial threat to these factors. Notably, when an interaction term between household consumption expenditures and a COVID-19 dummy variable is introduced into the model, the overall effect of consumption expenditures is diminished. Moreover, this study establishes the existence of a long-run cointegration relationship between the number of COVID-19 cases, food prices, and the prevalence of undernourishment. The Pooled Mean Group estimation demonstrates that an increase in food prices has a positive and significant effect on undernourishment in sub-Saharan Africa, a finding further corroborated by Fully Modified Ordinary Least Squares (FMOLS) estimations.
This study provides critical insights into how future external shocks, like pandemics, could affect food security and malnutrition. To address malnutrition amidst a potential future shock, countries must adopt targeted strategies including social protection programs and price stabilization mechanisms. These policies will include implementing subsidies or controlling price surges. Countries should invest in long-term health to reduce vulnerabilities.
A major constraint in this study was the availability of data. The monthly data gathered by some institutions, namely the World Food Program through Hunger Map, were not available for many sub-Saharan countries. Another limitation is aggregation bias, as using national-level data may mask regional disparities. For example, food insecurity in rural Chad differs significantly from urban Nigeria, but national averages do not reflect this granularity. Another concern is also related to data gaps, particularly for real-time food price monitoring in SSA, which led to reliance on interpolated data from the FAO and WFP Hunger Map.
Author Contributions
Conceptualization, B.D.K. and K.D.N.; methodology, B.D.K. and K.D.N.; formal analysis; data curation, B.D.K. and K.D.N.; writing—original draft preparation, B.D.K. and K.D.N.; writing—review and editing, B.D.K.; supervision, B.D.K.; project administration, B.D.K.; funding acquisition. All authors have read and agreed to the published version of the manuscript.
Funding
This research was supported by a funding from the African Economic Research Consortium (AERC) under the grant number RC21534.
Institutional Review Board Statement
Not applicable.
Informed Consent Statement
Not applicable.
Data Availability Statement
The datasets used and/or analyzed during the current study are available from the corresponding author on reasonable request.
Conflicts of Interest
No potential conflict of interest was reported by the author(s).
Appendix A
Table A1.
List of countries with annual data.
Table A1.
List of countries with annual data.
| Western Africa | Central Africa | Eastern Africa | Southern Africa |
|---|---|---|---|
| Benin | Cameroon | Ethiopia | Eswatini |
| Burkina Faso | Chad | Kenya | Botswana |
| Cabo Verde | Congo Republic-Brazaville | Malawi | Mozambique |
| Côte d’Ivoire | Democratic Republic of Congo | Madagascar | Namibia |
| Ghana | Gabon | Rwanda | South Africa |
| Liberia | Angola | Tanzania | Lesotho |
| Mali | Rwanda | Sudan | |
| Mauritania | Sao Tome | ||
| Nigeria | |||
| Senegal | |||
| Sierra Leone | |||
| Gambia | |||
| Togo |
Source: Authors’ compilation.
Table A2.
List of countries with monthly data.
Table A2.
List of countries with monthly data.
| Angola | Benin | Burkina Faso | Cameroon |
| Chad | Cote d’Ivoire | Guinea | Mozambique |
| Kenya | Mali | Mauritania | Somalia |
| Niger | Nigeria | Sierra Leone | Malawi |
| Tanzania | Zambia | Zimbabwe |
Source: Authors’ compilation.
Table A3.
Short-run country-specific coefficients.
Table A3.
Short-run country-specific coefficients.
| Variables | No Interaction Between Food Price and COVID-19 Cases | Food Price and COVID-19 Cases’ Interaction | |
|---|---|---|---|
| Angola | |||
| Speed of adjustment | −0.252 | −0.047 | |
| (0.173) | (0.055) | ||
| Short-run coefficients | |||
| D (COVID-19 confirmed cases) | 0.015 | 9.621 *** | |
| (0.024)) | (2.977) | ||
| D (Food price inflation) | −1.04 | 24.224 *** | |
| (1.843) | (7.968) | ||
| D (Food price inflation * COVID-19) | −2.677 *** | ||
| (0.831) | |||
| Constant | −0.741 | −0.522 | |
| (0.521) | (0.552) | ||
| Benin | |||
| Speed of adjustment | −0.092 | −0.037 * | |
| (0.0701601) | (0.021) | ||
| Short-run coefficients | |||
| D (COVID-19 confirmed cases) | 0.013 | 0.111 ** | |
| (0.0133) | (0.043) | ||
| D (Food price inflation) | −0.027 | 0.277 ** | |
| (0.0286) | (0.134) | ||
| D (Food price inflation * COVID-19) | −0.048 ** | ||
| (0.020) | |||
| Constant | −0.133 | −0.283 | |
| (0.103) | (0.155) | ||
| Burkina Faso | |||
| Speed of adjustment | −0.045 | −0.010 | |
| (0.083) | (0.021) | ||
| Short-run coefficients | |||
| D (COVID-19 confirmed cases) | −0.016 | −0.072 | |
| (0.01194) | (0.070) | ||
| D (Food price inflation) | 0.105 | −0.012 | |
| (0.0637) | (0.162) | ||
| D (Food price inflation * COVID-19) | 0.025 | ||
| (0.029) | |||
| Constant | −0.070 | −0.095 | |
| (0.108) | (0.163) | ||
| Cameroon | |||
| Speed of adjustment | −0.173 | −0.161 ** | |
| (0.089) | (0.064) | ||
| Short-run coefficients | |||
| D (COVID-19 confirmed cases) | 0.023 | 0.477 ** | |
| (0.025) | (0.235) | ||
| D (Food price inflation) | 0.454** | 3.074 ** | |
| (0.193) | (1.385) | ||
| D (Food price inflation * COVID-19) | −0.323 ** | ||
| (0.156) | |||
| Constant | −0.281 | −1.312 ** | |
| (0.185) | (0.568) | ||
| Chad | |||
| Speed of adjustment | −0.178 * | −0.004 | |
| (0.100) | (0.006) | ||
| Short-run coefficients | |||
| D (COVID-19 confirmed cases) | 0.018 | 0.042 *** | |
| (0.014) | (0.012) | ||
| D (Food price inflation) | 0.006 | 0.132 *** | |
| (0.022) | (0.047) | ||
| D (Food price inflation * COVID-19) | −0.021 ** | ||
| (0.009) | |||
| Constant | −0.330 | 0.006 | |
| (0.205) | (0.035) | ||
| Cote d’Ivoire | |||
| Speed of adjustment | −0.262 * | −0.255 *** | |
| (0.140) | (0.0878) | ||
| Short-run coefficients | |||
| D (COVID-19 confirmed cases) | −0.003 | −0.015 | |
| (0.014) | (0.054) | ||
| D (Food price inflation) | 0.003 | −0.032 | |
| (0.090) | (0.224) | ||
| D (Food price inflation * COVID-19) | 0.004 | ||
| (0.025) | |||
| Constant | −0.629 * | −2.304 *** | |
| (0.342) | (0.721) | ||
| Guinea | |||
| Speed of adjustment | −0.594 ** | −0.435 *** | |
| (0.263) | (0.118) | ||
| Short-run coefficients | |||
| D (COVID-19 confirmed cases) | 0.016 | 0.154 | |
| (0.017) | (0.328) | ||
| D (Food price inflation) | −0.223 | 0.151 | |
| (0.256) | (0.923) | ||
| D (Food price inflation * COVID-19) | −0.038 | ||
| (0.123) | |||
| Constant | −1.004 ** | −3.815 *** | |
| (0.447) | (0.810) | ||
| Kenya | |||
| Speed of adjustment | −1.108 *** | −1.369 *** | |
| (0.234) | (0.199) | ||
| Short-run coefficients | |||
| D (COVID-19 confirmed cases) | −0.007 | −0.068 | |
| (0.021) | (0.265) | ||
| D (Food price inflation) | −0.085 | −0.155 | |
| (0.289) | (1.145) | ||
| D (Food price inflation * COVID-19) | 0.021 | ||
| (0.120) | |||
| Constant | −3.082 *** | −13.037 *** | |
| (0.669) | (3.051) | ||
| Malawi | |||
| Speed of adjustment | −0.180 | −0.163 | |
| (0.114) | (0.099) | ||
| Short-run coefficients | |||
| D (COVID-19 confirmed cases) | 0.001 | −0.280 | |
| (0.019) | (0.412) | ||
| D (Food price inflation) | 0.060 | −1.114 | |
| (0.604) | (1.841) | ||
| D (Food price inflation * COVID-19) | (0.115) | ||
| (0.165) | |||
| Constant | −0.519 * | −1.578 | |
| (0.313) | (0.967) | ||
| Mali | |||
| Speed of adjustment | −0.055 | −0.001 | |
| (0.080) | (0.016) | ||
| Short-run coefficients | |||
| D (COVID-19 confirmed cases) | 0.012 | 0.005 | |
| (0.008) | (0.032) | ||
| D (Food price inflation) | 0.020 | 0.015 | |
| (0.025) | (0.094) | ||
| D (Food price inflation * COVID-19) | 0.003 | ||
| (0.015) | |||
| Constant | −0.052 | 0.012 | |
| (0.096) | (0.118) | ||
| Mauritania | |||
| Speed of adjustment | −0.160 | −0.142 ** | |
| (0.166) | (0.067) | ||
| Short-run coefficients | |||
| D (COVID-19 confirmed cases) | −0.013 | −0.072 | |
| (0.016) | (0.094) | ||
| D (Food price inflation) | 0.035 | −0.251 | |
| (0.169) | (0.445) | ||
| D (Food price inflation * COVID-19) | 0.030 | ||
| (0.044) | |||
| Constant | −0.346 | −1.214 ** | |
| (0.391) | (0.535) | ||
| Mozambique | |||
| Speed of adjustment | −0.422 | −0.180 | |
| (0.241) | (0.251) | ||
| Short-run coefficients | |||
| D (COVID-19 confirmed cases) | −0.012 | −0.397 | |
| (0.014) | (0.320) | ||
| D (Food price inflation) | −0.189 | −1.493 | |
| (0.251) | (1.165) | ||
| D (Food price inflation * COVID-19) | 0.167 | ||
| (0.138) | |||
| Constant | −0.858 | −1.579 | |
| (0.500) | (2.224) | ||
| Niger | |||
| Speed of adjustment | −0.541 ** | −0.345 *** | |
| (0.180) | (0.103) | ||
| Short-run coefficients | |||
| D (COVID-19 confirmed cases) | −0.059 ** | 0.756 | |
| (0.028) | (0.603) | ||
| D (Food price inflation) | 0.007 | 1.932 | |
| (0.159) | (1.540) | ||
| D (Food price inflation * COVID-19) | −0.360 | ||
| (0.266) | |||
| Constant | −0.779 *** | −2.802 *** | |
| (0.266) | (0.784) | ||
| Nigeria | |||
| Speed of adjustment | −0.191 ** | −0.026 | |
| (0.087) | (0.041) | ||
| Short-run coefficients | |||
| D (COVID-19 confirmed cases) | 0.005 | −0.048 | |
| (0.008) | (0.256) | ||
| D (Food price inflation) | −0.323 | 0.128 | |
| (0.393) | (0.774) | ||
| D (Food price inflation * COVID-19) | 0.020 | ||
| (0.087) | |||
| Constant | −0.446 ** | −0.217 | |
| (0.217) | (0.379) | ||
| Sierra Leone | |||
| Speed of adjustment | −0.240 | 0.026 | |
| (0.150) | (0.047) | ||
| Short-run coefficients | |||
| D (COVID-19 confirmed cases) | −0.007 | 0.098 | |
| (0.008) | (0.257) | ||
| D (Food price inflation) | −0.141 | 0.028 | |
| (0.115) | (0.419) | ||
| D (Food price inflation * COVID-19) | −0.035 | ||
| (0.088) | |||
| Constant | −0.414 | 0.241 | |
| (0.257) | (0.436) | ||
| Somalia | |||
| Speed of adjustment | −0.255 *** | −0.057 *** | |
| (0.057) | (0.017) | ||
| Short-run coefficients | |||
| D (COVID-19 confirmed cases) | 0.002 | −0.041 | |
| (0.012) | (0.120) | ||
| D (Food price inflation) | −0.025 ** | −0.183 | |
| (0.010) | (0.204) | ||
| D (Food price inflation * COVID-19) | 0.021 ** | ||
| (0.012) | |||
| Constant | −0.225 *** | −0.368 *** | |
| (0.053) | (0.096) | ||
| Tanzania | |||
| Speed of adjustment | −0.223 ** | −0.073 ** | |
| (0.101) | (0.028) | ||
| Short-run coefficients | |||
| D (COVID-19 confirmed cases) | −(0.001) | 0.117 ** | |
| (0.008) | (0.056) | ||
| D (Food price inflation) | 0.028 | 0.881 ** | |
| (0.089) | (0.356) | ||
| D (Food price inflation * COVID-19) | −0.087 ** | ||
| (0.038) | |||
| Constant | −0.686 ** | −0.709 *** | |
| (0.310) | (0.230) | ||
| Zambia | |||
| Speed of adjustment | −0.478 | −0.012 | |
| (0.214) | (0.103) | ||
| Short-run coefficients | |||
| D (COVID-19 confirmed cases) | −0.024 | −0.275 | |
| (0.022) | (0.463) | ||
| D (Food price inflation) | −0.126 | −0.675 | |
| (0.357) | (1.426) | ||
| D (Food price inflation * COVID-19) | 0.083 | ||
| (0.145) | |||
| Constant | −1.465 ** | −0.094 | |
| (0.675) | (1.018) | ||
| Zimbabwe | |||
| Speed of adjustment | −0.024 | 0.003 | |
| (0.131) | (0.019) | ||
| Short-run coefficients | |||
| D (COVID-19 confirmed cases) | 0.004 | 0.150 | |
| (0.015) | (0.085) | ||
| D (Food price inflation) | 0.013 | 0.307 | |
| (0.111) | (0.199) | ||
| D (Food price inflation * COVID-19) | −0.031 * | ||
| (0.018) | |||
| Constant | −0.071 | 0.027 | |
| (0.351) | (0.192) |
Notes: Values in parentheses are the standard errors. *, **, and *** indicate significance level at 10%, 5%, and 1%, respectively. Source: authors’ compilations.
Table A4.
Definitions of variables and data sources.
Table A4.
Definitions of variables and data sources.
| Variable | Definition | Data Source | |
|---|---|---|---|
| Annual data | Prevalence of undernourishment (% of population) | Percentage of the population at risk of not meeting the food requirements for normal physical activity. | FAO (2021) |
| Food production index | This gross per-capita index expresses the relative level of the aggregate volume of food production for each year in comparison with the base period of 2004–2006. | World development indicators, https://databank.worldbank.org/source/world-development-indicators. Accessed on 2 April 2022 | |
| GDP per capita (constant 2010 US dollars) | Gross domestic product divided by midyear population. Data are in constant 2005 US dollars. | World development indicators, https://databank.worldbank.org/source/world-development-indicators. Accessed on 2 April 2022 | |
| Household consumption expenditure (% of GDP) | Formerly private consumption, this is the market value of all goods and services, including durable products (such as cars, washing machines, and home computers), purchased by households. | World development indicators, https://databank.worldbank.org/source/world-development-indicators. Accessed on 2 April 2022 | |
| Consumer price index inflation | Average change over time in the prices of goods and services that a typical household consumes, such as food, beverages, tobacco, clothing, housing, fuels, household appliances, transport, health, and telecommunications. | World development indicators, https://databank.worldbank.org/source/world-development-indicators. Accessed on 2 April 2022 | |
| Population growth rate | World development indicators, https://databank.worldbank.org/source/world-development-indicators. Accessed on 2 April 2022 | ||
| Employment in agriculture (% of total employment) | World development indicators, https://databank.worldbank.org/source/world-development-indicators#. Accessed on 2 April 2022 | ||
| Monthly data | Prevalence of undernourishment | WFP’s hunger map, 2021/ https://hungermap.wfp.org/ (accessed on 2 April, 2022). | |
| Number of confirmed COVID-19 cases | https://www.worldometers.info/coronavirus/#countries (accessed on 2 April, 2022). | ||
| Food price inflation | https://tradingeconomics.com/countries (accessed on 2 April, 2022). | ||
Source: Authors’ compilations.
Notes
| 1 | Hunger is measured using the prevalence of undernourishment (PoU), as indicated by the FAO (2021). |
| 2 | Hunger Map LIVE is a critical and global public good, made available by the World Food Program. It is a near-real-time food security monitoring platform, which collects daily food security information using live calls conducted through call centers. It provides information covering population density, nightlight intensity, rainfall, vegetation index, conflict, market prices, macroeconomic indicators, and undernourishment. Food security, currency exchanges, inflation, and nutrition are among the many topics the interactive map offers information on. However, these data were not available for all Sub-Sahara African countries between January 2020 and September 2021, which was the initial period this study was intended to cover. Also, while a handful of the continuous monitoring systems pre-date this time period, many were implemented in the months after Hunger Map LIVE was launched (September 2019) and during the COVID-19 pandemic. In addition, the collection of the historical data on the site proved to be quite complex because the platform presents only the data of the current day. |
References
- Adjognon, G. S., Bloem, J. R., & Sanoh, A. (2021). The coronavirus pandemic and food security: Evidence from Mali. Food Policy, 101, 102050. [Google Scholar] [CrossRef] [PubMed]
- African Development Bank (AfDB). (2023). Mobilizing private sector financing for climate and green growth in Africa. African Development Bank/Organization for Economic Cooperation and Development/United Nations Development Programme. [Google Scholar]
- Agyei, S. K., Isshaq, Z., Frimpong, S., Adam, A. M., Bossman, A., & Asiamah, O. (2021). COVID-19 and food prices in sub-Saharan Africa. African Development Review, 33, S102–S113. [Google Scholar] [CrossRef]
- Baldwin, R. E., & Tomiura, E. (2020). Thinking ahead about the trade impact of COVID-19. In Economics in the time of COVID-19 (pp. 59–71). Centre for Economic Policy Research. [Google Scholar]
- Barrett, C. B. (2020). Actions now can curb food systems fallout from COVID-19. Nature Food, 1(6), 319–320. [Google Scholar] [CrossRef]
- Béné, C. (2020). Resilience of local food systems and links to food security—A review of some important concepts in the context of COVID-19 and other shocks. Food Security, 12(4), 805–822. [Google Scholar] [CrossRef] [PubMed]
- Bread for the World. (2020). Annual report. Available online: https://www.bread.org/sites/default/files/bread_for_the_world_2020_annual_report.pdf (accessed on 13 June 2021).
- Carlsson-Szlezak, P., Reeves, M., & Swartz, P. (2020). What coronavirus could mean for the global economy. Harvard Business Review, 3(10), 1–10. [Google Scholar]
- Clapp, J., & Moseley, W. G. (2020). This food crisis is different: COVID-19 and the fragility of the neoliberal food security order. The Journal of Peasant Studies, 47(7), 1393–1417. [Google Scholar] [CrossRef]
- Dekker, B. (2020). The impact of COVID-19 measures on Indonesian value chains. Clingendael Institute. Available online: http://www.jstor.org/stable/resrep25674 (accessed on 20 June 2021).
- Devereux, S., Béné, C., & Hoddinott, J. (2020). Conceptualising COVID-19’s impacts on household food security. Food Security, 12(4), 769–772. [Google Scholar] [CrossRef]
- Dia Kamgnia, B. (2011). Political economy of recent global food price shocks: Gainers, losers and compensatory mechanism. Journal of African Economies, 20(S1), i142–i210. [Google Scholar] [CrossRef]
- Durevall, D., Loening, J. L., & Birru, Y. A. (2013). Inflation dynamics and food prices in Ethiopia. Journal of Development Economics, 104, 89–106. [Google Scholar] [CrossRef]
- Eftimov, T., Popovski, G., Petković, M., Seljak, B. K., & Kocev, D. (2020). COVID-19 pandemic changes the food consumption patterns. Trends in Food Science & Technology, 104, 268–272. [Google Scholar]
- Erokhin, V., & Gao, T. (2020). Impacts of COVID-19 on trade and economic aspects of food security: Evidence from 45 developing countries. International Journal of Environmental Research and Public Health, 17, 5775. [Google Scholar] [CrossRef] [PubMed]
- Ezirigwe, J., Ojike, C., Amechi, E., & Adewopo, A. (2021). ‘COVID-19/food insecurity syndemic’: Navigating the realities of food security imperatives of sustainable development goals in Africa. Law and Development Review, 14(1), 129–162. [Google Scholar] [CrossRef]
- FAO. (2021). Price changes by countries. Available online: http://www.fao.org/datalab/website/web/food-prices (accessed on 13 August 2021).
- FAO, AUC, ECA and WFP. (2023). Africa–Regional overview of food security and nutrition 2023: Statistics and trends. Accra, FAO. [Google Scholar] [CrossRef]
- FAO, IFAD, UNICEF, WFP & WHO. (2024). The state of food security and nutrition in the world 2024—Financing to end hunger, food insecurity and malnutrition in all its forms. Available online: https://www.fao.org/publications/fao-flagship-publications/the-state-of-food-security-and-nutrition-in-the-world/en (accessed on 3 January 2025).
- HLPE. (2020). Impacts of COVID-19 on food security and nutrition: Developing effective policy responses to address the hunger and malnutrition pandemic. HLPE. Available online: https://openknowledge.fao.org/server/api/core/bitstreams/8abcbe13-833e-4658-a339-4e3be593b66e/content (accessed on 13 June 2021).
- Ihle, R., Rubin, O. D., Bar-Nahum, Z., & Jongeneel, R. (2020). Imperfect food markets in times of crisis: Economic consequences of supply chain disruptions and fragmentation for local market power and urban vulnerability. Food Security, 12(4), 727–734. [Google Scholar] [CrossRef] [PubMed]
- Kaur, B., & Kaur, M. H. (2017). Association between malnutrition and depression among elderly of selected rural area of district Faridkot, Punjab. International Journal of Community Health & Medical Research, 3(1). [Google Scholar] [CrossRef]
- Kumeh, O. W., Fallah, M. P., Desai, I. K., Gilbert, H. N., Silverstein, J. B., Beste, S., Beste, J., Mukherjee, J. S., & Richardson, E. T. (2020). Literacy is power: Structural drivers of child malnutrition in rural Liberia. BMJ Nutrition, Prevention, Health, 3(2), 295–307. [Google Scholar] [CrossRef] [PubMed] [PubMed Central]
- Laborde, D., Martin, W., Swinnen, J., & Vos, R. (2020). COVID-19 risks to global food security. Science, 369(6503), 500–502. [Google Scholar] [CrossRef] [PubMed]
- Lu, J., Gu, J., Li, K., Xu, C., Su, W., Lai, Z., Zhou, D., Yu, C., Xu, B., & Yang, Z. (2020). COVID-19 outbreak associated with air conditioning in restaurant, Guangzhou, China, 2020. Emerging Infectious Diseases, 26(7), 1628. [Google Scholar] [CrossRef]
- Mohamed, E. M. A., Abdallah, S. M. A., Ahmadi, A., & Lucero-Prisno, D. E., III. (2021). Food security and COVID-19 in Africa: Implications and recommendations. The American Journal of Tropical Medicine and Hygiene, 104(5), 1613. [Google Scholar] [CrossRef]
- Mwamkonko, M. A. (2023). The relative effectiveness of monetary policy transmission channels in Tanzania: Empirical lesson for post COVID-19 recovery. African Journal of Economic Review, 11(1), 65–82. [Google Scholar]
- Pedroni, P. (1999). Critical values for cointegration tests in heterogeneous panels with multiple regressors. Oxford Bulletin of Economics and statistics, 61(S1), 653–670. [Google Scholar] [CrossRef]
- Pedroni, P. (2004). Panel cointegration: Asymptotic and finite sample properties of pooled time series tests with an application to the PPP hypothesis. Econometric Theory, 20(3), 597–625. [Google Scholar] [CrossRef]
- Pesaran, M. H. (2007). A simple panel unit root test in the presence of cross-section dependence. Journal of Applied Econometrics, 22(2), 265–312. [Google Scholar] [CrossRef]
- Pesaran, M. H., Shin, Y., & Smith, R. P. (1999). Pooled mean group estimation of dynamic heterogeneous panels. Journal of the American Statistical Association, 94(446), 621–634. [Google Scholar] [CrossRef]
- Reardon, T., Mishra, A., Nuthalapati, C. S., Bellemare, M. F., & Zilberman, D. (2020). COVID-19’s disruption of India’s transformed food supply chains. Economic and Political Weekly, 55(18), 18–22. [Google Scholar]
- Saccone, D. (2021). Can the COVID19 pandemic affect the achievement of the ‘Zero Hunger’ goal? Some preliminary reflections. The European Journal of Health Economics, 22, 1025–1038. [Google Scholar] [CrossRef] [PubMed]
- Sacks, A., & Levi, M. (2010). Measuring government effectiveness and its consequences for social welfare in sub-Saharan African countries. Social Forces, 88(5), 2325–2351. [Google Scholar] [CrossRef]
- Sassi, M. (2015). Seasonality and trends in child malnutrition: Time-series analysis of health clinic data from the Dowa district of Malawi. The Journal of Development Studies, 51(12), 1667–1682. [Google Scholar] [CrossRef]
- Stock, J. H., & Watson, M. W. (1993). A simple estimator of cointegrating vectors in higher order integrated systems. Econometrica: Journal of the Econometric Society, 783–820. [Google Scholar] [CrossRef]
- Terazono, E., & Munshi, N. (2020). Choc waves: How coronavirus shook the cocoa market. Financial Times, 30. [Google Scholar]
- Timpanaro, G., & Cascone, G. (2022). Food consumption and the Covid-19 pandemic: The role of sustainability in purchasing choices. Journal of Agriculture and Food Research, 10, 100385. [Google Scholar] [CrossRef]
- Torero, M. (2020). Without food, there can be no exit from the pandemic. Nature, 580(7805), 588–589. [Google Scholar] [CrossRef] [PubMed]
- Westerlund, J. (2005). A panel CUSUM test of the null of cointegration. Oxford Bulletin of Economics and Statistics, 67(2), 231–262. [Google Scholar] [CrossRef]
- Wieser, C., Alemayehu, A. A., Bundervoet, T., & Haile, A. (2020). Monitoring COVID-19 impacts on households in Ethiopia: Results from a high-frequency phone survey of households. World Bank. Available online: https://openknowledge.worldbank.org/handle/10986/33824 (accessed on 13 June 2021).
- World Bank. (2020). The impact of COVID-19 (coronavirus) on global poverty: Why sub-saharan Africa might be the region hardest hit. Data Blog. Available online: https://blogs.worldbank.org/en/opendata/impact-covid-19-coronavirus-global-poverty-why-sub-saharan-africa-might-be-region-hardest (accessed on 13 June 2021).
- Zurayk, R. (2020). Pandemic and food security: A view from the Global South. Journal of Agriculture, Food Systems, and Community Development, 9(3), 17–21. [Google Scholar] [CrossRef]
Disclaimer/Publisher’s Note: The statements, opinions and data contained in all publications are solely those of the individual author(s) and contributor(s) and not of MDPI and/or the editor(s). MDPI and/or the editor(s) disclaim responsibility for any injury to people or property resulting from any ideas, methods, instructions or products referred to in the content. |
© 2025 by the authors. Licensee MDPI, Basel, Switzerland. This article is an open access article distributed under the terms and conditions of the Creative Commons Attribution (CC BY) license (https://creativecommons.org/licenses/by/4.0/).