Abstract
This research investigates the multiplier effect of ferry transportation development on the medium-term economy of Samosir Island from 2016 to 2022. The study will provide insights into the implications of ferry transportation for the economies of rural or remote regions like Samosir Island. The analysis was conducted by comparing the multiplier effects before and after the development, utilizing the input–output approach, which encompassed the output multiplier, the multiplier on gross value added (GVA), and the household income multiplier. The findings from the input–output analysis indicate that the average output multiplier for 37 industries on Samosir Island has declined by 0.84% annually, with the average output multiplier recorded at 1.80 in 2016, decreasing to 1.71 by 2022. This suggests that, overall, the advancement of ferry transportation in the medium term is comparatively ineffective in promoting economic growth in rural or remote regions such as Samosir Island. Conversely, the average GVA multiplier rose by 1.04% annually. Similarly, the household income multiplier index experienced an increase of 1.91% each year. This indicates that ferry transportation seems to exert a notable influence on both GVA and the household income multiplier, albeit the effect is comparatively modest.
1. Introduction
The commuting lives of individuals and the growth of the economy are greatly influenced by transportation (Cowie, 2010). Transportation serves as the means of transferring people or goods from one location to another (Morlok & Hainim, 1985) or from the origin point to the final destination (Adisamita, 2011). It adds value to the movement of goods and services, providing place utility by relocating products from production sites to marketing locations, and time utility by ensuring that commodities are delivered precisely when required (Kamaluddin, 2003).
Land, water, and air transportation represent the three main categories of spatial or surface transportation (Rodrigue et al., 2013). Additionally, from a physiographic viewpoint, there are three fundamental components of transportation: rivers, lakes, and oceans. Each transportation mode offers distinct advantages and characteristics; its use can be adapted to align with a region’s global trade, transportation requirements, and geographical circumstances. Moreover, transportation is dynamic and can be modified to address community needs arising from scientific and technological advancements.
Transportation infrastructure promotes spatial interaction (Nakoinz, 2023) to enhance accessibility (OECD, 2002) and connectivity among regions (Rodrigue et al., 2013), which includes rural (Gharehbaghi et al., 2020) and archipelagic regions (Akustia et al., 2024), as well as facilitating connections between economic activity hubs or regional growth centers. Furthermore, transportation services simplify the movement of individuals and the distribution of goods to inland areas along rivers and remote locations separated by lakes (Solomon et al., 2021). The availability of transportation can boost productivity (Litman, 2018), enhance regional appeal (Pokharel et al., 2023), broaden business access to raw materials and markets (Polyzos & Tsiotas, 2020), extend marketing territories (Jinca, 2011), generate employment opportunities, and alleviate poverty (Leung & Choy, 2024); (Susantono, 2013). Nevertheless, the transportation sector plays a crucial role in the productivity of the manufacturing and industrial sectors, which are significantly interrelated (Mance et al., 2021). Therefore, the growth of the industrial sector, particularly the manufacturing segment, is positively influenced by the expansion of the industrial sector, especially the manufacturing sector.
The transportation infrastructure present in a region can alter land use (Xiao et al., 2024), elevate housing prices in urban areas (Soltani et al., 2024), and serve as a factor in foreign direct investment (Soto & Martinez-Cobas, 2024); additionally, the expansion of tourism is closely linked to the presence of transportation infrastructure (Button et al., 2010).
A new wave of technological innovation and industrial transformation has created fresh growth opportunities for nations across the globe (F. Liu et al., 2025), particularly within the transportation sector. Investment in and reengineering of transportation infrastructure will enhance accessibility and reduce congestion (Black, 2003), promote the development of economic agglomeration and labor mobility (Wan et al., 2024; Rosik & Wójcik, 2022), and boost the overall productivity of various business sectors (L. Liu et al., 2025), thereby making a substantial contribution to economic growth (Ma & Tang, 2024) and gross regional domestic income (Mudronja et al., 2020). The expansion of the transportation industry can serve as an indicator of a region’s economic development (Ralahalu et al., 2013). Nevertheless, not all transportation infrastructure services positively influence economic growth; rather, their impact varies based on the mode of transport, geographical location, infrastructure conditions, and timing. For instance, road transport infrastructure has a significant and beneficial effect on economic growth in Central and Eastern European Member States, whereas rail infrastructure tends to have a negative impact due to its inefficiency and obsolescence (Lenz et al., 2018).
There are various techniques available for evaluating the economic effects of transportation on the regional economy (Wang & Charles, 2010), such as cost–benefit analysis, macroeconomic assessments, input–output models, and the computable general equilibrium method. Input–output analysis is frequently employed to examine the interconnections among different sectors and their influence on the regional economy in the event of alterations in industrial input or output (Mayvani, 2022).
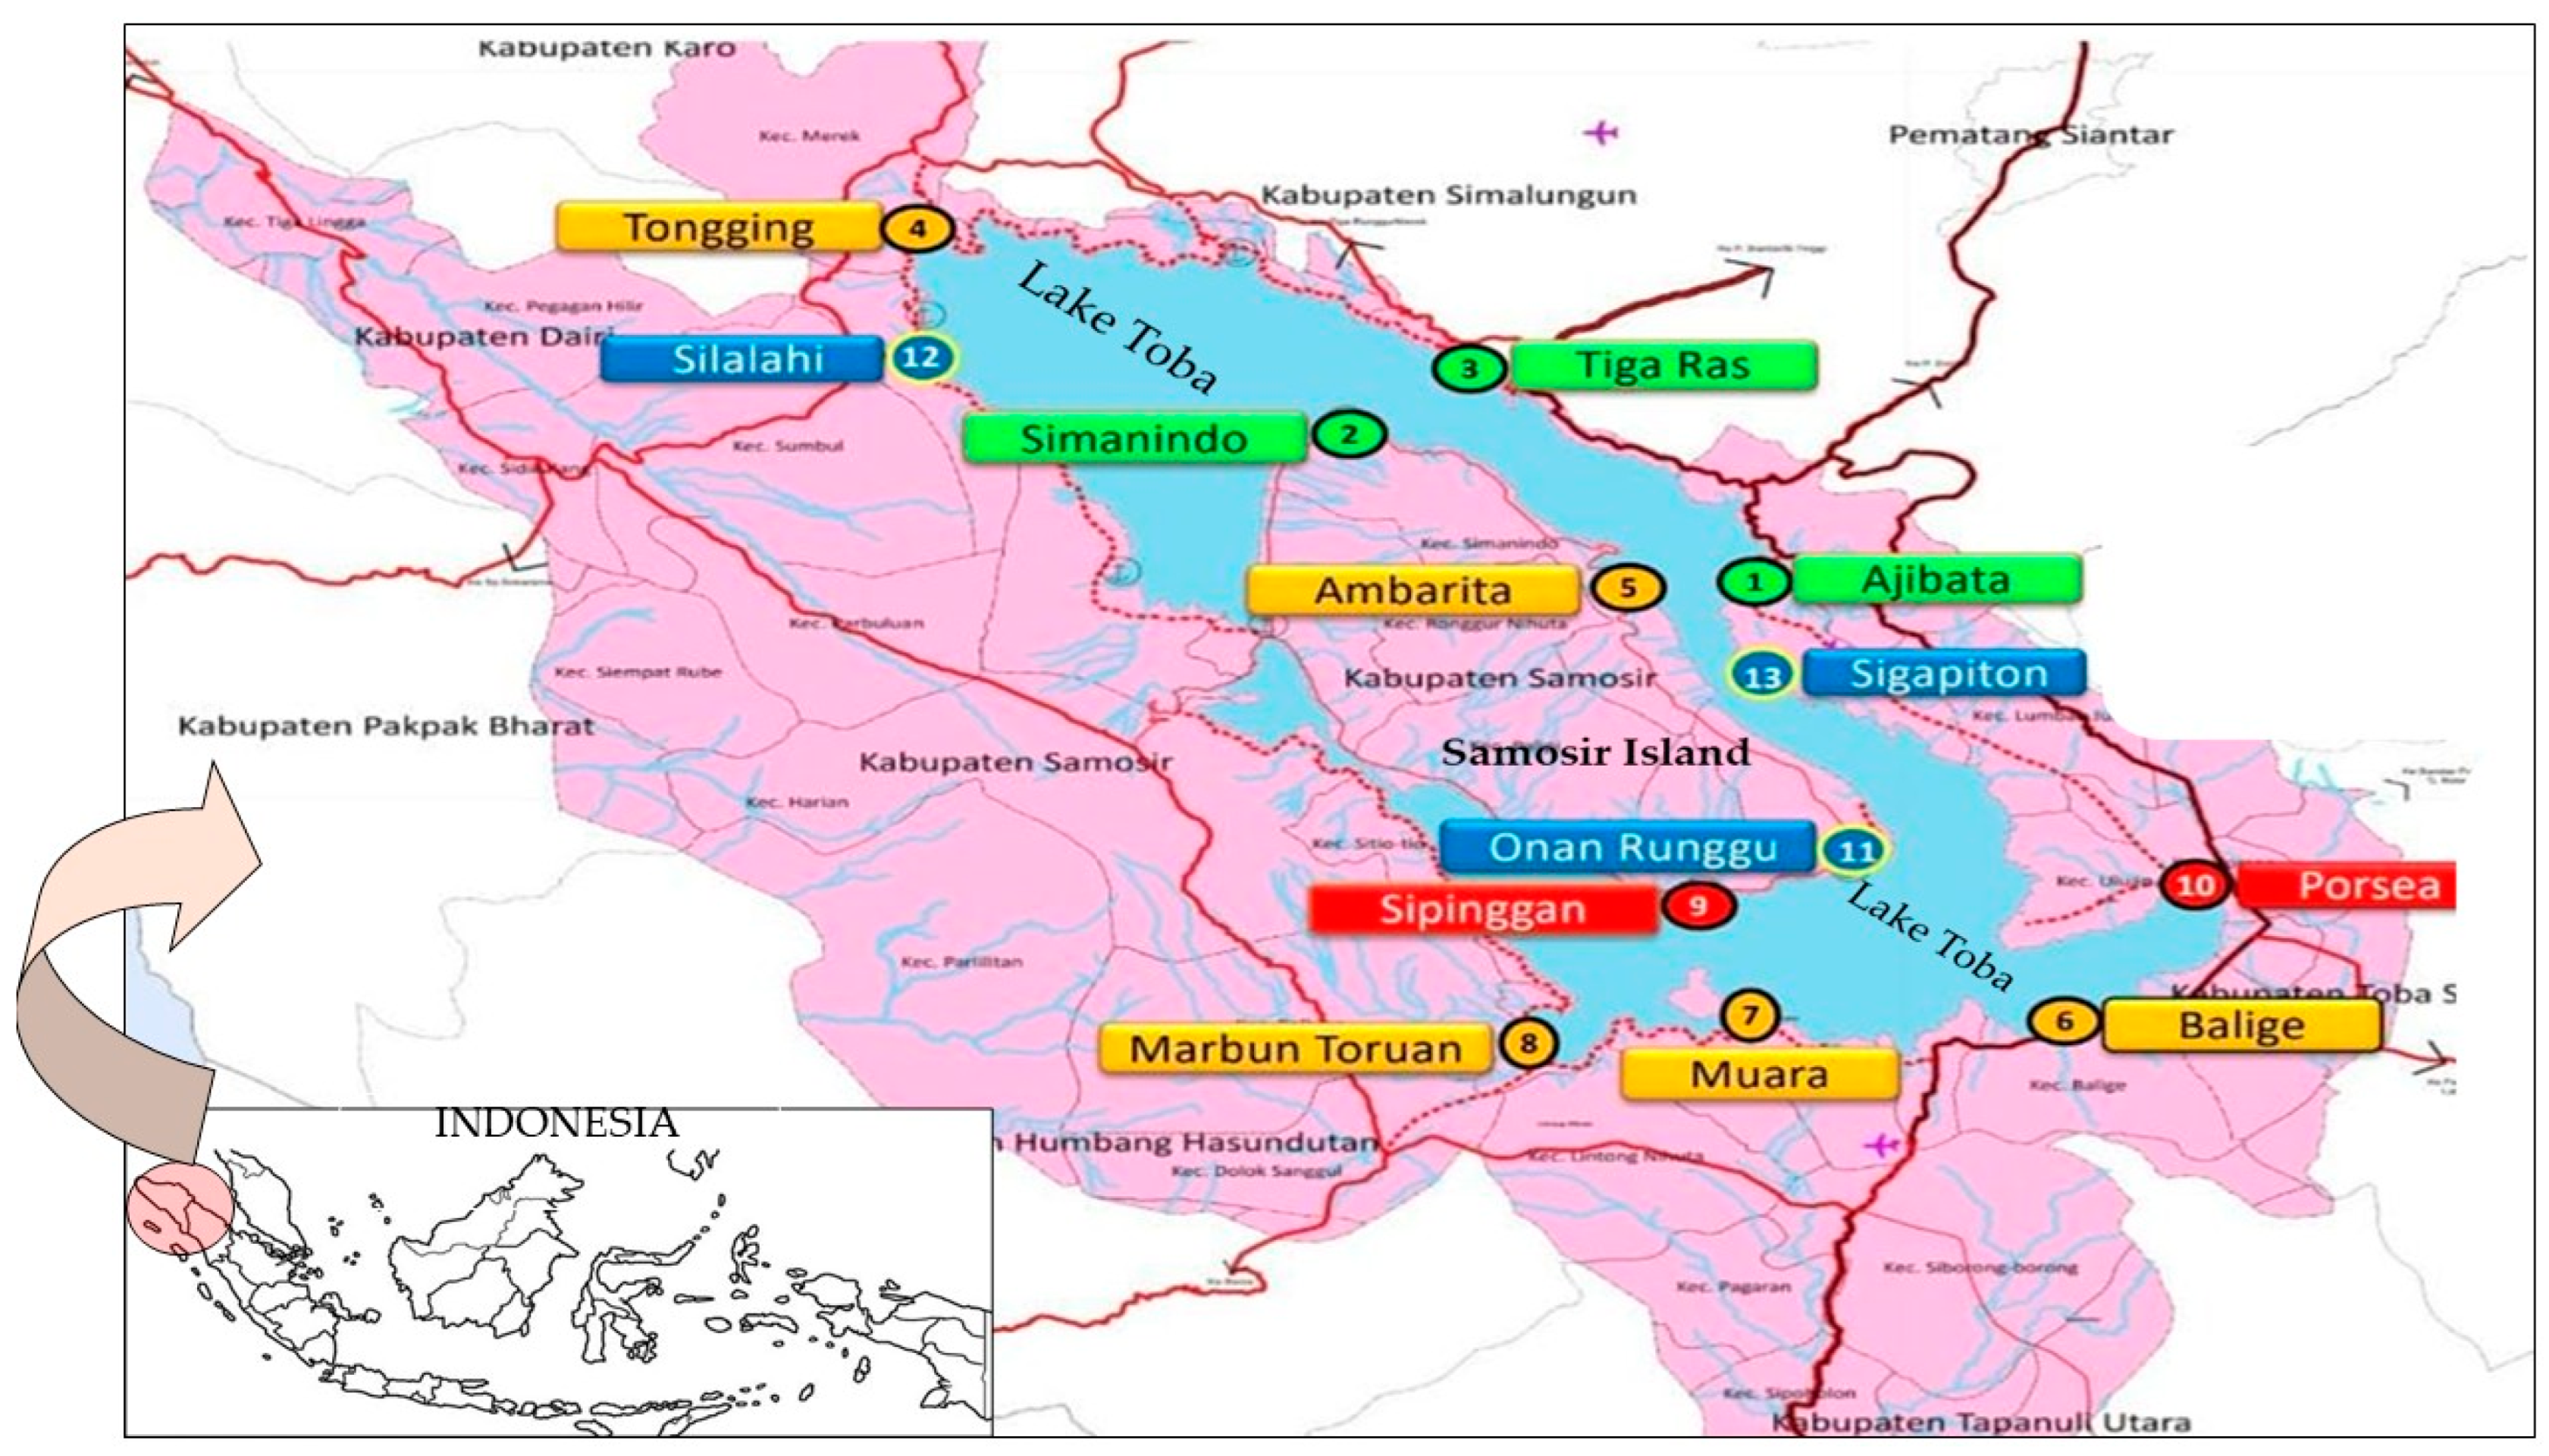
Lake Toba, situated in North Sumatra Province, is the largest lake in Indonesia, encompassing a water surface area of 1130 km2 and reaching a depth of 1667 feet. As illustrated in Figure 1, Lake Toba is divided among eight regencies and is currently recognized as part of Indonesia’s Super-priority National Tourism initiative. Samosir Island, one of the regencies within North Sumatra Province, is located over 212 km from the provincial capital. Although Samosir Island is part of Sumatra Island, it is separated from the mainland, as it lies in the center of Lake Toba. With an area of 2069.05 km2 and a population of 148,123 residents, Samosir Island has emerged as a significant tourist attraction. The only connection between Samosir Island and the Sumatra mainland is a single bridge; therefore, ferry transportation plays a vital role in the movement of people, goods, and vehicles.
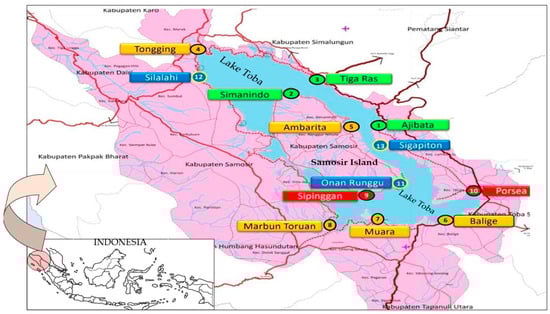
Figure 1.
Map of Indonesia and Samosir Island. Source: Directorate of River, Lake and Ferry Transportation-Ministry of Transportation Republic Indonesia.
Between 2018 and 2022, the government of the Republic of Indonesia enhanced the ferry transportation infrastructure in the Lake Toba region. The total investment amounted to IDR 858.4 billion for the construction of 13 new ferry ports capable of accommodating roll-on/roll-off (RoRo) motorboats, the rehabilitation of 34 traditional motorboat docks, and the addition of five new RoRo motorboats.
At present, there are 349 motor boats functioning in the Lake Toba region, which includes 9 RoRo motorboats and 65 traditional motorboats that provide public transportation across 22 established and regular routes. Ninety-six percent of the ferry routes in the Lake Toba area facilitate travel to and from Samosir Island. The government has established commercial rates for the service fees of RoRo motor vessels and traditional motor vessels on this route, with the exception of one RoRo ship that receives operational subsidies. Nevertheless, the significance of ferry transport is increasingly evolving as a vital link or connecting bridge to the mainland of Samosir Island.
The enhancement of the ferry transportation infrastructure in the Lake Toba region is anticipated to bolster shipping safety and stimulate the economy across eight regencies, particularly Samosir Island. Nevertheless, the economic framework of Samosir Island remains predominantly reliant on primary sectors, specifically agriculture, forestry, and plantations. The average growth rate of gross regional domestic income stands at 3.6% annually, marking it as the second lowest among the eight regencies in the Lake Toba region and the fifth lowest among thirty-three regencies in North Sumatra Province (BPS-Statistics Indonesia Samosir Regency, 2023). This suggests that the advancement of ferry transport infrastructures in the Lake Toba area has not had a substantial effect on the economic growth of Samosir Island.
This research investigates the multiplier effect that the enhancement of ferry services has on the medium-term economy of Samosir Island. The analysis involved a comparison of the multiplier effects of ferry development before and after implementation, utilizing the input–output approach. This approach encompassed the output multiplier, the multiplier on gross value added (GVA), and the household income multiplier. Consequently, this study aims to offer insights into the implications of transportation development for the economies of rural or remote regions, such as Samosir Island, in the medium term.
2. Literature Review
The input–output application has been extensively utilized by both academics and practitioners due to its straightforwardness and the concept of multiplier effects (Yu, 2017). This application examines the relationship between transportation and the economy across urban, regional, and national contexts. Martins et al. (2024) assessed the macroeconomic potential of green hydrogen, emphasizing its impact on GDP growth and job creation in Brazil. Lee et al. (2024) employs input–output methodologies to evaluate the significance and economic repercussions of the coal extraction sector in South Korea. Input–output tables from the years 2000, 2005, 2010, 2015, and 2019 are utilized in this analysis. Thongkaw et al. (2024) performed an in-depth study on a regional input–output table analysis concerning Thailand’s tourism system, with a particular focus on gastronomic activities and the tourism industry.
Several researchers have undertaken studies regarding the economic effects of the transportation industries utilizing an input–output methodology. Zhao et al. (2022) employed this approach to assess the contributions of five transportation modes to China’s national economy, focusing on linkage, production, supply, and employment effects. The findings of the author’s research indicated that, among other results, road transportation exhibited the most substantial forward linkage effect on China’s national economy, with a tendency for growth. Conversely, air transportation demonstrated the highest backward linkage, although its trend was inclined to decline, while pipeline transportation revealed the most significant supply shortage effect. The COVID-19 pandemic had a profound impact on the transportation sector in 2020, only rail and water transportation managed to sustain their growth, whereas the contributions of road, air, and pipeline transportation to the economy showed a tendency to diminish.
Kecek et al. (2022) performed a comparative study examining the effects of different transportation modes on the Croatian economy, which included type I and type II output, gross value added, and employment multipliers derived from the Croatian input–output tables for the years 2010 and 2015. The findings of the research revealed that in 2015, the type I and type II output, gross value added, and employment multipliers associated with land transportation, pipeline transportation, and water transportation were lower than those recorded in 2010. Conversely, the trend for air transportation services showed a significant increase, particularly in the employment multipliers for types I and II.
Varnavskii (2021) employed the World Input–Output Database to summarize and evaluate alterations in the structure and stability of the output within the Russian transportation sector. The author discovered that the transportation sector constituted approximately 6.6% of Russia’s gross output. From 2010 to 2014, the growth of output in the transportation sector of the Russian Federation averaged 731%, with land transportation and pipeline transportation at 724%, water transportation at 287%, air transportation at 714%, and warehousing and support activities for transportation at 834%.
Vukic et al. (2021) assessed the multiplier output and gross value added of the transportation sector to the Croatian economy using the input–output tables from 2004, 2010, 2013, and 2015. The findings indicated that the multiplier effect of the Croatian transportation sector was notably substantial during the analyzed period, particularly in air transportation.
Lee and Yoo (2016) investigated the contributions of rail, road, water, and air transportation modes to the Korean national economy. Among these four transportation modes, it was revealed that rail and road transportation play a more significant role in the Korean national economy compared to water and air transportation. Ali et al. (2021) utilized an input–output model to analyze the effects of strikes in the transportation sector on the Pakistani economy. The findings indicated that transportation strikes had a considerable impact on financial institutions, as well as the food and beverage, and oil, chemicals, and non-metallic mining sectors.
Transportation researchers also engage in partial studies regarding the influence of each transportation mode on the economy. The findings from Dwiatmoko et al.’s (2020) study indicate that rail transportation exhibits both forward and backward linkages with various sectors of the Indonesian economy, whereas the conclusions drawn from Meersman et al.’s (2022) research suggest that freight rail transportation generates a multiplier effect on the Belgian national economy. Chang et al. (2014) employed the forward and backward linkage parameters to assess the impact of hub port development on the South African economy. Similarly, Jun et al. (2018) examined the effects of the development and implementation of innovative port technology within the port industry on the Korean national economy.
Bagoulla and Guillotreau (2020) investigated the impact of maritime transportation on the output and employment within the French domestic economy. The findings indicated that the French maritime transportation sector possessed the second-highest backward linkage index and the lowest forward linkage index among the sixty-four industries assessed. The employment multiplier index for the maritime industry was 7, whereas passenger water transportation achieved a multiplier of two, equating to 14.
Njoya and Ragab (2022) examined the connection between the growth of air transportation infrastructure and the Egyptian economy. The findings indicate that public investment in air transportation exhibits a backward linkage that is above the average of other sectors, yet it shows a weak forward linkage. The mining sector stands out as the industry with the highest demand for intermediary inputs related to air transport. Additionally, the transportation sector generates direct, indirect, and supplementary multiplier effects on Indonesia’s economic sector (Muryani & Swastika, 2018). Nevertheless, this contribution is not the most significant for the regional economy of West Timor (Messakh et al., 2021).
As described above, several previous authors have no articles that examine the impact of ferry transportation on the economy in rural or remote areas using input–output. Therefore, the results of this study will provide a scientific contribution regarding the impact of ferry transportation infrastructure development on the regional economy, especially in rural or remote areas such as Samosir Island.
3. Research Method
This research employs the input–output methodology, which encompasses the output, gross value added (GVA), and the household income multiplier.
3.1. Input–Output Approach
The input–output (I-O) model has been extensively utilized to explore issues and develop a range of policies associated with development. Wassily Leontief introduced this model in the 1930s to quantitatively describe an economy’s elements. Initially, the input–output (I-O) model was employed to examine economic issues at the national level; however, as time progressed, I-O applications began to be utilized at regional and even international levels, notwithstanding their limitations (Miller & Blair, 2022). The I-O model has also undergone evolution (Thomassin, 2018) as experts have created various applications of high-speed, digital, computer-based input–output models, serving not only as a means to analyze the intricacies of economic activities but also in relation to social dimensions, including environmental I-O (Nakamura & Kondo, 2008).
The input–output (I-O) model serves as an analytical instrument for tables that encompass production data along with the movement of goods and services (BPS, 1999). The transactions related to the flow of goods and services depicted in the I-O table demonstrate the interdependence among various industries within a specific region during a defined time frame (Sahara, 2017). The I-O table is categorized into four quadrants. The initial quadrant includes transactions involving goods and services that serve as inputs or raw materials for subsequent production. The second quadrant encompasses the ultimate demand for goods and services, including household consumption, government expenditure, investment, and exports. The third quadrant provides details regarding the utilization of primary inputs, represented by compensation for production factors, wages and salaries, business profits, depreciation, and indirect net taxes. Conversely, the fourth quadrant is referred to as the exogenous sector. Producers located in quadrant one are identified as the endogenous sector, whereas producers groups situated in the second, third, and fourth quadrants are classified as the exogenous sector. All depictions of the flow of goods and services transactions, as previously outlined, can be found in Table 1 below.

Table 1.
Input–output table framework n × n.
Two approaches, the survey method and the non-survey method, can be employed to prepare the I-O table. The survey method necessitates a workforce, incurs costs, and demands a significant amount of time. Consequently, Richard Stone devised the non-survey approach, known as the RAS (Ratio-Adjusted Scaling) technique.
The RAS method is employed to calculate the coefficient of the technology matrix within the input–output table for a specific year (Miller & Blair, 2022) when the available data is scarce or when existing input–output tables are outdated. The figures in the input rows and output columns of the original input–output table are modified based on the most recent data accessible to estimate the input–output table for a designated year. RAS is defined as a formula where R and S represent n × n diagonal matrices, while A denotes an n × n matrix that illustrates input–output coefficients, with n indicating the number of industries. To determine the elements of matrix A for year t, it is denoted as At, whereas the existing matrix for year t = 0 is referred to as A0. This method is iterative, necessitating repeated adjustments of the matrix coefficients in accordance with the available data, such as the total input and output across sectors. The matrix A can be estimated using the following formula (Daryanto & Hafizrianda, 2010).
where At denotes the estimated input–output matrix, A0 signifies the base period coefficient matrix, and R and S are matrices that illustrate the rate of change in technology coefficients across two distinct periods. The diagonal elements of matrix R reflect the impacts of technological substitution, quantified by the increase in demand for the output of each industrial sector. Conversely, the diagonal elements of matrix S indicate the effects of variations in the quantity of input utilized in each industrial sector (Miller & Blair, 2022). To compute the elements of the R and S matrices, certain information is required, including the elements of the A matrix at period t = 0, the output of each industry during period t, the level of intermediate demand for the output of each industry at period t, and the quantity of intermediate input for each industry at period t. The information is then articulated as follows:
where A0 denotes the input-output coefficient at time t = 0, Xt signifies the output of n industrial sectors during period t, Ut indicates the total of intermediate inputs for n industrial sectors at time t, and Jt represents the level of intermediate demand for the output of n industrial sectors in period t. Utilizing this information, multiple iterations are performed to derive the diagonal elements of the R and S matrices. Subsequently, the input-output coefficient for period t can be estimated through a series of steps and various equations.
At = R A0 S
One of the key analyses within the input–output model involves assessing the effects of alterations in exogenous sector elements on output, income, or job creation across each economic sector (Miller & Blair, 2022). Consequently, an analysis of the multiplier effect can be executed on the output multiplier, household income multiplier, and employment multiplier. Nevertheless, this study focused solely on the output and household income multipliers.
The analysis of output multipliers seeks to assess the impact of variations in final demand from a specific sector on the overall output across all economic sectors. In other terms, the output multiplier for sector j is characterized as the aggregate value of output generated by economic activities due to a modification in one unit of final demand within sector j. The analysis of output multipliers can be categorized into simple output multipliers and total output multipliers (Miller & Blair, 2022). A simple output multiplier represents the total value generated by a region’s economy over a defined period as a result of shifts in final demand from a sector. Conversely, the total output multiplier encompasses direct, indirect, and induced effects, illustrating how changes in final demand influence the output of various economic sectors. The output multiplier computed in this research is exclusively a simple output multiplier, as expressed in Equation (2) below (Muljarijadi, 2011).
where is simple output multiplier, reperesents the Leontief Inverse Matrix element, (I − A)−1, and Fd is the final demand of an industry.
The gross value-added multiplier indicates the extent of the change in a region’s national income or economic output resulting from the added value of an industry. Concurrently, gross value added represents the difference between production value and the intermediate costs incurred during the production process. Within the input–output table, it is presumed that there exists a linear relationship between gross value added and output. This implies that any increase or decrease in output will be proportionately matched by a corresponding increase or decrease in gross value added. The calculation of the gross value added multiplier can be performed using Equation (3) (BPS, 1999):
where Vj denotes the GVA multiplier, bij signifies the output multiplier, and vi represents the coefficient of the GVA.
The analysis of household income multipliers aims to estimate the variations in household income resulting from the addition of one unit of final demand money within a sector (Firmansyah et al., 2023). Household income is defined as wages or salaries and encompasses monetary units such as dividends or interest accrued from bank deposits. The analysis of household income multipliers can be categorized into two methodologies: the simple income multiplier and the total income multiplier. The simple income multiplier assesses the changes in household income value as both direct and indirect effects of introducing one unit of money into the final demand of a sector. Conversely, the total income multiplier evaluates the changes in household income value as a result of direct, indirect, and induced effects stemming from the addition of one unit of final demand money from a sector. In this study, the household income analysis employs the simple income multiplier, frequently referred to as the type I income multiplier (Miller & Blair, 2022). It is important to note that the analysis of household income multipliers in this research focuses solely on the simple income house multiplier. The calculation process is conducted in two phases (Muljarijadi, 2011).
The first step is calculating the income coefficient of industry j through Equation (4):
where Hj denotes the income coefficient for sector j, Sj signifies the wage and salary labor of industry j, and Xj represents the output of the sector.
The subsequent step involves calculating the simple income multiplier value resulting from a change in the final demand of one monetary unit, utilizing Equation (5):
where Yj denotes the household income multiplier for sector j, ij signifies the element of the Leontief inverse matrix, and an+1,j represents the income coefficient matrix for sector j.
3.2. Data Source
This research utilizes secondary data sourced from BPS-Statistic Indonesia. The input–output table for Samosir Island for the year 2016 was acquired from BPS (Statistics Indonesia) and serves as the base year. Additionally, employing the Richard Stone method, the input–output table for Samosir Island in 2016 was revised to reflect the input–output table for Samosir Island in 2022. The categorization of industries within the input–output table of Samosir Island was expanded from 14 to 52 industry classifications.
4. Results
4.1. Output Multiplier of Ferry Transportation Development
The analysis of 52 disaggregated industries found that fifteen industries had no activity on Samosir Island before development (2016) and after development (2022). This means that only thirty-seven industries will produce an output multiplier if one unit of money increases in each industry’s final demand.
Table 2 illustrates that the average output multiplier index across different industries on Samosir Island from 2016 to 2022 experienced a decline of 0.84% annually, with the average output multiplier value decreasing from 1.80 in 2016 to 1.71 in 2022.
Table 2.
Output multiplier index of industries on Samosir Island.
Eighteen industries exhibited an output multiplier value exceeding the average for industries on Samosir Island, with seventeen of these surpassing a value of 2 in 2016. Consequently, this indicates that there are nineteen industries with output multiplier values that are either below or equal to the mean industry index. The textile and apparel manufacturing boasts the highest multiplier index, recorded at 3.52. This indicates that a change of one unit in final demand will yield a multiplier effect of 2.52 times for the textile and apparel manufacturing industry. In practical terms, should there be an increase in final demand or a shock to the textile and apparel manufacturing sector amounting to IDR 1 billion, it would result in an economic output increase of IDR 2.52 billion. Other sectors exhibiting significant output multiplier effects include other financial services at 2.91, warehousing and support services for postal and courier transportation at 2.73, wholesale and retail trade, including the repair of motor vehicles and motorcycles at 2.72, manufacturing of fabricated metal products, computers, and optical and electrical products at 2.67, production of other non-metallic mineral products at 2.41, gas and ice production at 2.38, furniture manufacturing at 2.32, insurance and pension funds at 2.25, and private education services at 2.22.
Following the establishment and functioning of ferry transportation in 2022, numerous business sectors altered their structure and output multiplier value. However, only seventeen industries exhibited output multiplier values that surpassed the average value of industries within the economy of Samosir Island. Among them, twelve industries exhibited output multiplier index values exceeding two. This indicates that the count of industries with an output multiplier value above two has decreased by 29.41% in comparison to 2016. The industry exhibits the highest output multiplier index, and at the same time as the key sector in Samosir Island’s economy was the manufacturing of other non-metallic mineral products, which stands at 2.57. Following this, warehousing and support services for transportation, postal, and courier services have an index of 2.54; the manufacture of fabricated metal products, computers, and optical and electrical products is at 2.45; other financial services are recorded at 2.39; the textile and apparel manufacturing sector has an index of 2.33; gas and ice production is at 2.28; other manufacturing, along with the repair and installation of machinery and equipment, also stands at 2.28; the furniture manufacturing sector has an index of 2.25; other service activities are recorded at 2.23; and the manufacture of paper, along with the painting and reproduction of recorded media, has an index of 2.16.
The data presented above suggest that, overall, ferry transportation in Lake Toba has a limited effect on stimulating economic output growth on Samosir Island during the initial five-year period following the establishment of the ferry transportation infrastructure. This situation aligns with various research findings that indicate the influence of transportation infrastructure does not consistently exhibit a significant correlation with regional economic growth, as it is contingent upon factors such as time, location, type, and the condition of the transportation infrastructure. According to Zhang and Cheng’s (2023) research, transportation infrastructure has a significant long-term relationship with the economy of the United Kingdom, although this relationship is negative in the short term. Grgic (2021) demonstrates that road transportation has a beneficial effect on inland regions but shows a negative correlation in island areas and along coastlines. Similarly, Fageda and Olivieri (2019) research indicates that road transportation plays a positive role in regional convergence in Spain. Nevertheless, substantial investments in high-speed rail transportation infrastructure, ports, and airports have a less favorable impact on diminishing economic disparities across various regions. This contrasts with Centuriao et al.’s (2024) research, which asserts that investment in road transportation in Mato Grosso do Sul-Brazil (MS) significantly boosts MS’s GDP in the short term.
4.2. Gross Value Added (GVA) Multiplier
Table 3 illustrates that the GVA multiplier for industries on Samosir Island has risen to 1.04% annually from 2016 to 2022. The average GVA multiplier was IDR 766.1 million in 2016, increasing to IDR 816.1 billion by 2022. This reflects a growth in the utilization of primary inputs, such as labor wages and other value added elements, to generate output across various industries on Samosir Island.
Table 3.
The highest GVA multiplier of industries on Samosir Island.
There are twenty-three sectors that possess a GVA multiplier value exceeding the average industrial GVA within the Samosir Islands economy for both 2016 and 2022. This indicates that there are fourteen sectors with a GVA multiplier value that is either below or equal to the average industrial index. The fisheries, forestry, and logging sectors exhibited the highest GVA multiplier during both timeframes.
The GVA multiplier for the transportation and storage sector is lower than the average GVA multiplier of industries within the economy of Samosir Island, both prior to and following development. Nevertheless, the GVA multiplier for the transportation industry saw an increase from 2016 to 2022: ferry transportation rose by 7.56% annually, while land transport grew by 3.02% each year. Conversely, the GVA multiplier for warehousing and support services related to postal and courier transportation experienced a decline of 1.58% per year.
4.3. Household Income Multipliers Index of Various Industries
Table 4 illustrates that the average household income multiplier index across different industries on Samosir Island increased by 1.91% annually, where the average household income index increasing from 0.30 in 2016 to 0.33 in 2022.
Table 4.
Index of household income multipliers for different industries on Samosir Island.
In the meantime, the household income multiplier index for 37 industries on Samosir Island ranged from 0.09 to 0.54 in 2016 and from 0.09 to 0.59 in 2022. This increase was influenced by the increased GVA of various industries in 2022, thus changing the income coefficients of several industries on Samosir Island. The average income coefficient of 37 industries increased by 1.63% per year, from an average of 0.14 in 2016 to 0.16 in 2022. The household income coefficient ranged from 0.00 to 0.41 in 2016, and 0.00 to 0.58 in 2022.
In 2016, fourteen industries exhibited a household income multiplier index that surpassed the average industrial index. Meanwhile, by 2022, this figure rose to eighteen industries. Consequently, in both 2016 and 2022, there were industries with a household income multiplier index that was either below or equal to the average industry index, specifically twenty-three and nineteen industries, respectively. In 2016, the sector recorded the highest household multiplier income index was the public administration and defense, along with compulsory social security, at 0.54. Other sectors that exhibited significant household income multiplier indices include agriculture and hunting services at 0.52, livestock at 0.43, private education services at 0.40, plantation crops at 0.40, and wholesale and retail trade, excluding motor vehicles and motorcycles at 0.39. Additionally, wholesale trade and retail trade, excluding motor vehicles and motorcycles, also stood at 0.39, while other manufacturing, repair, and installation of machinery and equipment had an index of 0.38. Private human health and social activities recorded an index of 0.36, as did other service activities, which also had an index of 0.36.
In 2022, the sector with the highest household multiplier income index is public administration and defense, along with compulsory social security, which stands at 0.54 and 0.59, respectively. Other sectors that exhibit a significant household income multiplier index include agriculture and hunting services at 0.52, livestock at 0.46, private education services also at 0.46, plantation crops at 0.42, as well as other manufacturing, repair, and installation of machinery and equipment at 0.40. Additionally, business activities and food and beverage service activities both have a multiplier index of 0.39.
The household income multiplier index for ferry transport, as well as warehousing and support services related to postal and courier transport industries, in 2022 exceeds the average household income multiplier of the industrial index. However, the land transport sector falls short of the average index.
5. Conclusions and Discussion
This research investigates the multiplier effects resulting from the advancement of ferry transportation in the Lake Toba region on the economy of Samosir Island, Indonesia, in the medium term. The analysis employs an input–output methodology, which encompasses output, gross value added, and household income multipliers across 37 industries. This study elucidates the implications of transportation development for the economies of rural or remote regions like Samosir Island.
The mean output multiplier for 37 industries on Samosir Island from 2016 to 2022 experienced a decline of 0.84% annually, with the average multiplier value recorded at 1.80 in 2016, which subsequently decreased to 1.71 by 2022.
Furthermore, in 2016, Samosir Island had eighteen industries that demonstrated output multiplier values surpassing the regional economic average; however, this figure decreased to seventeen by 2022. It is also crucial to note that before the establishment of the ferry transportation infrastructure, specifically in 2016, there were seventeen industries with an output multiplier value exceeding two. After the development of this infrastructure, this number dropped to twelve industries in 2022. As a result, the number of industries with an output multiplier value above two saw a decline of 29.41% compared to 2016. This pattern indicates that, overall, the ferry transportation infrastructure was relatively weak in stimulating economic growth in rural or remote areas, such as Samosir Island, during the first five years after its development. The textile and apparel manufacturing sector recorded the highest output multiplier value at 3.52, while in 2022, the industry with the highest output multiplier value was the manufacturing of other non-metallic mineral products, which was recorded at 2.57.
In 2022, the transportation and storage sector is not categorized as one of the industries with the most significant output multiplier effect on the economy of Samosir. However, the output multiplier effect of ferry transport has increased by 5.01% each year. In contrast, land transport and warehousing, as well as support services for postal and courier transportation, have seen decreases of 0.54% and 1.23%, respectively.
The average gross value added (GVA) of Samosir Island’s economy rose from IDR 766.1 million in 2016 to IDR 815.1 million in 2022, reflecting an annual increase of 1.04%. This trend signifies a rise in the utilization of primary inputs across different sectors, including labor wages and other components contributing to value addition. There are twenty-three sectors that had a GVA multiplier value surpassing the average industrial GVA in the Samosir Islands economy for both 2016 and 2022. The fisheries, forestry, and logging industries had the highest GVA multiplier during both years, with the respective figures being IDR 958.6 million in 2016 and IDR 9948.1 million in 2022. The GVA multiplier for ferry and land transport increased by 7.56% annually and 3.02% annually, respectively, while warehousing and support services for postal and courier transportation experienced a decline of 1.58% per year.
The household income multiplier index averaged 0.30 in 2016 and increased to 0.33 in 2022, reflecting an annual increase of 1.91%. This change was driven by the growth in GVA and income coefficients across various industries. Additionally, the household income multiplier index for 37 industries on Samosir Island ranged from 0.09 to 0.54 in 2016, and from 0.09 to 0.59 in 2022. In 2016, fourteen sectors within the Samosir Islands economy demonstrated a household income multiplier index that exceeded the average for the industry. By 2022, this figure had increased to eighteen sectors. The sectors that exhibited the highest household income multiplier index during both timeframes were public administration and defense, along with compulsory social security, which reported indexes of 0.54 and 0.59, respectively.
The information provided above indicates that in the first five years of establishing the ferry transportation infrastructure in the Lake Toba area, there has been a significant influence on the Gross Value Added (GVA) and the household income multiplier on Samosir Island, although the effect is still relatively modest.
The COVID-19 pandemic may continue to influence the data of this study. Consequently, additional research is required after a period of 5 years has elapsed since the onset of the COVID-19 pandemic or once the Indonesian economy has stabilized. Moreover, the government of the Republic of Indonesia, along with local authorities, must address various shortcomings in the management of ferry transportation, particularly those concerning departure schedules, routes, tariff structures, and RoRo ship subsidies, taking into account the feedback from passengers and the general public.
Author Contributions
Conceptualization: E.M., S.W., M.Y.J. and L.D.S.; methodology: E.M., S.W., M.Y.J., and L.D.S.; software: E.M.; data curation; E.M., writing-original draft preparation, E.M.; writing-review and editing; S.W., M.Y.J. and L.D.S. All authors have read and agreed to the published version of the manuscript.
Funding
This research received no external funding.
Institutional Review Board Statement
Not applicable.
Informed Consent Statement
Not applicable.
Data Availability Statement
The data presented in this research are available on request from the corresponding author.
Conflicts of Interest
The authors declare no conflict of interest.
Abbreviations
The following abbreviations are used in this manuscript:
| GVA | Gross Value Added |
| IDR | Indonesian Rupiah |
| I-O | Input–output |
| BPS | Statistics Indonesia |
| CAGR | Compound Annual Growth Rate |
References
- Adisamita, A. S. (2011). Transportasi dan pengembangan wilayah. Graha Ilmu Yogyakarta. ISBN 978-979-756-777-4. [Google Scholar]
- Akustia, W., Juniati, H., Purwiningsih, F. S., Malisan, J., Mutholib, A., Tarigan, H., Purwoko, P., Sulistyono, D., Purwantini, T. B., & Haryati, H. (2024). Transportation connectivity development strategy in the Wakatobi Island, Indonesia. Journal of Infrastructure, Policy and Development, 8(12), 7606. [Google Scholar] [CrossRef]
- Ali, Y., Bilal, M., & Sabir, M. (2021). Impacts of transport strike on Pakistan economy: An inoperability input-output model (IIOM) aproach. Reseacrh in Transportation Economics, 90, 100860. [Google Scholar] [CrossRef]
- Badan Pusat Satistik (BPS). (1999). Kerangka teori dan analisis tabel input-output. Badan Pusat Statistik. Nomor Publikasi 06330.9501. ISSN 0251-0395. [Google Scholar]
- Bagoulla, C., & Guillotreau, P. (2020). Maritime transport in the French economy and its impact on air pollution: Input-output analysis. Marine Policy, 116, 103818. [Google Scholar] [CrossRef]
- Black, W. R. (2003). Transportation a geographical analysis. The Guilford Press. ISBN 1-57230-848-6. [Google Scholar]
- BPS-Statistics Indonesia Samosir Regency. (2023). Samosir regency in figures 2023. BPS-Statistics of Samosir Regency. Publication Number: 12170.2302. ISSN/ISBN 2301-976X. [Google Scholar]
- Button, K., Vega, H., & Nijkamp, P. (2010). A dictionary of transport analysis. Edward Elgar Publishing Limited. ISBN 978-1-84376-375-8-9. [Google Scholar]
- Centuriao, D., Abrita, M. B., Neto, A. R., Camilo, A. P., Vignandi, R. S., Junior, G. E., Weber, V., Marques, N., & Maciel, R. F. (2024). Impacts of road transport infrastructure investments on the Latin American Integration Route. Regional Science Policy & Practice, 16, 100061. [Google Scholar] [CrossRef]
- Chang, Y., Shin, S., & Lee, P. T. (2014). Economic impact of port sectors on South African economy: An input–output analysis. Transport Policy, 35, 333–340. [Google Scholar] [CrossRef]
- Cowie, J. (2010). The transport economics, a theoretical and applied perspective. Routledge Taylor and Francis. ISBN 978-0-415-41979-6. [Google Scholar]
- Daryanto, A., & Hafizrianda, Y. (2010). Analisis input-output & social accounting matrix untuk pembangunan daerah. IPB Press. ISBN 978-979-493-254-1. [Google Scholar]
- Dwiatmoko, H., Hidayat, A. K., Supriyatno, D., Mudjanarko, S. W., & Ramli, M. I. (2020). The influence of railway development on Indonesian national economy: An input-output aproach. IOP Conferenve Series: Earth and Environmental Science, 419, 012104. [Google Scholar] [CrossRef]
- Fageda, X., & Olivieri, C. (2019). Transport Infrastructure and Regional Convergence: A Spatial Panel Data Approach. Regional Science, 98, 1609–1631. [Google Scholar] [CrossRef]
- Firmansyah, F. (2006). Operasi matrix dan analisis input-output (I-O) untuk ekonomi. Aplikasi praktis dengan microsoft exel dan matlab. Badan Penerbit Universitas Diponegoro. ISBN 979-704-375. [Google Scholar]
- Firmansyah, F., Prasetyo, A. B., Oktavilia, S., Azyzia, S. H., Puspita, D. W., Boykhair, A., & Nugraha, F. (2023). Economic recovery of sectoral industries post-COVID-19_input-output model simulations. Economies, 11, 151. [Google Scholar] [CrossRef]
- Gharehbaghi, K., Clarkson, I., Hurst, N., & Rahmani, F. (2020). Transportation development for regional infrastructure: Implications for Australia rural areas. Transportation Research Procedia, 48, 4003–4011. [Google Scholar] [CrossRef]
- Grgic, J. (2021). Impact of Transport Infrastructure on Local Development in Dalmatia. Regional Science Policy and Practice, 13, 527–558. [Google Scholar] [CrossRef]
- Jinca, I. M. Y. (2011). Transportasi laut Indonesia, analisis sistem & studi kasus. Brilian Internasional. ISBN 978-602-98025-4-2. [Google Scholar]
- Jun, W. K., Lee, M., & Choi, J. Y. (2018). Impact of the smart port industry on the Korean national economy using input-output analysis. Transportation Research Part A, 118, 480–493. [Google Scholar] [CrossRef]
- Kamaluddin, R. H. (2003). Ekonomi transportasi, karesteristik, teori dan kebijakan. Penerbit Ghalia Indonesia. ISBN 979-450-460-2. [Google Scholar]
- Kecek, D., Brlek, P., & Buntak, K. (2022). Economic effects of transport sectors on Croatian economy: An input-output approach. Economic Research-Ekonomska Istrazivanja, 35(1), 2023–2038. [Google Scholar] [CrossRef]
- Lee, J., Hyun, M., & Yoo, S. (2024). Economic impacts of the coal extraction sector on the South Korean national economy: An input-output analysis. The Extractive Industries and Society, 17, 101436. [Google Scholar] [CrossRef]
- Lee, M., & Yoo, S. (2016). The role of transportation sectors in the Korean national economy: An input-output analysis. Transportation Research Part A, 93, 13–22. [Google Scholar] [CrossRef]
- Lenz, N. V., Skender, H. P., & Mirković, P. A. (2018). The macroeconomic effects of transport infrastructure on economic growth: The case of Central and Eastern EU member states. Economic Research-Ekonomiska Istrazivanja, 31(1), 1953–1964. [Google Scholar] [CrossRef]
- Leung, K. M., & Choy, L. H. T. (2024). The impacts of public transportation development on gentrification and poverty in Hong Kong neighbourhoods (2006–2021). Cities, 157, 105467. [Google Scholar] [CrossRef]
- Litman, T. (2018). Evaluating transportation economic development impact. Victoria Transport Policy Institute. Available online: https://www.vtpi.org/econ_dev.pdf (accessed on 1 June 2025).
- Liu, F., Kumar, J., Sun, H., & Edziah, B. K. (2025). Harnessing the digital economy for sustainable energy efficiency: An empirical analysis of China’s Yangtze River Delta. Economics, 19, 20250136. [Google Scholar] [CrossRef]
- Liu, L., Jia, S., & Liu, P. (2025). The impact of intercity multi-transportation networks on enterprises’ total factor productivity. Transport Policy, 162, 477–492. [Google Scholar] [CrossRef]
- Ma, L., & Tang, Y. (2024). The distributional impacts of transportation networks in China. Journal of International Economics, 148, 103873. [Google Scholar] [CrossRef]
- Mance, D., Debelić, B., & Jugović, A. (2021). Dependence of transportation on industry in Croatia. Economies, 9, 43. [Google Scholar] [CrossRef]
- Martins, P. H. d. S., Serrano, A. L. M., Rodrigues, G. A. P., Vergara, G. F., Saiki, G. M., Borges, R. V., Bispo, G. D., Peixoto, M. G. M., & Gonçalves, V. P. (2024). Brazil new green hydrogen industry—An assessment of its macroeconomic viability through an input-output approach. Economies, 12, 333. [Google Scholar] [CrossRef]
- Mayvani, T. C. (2022). Ekonomi regional: Mengukur potensi wilayah. Penerbit Deepublish Yogyakarta. ISBN 978-623-02-5712-4. [Google Scholar]
- Meersman, H., Sys, C., Troch, F., Van de Voorde, E., & Vanelslander, T. (2022). The indirect economic impact of rail freight transport: An input-output case study for Belgium. Case Studies on Transport Policy, 10, 1353–1365. [Google Scholar] [CrossRef]
- Messakh, T. A., Rustiadi, E., Putri, E. I. K., & Fauzi, A. (2021). The impact of transportation sector to economic on west timor: An input-output model analysis. Jurnal Wilayah dan Lingkungan, 9(2), 127–141. [Google Scholar] [CrossRef]
- Miller, R. E., & Blair, P. D. (2022). Input-output analysis, foundations and extensions (3rd ed.). Cambridge University Press United Kingdom. ISBN 978-1-108-48476-3. [Google Scholar]
- Morlok, E. K., & Hainim, J. K. (1985). Pengantar teknik dan perencanaan transportasi. Penerbit Erlangga. [Google Scholar]
- Mudronja, G., Jugović, A., & Škalamera-Alilović, D. (2020). Seaport and economic growth paviel analysis of EU port regions. Journal of Marine Science and Engineering, 8, 1017. [Google Scholar] [CrossRef]
- Muljarijadi, B. (2011). Pembangunan ekonomi wilayah, pendekatan analisis tabel input-output. Unpad Press. ISBN 978-602-8743-53-2. [Google Scholar]
- Muryani, M., & Swastika, R. B. (2018). Input-output analysis: A case study of transportation sector in Indonesia. Journal of Developing Economies, 3(2), 80–90. [Google Scholar] [CrossRef]
- Nakamura, S., & Kondo, Y. (2008). Waste input-output analysis. Concepts and aplication to industrial ecology. Springer. ISBN 978-1-4020-9901-4. [Google Scholar]
- Nakoinz, O. (2023). Transport, interaction and connectivity. Open Archaeology, 9, 202220347. [Google Scholar] [CrossRef]
- Njoya, E. T., & Ragab, A. M. (2022). Economic impacts of public air transport investment: A case study of Egypt. Sustainability, 14, 2651. [Google Scholar] [CrossRef]
- Organisation for Economic Co-Operation and Development (OECD). (2020). Impact of transport infrastructure investment on regional development. OECD. ITRD Number: E112022. [Google Scholar]
- Pokharel, R., Bertolini, L., & Brömmelstroet, M. T. (2023). How does transportation facilitate regional economic development? A heuristic mapping of the literature. Transportation Research Interdisciplinary Perspectives, 19, 100817. [Google Scholar] [CrossRef]
- Polyzos, S., & Tsiotas, D. (2020). The contribution of transport infrastructure to the economic and regional development: A review of the conceptual framework. Theoretical and Empirical Research in Urban Management, 15(1), 5–23. [Google Scholar]
- Ralahalu, K. A., Jinca, M. Y., Siahaan, L. D., & Sihaloho, A. (2013). Pembangunan transportasi kepulauan di Indonesia. Brilian Internasional. ISBN 978-602-17209-6-7. [Google Scholar]
- Rodrigue, J. P., Comtois, C., & Slack, B. (2013). The geography transport systems (3rd ed.). Routledge Taylor & Francis. ISBN 978-0-415-82253-4. [Google Scholar]
- Rosik, P., & Wójcik, J. (2022). Transport infrastructure and regional development: A survey literature on wider economic and spatial impacts. Sustainability, 15, 548. [Google Scholar] [CrossRef]
- Sahara. (2017). Analisis input-output: Perencanaan sektor unggulan (1st ed.). IPB Press. ISBN 978-602-440-088-0. [Google Scholar]
- Solomon, B., Otoo, E., Boateng, A., & Koomson, D. A. (2021). Inland waterway transportation (IWT) in Ghana: A case study of volta lake transport. International Journal of Transportation Science And Technology, 10, 20–33. [Google Scholar] [CrossRef]
- Soltani, A., Zali, N., Aghajani, H., Hashemzadeh, F., Rahimi, A., & Heydari, M. (2024). The nexus between transportation infrastructure and housing prices in metropolitan regions. Journal of Housing and The Built Environment, 39, 787–812. [Google Scholar] [CrossRef]
- Soto, G. H., & Martinez-Cobas, X. (2024). The impact of transportation investment, road transportation and telecommunications on FDI in Latin America 2008–2021. Transport Economics and Management, 2, 45–57. [Google Scholar] [CrossRef]
- Susantono, B. (2013). Transportasi dan investasi, tantangan dan perspektif multidimensi. Penerbit Buku Kompas Jakarta. ISBN 978-979-709-689-2. [Google Scholar]
- Thomassin, P. J. (2018). The evolution of input-output analysis. Springer Proceeding in Business and Economics. ISBN 978-981-13-1507-7. [Google Scholar] [CrossRef]
- Thongkaw, B., Kongbuamai, N., Chinnakum, W., & Chaiboonsri, C. (2024). The impact of gastronomi tourism on the regional economy of Thailand: Examined by the dynamic I-O model after the decline of COVID-19. Economies, 12, 180. [Google Scholar] [CrossRef]
- Varnavskii, V. (2021). International input-output tables as a tool for structured analysis and assessment of stability in Russian transport sector. Science Direct, IFAC PaperOnLine, 54(13), 710–714. [Google Scholar] [CrossRef]
- Vukic, L., Mikulić, D., & Keček, D. (2021). The impact of transportation on the croatian economy: The input-output approach. Economies, 9, 7. [Google Scholar] [CrossRef]
- Wan, J., Xie, Q., & Fan, X. (2024). The impact of transportation and information infrastructure on urban productivity: Evidence from 256 cities in China. Structural Change and Economic Dynamics, 68, 384–392. [Google Scholar] [CrossRef]
- Wang, J., & Charles, M. B. (2010, September 29–October 1). IO based impact analysis: A method for estimating the economic impacts by different transport infrastructure invesments in Australia. ATRF 2010: 33rd Australasian Transport Research Forum, Canberra, Australia. [Google Scholar]
- Xiao, C., Wang, Y., Yan, M., & Chiaka, J. C. (2024). Impact of cross-border transportation corridors on changes of land use and landscape pattern: A case study of the China-Laos railway. Landscape and Urban Planning, 241, 104921. [Google Scholar] [CrossRef]
- Yu, H. (2017). A review of input-output models on multisectoral modelling of transportation-economic linkages. Transport Review, 38(5), 654–677. [Google Scholar] [CrossRef]
- Zhang, Y., & Cheng, L. (2023). The role of transport infrastructure in economic growth: Empirical evidence in the UK. Transport Policy, 133, 223–233. [Google Scholar] [CrossRef]
- Zhao, B., Wang, N., & Wang, Y. (2022). The role of different transportation modes in China’s national economy: An input-output analysis. Transport Policy, 127, 92–102. [Google Scholar] [CrossRef]
Disclaimer/Publisher’s Note: The statements, opinions and data contained in all publications are solely those of the individual author(s) and contributor(s) and not of MDPI and/or the editor(s). MDPI and/or the editor(s) disclaim responsibility for any injury to people or property resulting from any ideas, methods, instructions or products referred to in the content. |
© 2025 by the authors. Licensee MDPI, Basel, Switzerland. This article is an open access article distributed under the terms and conditions of the Creative Commons Attribution (CC BY) license (https://creativecommons.org/licenses/by/4.0/).