Abstract
The mounting prevalence of chronic diseases poses a substantial public health and economic burden, particularly in aging societies such as the United States. Focusing on both direct healthcare expenditure and indirect costs such as productivity loss, this study examines the economic burden of chronic non-communicable diseases (NCDs) from 1996 to 2040. A multidisciplinary approach is employed, integrating panel data models to identify determinants of real healthcare spending across ten chronic conditions and an Autoregressive Integrated Moving Average (ARIMA) forecasting model to estimate future expenditure as a share of national Gross Domestic Product (GDP). The estimations are based on data available for the period 1996–2015, which serve as the foundation for projections up to 2040. The results show that chronic diseases—especially cardiovascular conditions, diabetes, and respiratory illnesses—are associated with persistent increases in public and private healthcare costs and substantial reductions in labor productivity. Disparities by age, income, and race further intensify this burden. Projections suggest that the financial impact of chronic diseases will escalate significantly through 2040, exceeding the rate of GDP growth. Our study concludes that indirect costs are often underestimated in many models, which limits accurate fiscal planning. We thus underscore the need for integrated economic health forecasting tools to support sustainable, equity-focused health policies. These findings support calls for increased investment in prevention, coordinated chronic care, and more robust data systems to anticipate long-term health and economic outcomes.
1. Introduction
Throughout the past two centuries, evolving medical care and improving public health have resulted in a notable increase in human life expectancy across the globe. However, this progress is accompanied by significant challenges. The intertwined processes of longer lives, aging populations, and numerous socioeconomic and environmental factors have led to a global surge in chronic diseases and an extraordinary escalation in their prevalence worldwide (Maresova et al., 2019; Williams et al., 2020). These non-communicable diseases (NCDs), which include but are not limited to diabetes, heart disease, and cancer, have exerted a considerable strain on healthcare systems and substantially impacted people’s quality of life (Clayton et al., 2022; Maresova et al., 2019).
Collectively, noncommunicable diseases (NCDs) account for nearly 74% of all global deaths, and over 80% of premature deaths due to NCDs are attributed to cardiovascular diseases, cancers, chronic respiratory diseases, and diabetes (WHO, 2023, 2024; Yang et al., 2023). Specifically, approximately 17.9–19 million deaths are caused annually by cardiovascular diseases, 9–10 million by cancers, 4 million by chronic respiratory diseases, and 1.6–2.0 million by diabetes, including diabetes-associated kidney disease (WHO, 2024; Knowledge Action Portal, 2024; García-Morales et al., 2024). Alarmingly, 86% of these premature deaths (occurring before the age of 70) are concentrated in low- and middle-income countries (WHO, 2024). The economic burden is profound: prolonged and costly treatments, combined with income loss, rapidly erode household resources and push millions into poverty—especially in LMICs—where studies document catastrophic out-of-pocket expenditures, impoverishment, and declines in income (Kazibwe et al., 2021; Odunyemi et al., 2023; García-Morales et al., 2024). Given the escalating global NCD burden, countries of all income levels must adopt effective strategies for prevention and management.
Although the burden of non-communicable diseases (NCDs) is particularly acute in low- and middle-income countries, focusing on the United States provides a theoretically and empirically sound case for global health-economics research. The U.S. represents an advanced stage of the epidemiological and fiscal transition that many countries are now approaching, making it a relevant “stress test” for assessing the sustainability of health systems under demographic aging and chronic disease pressures. Moreover, the United States maintains the largest and most complex health economy worldwide, where shifts in medical spending, pharmaceutical innovation, and care delivery models exert significant spillover effects on international research agendas and global supply chains (Cutler & Summers, 2020; OECD, 2023).
From a methodological standpoint, the U.S. also offers unparalleled data infrastructure. The Medical Expenditure Panel Survey (MEPS) provides longitudinal, condition-specific microdata that allow for robust and comparable analysis of direct healthcare expenditures (Dieleman et al., 2020). This level of standardization and transparency ensures consistency that is often unattainable in other contexts, strengthening both internal validity and cross-national comparability.
Therefore, studying the economic burden of chronic diseases in the United States not only enhances understanding of national expenditure dynamics but also generates insights with broad policy relevance. The U.S. experience serves as an empirical benchmark for evaluating fiscal sustainability, health-system resilience, and equity outcomes in other regions, including Latin America, where rising NCD prevalence continues to deepen poverty and inequality (WHO, 2022).
The World Bank (2024) underscores the significance of integrating chronic disease management into primary healthcare systems to foster public health and economic sustainability. This assertion is further substantiated by evidence that underscores NCDs as a substantial cause of premature mortality, disability, and economic loss. Individuals from lower-income groups face heightened vulnerability to chronic conditions due to a combination of factors, including constrained access to healthcare, nutritious food, and physical activity opportunities (Wahnschafft et al., 2024). Concomitantly, intending to mitigate the long-term financial pressures associated with chronic diseases, the OECD (2024) has issued a call for augmented health investment, stipulating that at least 1.4% of GDP be allocated to this area.
The United States reveals the national consequences of this global trend. Chronic diseases have emerged as a dominant public health challenge, resulting in substantial healthcare expenditure and diminished economic productivity. According to the National Center for Chronic Disease Prevention and Health Promotion (NCCDPHP, 2023), these diseases account for over USD 4.1 trillion in annual health expenditure, encompassing direct medical costs and productivity loss. Specifically, heart disease imposes an annual financial burden of USD 216 billion on the U.S. healthcare system, along with a further USD 147 billion lost due to diminished productivity. Disparities across racial, ethnic, and socioeconomic groups further exacerbate the problem. For instance, nearly 40% of Black and Hispanic/Latino older adults report income loss due to chronic conditions, compared to 16.6% of white individuals (Silberman, 2022), underscoring the compounded effect of chronic disease and structural inequity.
Notably, a salient concern is NCDs’ preventable nature, as their proliferation is attributable to underinvestment in prevention, constrained access to quality healthcare, and systemic inequities. The financial sustainability of healthcare systems is further challenged by aging populations and increasing dependence on medical technologies and pharmaceuticals (Hacker, 2024). Furthermore, existing data and modeling tools frequently underestimate the comprehensive costs of chronic diseases, particularly indirect costs such as income and economic productivity loss. This limitation prevents precise forecasts and comprehensive policies.
This study focuses on direct costs due to the lack of consensus and standardization in measuring indirect costs. Recent evidence highlights substantial methodological heterogeneity and variability in valuing informal care, which limits cross-study comparability (Kitschen et al., 2025; Das et al., 2024). Moreover, while MEPS provides robust data on health expenditures and lost workdays, it does not systematically capture presenteeism or the full value of unpaid care. Consistent with the Consolidated Health Economic Evaluation Reporting Standards (CHEERS) recommendations on transparency and clarity in cost reporting, we therefore restricted our analysis to observed direct costs, leaving the integration of indirect costs for future research with more harmonized data (Husereau et al., 2022).
The objectives of this paper are as follows: Firstly, chronic disease trends and related healthcare expenditure are analyzed. Secondly, we construct a projection model to estimate future costs relative to the national GDP. Third, evidence-based policy recommendations are provided to promote both health equity and economic sustainability.
Two hypotheses were formulated as a result of the preceding research objectives. (1) The prevalence of major chronic diseases (e.g., diabetes, cardiovascular diseases, and respiratory conditions) has increased significantly over time and is positively associated with the rise in total healthcare expenditure in the United States (1996–2024). Secondly, it is projected that healthcare expenditures attributable to chronic diseases will exceed GDP growth by 2040, resulting in an escalating proportion of national income being allocated to chronic disease management.
This study employs a multidisciplinary analytical framework integrating public health indicators with economic modeling. Our research incorporates national and international datasets, including sources from the WHO, the Centers for Disease Control and Prevention (CDC), the Medical Expenditure Panel Survey (MEPS), and the American Heart Association. We use these datasets to evaluate direct healthcare expenditure associated with chronic diseases. Using metrics such as GDP share, our analysis assesses the cost trends, disparities, and projected economic impacts up to 2040.
This research provides valuable insights for healthcare policymakers, practitioners, and community leaders by highlighting the complex economic implications of chronic disease. By elucidating these relationships, our study facilitates the development of more efficacious prevention programs to alleviate economic strain, as well as informing long-term strategies for public health investment.
This paper’s structure is outlined as follows: The Section 2 is devoted to a comprehensive review of the extant literature on chronic diseases and their economic burden. The Section 3 details the research methodology, projection model, and analytical tools. The Section 4 analyzes historical data on chronic disease prevalence and healthcare expenditure in the United States from 1996 to 2015, exploring the economic impact of these diseases and including both direct and indirect costs on GDP. The Section 5 discusses the results, policy implications, and recommendations for future research.
Despite the evident economic implications, numerous contemporary models continue to underestimate the indirect costs, particularly in LMICs, where informal caregiving and income loss substantially contribute to the overall burden (Cook et al., 2014). This underestimation is compounded by the lack of integrated models that simultaneously incorporate healthcare cost trends, labor productivity, and demographic change, thereby impeding long-term fiscal planning. This study seeks to address this gap by developing a projection model that quantifies the impact of chronic diseases on GDP, encompassing both direct and indirect costs. By identifying fiscal pressures and equity implications, our analysis aims to inform robust, evidence-based policy strategies to support sustainable health and economic systems.
2. Literature Review
This literature review examines three interrelated aspects of chronic disease burden that are increasingly relevant to health economics and public policy. Firstly, it analyzes the recent empirical evidence on the changing patterns, prevalence, and rising costs of chronic NCDs, particularly in the context of population aging and increasing multimorbidity. Secondly, it reviews the development and implementation of models that forecast the future economic implications of chronic diseases, particularly in relation to the national GDP. Thirdly, by synthesizing findings from both global disparities and national context-specific studies, this review contextualizes the scope and dynamics of chronic disease expenditure—both direct and indirect—while highlighting methodological advances and ongoing limitations in current cost projections. Overall, this review underscores the need for integrated forecasting tools that consider healthcare system pressures, productivity loss, and demographic transitions.
2.1. The Changing Patterns and Costs of Chronic Diseases
Health economics research increasingly focuses on the evolving patterns and rising costs of chronic diseases, particularly as populations age and multimorbidity becomes more prevalent, reshaping healthcare demands and economic priorities worldwide. Chronic NCDs—including diabetes, cardiovascular conditions, chronic respiratory illnesses, mental health disorders, and certain cancers—now represent the leading causes of morbidity and mortality, accounting for over 70% of global deaths and placing a substantial and growing burden on individuals, households, and national health systems.
For instance, in France, data from the National Health Insurance system indicate that treatment costs for conditions such as diabetes, mood disorders, and lung cancer rose significantly between 2015 and 2019, with lung cancer costs increasing by 54%, largely due to expensive hospital-based care (Rachas et al., 2022). In China, the rate of multimorbidity among middle-aged and older adults increased from 70.7% in 2013 to 76.6% in 2023, with distinct multimorbidity patterns expanding from six to nine over the decade and now including combinations such as metabolic disorders with hypertension and chronic respiratory conditions with malignancies (Balducci et al., 2024).
Similarly, in Europe, chronic conditions such as cardiovascular disease, cancer, diabetes, and respiratory illnesses remain highly prevalent. For instance, in Germany, the prevalence of diabetes (8.4%), cardiovascular disease (6.8%), and chronic respiratory conditions (11.4%) exceeds the European average (7.4%, 5.7%, and 7.9%, respectively) (Baumert et al., 2024), while the latest WHO European health report highlights that both cardiovascular disease and cancer each account for roughly one-third of all premature deaths from noncommunicable diseases in the region (WHO, 2025). In the United States, the burden has risen dramatically over recent decades: in 2018, 51.8% of adults had at least one chronic disease, and 27.2% were living with multiple conditions (Boersma et al., 2020), figures that increased to 76.4% and 51.4%, respectively, by 2023 (Watson et al., 2025). This growing prevalence of chronic illnesses has been directly linked to higher healthcare utilization and costs; indeed, recent estimates suggest that approximately 42% of U.S. adults live with at least one chronic disease and that such conditions account for nearly 90% of total healthcare expenditures (Benavidez et al., 2024). Primarily driven by aging, comorbidities, poor diet, and physical inactivity, these illnesses now account for approximately 75% of total healthcare spending, placing significant strain on public programs such as Medicare and Medicaid. As of 2020, cardiovascular disease (CVD) and stroke affected over 45 million adults, with projections indicating an increase to 184 million by 2050 (Joynt Maddox et al., 2024).
Marked disparities in chronic disease outcomes are evident along racial, socioeconomic, and geographic lines. Aggarwal et al. (2021) reported higher age-adjusted mortality rates from diabetes, hypertension, and cardiovascular diseases among rural Black populations in the U.S. In Spain, Pérez-Ardanaz et al. (2024) observed that children with complex chronic diseases used more healthcare services and that factors such as the mother’s occupation influenced service utilization, suggesting persistent coordination gaps in care.
The increasing prevalence of chronic conditions is a primary driver of healthcare spending. In Europe, NCDs are responsible for roughly 25% of the total health spending and nearly 2% of the GDP. Pharmaceutical expenditure ranks as the second largest cost category in hospitals, representing 10% of the total costs in Germany and 8.3% in Italy (Abdulsalam et al., 2022). In the U.S., chronic diseases account for 86% of the total healthcare expenditure (Hoffman & Mertzlufft, 2022), while in South America, NCDs and mental health disorders are projected to impose a macroeconomic burden of approximately 4% of the GDP between 2020 and 2050, with the greatest burden attributed to cancer (Ferranna et al., 2023).
In rural China, Zhou et al. (2020) found that chronic illness accounts for nearly 64% of expected individual medical spending among older adults. In Ethiopia, 64.2% of patients with chronic illnesses faced catastrophic health expenditure (CHE), primarily due to pharmaceutical and transport costs (Shumet et al., 2021). In Nepal, Rai et al. (2022) observed that 14.6% of older adults with chronic diseases experienced CHE, with single individuals being especially vulnerable.
Beyond direct costs, chronic diseases impose significant indirect costs through productivity loss. In China, Japan, and South Korea, these losses are estimated to reach trillions of dollars over the coming decades (Bloom et al., 2017). Chronic illness reduces labor force participation, with evidence showing that European men with chronic conditions experience larger wage reductions than women (Polanco et al., 2024). In Finland, individuals with type 1 diabetes exit the labor force earlier than those with type 2 diabetes, leading to higher productivity losses (Kurkela et al., 2021). In the U.S., chronic illnesses such as cancer, pain, and depression result in up to 80 h of lost work per year per employee (Rojanasarot et al., 2023).
These findings highlight that chronic diseases are not only a leading cause of ill health but also a substantial and growing economic burden. Pharmaceuticals, transportation, and productivity loss are key contributors to both direct and indirect costs. Prevention and effective management strategies—combined with rigorous economic evaluation—are critical in mitigating their impact. Forward-looking cost projections are thus vital for informed policymaking.
2.2. Projection Models for Chronic Disease Costs and GDP Impact
Projection models for chronic disease costs have become essential for policymakers aiming to anticipate future healthcare and economic challenges. These models consistently demonstrate that the economic burden of chronic conditions is set to rise faster than GDP, especially in aging societies. For instance, dynamic microsimulation projections for Austria indicate that demographic aging will substantially increase future healthcare spending (Horvath et al., 2025). Similarly, the health-augmented macroeconomic (HAM) model estimates the broader impact of chronic diseases on labor supply, productivity, and GDP, offering valuable foresight for policy decisions (X. F. Chen et al., 2025). In the United States, chronic diseases now account for 90% of total healthcare expenditures—approximately USD 4.9 trillion annually—with cardiovascular disease alone projected to contribute around USD 2 trillion by 2050, exerting considerable pressure on federal entitlement programs (CDC, 2025).
Frequently applied to Chronic Kidney Disease (CKD), diabetes, and Chronic Obstructive Pulmonary Disease (COPD), microsimulation models incorporate disease progression, comorbidities, and treatment strategies to estimate the long-term costs at national and subnational levels (Ansah & Chiu, 2023; Chadban et al., 2024). Mannino et al. (2024) forecast that COPD-related medical costs in the U.S. will rise from USD 31.3 billion in 2019 to USD 60.5 billion by 2029. Bommer et al. (2018) estimate that diabetes may cost up to 2.2% of the global GDP by 2030, even under optimal WHO policy scenarios. Macroeconomic modeling of the global cancer burden projects USD 25.2 trillion in economic cost between 2020 and 2050, translating to about 0.55% of annual global GDP (S. Chen et al., 2023a). Additionally, cancer patients now incur financial costs that represent more than double their households’ average annual income, underscoring the substantial disparity in economic burden between individuals with and without the disease (Sarker et al., 2025).
Demographic trends will further intensify these costs. The Global Burden of Disease (GBD) Study 2021 projects that, by 2050, NCDs will be the leading contributors to Disability-Adjusted Life Years (DALYs). In the U.S., the number of people aged 50+ with chronic conditions is expected to double by 2050, putting further strain on long-term care systems (Ansah & Chiu, 2023).
Health-augmented macroeconomic models measure how chronic diseases impact national productivity and capital accumulation. S. Chen et al. (2023b) estimate that chronic diseases will amount to a 0.11% annual tax on global GDP by 2050. Kazi et al. (2024) project that healthcare costs for Cardiovascular Disease CVD in the U.S. will nearly quadruple by 2050, reaching USD 1.49 trillion annually, with productivity losses increasing by 54%.
In Brazil, Russia, India, China, South Africa (BRICS) countries, Sahoo et al. (2023) projected heterogeneous health spending trends using exponential smoothing models. Brazil will maintain the highest share of GDP devoted to health (10.67%), while, due to strong public financing, Russia will lead in per capita spending. Conversely, India’s health spending—both per capita and as a share of GDP—is projected to decline, exacerbating reliance on out-of-pocket payments.
2.3. Global Disparities and Context-Specific Insights
Despite advancements in projection techniques, substantial variation persists across countries and disease types. More recent estimates place the 2021 global economic burden of heart failure at USD 284 billion, with approximately 48% attributable to direct medical costs and 52% to indirect costs such as productivity loss (Darvish et al., 2025). At the same time, the global prevalence of hypertensive heart disease linked to high sodium intake increased markedly from 4.6 million to 12.5 million cases between 1990 and 2021. Although mortality rates have shown a modest decline, the absolute burden remains high, underscoring persistent regional inequalities in disease impact (Wang et al., 2025).
Although Hoffman and Mertzlufft (2018) projected that U.S. health spending would grow at 5.6% annually through 2025—primarily driven by chronic diseases—recent data suggest that this projection has largely materialized. National health expenditures reached USD 4.8 trillion in 2023, already outpacing GDP growth, and actuaries now estimate a 7.1% increase in spending for 2025 (CMS, 2024a, 2024b). Moreover, projections for 2023–2032 anticipate an average annual growth rate of 5.6%, closely aligning with the earlier forecast. Even countries with constrained budgets continue to face substantial indirect costs from chronic conditions, threatening both fiscal balance and economic stability.
The evidence suggests that improved prevention, integrated care systems, and enhanced financial protections are key to reducing the long-term burden. However, few studies comprehensively estimate the chronic disease costs as a share of the GDP while integrating both direct and indirect dimensions and addressing inequities. This paper contributes to this gap by developing a multidisciplinary projection model to inform equitable and evidence-based health policy.
3. Methodology
The objective of this paper is to analyze the determinants of real expenditure on selected chronic diseases—namely cancer, cerebrovascular diseases, COPD and asthma, diabetes mellitus, epilepsy and seizures, hyperlipidemia, hypertension, renal and related diseases, and osteoarthritis and other non-traumatic disorders—during the period 1996–2015. Annual expenditures for these ten major chronic conditions were estimated using the Medical Expenditure Panel Survey (MEPS). The analytic files cover 1996–2015, the most recent years in which MEPS provides condition–event link files fully compatible with the Clinical Classification System (CCS). Since 2016, MEPS has adopted the Clinical Classifications Software Refined (CCSR), which is not directly comparable to the earlier CCS codes. Therefore, restricting the analysis to 1996–2015 ensures internal consistency in diagnostic coding and expenditure estimates throughout the study period.
Expenditure determinants are defined as variables that exert a statistically significant influence on healthcare spending. The variables analyzed include the number of individuals receiving care, emergency room visits, home care events, hospital admissions, office visits, outpatient consultations, and the number of medications purchased, disaggregated by disease and year. Given the nature of the available data, we conducted our analysis using panel data, a methodological approach that has been demonstrably effective in contexts where the variables in question depend on both time and categories (Wooldridge, 2021).
Subsequently, using an Autoregressive Integrated Moving Average model (ARIMA), our study aims to project real expenditure on these diseases as a share of GDP by 2030. With this forecast, we endeavor to estimate the anticipated economic impact of chronic diseases on the national economy.
3.1. Methodological Description
To estimate the determinants of spending on the selected chronic diseases during the studied period, as well as their impact, a panel data model was chosen. According to Wooldridge (2021), a panel dataset is essentially a time series for each entity in a cross-sectional database. In other words, there is one observation for each unit in time , where there are N units for each observation, and T periods . In this work, each unit represents a chronic disease, with 10 diseases, , observed for each year of the period studied, from 1996 to 2015, .
A panel data model is appealing for several reasons. The primary rationale for this approach is that it enables us to control the effect of unobserved variables, which remain constant over time but vary between entities (e.g., chronic diseases or population groups). In the absence of such control, bias could be introduced into the estimation if an ordinary least squares regression were performed (Stock & Watson, 2011). Secondly, this model facilitates more effective analysis and better comprehension of temporal dynamics, i.e., changes that occur over time. These dynamics may encompass trends, patterns of behavior, or effects that only become evident when the same units are observed over several periods. A third reason for their appeal is that these models frequently possess a substantial number of observations. If units of observation are present and the survey is conducted over time, there are periods during which potential observations may be made (Dougherty, 2016).
Two types of data panel models will be utilized in this analysis: fixed (FEs) and random effects (REs). The RE model operates under the key assumption that unobserved variables are uncorrelated with observed variables; that is, it assumes that any unmeasured individual characteristics (e.g., chronic disease) do not systematically affect the variables of interest over time. However, this assumption may not be valid in all cases. If the unobserved variables are correlated with the explanatory variables, RE estimates are imprecise (Dougherty, 2016). Conversely, within the framework of the FE model, the impact of unobservable variables is mitigated through differencing observations within each unit of analysis over time. Mathematically, this is equivalent to transforming the data so that only within-unit variation is used; this thus eliminates constant differences between units that might be correlated with the independent variables (Wooldridge, 2021).
In summary, for the advantages of its efficiency and data-saving capabilities, using the RE model is recommended when it is assumed that the unobserved variables affecting the dependent variable are not correlated with the explanatory variables. Conversely, the FE model is used when there is a suspected correlation between the unobserved and explanatory variables. Although it sacrifices information related to any constant variables over time, this approach helps avoid biases in the estimates.
In its generalized form, the panel data model is expressed as follows:
where is the dependent variable, and are the independent variables for each unit (i) and time (t), is a compound error term, are the individual effects, and are the error model. In the context of a fixed effects model, the elimination of unobservable variables () is a crucial step, particularly in instances where there is suspected correlation with the independent variables. Within the framework of the random effects model, the unobservable variables () constitute an integral error component (). The betas are estimators of the extent to which the dependent variable is expected to increase with a marginal increase in the independent variable.
Determining the appropriate specification for panel data analysis requires establishing whether a fixed effects or a random effects model is more suitable. The Hausman test is widely employed for this purpose, as it evaluates the potential correlation between unobserved heterogeneity and the independent variables. Under the null hypothesis, it is assumed that unobserved factors are uncorrelated with the explanatory variables, which justifies the use of the random effects model given its greater efficiency. Conversely, rejection of the null hypothesis implies the presence of correlation, indicating that the fixed effects model constitutes the more consistent and reliable estimator (Wooldridge, 2021).
In panel data analysis, the F-test for individual (fixed) effects is the appropriate statistical procedure to assess whether the inclusion of unit-specific intercepts is justified. This test evaluates the null hypothesis that all individual effects are jointly equal to zero, implying that a panel data model would be sufficient. A statistically significant result (e.g., p-value < 0.05) leads to the rejection of this null, thereby indicating the presence of meaningful individual heterogeneity and validating the use of a fixed effects specification (Greene, 2018; Hsiao, 2022).
Another rigorous approach to validate the appropriateness of a panel data model is through the intraclass correlation coefficient, denoted as Rho. This metric quantifies the proportion of the total variance in the dependent variable that is accounted for by the unobserved individual-specific effects. A low p-value (approaching zero) suggests that individual heterogeneity contributes minimally to the variance, in which case a panel data model might suffice. Conversely, a high and statistically significant Rho indicates that a substantial share of the variability in the dependent variable arises from individual-specific characteristics—thus justifying the adoption of a panel data specification (Wooldridge, 2021).
The second part of the analysis focuses on forecasting the burden that chronic diseases will have on the U.S. economy by 2030. For this, an ARIMA model is used. The objective of this study is twofold: first, to forecast real chronic disease spending, and second, to forecast real U.S. GDP, both at 2015 prices. Disease spending is then analyzed as a percentage of GDP.
The ARIMA model integrates autoregressive components (AR), which employ series lags to forecast future values, with moving average components (MA), which assimilate lags from previous forecast errors. The integration term (I) in ARIMA indicates the necessity of differentiating the time series to achieve stationarity, something which is imperative for accurate forecasting (Nau, 2020).
In general terms, the ARIMA forecast equation is as follows:
The constant is the proportion by which the current period is explained based on the previous period (i.e., the autoregressive parameter). Conversely, denotes the proportion by which the current error is explained by the error of the previous period (Nau, 2020).
In time series analysis, diagnostic procedures play a crucial role in validating model assumptions. The Dickey–Fuller test is employed to determine whether a series is stationary by testing the null hypothesis of a unit root—implying non-stationarity—against the alternative of stationarity, thereby ensuring that econometric models relying on constant statistical properties over time are appropriately applied (Dickey & Fuller, 1979; Shumway & Stoffer, 2021). Complementarily, the Ljung–Box test evaluates whether the residuals of a fitted model behave as white noise by testing the joint null hypothesis that autocorrelations up to a specified lag are zero. Failure to reject this hypothesis suggests that the residuals are random and uncorrelated, indicating that the model has adequately captured the serial dependence in the data. In contrast, rejection signals remaining autocorrelation and possible model misspecification (Ljung & Box, 1978; Zhang, 2025).
It is sometimes useful to use a multiplicative ARIMA model that considers the seasonal part of the time series. One of the most used models is the Seasonal Autoregressive Integrated Moving Average (SARIMA).
The SARIMA can be mathematically represented as follows:
3.2. Database Description
The variables employed in this analysis are estimates derived from the Medical Expenditure Panel Survey (MEPS), a survey conducted by the Agency for Healthcare Research and Quality (AHRQ) of the U.S. Department of Health and Human Services. MEPS has been in operation since its inception in 1996. The objective of the survey is to collect data on healthcare use and costs, health insurance coverage, and access to health services through questionnaires targeted at a representative sample of the U.S. household population (AHRQ, n.d.).
The information is organized by chronic disease (cancer, cerebrovascular disease, COPD and asthma, diabetes mellitus, epilepsy and seizures, heart disease, hyperlipidemia, hypertension, renal and related diseases, osteoarthritis and other non-traumatic joint disorders) and time, from 1996 to 2015.
Each observation is associated with many variables, which are collectively summarized in thousands. The dependent variable, denoted by the acronym Actual Exp T, refers to the total sum of out-of-pocket expenditure incurred for healthcare services received during the specified period. This encompasses out-of-pocket payments, as well as those facilitated by private insurance, Medicaid, Medicare, and other government or private health insurance sources. It is essential to note that the expenditure related to over-the-counter medications is not included in the overall total spending estimates. The independent variables are as follows:
- Persons with active treatment (PWCT). This term is used to denote the treatment prevalence, which is defined as the number of persons with a medical event or the purchase of a prescribed medication for a particular condition.
- Emergency room visits (emergencyroomvisits) are defined as any visit to a hospital emergency room during the person’s referral period.
- Home health events (homehealthevents) are defined as a month during which home care services were received.
- Hospital stays (inpatientevents) are defined as any instance in which an individual is admitted to a medical facility for a minimum of one night for care and treatment.
- Office-based events (officebasedevents) are defined as medical services provided outside the confines of hospitals. These services are rendered in various settings, including individual or group practices, clinics, community health centers, surgical centers, rural areas, business offices, educational institutions, non-critical emergency rooms, veterans’ services, and laboratory settings.
- Outpatient events (Outpatientevents) are defined as visits to departments or facilities associated with hospitals that offer medical and health services to patients who do not necessitate overnight hospitalization.
- Prescription medicines (Prescriptionmedicines) are defined as a medicine purchase or a prescription refill.
- Population between 18 and 44 years old (poblacion1844).
- Population between 45 and 64 years of age (poblacion4564).
- Population over 65 years of age (poblacion65).
It is essential to recognize that the population variables serve as control variables within the model. Moreover, it is crucial to emphasize that the same observation is applied to each disease in year t.
Additionally, for the ARIMA model, we have a database of the U.S. real GDP by quarter for the period studied (1996–2015), obtained from the Federal Reserve Bank of St. Louis (U.S. Bureau of Economic Analysis, n.d.). For both real spending per illness and GDP, the database was transformed to constant 2015 prices.
All empirical models presented in this study were estimated using the statistical software R (R Core Team, 2023). This environment was selected due to its robustness, flexibility, and the wide availability of specialized packages for econometric and statistical analysis, which ensured the accuracy and reproducibility of the results.
Determinants of Chronic Degenerative Disease Cost
As previously mentioned, we estimated the determinants of chronic degenerative disease spending by implementing a panel data model structured as follows:
Here, , and , where 1 = cerebrovascular disease, 2 = COPD and asthma, 3 = diabetes mellitus, 4 = renal and related diseases, 5 = osteoarthritis and other non-traumatic joint disorders, 6 = cancer, 7 = epilepsy and seizures, 8 = heart disease, 9 = hyperlipidemia, and 10 = hypertension.
4. Results
The Hausman test was initially employed, suggesting the utilization of a random effects panel data model. To identify the statistically significant variables explaining real expenditure, we applied a series of models, with the final of these expressed as presented in Table 1:

Table 1.
Random effects panel data model results.
The p-value for the F test is 0, which is less than 0.05, indicating that all coefficients in the model are statistically significant. Finally, a high Rho (0.92) value is obtained, indicating that 92% of the observed variance in spending is explained by differences between chronic diseases, as well as time-constant unobservable effects.
Consistent with the theoretical expectations, the preliminary findings suggest that age is a key factor in predicting spending. During the period studied, spending on chronic diseases increased in line with population aging over 65 years of age. In general, control variables are incorporated into the model to observe the effect of specific categories or groups. However, interpreting their coefficients may be less direct or informative than those of the continuous variables. The impact of office-based events on spending is significant and can be attributed to the ongoing treatment required for chronic degenerative diseases. Given that spending is expressed in real terms, this implies an increase in treatment costs per consultation. According to Table 1, for each additional consultation, spending on these diseases increases by USD 559,242. Conversely, for each prescription medicine purchased, spending on these diseases increases by USD 85,871. Moreover, one of the most notable findings of this study was the unexpected response to the initial research question. This study posited that, for each additional person receiving care, spending on these diseases would decrease by USD 669.39. This finding offers an optimistic outlook on chronic disease management in the United States, as evidenced by the decrease in average real spending per person receiving care for several chronic diseases. This trend may indicate enhanced care efficiency or treatment cost-effectiveness.
Building on the above discussion, Table 2 presents the percentage change in average real expenditure per person receiving care between 1996 and 2015, thereby supporting the preceding panel data model results. This measure is derived from the ratio of total real spending on a specific disease to the number of individuals receiving care for that condition.
Table 2.
Percentage change in real expenditure per person receiving care between 1996 and 2015 (figures in USD).
Cancer, epilepsy, seizures, heart disease, hyperlipidemia, and hypertension stand out for their reduction in per capita spending (at constant 2015 prices) for persons receiving care in real terms. To determine whether this is the reason for the negative coefficient on the PWCT (persons receiving care) estimator, a panel data model was estimated using only diseases with increased actual expenditure
Before estimating the refined model, the Hausman test was conducted, and the resulting p-value was statistically significant, leading to the rejection of the null hypothesis and confirming that a fixed effects specification was the most appropriate. Building on this result, Table 3 presents the outcomes of the panel data model after a specification refinement process in which statistically insignificant variables were excluded. This procedure improves the efficiency and consistency of the estimators by reducing potential noise and multicollinearity, thereby yielding a more parsimonious model. Consequently, the final specification retains only variables that are both statistically significant and theoretically relevant, enhancing the explanatory power and robustness of the estimated relationships.
Table 3.
Fixed effects panel data model.
The fix effect panel data model presented in Table 3 is adequately robust. First, a probability of the F test is less than 0, indicating that at least one of the individual factors are significantly different from zero. Furthermore, the Rho value suggests that 94% of the variation in expenditure is due to disease variation.
According to Table 3, for each additional week of care time (PWCT), spending on these diseases increases by approximately USD 1253, a result that is statistically significant. Similarly, each additional outpatient event is associated with an increase of USD 629, while every prescription medicine purchased raises expenditures by USD 103, both of which are significant at conventional levels. Emergency room visits also contribute to higher costs, with an estimated increase of USD 3927 per visit.
A comparison between Table 1 and Table 3 reveals how the scope of diseases included in the model alters the estimated effect of patient weeks of care time (PWCT). When considering ten chronic diseases (Table 1), the coefficient for PWCT is negative and statistically significant, indicating that each additional week of care was associated with a reduction of approximately USD 669 in total spending. However, when the analysis is restricted to the five chronic diseases that exhibited a positive percentage change in expenditures between 1996 and 2015 (Table 3), the effect of PWCT reverses sign. In this refined specification, PWCT becomes positive and highly significant, with each additional week of care associated with an increase of about USD 1253 in expenditures. This contrast underscores the sensitivity of the results to the set of conditions analyzed and highlights the importance of disease selection in shaping the interpretation of healthcare cost dynamics.
Total Spending Forecast for Chronic Degenerative Diseases as a Share of GDP by 2040
We utilized an ARIMA model to project the impact of chronic diseases on the U.S. economy by 2040. To apply this model, we need to justify the stationarity condition of the time series with the Dickey–Fuller test. Finally, we argued the relevance of the model with the Ljung–Box test.
First, we forecasted the time series of U.S. quarterly real GDP at constant prices from 2015 to 2040. Next, the expenditure for each chronic disease was predicted to assess the economic burden of each condition. Finally, we analyzed and compared the sum of spending on these diseases to the annualized GDP forecast.
A SARIMA (2, 0, 0) (2, 1, 0) model was selected for forecasting the quarterly GDP. Including seasonal autoregressive terms (SAR) with a seasonal period of four quarters suggests that the model captures seasonal patterns in the data, indicating a repeating pattern. Due to the seasonal behavior of this quarterly time series, the seasonal difference stabilized the series.
Applying the Ljung–Box test to the model residuals revealed the absence of statistical evidence indicative of significant autocorrelations. This finding suggests that the ARIMA (2, 0, 0) (2, 1, 0) model effectively captured the data’s underlying patterns, resulting in residuals that resemble white noise. This outcome is consistent with the expectations of a well-fitted time series model.
As illustrated in Figure 1, the model demonstrates an adequate capacity to replicate the behavior exhibited during previous periods, thereby facilitating precise forecast. When the confidence level is set at 80% or 95%, a discernible trend emerges. In the medium and long term, the confidence intervals suggest a greater degree of forecast uncertainty.
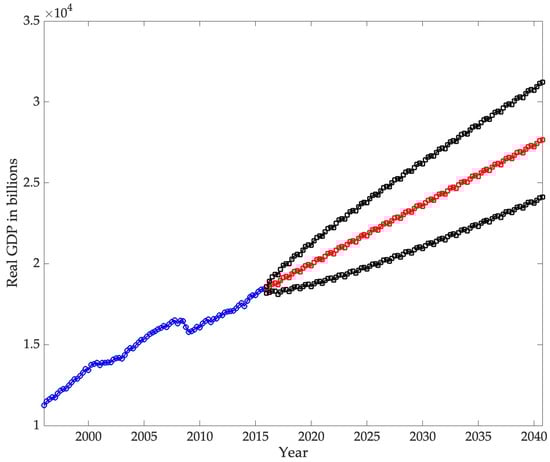
Figure 1.
Quarterly real GDP forecast for 2040 in red with the 95% confidence intervals shown in black. Source: Author’s elaboration of data from the Medical Expenditure Panel Survey.
However, there is a noticeable trend, and the intervals are not significantly wide, meaning that, in summary, the forecast is satisfactory. The long-term real US GDP forecast—at constant 2010 prices and as projected by the OECD (2024)—indicates a value of USD 18,627.602 billion.
In contrast, the forecast generated in this study estimates a real US GDP of USD 18,627,307.92 million. This observed discrepancy may be attributable to the OECD’s use of constant 2010 prices, in contrast to the constant 2015 prices employed in this analysis. This outcome suggests a high degree of confidence in the short-term forecast accuracy. According to the OECD (2024), in 2030, the real GDP is projected to be USD 24,671,940 million. However, the prediction presented in this study indicates a slightly lower figure of USD 23,807,164.66 million. This comparison, though not exact due to the difference in base years, demonstrates confidence in the forecast, particularly in the short term.
Figure 2 illustrates, based on the historical data from 1995 to 2015, the projected increase in total chronic disease spending through 2040. The upward trend is both steep and consistent, indicating that health spending for these diseases is expected to continue growing at a rapid rate with no signs of slowing. The forecast line, delineated in blue, indicates a linear increase, suggesting that spending is not only anticipated to rise persistently but also consistently and predictably. The confidence intervals, which widen into the future, reflect natural uncertainty in long-term estimates; however, even with this uncertainty, rising spending is clearly expected. In summary, a steady and steep increase in chronic disease spending is expected.
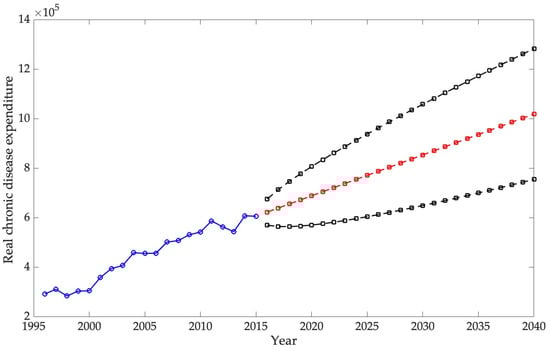
Figure 2.
Forecasted real chronic disease expenditure for 2040 in red with the 95% confidence intervals shown in black. Source: Author’s elaboration with data from the Medical Expenditure Panel Survey.
To visualize the estimated real future economic impact of chronic disease spending on the economy, the results were compared to the GDP forecast previously obtained. Figure 3 illustrates the trajectory of real chronic disease spending as a percentage of GDP from 2016 to 2040. The historical line exhibits fluctuations and a general upward trend, culminating in a projection that extends beyond the most recent observed data. The forecast line indicates a persistent trend of escalating expenditure on chronic diseases, with projections indicating a 0.9265% share of GDP by 2040. Despite the inherent limitations of interpreting forward projections with limited observations, Figure 3 demonstrates a clear increasing trend in real chronic disease spending as a percentage of GDP by 2040. Calculated in real terms and with reference to 2015 base-year prices, this progression evidence not only an increase in spending on these diseases but also a rate of increase that exceeds the country’s overall economic growth. This upward trend indicates that the financial impact of chronic diseases is progressively encroaching on national economic resources. When controlling inflation using 2015 prices, the rise can be attributed to mounting pressures on health and welfare systems.
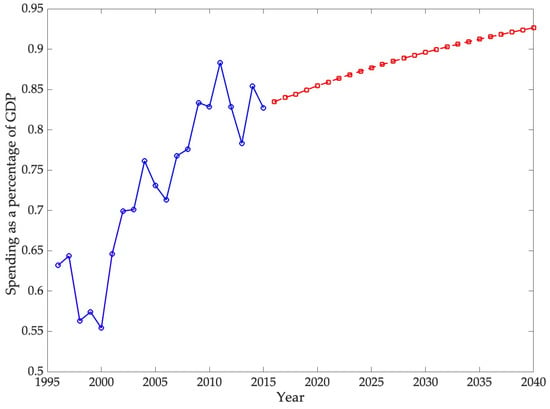
Figure 3.
Forecast for real spending on chronic diseases as a percentage of GDP by 2040 in red with the 95% confidence intervals shown in black. Source: Author’s elaboration with data from the Medical Expenditure Panel Survey.
Figure 4 presents the real spending forecast for COPD, asthma, diabetes mellitus, osteoarthritis, and other non-traumatic joint disorders, providing a more detailed analysis of this situation. As previously discussed, these diseases are characterized by a considerable increase in real expenditure, significant treatment costs, and a high prevalence. Consequently, this graph’s data can serve as a valuable tool for budget planning and future health policy development. Historical data demonstrate a consistent upward trend until 2015, a trend that the forecast indicates will continue, suggesting a significant increase in real spending on these diseases.
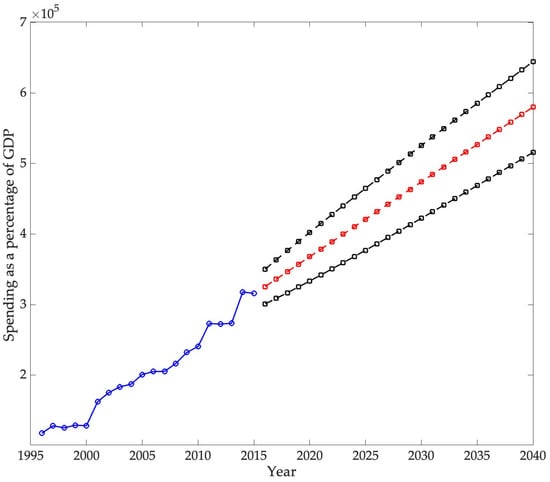
Figure 4.
Forecast of real expenditure on COPD, asthma, diabetes mellitus, osteoarthritis, and other non-traumatic disorders for the year 2040 in red with the 95% confidence intervals shown in black. Source: Author’s elaboration with data from the Medical Expenditure Panel Survey.
This projection not only indicates an anticipated increase in spending but also a notable acceleration in the growth rate, as evidenced by the upward slope of the forecast line. This observation is sustained at a 95% confidence level throughout the projection period.
Finally, Figure 5 illustrates that the projected expenditure on these five diseases calculated as a percentage of the GDP, showing the impact of those with the highest influence on total chronic degenerative disease expenditure in the US.
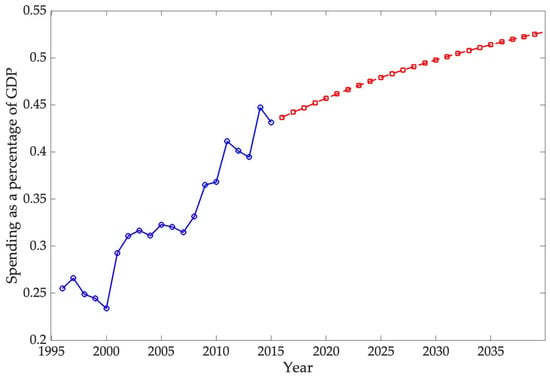
Figure 5.
Real spending forecast on COPD, asthma, diabetes mellitus, osteoarthritis, and other non-traumatic disorders as a percentage of U.S. GDP by 2040 in red with the 95% confidence intervals shown in black. Source: Author’s elaboration with data from the Medical Expenditure Panel Survey.
As with the overall spending, the share of the GDP for chronic diseases is projected to rise and hit 0.5278% in 2040.
5. Discussion
The panel model results indicate that healthcare expenditure is primarily driven by emergency visits, outpatient consultations, medication purchases, and an aging population. These determinants underscore the central role of ongoing medical care and reliance on pharmaceuticals. Prior studies report similar patterns: Muhuri (2022) found that consultations accounted for more than half of osteoarthritis-related costs, while medications represented over 60% of diabetes spending. In contrast, the association between cerebrovascular disease expenditure and emergency visits is less evident, suggesting a different underlying relationship. This comparison reinforces the robustness of the present findings
Another notable result is the decline in real per-patient spending for certain diseases, including cancer, epilepsy, heart disease, hypertension, and hyperlipidemia. This trend may signal gains in treatment efficiency or wider access to cost-effective therapies. Previous studies, however, consistently reported increases in per-patient costs (Buttorff et al., 2017; Raghupathi & Raghupathi, 2018). The decrease observed here, therefore, provides a contrasting perspective and highlights the need for further research to determine whether it reflects actual efficiencies, shifts in coverage, or changes in medicine and service prices.
When compared with earlier projections and recent official statistics, the results of this study provide a more nuanced perspective on the economic burden of chronic diseases. DeVol et al. (2007) anticipated nominal expenditures of USD 790 billion in 2023 for a broad set of chronic conditions, while estimating USD 737.5 billion in real terms, and suggested that indirect costs could reach USD 3.4 trillion. More recent figures from the National Health Expenditure Accounts reported total U.S. health spending of USD 4.9 trillion in 2023 (17.6% of GDP), with the CDC (2025) attributing nearly 90% of this expenditure to individuals with chronic conditions and mental health disorders, equivalent to over USD 4 trillion. By contrast, the forecasts presented in this study, focused specifically on ten chronic diseases—cerebrovascular disease, COPD and asthma, diabetes mellitus, renal and related diseases, osteoarthritis and other non-traumatic joint disorders, cancer, epilepsy and seizures, heart disease, hyperlipidemia, and hypertension—indicate that these conditions accounted for 0.92% of GDP in 2023. This discrepancy reflects the differences in scope between broader national expenditure estimates and disease-specific modeling, while reinforcing the importance of clearly defining the set of conditions under analysis when evaluating the macroeconomic burden of chronic diseases
The ARIMA model employed in this study estimates that direct spending on the selected chronic diseases will reach 0.9265% of GDP by 2040, confirming a persistent upward trajectory in the economic burden of these conditions. International projections show similar trends. For example, S. Chen et al. (2023b) estimated that the global macroeconomic burden of chronic obstructive pulmonary disease (COPD) will amount to INT$4.326 trillion between 2020 and 2050, equivalent to an annual levy of approximately 0.111% of global GDP. In the United States, the direct medical expenditures for COPD were calculated at USD 31.3 billion in 2019, with projections reaching USD 60.5 billion by 2029, highlighting the rapid escalation of costs (Mannino et al., 2024). Likewise, Kahn et al. (2023) reported that the total annual economic cost of diabetes in the U.S. amounted to USD 413 billion in 2022, with USD 306.6 billion in direct medical costs and USD 106.3 billion in indirect costs. Although these studies differ in scope and methodology, they consistently demonstrate that direct costs are rising, while indirect costs—such as lost productivity, informal caregiving, and infrastructure—remain substantial. Consequently, the projections presented here likely underestimate the total economic impact of chronic diseases by focusing exclusively on direct expenditures.
Taken together, the findings confirm that population aging and the rising prevalence of chronic diseases will continue to strain health budgets. Policy responses should therefore focus on the following: (1) investing in preventing modifiable risk factors (diet, physical inactivity, smoking); (2) strengthening primary care and access to cost-effective medicines; and (3) developing information systems and forecasting models that integrate both direct and indirect costs to improve fiscal and health planning.
In addition to the public policy responses that have been previously suggested, there are other structural factors that have the potential to have a positive impact on cost reduction within the health sector, particularly in the care of chronic diseases. In a similar fashion, an array of structural changes at the political level has the potential to engender uncertainty and elevate the costs associated with these diseases. The following subsection will provide a detailed discussion of the aforementioned structural changes.
5.1. Structural Changes Plausibly Affecting Economic Burden
Forecasting the direct economic burden of chronic diseases over an extended horizon necessarily entails assumptions about the stability of structural, technological, and policy conditions. However, the last decade has shown that medical innovation, digital transformation, and geopolitical uncertainty can alter health-care costs at a systemic level. This section discusses the main structural changes that could plausibly reshape the projected economic burden in the United States between 2025 and 2040. The discussion emphasizes three main drivers—medical technological breakthroughs, the diffusion of artificial intelligence in health systems, and macro-policy uncertainty—together with their potential offsetting risks.
5.1.1. Technological Developments in Medicine
One of the most significant advances in biomedical innovation is the emergence of GLP-1 receptor agonists, a class of drugs that has redefined the treatment paradigm for obesity, type 2 diabetes, and related cardiometabolic disorders. Srivastava et al. (2025) contend that these pharmacological breakthroughs should be regarded as public goods, given their potential to reduce aggregate health-care expenditures, enhance labor productivity, and generate positive externalities across society. The central argument is that the social and economic gains associated with their use extend beyond direct users, yielding benefits for workforce participation, public health budgets, and overall social cohesion.
Empirical estimates suggest that, if left unaddressed, obesity alone could account for up to 3% of global GDP losses by mid-century, whereas the widespread adoption of GLP-1 therapies could substantially alleviate this fiscal burden. At such magnitude, an innovation that effectively reduces the prevalence of obesity and diabetes could exert a macroeconomic impact akin to a “reverse recession”—a positive shock that releases resources, raises productivity, and reshapes projected expenditure trajectories. Furthermore, government-led financing initiatives—comparable to Operation Warp Speed during the COVID-19 pandemic—could accelerate the accessibility, affordability, and global diffusion of GLP-1-based treatments.
While the authors acknowledge that private investment has historically been the principal engine of such medical innovation, they caution that its dependence on financial-market cycles introduces volatility and uncertainty, jeopardizing the continuity of research and development. Consequently, they advocate for a complementary role of the State as a strategic co-financier, particularly during the early phases of innovation when expected benefits are uncertain yet potentially transformative.
5.1.2. Technological Developments in Computer Science and Other Fields
Artificial Intelligence as a Structural Driver of Health System Productivity: From Technological Promise to Epistemic Realism.
Parallel to biomedical innovation, the rise of artificial intelligence (AI) has redefined the structural foundations of health systems. Drawing on Topol (2019, 2023) and Xu et al. (2024), AI emerges not merely as a technological tool but as a complementary engine of productivity that reshapes how data, diagnosis, and decision-making interact within modern medicine.
Topol (2019) frames AI as a response to a systemic crisis marked by escalating costs, administrative inefficiency, and cognitive overload. Deep-learning algorithms applied to medical imaging, genomics, and electronic health records can detect patterns invisible to human perception, automate routine tasks, and free clinical time. These processes enhance system-wide efficiency and reduce unit costs of care, even without therapeutic innovation. However, Topol cautions against the “AI gap”—the discrepancy between statistical accuracy and real clinical value—emphasizing that predictive precision is insufficient if it fails to improve outcomes or equity.
By 2023, Topol extends this vision to describe a structural transition from unimodal to multimodal AI, capable of integrating text, image, voice, and clinical data. This shift implies transformative effects on cost determinants: fewer hospitalizations through remote monitoring, earlier detection via multimodal correlations, and optimization of medical labor through intelligent task allocation. In macroeconomic terms, such integration could slow the growth of chronic-disease expenditures by fostering sustained productivity gains despite demographic aging.
Yet, Xu et al. (2024) introduce a critical corrective through computability theory: hallucinations in large language models (LLMs) are mathematically inevitable. No computable system can accurately represent all computable functions; thus, errors are intrinsic, not accidental. The implication is both epistemological and economic—AI can enhance productivity but cannot function autonomously without human oversight. Governance, ethical regulation, and professional accountability remain essential to prevent the social and financial costs of algorithmic error.
Taken together, these contributions mark an intellectual progression: from the 2019 optimism of high-performance medicine to the 2023 vision of cognitive infrastructure and, finally, the 2025 recognition of AI’s logical limits. This evolution signals a mature understanding of medical AI: it complements rather than replaces human judgment, operating within a regime of controlled uncertainty. The physician’s role transforms into that of curator and auditor of machine intelligence, ensuring that efficiency gains align with ethical responsibility and patient welfare.
Ultimately, while pharmacological innovation remains the most direct means to reduce the economic burden of chronic diseases, AI constitutes a structural mechanism that amplifies systemic efficiency. Its capacity for predictive management, diagnostic automation, and resource optimization justifies the inclusion of AI-induced productivity gains in future economic projections—provided they rest on transparent, accountable, and human-supervised foundations.
5.1.3. Policy Uncertainty
Campello et al. (2022) demonstrate that political instability generates uncertainty that discourages investment and innovation. Although their study centers on corporate responses to the Brexit referendum, its implications extend directly to the health sector. When similar uncertainty arises in health policy—through abrupt regulatory shifts, inconsistent pharmaceutical governance, or reduced public research funding—it produces a “wait-and-see” effect that delays medical innovation and technological diffusion.
In the health-care context, this dynamic translates into slower development of preventive and low-cost therapies, the persistence of treatable chronic conditions, and an overall rise in long-term expenditure. Political volatility thus becomes a structural driver of inefficiency, not by lowering medical productivity but by eroding the institutional and financial conditions that sustain research. Consequently, uncertainty in policy environments limits innovation throughput and amplifies the economic burden of chronic diseases, as health systems face higher maintenance costs and diminished capacity for preventive action.
In sum, Campello et al. provide a theoretical and empirical foundation to understand how political instability undermines innovation-driven cost reduction in health care, transforming uncertainty into a key determinant of rising health expenditure and sustained.
6. Conclusions
The results of this study provide strong empirical support for the two central hypotheses. First, the analysis confirms that the prevalence of major chronic diseases—such as diabetes, cardiovascular diseases, and chronic respiratory conditions—has increased substantially over time and is positively associated with the rise in total healthcare expenditure in the United States between 1996 and 2015. This relationship is primarily driven by three interrelated determinants: the growing number of medical consultations, higher prescription drug utilization, and population aging. Together, these factors explain the sustained upward trajectory of aggregate healthcare spending, even as real per capita costs have declined under certain conditions due to improvements in treatment efficiency and access to cost-effective therapies.
The second hypothesis, concerning the long-term trajectory of expenditure relative to GDP, is also supported by the ARIMA projections. The forecasts indicate that direct spending on chronic diseases will continue to grow faster than national output, reaching approximately 0.9265% of GDP by 2040. Although these estimates exclude indirect costs such as productivity losses and informal caregiving, they nonetheless point to a persistent and widening economic burden. Cross-national evidence on conditions such as diabetes, COPD, and osteoarthritis reinforces this conclusion, showing similar upward trends in the share of GDP absorbed by chronic disease management across high-income countries.
A distinctive contribution of this study lies in its identification of declining per capita spending in conditions such as cancer, epilepsy, heart disease, hypertension, and hyperlipidemia. This finding diverges from much of the existing literature, which reports sustained increases in per-patient costs. The decline observed here may signal gains in efficiency or wider access to cost-effective therapies, though further research is required to confirm these mechanisms.
These findings also emphasize the urgent need for policies to contain the economic impact of chronic diseases. Four areas deserve priority: (1) prevention, through sustained investment in programs that address modifiable risk factors such as diet, smoking, and physical inactivity; (2) treatment efficiency, through research and development aimed at reducing costs for high-prevalence diseases such as diabetes and COPD; (3) fiscal and health planning, through the integration of models that capture both direct and indirect costs; and (4) intersectoral action, by coordinating health, education, transport, and urban planning policies to address the broader social determinants of health.
A key limitation of this study is its reliance on MEPS-HC data for the 1996–2015 period. We restricted our analysis to these years because they are the most recent for which the Medical Expenditure Panel Survey provides fully standardized condition–event link files using the CCS classification. Beginning in 2016, MEPS transitioned toward alternative diagnostic coding (CCSR), which is not directly comparable to the earlier CCS system without additional harmonization. By focusing on 1996–2015, we ensure internal consistency in disease categories and expenditure estimates over two decades.
Building on these limitations, future work should seek to harmonize CCS and CCSR coding to extend expenditure estimates beyond 2015 and capture the effects of recent policy changes and the COVID-19 pandemic. Additional research could compare disease-specific spending across countries, explore disparities by socioeconomic and insurance status, and incorporate indirect costs such as productivity losses and informal care. Indirect costs—such as lost productivity, early retirement, and informal care—often exceed direct expenditure, and their accurate estimation through time-use surveys and economic valuation methods would provide a more realistic picture of the total burden of chronic diseases on households and the economy.
The role of new technologies and medications also requires closer examination: while innovation may raise initial spending, it can reduce complications and hospitalizations in the long term. Future analyses should therefore evaluate the cost-effectiveness of these innovations compared to conventional treatments, incorporate technology adoption scenarios into projection models, and pay particular attention to inequalities in access across socioeconomic groups. Similarly, longitudinal evidence is needed to measure the outcomes of taxation on harmful products, physical activity programs, and nutrition interventions, not only in terms of reduced prevalence but also regarding potential healthcare expenditure savings and productivity gains.
In short, by incorporating indirect costs, evaluating the effects of technological innovation, and systematically measuring the effectiveness of prevention policies, future research will generate more accurate and useful estimates for decision-making. This will be crucial not only for strengthening the fiscal sustainability of health systems but also for guiding public policies that promote greater equity and efficiency in managing chronic conditions.
Author Contributions
All authors contributed to the following roles: conceptualization, methodology, software, validation, formal analysis, investigation, data curation, writing—original draft preparation, writing—review and editing, and visualization. All authors have read and agreed to the published version of the manuscript.
Funding
This research received no external funding.
Institutional Review Board Statement
Not applicable.
Informed Consent Statement
Not applicable.
Data Availability Statement
These data were derived from the following resources available in the public domain: https://www.ahrq.gov/ (accessed on 14 October 2025).
Conflicts of Interest
The authors declare no conflict of interest.
References
- Abdulsalam, Y., Alibrahim, A., Alhuwail, D., & Behbehani, H. (2022). A procurement-based classification of pharmaceutical supplies for diabetes disease management. Health Science Reports, 5, e807. [Google Scholar] [CrossRef]
- Agency for Healthcare Research and Quality [AHRQ]. (n.d.). Agency for healthcare research and quality. Available online: https://www.ahrq.gov/ (accessed on 3 October 2024).
- Aggarwal, R., Chiu, N., Loccoh, E. C., Kazi, D. S., Yeh, R. W., & Wadhera, R. K. (2021). Rural-urban disparities: Diabetes, hypertension, heart disease, and stroke mortality among black and white adults, 1999–2018. Journal of the American College of Cardiology, 77(11), 1480–1481. [Google Scholar] [CrossRef]
- Ansah, J., & Chiu, C. (2023). Projecting the chronic disease burden among the adult population in the United States using a multi-state population model. Frontiers in Public Health, 10, 1082183. [Google Scholar] [CrossRef]
- Balducci, F., Di Rosa, M., Roller-Wirnsberger, R., Wirnsberger, G., Mattace-Raso, F., Tap, L., Formiga, F., Moreno-González, R., Kostka, T., Guligowska, A., Artzi-Medvedik, R., Melzer, I., Weingart, C., Sieber, C., Ärnlöv, J., Carlsson, A., Lattanzio, F., & Corsonello, A. (2024). Healthcare costs in relation to kidney function among older people: The SCOPE study. European Geriatric Medicine, 16, 135–148. [Google Scholar] [CrossRef] [PubMed]
- Baumert, J., Sarganas, G., Kuhnert, R., Thamm, R., Steppuhn, H., Waldhauer, J., Hoebel, J., Neuhauser, H., & Heidemann, C. (2024). Diabetes mellitus, cardiovascular and chronic respiratory diseases in Germany and Europe—Results of the European Health interview survey (EHIS 3, 2018–2020). Journal of Health Monitoring, 9(4), e12920. [Google Scholar] [CrossRef] [PubMed]
- Benavidez, G. A., Watkins, S. M., & Thorpe, R. J. (2024). Burden of chronic conditions and healthcare costs among adults in the United States, 2019–2021. Preventing Chronic Disease, 21, 230267. [Google Scholar] [CrossRef]
- Bloom, D., Chen, S., Kuhn, M., McGovern, M., Oxley, L., & Prettner, K. (2017). The economic burden of chronic diseases: Estimates and projections for China, Japan and South Korea. The Journal of the Economics of Ageing, 17, 100163. [Google Scholar] [CrossRef]
- Boersma, P., Black, L. I., & Ward, B. W. (2020). Prevalence of multiple chronic conditions among US adults, 2018. Preventing Chronic Disease, 17, E106. [Google Scholar] [CrossRef]
- Bommer, C., Sagalova, V., Heesemann, E., Manne-Goehler, J., Atun, R., Bärnighausen, T., Davies, J., & Vollmer, S. (2018). Global economic burden of diabetes in adults: Projections from 2015 to 2030. Diabetes Care, 41(5), 963–970. [Google Scholar] [CrossRef]
- Buttorff, C., Ruder, T., & Bauman, M. (2017). Multiple chronic conditions in the United States. RAND Corporation. Available online: https://www.rand.org/pubs/tools/TL221.html (accessed on 13 May 2025).
- Campello, M., Cortes, G. S., d’Almeida, F., & Kankanhalli, G. (2022). Exporting uncertainty: The impact of Brexit on corporate America. Journal of Financial and Quantitative Analysis, 57(8), 3178–3222. [Google Scholar] [CrossRef]
- Centers for Disease Control and Prevention (CDC). (2025, March 10). Fast facts: Health and economic costs of chronic conditions. U.S. Department of Health and Human Services. Available online: https://www.cdc.gov/chronic-disease/data-research/facts-stats/index.html (accessed on 19 May 2025).
- Centers for Medicare & Medicaid Services (CMS), Office of the Actuary. (2024a, June 12). U.S. health care spending rises to $4.8 trillion in 2023, outpacing GDP. Reuters. Available online: https://www.reuters.com/business/healthcare-pharmaceuticals/us-healthcare-spending-rises-48-trillion-2023-outpacing-gdp-2024-06-12/ (accessed on 9 September 2025).
- Centers for Medicare & Medicaid Services (CMS), Office of the Actuary. (2024b, June 13). Healthcare spending likely to grow 7.1% in 2025, CMS study finds. Fierce Healthcare. Available online: https://www.fiercehealthcare.com/regulatory/cms-study-healthcare-spending-likely-grow-71-2025 (accessed on 9 September 2025).
- Chadban, S., Arici, M., Power, A., Wu, M., Mennini, F., Álvarez, J., Sanchez, J., Barone, S., Card-Gowers, J., Martin, A., & Retat, L. (2024). Projecting the economic burden of chronic kidney disease at the patient level (Inside CKD): A microsimulation modelling study. eClinicalMedicine, 72, 102615. [Google Scholar] [CrossRef]
- Chen, S., Cao, Z., Prettner, K., Kuhn, M., Yang, J., Jiao, L., Wang, Z., Li, W., Geldsetzer, P., Bärnighausen, T., Bloom, D. E., & Wang, C. (2023a). Estimates and projections of the global economic cost of 29 cancers in 204 countries and territories from 2020 to 2050. JAMA Oncology, 9(4), 465–472. [Google Scholar] [CrossRef]
- Chen, S., Kuhn, M., Prettner, K., Yu, F., Yang, T., Bärnighausen, T., Bloom, D., & Wang, C. (2023b). The global economic burden of chronic obstructive pulmonary disease for 204 countries and territories in 2020–50: A health-augmented macroeconomic modelling study. The Lancet Global Health, 11, e1183–e1193. [Google Scholar] [CrossRef]
- Chen, X. F., Xu, Y., Li, M., & Zhang, Y. (2025). Estimation and prediction of the economic burden of chronic diseases using the Health-Augmented Macroeconomic (HAM) model: Evidence from China. Infectious Diseases of Poverty, 14(1), 33. [Google Scholar] [CrossRef]
- Clayton, Z. S., Craighead, D. H., Darvish, S., Coppock, M. K., Ludwig, K. R., Brunt, V. E., Seals, D. R., & Rossman, M. J. (2022). Promoting healthy cardiovascular aging: Emerging topics. Journal of Cardiovascular Aging, 2, 43. [Google Scholar] [CrossRef]
- Cook, C., Cole, G., Asaria, P., Jabbour, R., & Francis, D. P. (2014). The annual global economic burden of heart failure. International Journal of Cardiology, 171(3), 368–376. [Google Scholar] [CrossRef]
- Cutler, D. M., & Summers, L. H. (2020). The COVID-19 pandemic and the $16 trillion virus. JAMA, 324(15), 1495–1496. [Google Scholar] [CrossRef] [PubMed]
- Darvish, M., Shakoor, A., Feyz, L., Schaap, J., van Mieghem, N. M., de Boer, R. A., Brugts, J. J., & van der Boon, R. M. A. (2025). Heart failure: Assessment of the global economic burden. European Heart Journal, 46(31), 3069–3078. [Google Scholar] [CrossRef] [PubMed]
- Das, N., Nguyen, P., Ho, T. Q. A., Lee, P., Robinson, S., & Gao, L. (2024). Methods for measuring and valuing informal care: A systematic review and meta-analysis in stroke. Value in Health, 27(12), 1789–1804. [Google Scholar] [CrossRef]
- DeVol, R., Bedroussian, A., Charuworn, A., Chatterjee, A., Kim, I., Kim, S., & Klowden, K. (2007). An unhealthy America: The economic burden of chronic disease—Charting a new course to save lives and increase productivity and economic growth. Milken Institute. Available online: https://commed.vcu.edu/Chronic_Disease/EBCDES_ResearchFindings_CPAC.pdf (accessed on 11 September 2025).
- Dickey, D. A., & Fuller, W. A. (1979). Distribution of the estimators for autoregressive time series with a unit root. Journal of the American Statistical Association, 74(366), 427–431. [Google Scholar] [CrossRef] [PubMed]
- Dieleman, J. L., Cao, J., Chapin, A., Chen, C., Li, Z., Liu, A., Horst, C., Kaldjian, A., Matyasz, T., Scott, K. W., Bui, A. L., Campbell, M., Duber, H. C., Dunn, A. C., Flaxman, A. D., Fitzmaurice, C., Naghavi, M., Sadat, N., Shieh, P., … Murray, C. J. L. (2020). US health care spending by payer and health condition, 1996–2016. JAMA, 323(9), 863–884. [Google Scholar] [CrossRef]
- Dougherty, C. (2016). Introduction to econometrics (5th ed.). Oxford University Press. [Google Scholar]
- Ferranna, M., Cadarette, D., Chen, S., Ghazi, P., Ross, F., Zucker, L., & Bloom, D. E. (2023). The macroeconomic burden of noncommunicable diseases and mental health conditions in South America. PLoS ONE, 18, e0293144. [Google Scholar] [CrossRef]
- García-Morales, C., Heredia-Pi, I., Guerrero-López, C. M., Orozco, E., Ojeda-Arroyo, E., Nigenda, G., & Serván-Mori, E. (2024). Social and economic impacts of non-communicable diseases by gender and its correlates: A literature review. International Journal for Equity in Health, 23(1), 274. [Google Scholar] [CrossRef]
- Greene, W. H. (2018). Econometric analysis (8th ed.). Pearson Education Limited. [Google Scholar]
- Hacker, K. (2024). The burden of chronic disease. Mayo Clinic Proceedings: Innovations, Quality & Outcomes, 8(1), 112–119. [Google Scholar] [CrossRef] [PubMed]
- Hoffman, D., & Mertzlufft, J. (2018). Why preventing chronic disease is essential—Prevention works. National Association of Chronic Disease Directors, An NACDD White Paper. Available online: https://www.tfah.org/wp-content/uploads/2018/12/COMMS_WP_InvestinginCD2018F.pdf (accessed on 19 April 2025).
- Hoffman, D., & Mertzlufft, J. (2022). Chronic disease prevention: An important key to improving life and healthcare systems today. Annals of Bioethics & Clinical Applications, 5(4), 000248. [Google Scholar] [CrossRef]
- Horvath, T., Leoni, T., Reschenhofer, P., & Spielauer, M. (2025). The impact of ageing, socio-economic differences and the evolution of morbidity on future health expenditure: A dynamic microsimulation. BMC Health Services Research, 25, 952. [Google Scholar] [CrossRef]
- Hsiao, C. (2022). Analysis of panel data (4th ed.). Cambridge University Press. [Google Scholar]
- Husereau, D., Drummond, M., Augustovski, F., de Bekker-Grob, E., Briggs, A. H., Carswell, C., Caulley, L., Chaiyakunapruk, N., Greenberg, D., Loder, E., Marsh, K., Munoz, E., Pwu, R. F., & Staniszewska, S. (2022). Consolidated Health Economic Evaluation Reporting Standards 2022 (CHEERS 2022) statement: Updated reporting guidance for health economic evaluations. PharmacoEconomics, 40(6), 601–609. [Google Scholar] [CrossRef]
- Joynt Maddox, K. E., Elkind, M. S. V., Aparicio, H. J., Commodore-Mensah, Y., de Ferranti, S. D., Dowd, W. N., Hernandez, A. F., Khavjou, O., Michos, E. D., Palaniappan, L., Penko, J., Poudel, R., Roger, V. L., Kazi, D. S., & American Heart Association. (2024). Forecasting the burden of cardiovascular disease and stroke in the United States through 2050-prevalence of risk factors and disease: A presidential advisory from the American Heart Association. Circulation, 150(4), e65–e88. [Google Scholar] [CrossRef] [PubMed]
- Kahn, S. E., Anderson, C. A. M., Atkinson, M. A., Bakris, G. L., Buse, J. B., Hu, F. B., Rich, S. S., Riddle, M. C., & Selvin, E. (2023). Reducing bias in academic publishing: The Diabetes Care approach. Diabetes Care, 46(4), 665–666. [Google Scholar] [CrossRef] [PubMed]
- Kazi, D. S., Elkind, M. S. V., Deutsch, A., Dowd, W. N., Heidenreich, P., Khavjou, O., Mark, D., Mussolino, M. E., Ovbiagele, B., Patel, S. S., Poudel, R., Ben Weittenhiller, M. B. A., Powell-Wiley, T. M., Joynt Maddox, K. E., & American Heart Association. (2024). Forecasting the economic burden of cardiovascular disease and stroke in the United States through 2050: A presidential advisory from the American Heart Association. Circulation, 150, e89–e101. [Google Scholar] [CrossRef]
- Kazibwe, J., Tran, P. B., & Annerstedt, K. S. (2021). The household financial burden of non-communicable diseases in low- and middle-income countries: A systematic review. Health Research Policy and Systems, 19(1), 96. [Google Scholar] [CrossRef]
- Kitschen, A., Asegu, L. M., & Sauerland, D. (2025). Methodological considerations for estimating indirect costs in children and adolescents with chronic diseases: A scoping review. BMC Pediatrics, 25, 123. [Google Scholar] [CrossRef] [PubMed]
- Knowledge Action Portal. (2024). Noncommunicable diseases (NCDs). Available online: https://knowledge-action-portal.com/en/content/noncommunicable-diseases (accessed on 5 September 2025).
- Kurkela, O., Forma, L., Ilanne-Parikka, P., Nevalainen, J., & Rissanen, P. (2021). Association of diabetes type and chronic diabetes complications with early exit from the labour force: Register-based study of people with diabetes in Finland. Diabetologia, 64, 795–804. [Google Scholar] [CrossRef]
- Ljung, G. M., & Box, G. E. P. (1978). On a measure of lack of fit in time series models. Biometrika, 65(2), 297–303. [Google Scholar] [CrossRef]
- Mannino, D. M., Roberts, M. H., Mapel, D. W., Zhang, Q., Lunacsek, O., Grabich, S., van Stiphout, J., Meadors, B. L., Feigler, N., & Pollack, M. F. (2024). National and local direct medical cost burden of COPD in the United States from 2016 to 2019 and projections through 2029. Chest, 165(5), 1093–1106. [Google Scholar] [CrossRef] [PubMed]
- Maresova, P., Javanmardi, E., Barakovic, S., Barakovic Husic, J., Tomsone, S., Krejcar, O., & Kuca, K. (2019). Consequences of chronic diseases and other limitations associated with old age—A scoping review. BMC Public Health, 19, 1431. [Google Scholar] [CrossRef]
- Muhuri, P. K. (2022). Expenditures for commonly treated conditions among older adults: Estimates from the medical expenditure panel survey, 2019. In Statistical brief (medical expenditure panel survey (US)). Agency for Healthcare Research and Quality (US). [Google Scholar]
- National Center for Chronic Disease Prevention and Health Promotion [NCCDPHP]. (2023). Health and economic costs of chronic diseases. Centres for Disease Control and Prevention. Available online: https://www.cdc.gov/nccdphp/index.html (accessed on 19 August 2023).
- Nau, R. (2020). Statistical forecasting: Notes on regression and time series analysis. Duke University. Available online: https://people.duke.edu/~rnau/411home.htm (accessed on 20 June 2025).
- Odunyemi, A., Rahman, T., & Alam, K. (2023). Economic burden of non-communicable diseases on households in Nigeria: Evidence from the Nigeria Living Standard Survey 2018–19. BMC Public Health, 23, 1563. [Google Scholar] [CrossRef]
- Organization for Economic Co-Operation and Development [OECD]. (2023). Health at a Glance 2023: OECD indicators. OECD Publishing. Available online: https://www.oecd.org/en/publications/health-at-a-glance-2019_4dd50c09-en.html (accessed on 31 August 2025). [CrossRef]
- Organization for Economic Co-Operation and Development [OECD]. (2024). Fiscal sustainability of health systems: How to finance more resilient health systems when money is tight? Available online: https://www.oecd.org/en/publications/fiscal-sustainability-of-health-systems_880f3195-en.html (accessed on 31 August 2025). [CrossRef]
- Pérez-Ardanaz, B., Gutiérrez-Rodríguez, L., Peláez-Cantero, M., Morales-Asencio, J., Gómez-González, A., García-Piñero, J., & Lupiáñez-Pérez, I. (2024). Healthcare service use for children with chronic complex diseases: A longitudinal six-year follow-up study. Journal of Pediatric Nursing, 77, e132–e138. [Google Scholar] [CrossRef]
- Polanco, B., Oña, A., Sabariego, C., & Barzallo, P. (2024). Chronic health conditions and their impact on the labor market. A cross-country comparison in Europe. SSM-Population Health, 26, 101666. [Google Scholar] [CrossRef]
- Rachas, A., Gastaldi-Ménager, C., Denis, P., Barthélémy, P., Constantinou, P., Drouin, J., Lastier, D., Lesuffleur, T., Mette, C., Nicolas, M., Pestel, L., Rivière, S., Tajahmady, A., Gissot, C., & Fagot-Campagna, A. (2022). The economic burden of disease in France from the national health insurance perspective: The healthcare expenditures and conditions mapping used to prepare the French social security funding act and the public health act. Medical Care, 60(9), 655–664. [Google Scholar] [CrossRef] [PubMed]
- Raghupathi, W., & Raghupathi, V. (2018). An empirical study of chronic diseases in the United States: A visual analytics approach to public health. International Journal of Environmental Research and Public Health, 15(3), 431. [Google Scholar] [CrossRef]
- Rai, S., Gautam, S., Yadav, G. K., Niraula, S. R., Singh, S. B., Rai, R., & Pokharel, P. K. (2022). Catastrophic health expenditure on chronic non-communicable diseases among elder population: A cross-sectional study from a sub-metropolitan city of Eastern Nepal. PLoS ONE, 17(12), e0279212. [Google Scholar] [CrossRef] [PubMed]
- R Core Team. (2023). R: A language and environment for statistical computing. R Foundation for Statistical Computing. Available online: https://www.R-project.org/ (accessed on 11 September 2025).
- Rojanasarot, S., Bhattacharyya, S., & Edwards, N. (2023). Productivity loss and costs to United States employers due to priority conditions: A systematic review. Journal of Medical Economics, 26, 262–270. [Google Scholar] [CrossRef]
- Sahoo, P. M., Rout, H. S., & Jakovljevic, M. (2023). Future health expenditure in the BRICS countries: A forecasting analysis for 2035. Globalization and Health, 19, 49. [Google Scholar] [CrossRef]
- Sarker, A. R., Zeng, W., Mohanty, S. K., Ahmed, S., & Prinja, S. (2025). Catastrophic health expenditure and economic burden associated with cancer in low- and middle-income countries: Evidence from household surveys. International Journal for Equity in Health, 24, 21. [Google Scholar] [CrossRef]
- Shumet, S., Mohammed, S. A., & Alemayehu, T. (2021). Catastrophic health expenditure among chronic patients attending Dessie Referral Hospital, Northeast Ethiopia. ClinicoEconomics and Outcomes Research, 13, 101–109. [Google Scholar] [CrossRef]
- Shumway, R. H., & Stoffer, D. S. (2021). Time series analysis and its applications: With R examples (5th ed.). Springer. [Google Scholar]
- Silberman, S. (2022). The inequities in the cost of chronic disease: Why it matters for older adults. National Council on Aging. Available online: https://www.ncoa.org/article/the-inequities-in-the-cost-of-chronic-disease-why-it-matters-for-older-adults/ (accessed on 20 December 2024).
- Srivastava, A., Silva, F., Dantas, M., Enache, L., & Chatterjee, C. (2025). Financing the common good: The case for the GLP-1 class of drugs. California Management Review. Available online: https://cmr.berkeley.edu/2025/01/financing-the-common-good-the-case-for-the-glp-1-class-of-drugs/ (accessed on 10 August 2025).
- Stock, J. H., & Watson, M. W. (2011). Introduction to Econometrics (3rd ed.). Addison Wesley Longman. [Google Scholar]
- Topol, E. J. (2019). High-performance medicine: The convergence of human and artificial intelligence. Nature Medicine, 25(1), 44–56. [Google Scholar] [CrossRef]
- Topol, E. J. (2023). As artificial intelligence goes multimodal, medical applications multiply. Science, 381(6663), eadk6139. [Google Scholar] [CrossRef] [PubMed]
- U.S. Bureau of Economic Analysis. (n.d.). Gross domestic product. Available online: https://www.bea.gov/data/gdp/gross-domestic-product (accessed on 20 December 2024).
- Wahnschafft, S., Chan, B., & Bayona Garcia, J. (2024). Integrating non-communicable management into primary health care: An anthology of country cases. Available online: https://documents1.worldbank.org/curated/en/099032724142533466/pdf/P1706381b8baba0981a59e1fe271036efcd.pdf (accessed on 19 December 2024).
- Wang, Y., Li, Y., Lu, Z., Li, Z., Wang, R., Wang, Z., Gu, Y., & Chen, L. (2025). The global magnitude and temporal trend of hypertensive heart disease burden attributable to high sodium intake from 1990 to 2021. Current Problems in Cardiology, 50(2), 102931. [Google Scholar] [CrossRef]
- Watson, K. B., Black, L. I., Clarke, T. C., & Boersma, P. (2025). Prevalence of chronic conditions and multiple chronic conditions among U.S. adults, 2023. Preventing Chronic Disease, 22, 240539. [Google Scholar] [CrossRef] [PubMed]
- Williams, R., Karuranga, S., Malanda, B., Saeedi, P., Basit, A., Besançon, S., Bommer, C., Esteghamati, A., Ogurtsova, K., Zhang, P., & Colagiuri, S. (2020). Global and regional estimates and projections of diabetes-related health expenditure: Results from the International Diabetes Federation Diabetes Atlas, 9th edition. Diabetes Research and Clinical Practice, 162, 108072. [Google Scholar] [CrossRef]
- Wooldridge, J. M. (2021). Introduction to econometrics: A modern approach (7th ed.). Cengage Learning. [Google Scholar]
- World Bank. (2024). World development report 2024: Investing in health for inclusive growth. Available online: https://www.worldbank.org/en/publication/wdr2024 (accessed on 2 April 2025).
- World Health Organization [WHO]. (2022). Global status report on noncommunicable diseases 2022. Available online: https://www.who.int/publications/i/item/9789240047761 (accessed on 30 June 2025).
- World Health Organization [WHO]. (2023, September 16). Noncommunicable diseases. Knowledge Action Portal on NCDs. Available online: https://www.knowledge-action-portal.com/en/content/noncommunicable-diseases#:~:text=Cardiovascular%20diseases%20account%20for%20most,Briefs%20&%20Fact%20Sheets (accessed on 19 June 2025).
- World Health Organization [WHO]. (2024, December 23). Noncommunicable diseases. WHO Newsroom Fact Sheets. Available online: https://www.who.int/news-room/fact-sheets/detail/noncommunicable-diseases (accessed on 21 June 2025).
- World Health Organization [WHO]. (2025, February 25). From cradle to cane: WHO’s new European Health Report warns of lifelong health crises across the region. WHO Europe. Available online: https://www.who.int/europe/news/item/25-02-2025-from-cradle-to-cane--who-s-new-european-health-report-warns-of-lifelong-health-crises-across-the-region (accessed on 9 September 2025).
- Xu, Z., Jain, S., & Kankanhalli, M. (2024). Hallucination is inevitable: An innate limitation of large language models. arXiv, arXiv:2401.11817. [Google Scholar] [CrossRef]
- Yang, X., Yan, J. E., Lai, S., Shen, C., & Duan, N. (2023). What affects the direct economic burden of non-communicable diseases. Frontiers in Public Health, 11, 1219199. [Google Scholar] [CrossRef] [PubMed]
- Zhang, X. (2025). Research on time series forecasting method based on model adequacy. Sustainability, 17(7), 2993. [Google Scholar] [CrossRef]
- Zhou, M., Sun, X., & Huang, L. (2020). Chronic disease and medical spending of Chinese elderly in rural regions. International Journal for Quality in Health Care, 33(1), mzaa142. [Google Scholar] [CrossRef]
Disclaimer/Publisher’s Note: The statements, opinions and data contained in all publications are solely those of the individual author(s) and contributor(s) and not of MDPI and/or the editor(s). MDPI and/or the editor(s) disclaim responsibility for any injury to people or property resulting from any ideas, methods, instructions or products referred to in the content. |
© 2025 by the authors. Licensee MDPI, Basel, Switzerland. This article is an open access article distributed under the terms and conditions of the Creative Commons Attribution (CC BY) license (https://creativecommons.org/licenses/by/4.0/).