COVID-19 also harmed edible fungus, horticultural, oilseed, and edible oil products. Due to the transportation shutdown, the labour force could not migrate to other sectors. The authors propose that the government should aid and subsidize this sector.
Lu et al. (
2020) studied China’s social policies in the presence of COVID-19. COVID-19 had many adverse effects on China’s economy, such as slowing industrial growth, decreasing GDP, reducing national exports and imports, and increasing unemployment. The author explored how the Chinese government provides financial assistance, social insurance, and social welfare. People receive social, medical, pension, and unemployment benefits. In this COVID-19pandemic, special medical, educational, and legal aid was available. The author also stated that China’s government provided special assistance to children and disabled people.
2.1. COVID-19 and Chinese Economy
The economic condition and its involvement in international trade make China important for all other countries. The financial or manufacturing fluctuations in China can disturb the trade balance globally. The current situation of COVID-19 hit the Chinese economy badly, and it also negatively impacted other economies around the world. Manufacturing activities stopped when COVID-19 spreads around the countries. The social distancing rules cause the underutilization of labour and capital in China, increasing the cost of production. Moreover, shutting down international borders and other transportation restrictions made the exports difficult for China, and it suffered huge losses, such as a reduction in its exports by 3.7% (
Liu and Hu 2020).
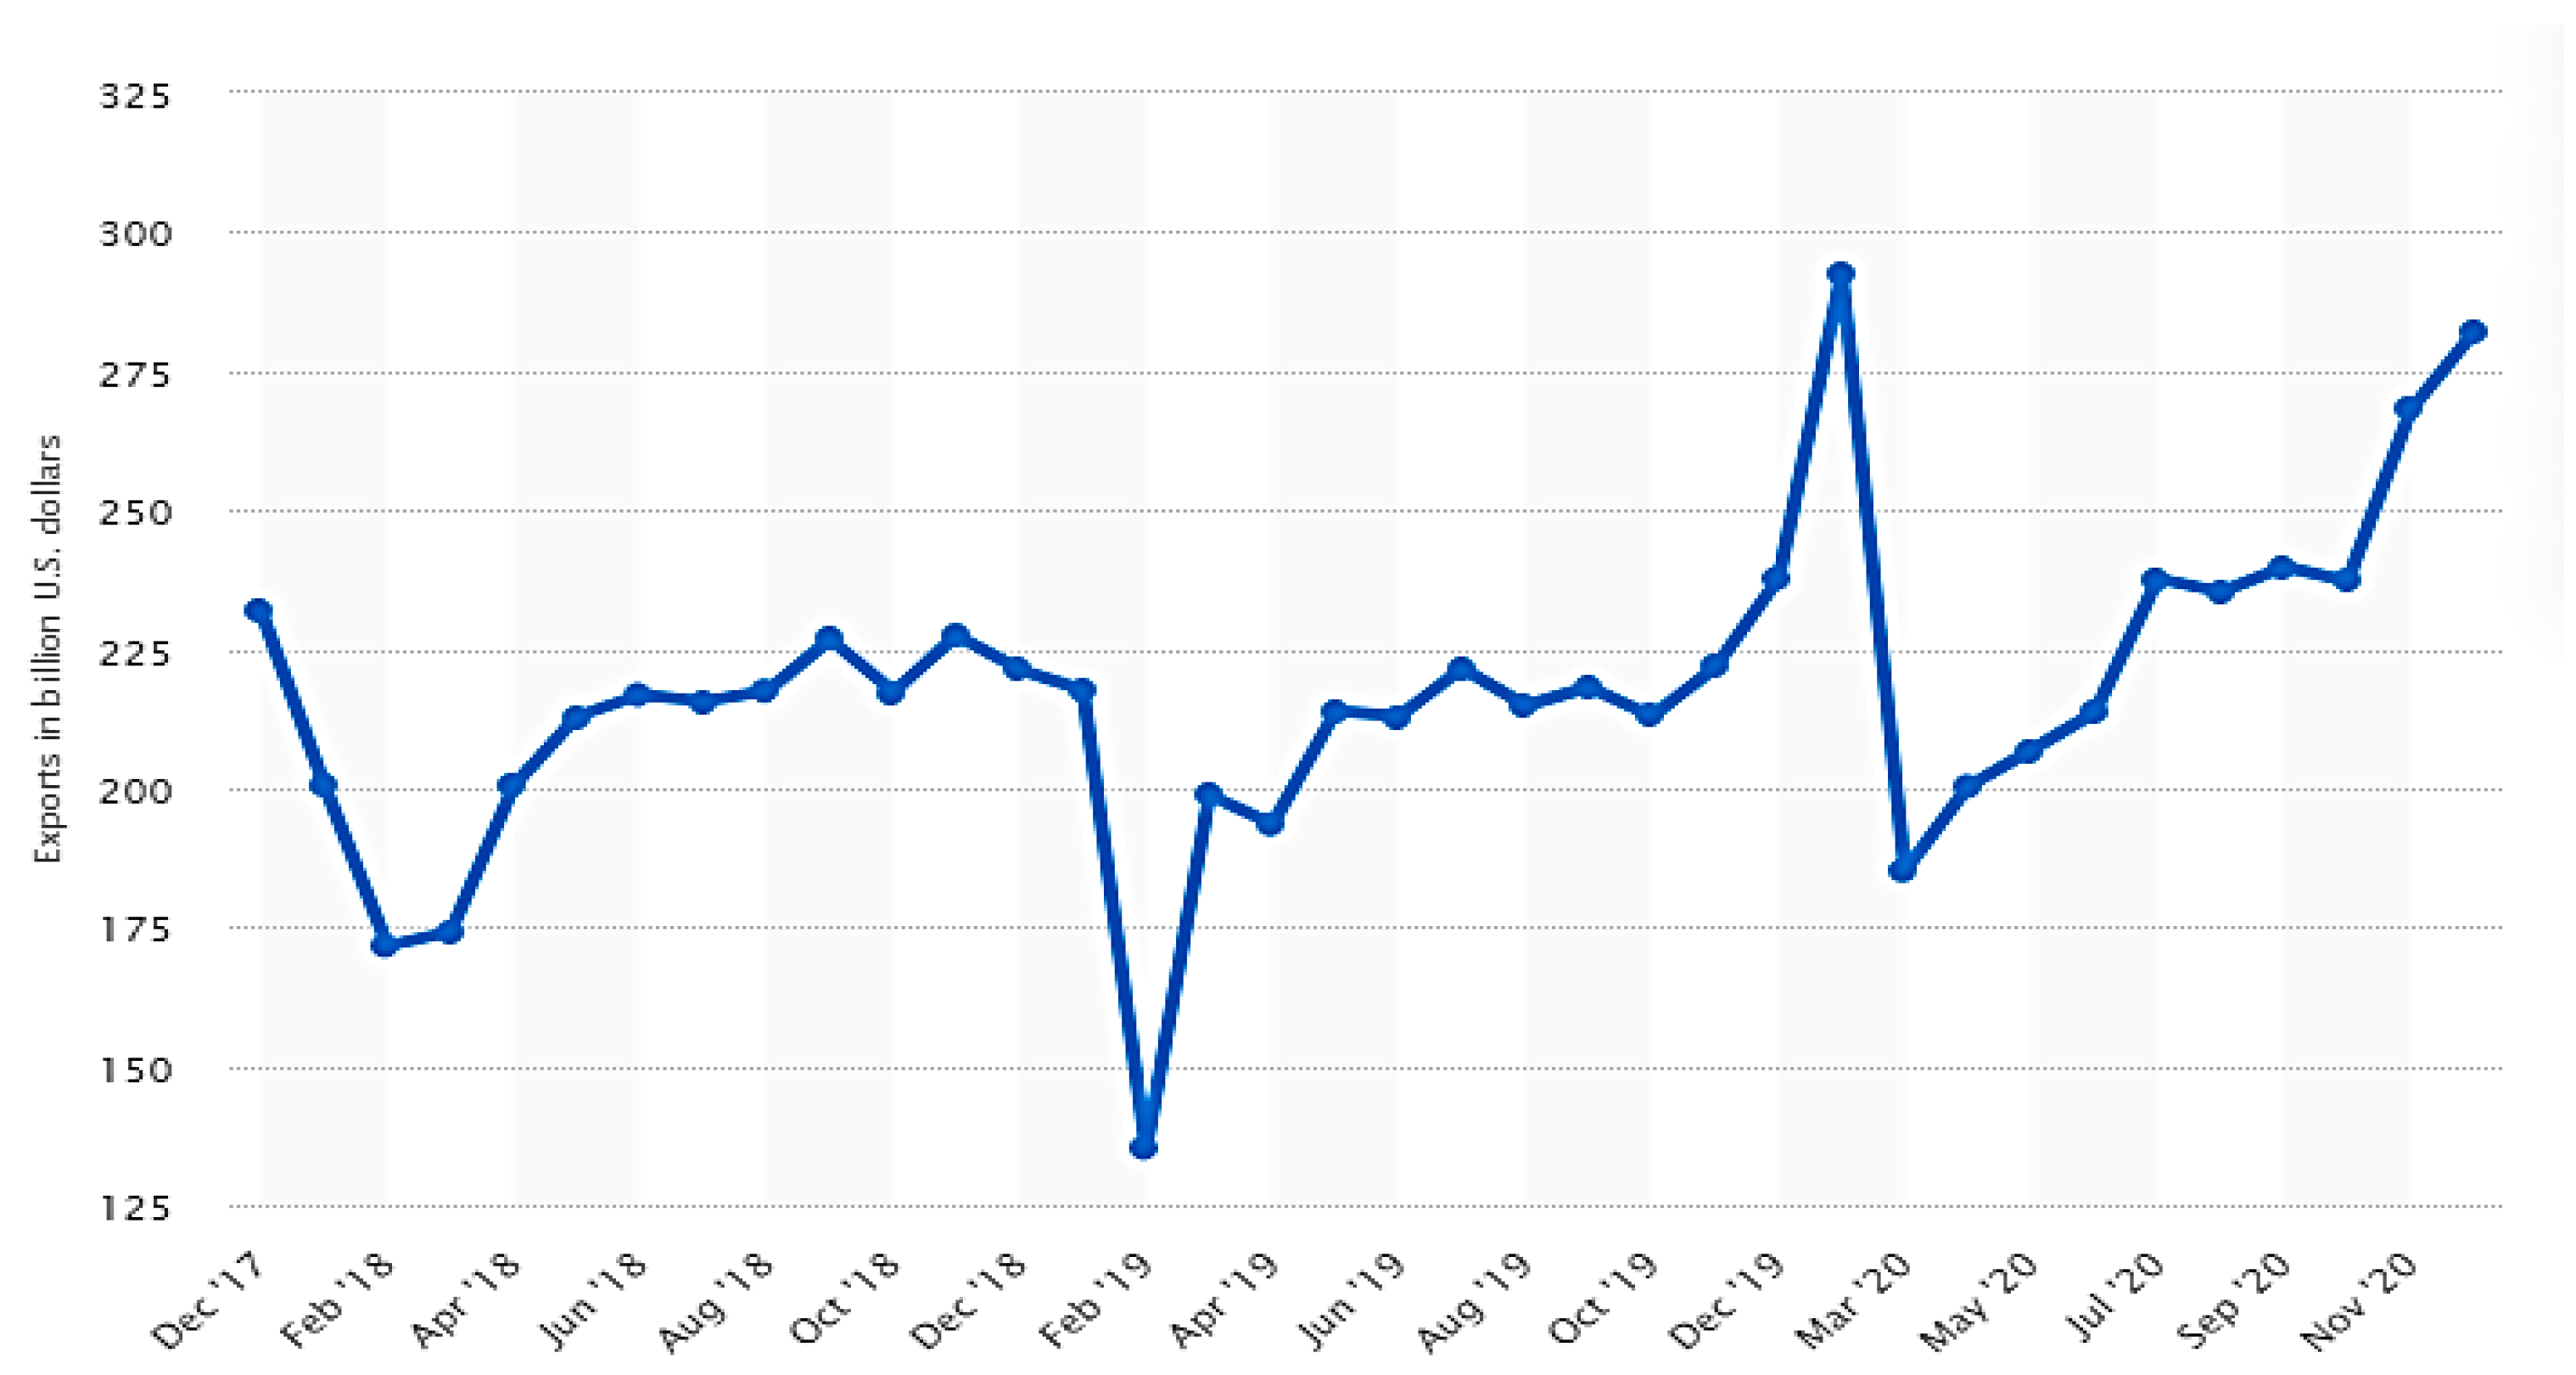
Figure 1 presents the export trends of the Chinese economy from 2017 to December 2020. The figure shows that exports of China remarkably declined in January 2019 due to the worst period of the COVID-19 pandemic. Then the passage of time and development of precautions against COVID-19 made a positive impact on the exports of China. By the end of 2020, exports were at their highest level.
It is also seen that during the worst time of the pandemic, there was a remarkable decline in the investment sector, and extensive stock of the automobile industry remains unsold. The outbreak of COVID-19 caused the reduction of foreign direct investment, tourism, and other business trips. COVID-19 has the property of quick spread among people, so the government of China strictly followed the advisory of social distancing (
Wong et al. 2020). Further preventions were taken, such as closing educational activities, private and government businesses, non-governmental organizations, and international trade. However, necessities and lifesaving commodities can transfer at the international level. The only objective of these measures is to minimize the spread of COVID-19, and China achieved this objective by these measures (
Liu et al. 2020). Before COVID-19, the world faced many other types of pandemics and suffered the loss of massive deaths (
Keogh-Brown et al. 2020). However, the COVID-19 spread quickly and covered the entire world. Many researchers, such as
Allen et al. (
2008), suggested that an increase in globalization and more trade of animals always have a more significant possibility of transmitting diseases. However,
Keogh-Brown et al. (
2020) explored the negative impacts of COVID-19 and suggested that the current pandemic is the most harmful and deadly. As COVID-19 compared to the previous pandemics and the number of death given in
Table 1. Many studies used different variables to measure COVID-19, such as total cases of COVID-19, death rate, and total patients that recovered from COVID-19 (
Alfani and Murphy 2017).
2.2. Short-Term and Long-Term Impacts of COVID-19 and the Chinese Economy
The epidemic of COVID-19 made many short-term and long-term shocks, and there are many types of research, such as
Chen et al. (
2020) and
Liu et al. (
2020), exploring the COVID-19 impacts and government policy of this pandemic. In a short-term analysis, the Chinese government took many emergency steps in response to COVID-19. The isolation and social distancing policies negatively impacted the domestic demand for commodities, such as decreased domestic demand. Moreover, the global market of Chinese products also decreases due to isolation and social distance policies. The categories of stages by which we can divide the impact of COVID-19 are as follows.
The first stage substantially negatively impacted consumption because it was a spring festival. All type of shopping malls was closed during this period, so there was a remarkable reduction in the consumption of commodities. Moreover, tourism, industrial, and retail activities were minimized, negatively impacting the country’s consumption level. The restaurant and hoteling sectors suffered a lot, and about 93% of catering companies closed their business due to low demand for their services and goods.
The second stage comes right after the spring festival, and workers have to return to their careers, but due to COVID-19, they were unable to perform their duties. This caused the reduction of the production of commodities; moreover, less availability of transportation makes the transfer of the labour force impossible. So, the industrial sector suffered a lot from social distancing initiatives. The statistics indicate that about 50 million workers could not travel to their work due to isolation policies. Thus, this created unemployment and diminished the standard of living in China (
Liu and Hu 2020).
The worldwide spread of COVID-19 referred to the third stage, and the demand for Chinese products reduced at the global level. Developed and developing nations strictly followed the policies and precautions suggested by the WHO about isolation. So, worldwide policies of isolation and social distancing put the borders close, then caused a substantial negative impact on Chinese international trade. The blowout of COVID-19 in the USA and European countries caused a considerable decline in the demand for Chinese products (
Shen et al. 2020).
In the early months of 2020, such as January and February, China’s macroeconomic information indicated negative development since measurements became accessible. Among these statistics, value-added to the modern industrial sector diminished by 13.5%. The services sector recorded a reduction of 13.0%, and absolute retail deals of social customer merchandise decreased by 20.5%. To forestall and stop COVID-19, China has paid a hefty monetary cost.
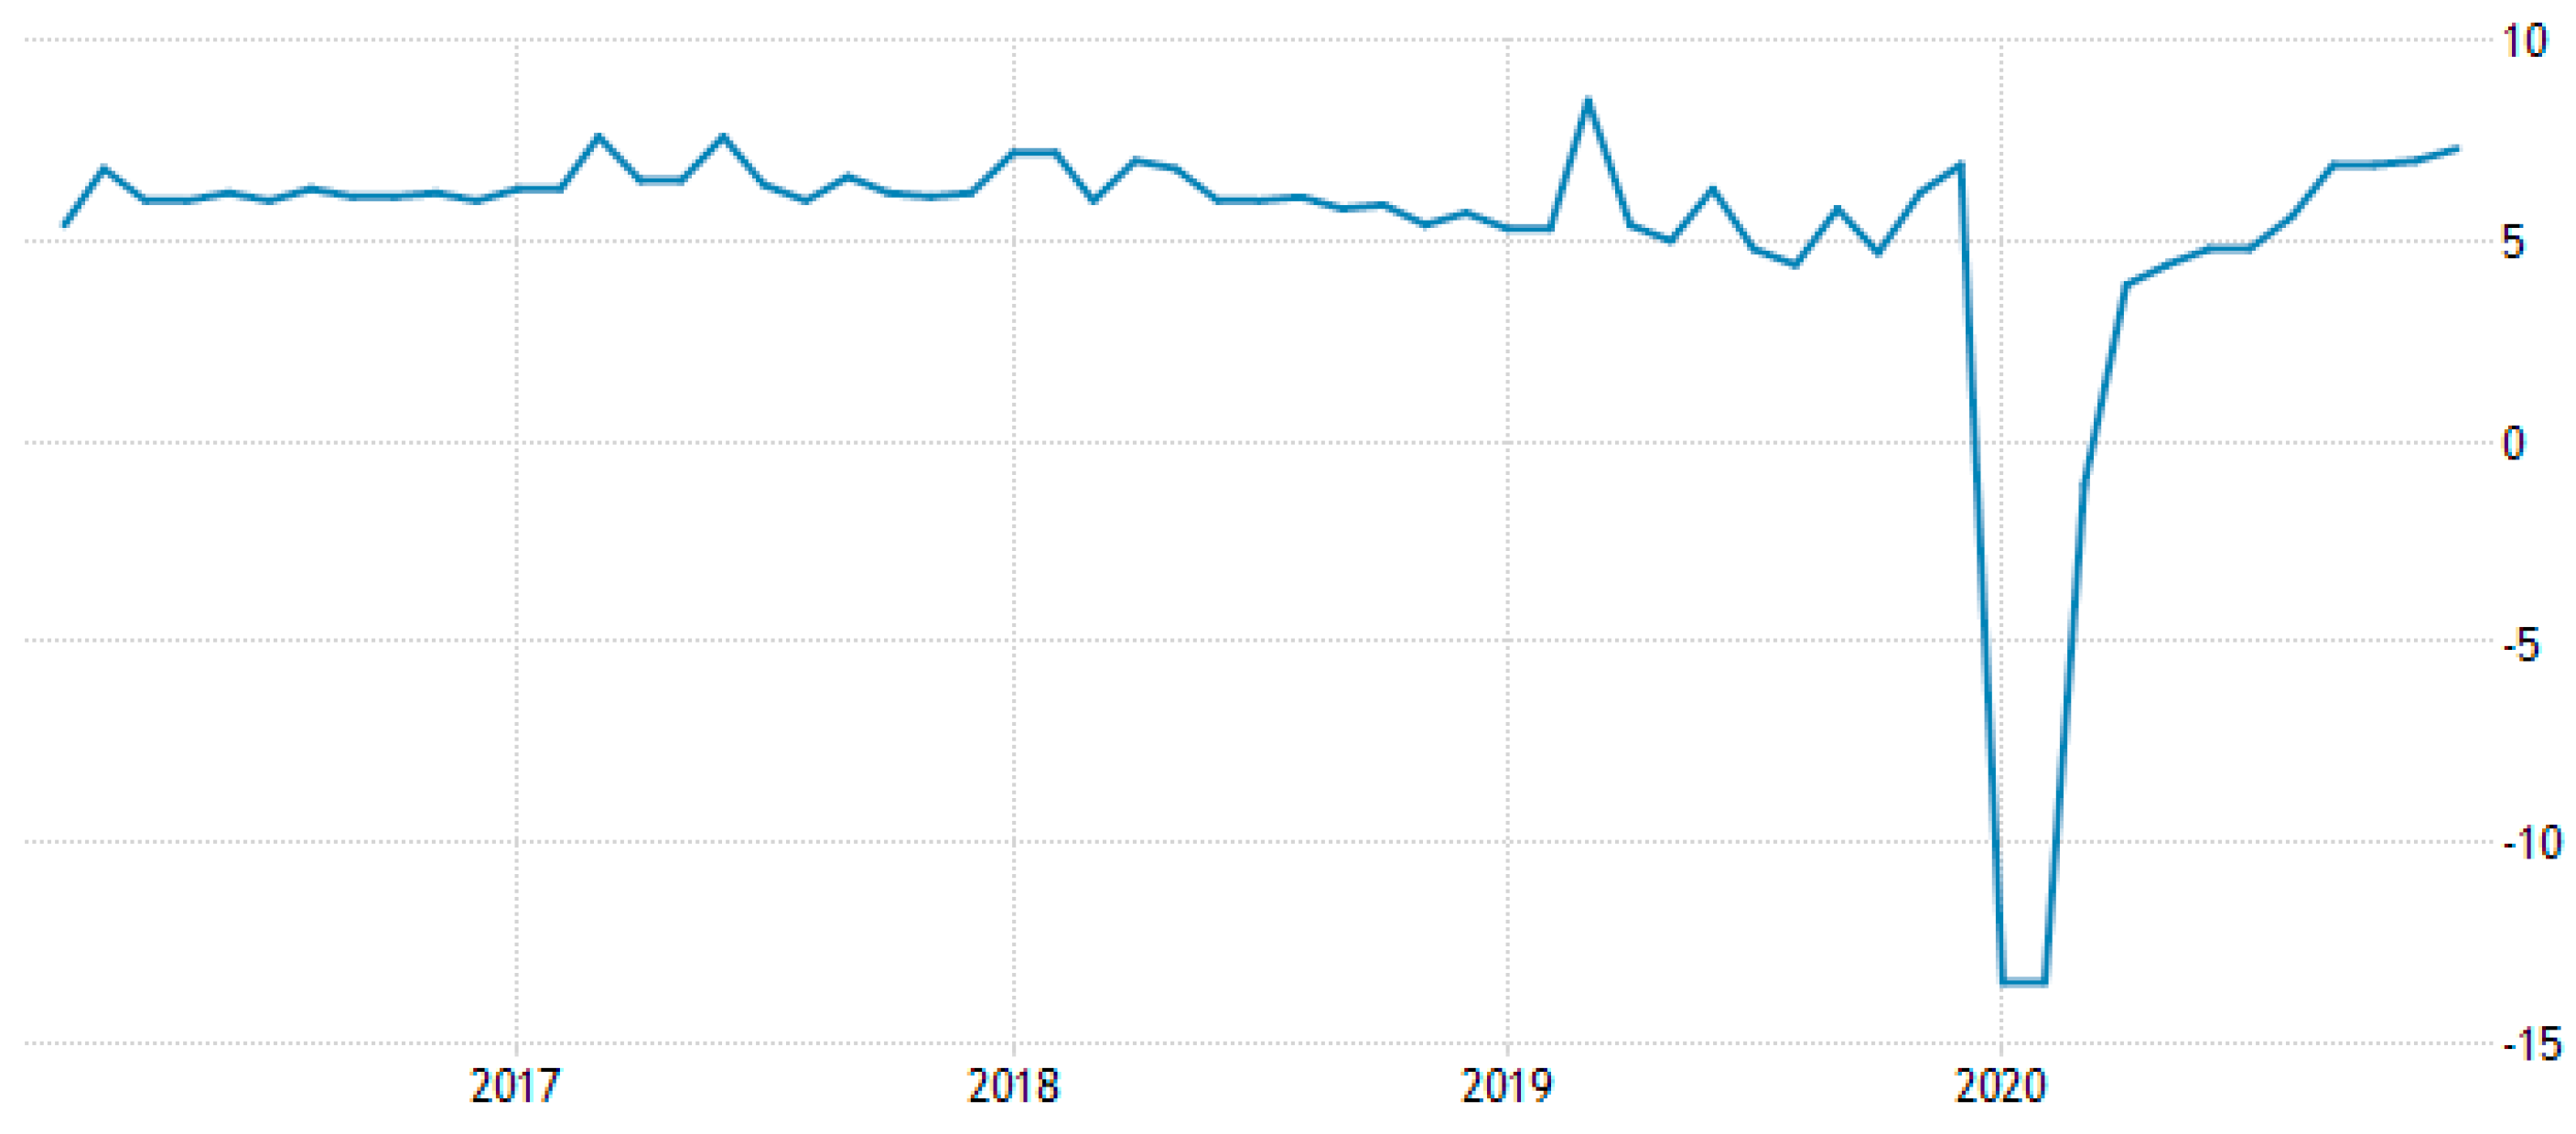
Figure 2 presents the industrial production growth trends of the Chinese economy from 2017 onward. The figure shows that industrial production of China remarkably declined after mid-2019 due to the worldwide spread of COVID-19. The demand for Chinese products declined mainly due to social distancing and the lockdown of international borders. Then the passage of time and development of precautions against COVID-19 positively impacted the industrial sector of China. By the end of 2020, industrial sector performance was at its highest level.
After the flare-up of COVID-19, China immediately dispatched a bundle of plans. To guarantee “hostile to plague”, the general public effectively gave cash and materials to guarantee “hostile to plague,” and the Chinese government immediately organized particular reserves. Simultaneously, the Chinese government has additionally declared different approaches, including financial arrangements, charge strategies, money-related arrangements, modern strategies, and business strategies. Regarding monetary interpretation, a blend of duty decrease, expense decrease, and endowments was given, and “Against Epidemic Thematic Bond” was given. The government has given particular treatment to businesses influenced by the plague, e.g., transportation, catering, travel, convenience, expedited service, standard avionics, and different companies. As indicated by fundamental gauges, the overall population spending shortage rate in 2020 may increase from 2.8% of GDP to about 3%.
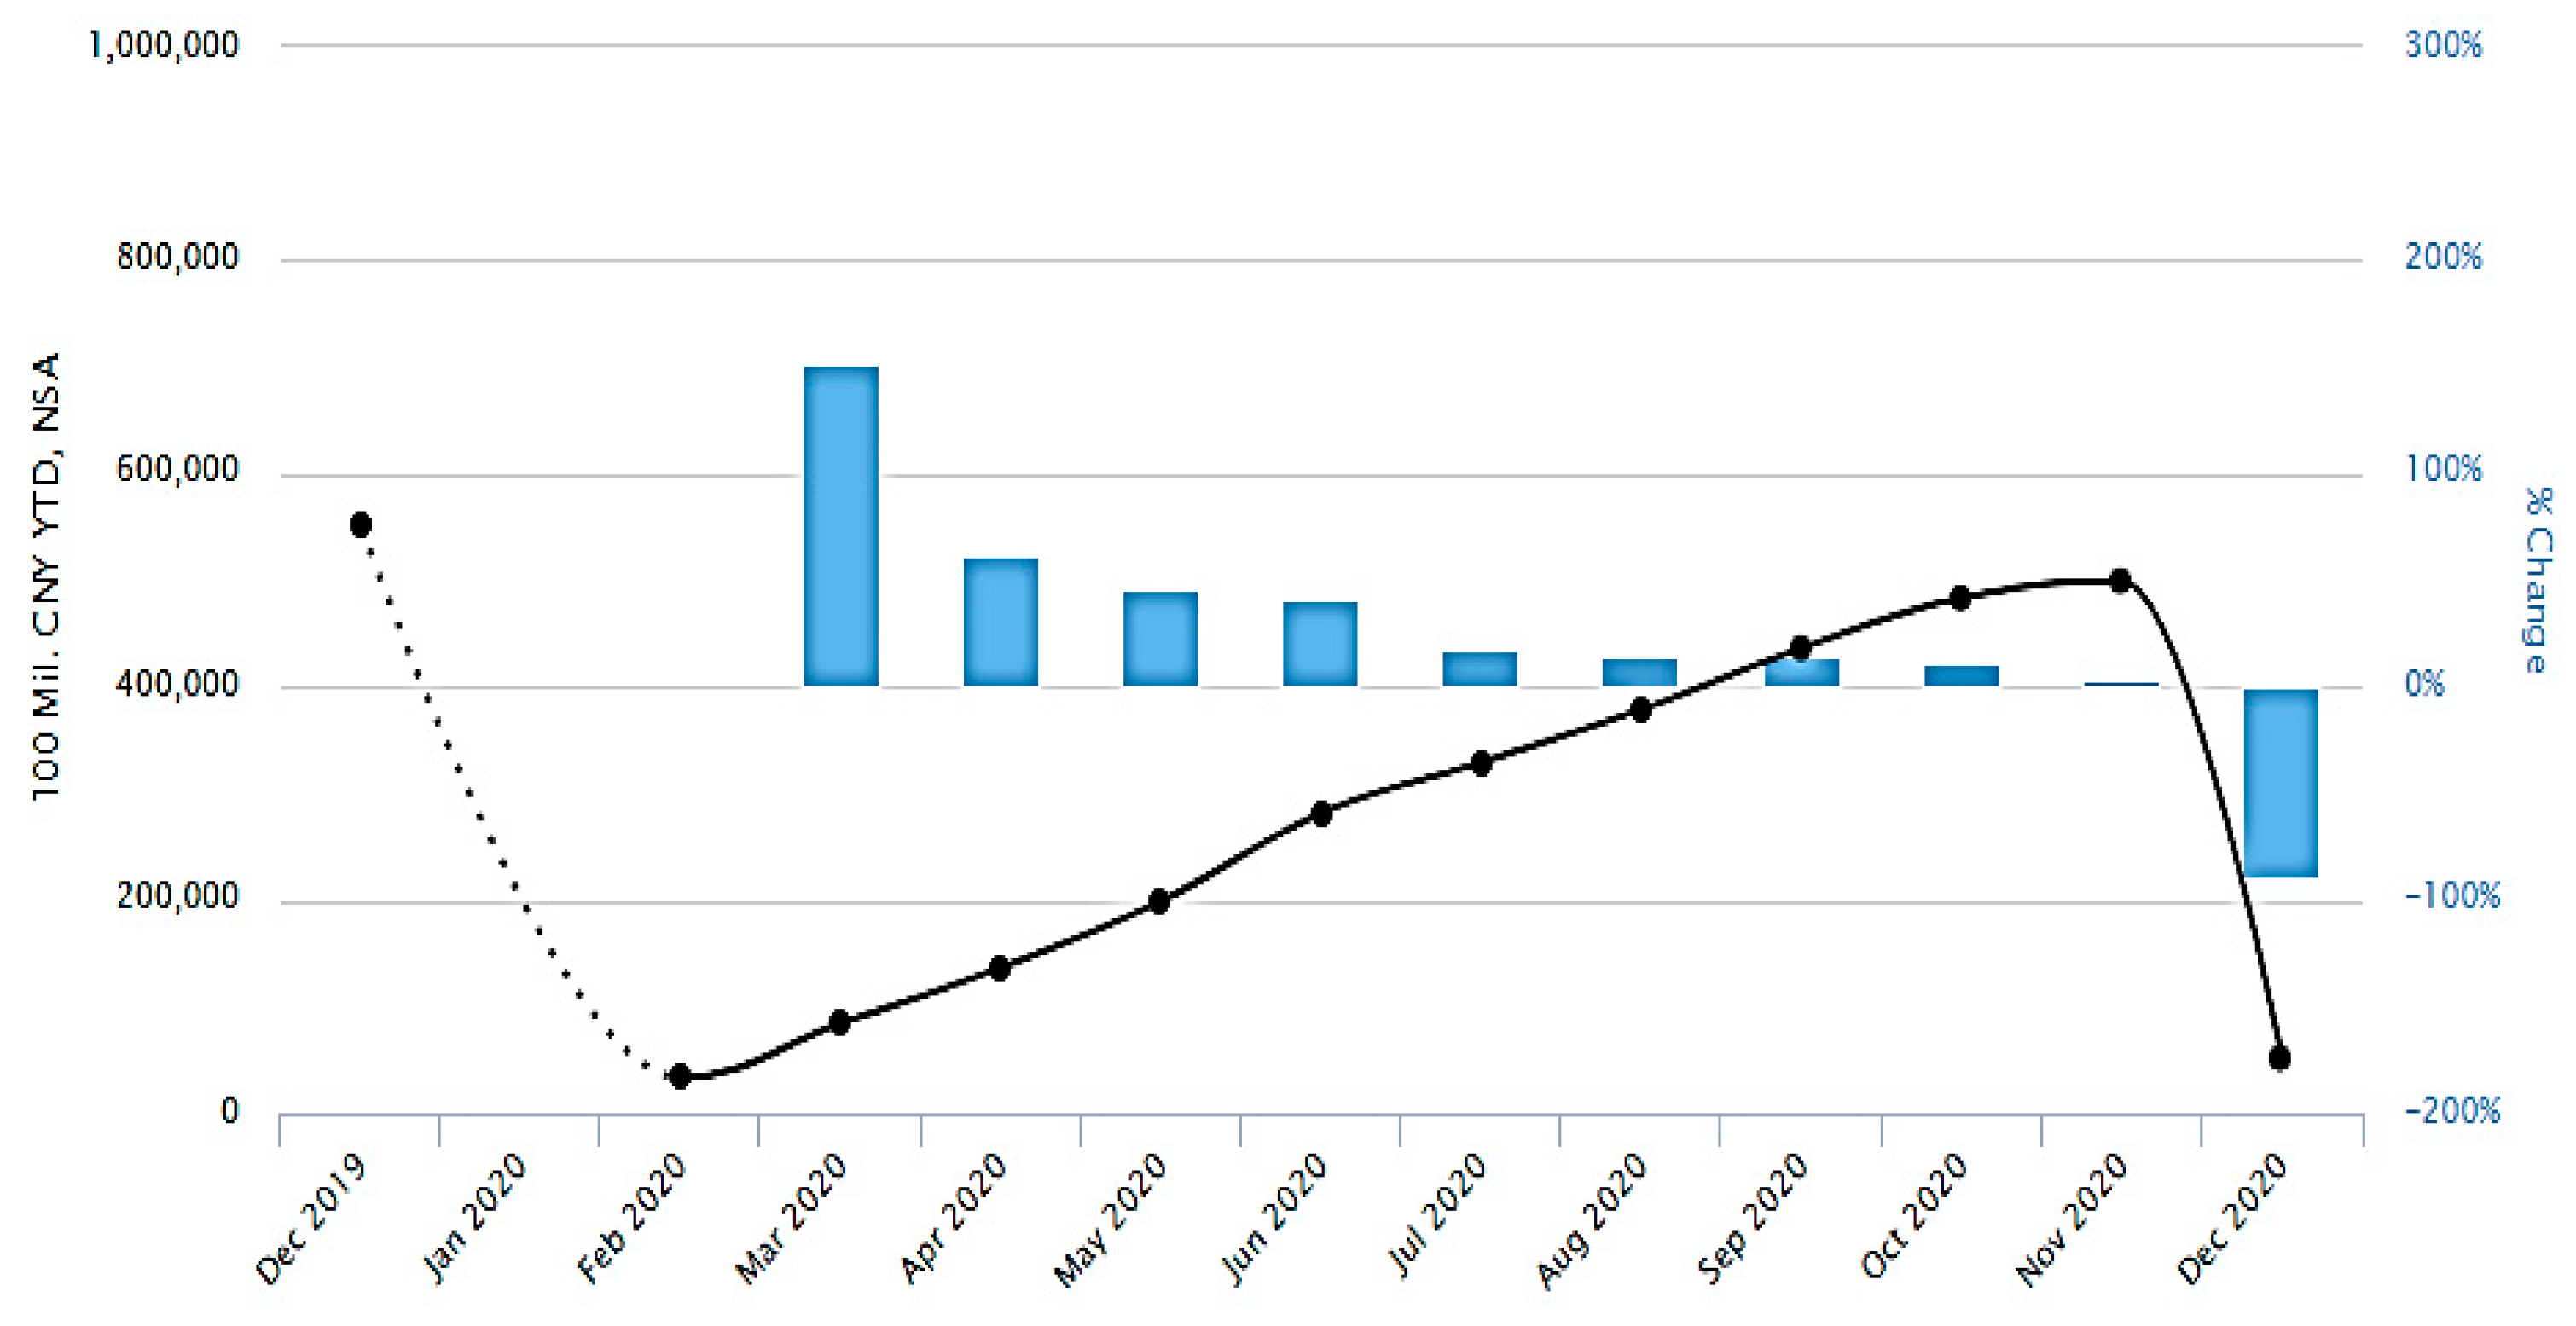
Figure 3 explores the nominal fixed investment trends for the Chinese economy between the years 2019 and2020. The figure shows that investment inChina remarkably declined due to the outbreak of COVID-19. Then the passage of time and development of precautions against COVID-19 had a positive impact on the investments of China. By the end of 2020, it had a negative growth rate, and COVID-19 also had a low growth rate.
Regarding the financial approach, it has additionally kept up enough for free. Through measures like balance sheet expansion, reserve requirement ratio RRR-cutting, and strategy loan cost-cutting, the People’s Bank of China (POBC)guarantees adequate liquidity and no expansion in financing costs for the real economy, simultaneously as financial strength. As of now, the focal banks unique enemy of scourge renegotiating portion has arrived at 800 billion Yuan. Simultaneously, under the state of impeded outside interest and the level foreign trade holds, PBOC focused on RRR–slicing to help develop all-out social financing. A more straightforward improvement plan comes from a “new framework.” In a request to battle the negative effects of COVID-19, as of in 1 March 2020, 13 territories, including Beijing, have delivered venture plans for critical activities in 2020 with up to 33.8 trillion Yuan. Among them, “new foundation” is exceptionally anticipated. “New framework” is unique concerning the customary foundation, for example, railroad, parkway, air terminal, and primarily incorporates seven perspectives: “5G foundation, UHV, intercity rapid rail line and metropolitan rail travel, new energy vehicle charging heaps, huge server farms, man-made consciousness, mechanical Internet” (
Chen et al. 2020).
Figure 4 presents the trade balance of the Chinese economy from 2017 to quarter 2 of 2020.
Figure 4 shows that China’s trade balance declined with the outbreak of COVID-19, such as in 2019, due to the severe conditions of COVID-19. Then, the passage of time and the development of precautions against COVID-19 positively impacted China’s trade balance. By the end of 2020, the trade balance had a positive figure, showing that the implications of COVID-19 were minimized.
Regarding business strategy, the public authority decreased the trouble on endeavours through the expense and charge decrease arrangements from one perspective. Then again, the public administration is effectively extending business channels. These channels incorporate developing enrollment plans for state-possessed undertakings, growing business at the grassroots level (for example, supporting agribusiness, instruction, clinical consideration, and destitution lightening, and so on), extending the size of business learners, sorting out “Cloud” job fairs for graduates, and properly postponing acknowledgment. It tends to be seen that under the extreme effects of the plague, China has consistently embraced general wellbeing approaches, financial arrangements, money-related strategies, mechanical approaches, and business arrangements, which are exceptionally focused on and very ground-breaking. Consequently, this paper will generally accept that the prior quarter ought to be the lower part of the transient economy. Afterward, it will show a “base bounce back what is more, generally adequacy”. Consistently, the probability of finishing the business and development targets set by the Central Economic Work Conference stays high. What is more, on the planet, the more noteworthy recuperation of China’s economy is expected to lead to the worldwide economy’s recovery (
Zhao et al. 2020).


