Abstract
Cell morphology and its mechanical properties are crucial factors in cancer development, affecting migration, invasiveness, and the potential risk of metastasis. However, most studies address these aspects separately, limiting the understanding of how morphological complexity relates to cellular mechanics. This work presents an integrated approach that simultaneously quantifies morphology and viscoelasticity in the human osteosarcoma cell line MG-63. Stress–relaxation experiments and optical imaging of the same cells were performed using a custom-built system that couples Atomic Force Microscopy (AFM) with an inverted optical microscope. Morphometric parameters were extracted from cell contours, while viscoelastic properties were obtained by fitting AFM data to the Fractional Kelvin (FK) and Fractional Zener (FZ) models. Among the morphological descriptors, the Shape Complexity (SC) was proposed. It is derived from the Lobe Contribution Elliptical Fourier Analysis (LOCO-EFA), which captures fine-scale contour features overlooked by conventional metrics. Experimental results show that, in MG-63 cells, higher SC values are associated with greater stiffness, indicating a correlation between cell shape complexity and cell stiffness. Furthermore, loading-rate analysis shows that the FZ model captures strain-rate-dependent stiffening more effectively than the FK model. This methodology provides a first approach to jointly analyzing quantitative morphological parameters and mechanical properties, underlining the importance of combined studies to achieve a comprehensive understanding of cell behavior.
1. Introduction
Bone and articular cartilage cancers impose a measurable global health burden. An analysis based on the Global Burden of Disease Study 2021 estimated 91,375 incident cases and 66,114 deaths worldwide in 2021 and reported increases in age-standardized mortality and Disability-Adjusted Life Years (DALYs) rates from 1990 to 2021 [1]. Osteosarcoma, one of the most common primary malignant bone tumors in children and adolescents, accounts for approximately 5–6% of childhood cancers and has a median incidence of 5.74 cases per million in children under 14 years [2,3]. These clinical trends motivate the development of new approaches to understanding cancer, including quantitative analyses at the cellular level using descriptors of cell shape and mechanics.
Cell morphology plays a pivotal role in identifying abnormal cells and assessing their metastatic potential. Specifically, cancer cells exhibit greater mobility compared with their healthy counterparts. Such increased mobility is evident from the number and size of the lobes, which are surface protuberances that enhance interactions with the surrounding environment and neighboring cells [4]. Moreover, morphological alterations frequently serve as indicators of invasiveness and developmental stages [5,6,7,8]. Ingber [9] highlighted that cell shape fundamentally governs how individual cells respond to external biochemical cues, thereby profoundly influencing tissue development and morphogenesis. Similarly, D’Anselmi et al. [10] demonstrated that modifications in cell membrane architecture can lead to significant metabolic changes in cancer cells, underlining the potential of cell morphology as a foundation for innovative therapeutic approaches. Furthermore, the transition from epithelial to mesenchymal states, characterized by a shift from rounded to elongated shapes [11], underscores the critical significance of morphology in regulating cellular behavior.
Methods for characterizing cell morphology encompass both qualitative descriptors, such as amoeboid or ramified phenotypes [4], and quantitative metrics, including aspect ratio, circularity, and roundness. Nevertheless, a universal descriptor capable of capturing the vast diversity of cell shapes remains elusive. For instance, while parameters such as aspect ratio and elongation index are well-suited for analyzing elongated cells, they do not provide insights into cell protrusions [4]. In response to this limitation, Sánchez-Corrales et al. [12] proposed the Lobe Contribution Elliptical Fourier Analysis (LOCO-EFA) method. This approach enables precise contour reconstruction and generates meaningful descriptors that effectively encapsulate critical morphological characteristics, making it a valuable tool for studying two-dimensional cellular morphology.
Beyond morphology, cancer cells exhibit significant alterations in their mechanical properties, including reduced stiffness due to cytoskeletal modifications [13,14]. This decrease in stiffness has been closely associated with their metastatic potential [15]. Although mechanical changes are usually quantified using Young’s modulus [16], this parameter alone is insufficient to comprehensively describe cell mechanics, as cells are not purely elastic materials but rather viscoelastic systems. Viscoelasticity is typically modeled through combinations of springs and dashpots, which represent elasticity and viscosity, respectively. Although simple models, such as the Maxwell or Standard Linear Solid (SLS) models, provide preliminary approximations of cell mechanics, more complex structures require advanced approaches. For instance, the Generalized Maxwell (GM) model not only achieves a better fit with experimental data, as evidenced by its lower error compared with the SLS model [17,18], but also captures a broader range of relaxation behaviors [18].
Moreover, fractional models [19] have gained prominence for their ability to describe viscoelastic behavior with fewer parameters than the GM model [20], offering a more efficient alternative for analyzing these complex properties. Some fractional models used to characterize the viscoelastic properties of cells include the Fractional Zener (FZ) [21] and the Fractional Kelvin (FK) [17].
Among the available techniques for measuring viscoelasticity, Atomic Force Microscopy (AFM) stands out for its versatility [22,23,24,25]. Its operating principle is straightforward: a sharp probe at the end of a flexible cantilever interacts with the sample surface, causing cantilever deflections that are detected by a position-sensitive photodetector receiving the laser beam reflected from the back of the cantilever. The relative position between the probe and the sample is controlled by a piezoelectric actuator. The photodetector signal is processed by a feedback control system that regulates the tip–sample interaction force, enabling the acquisition of force–distance curves used to determine the mechanical properties of the cells. In addition, its versatility enables AFM to be combined with complementary techniques, such as optical or confocal microscopy [26], expanding its capabilities for correlative studies.
Currently, the literature lacks studies that analyze in depth the relationship between morphology and cell mechanics. This gap is critical since cell shape and mechanical properties depend on the cytoskeleton [27]. In addition, studies are limited to reporting Young’s modulus as the only mechanical parameter or using simplified morphometric descriptors by converting cell shapes into ellipses, which significantly reduces the complexity of cell shape [26]. Studying the interplay between mechanical and morphometric characteristics provides deeper insights into the mechanisms that govern cellular behavior.
The objective of this research is to deepen understanding of cell mechanics and morphology, and of their relationships. To this end, the MG-63 human osteosarcoma cell line was used as the model system. Cell images were first acquired using a custom-built inverted optical microscope. Individual cells were then selected, and relaxation experiments were performed on each selected cell using AFM at two loading rates. The morphological analysis considered standard metrics such as area, circularity, and aspect ratio, as well as metrics from the LOCO-EFA method, including entropy and a new parameter introduced in this work, Shape Complexity (SC). In this initial analysis, SC is used to organize morphological variability at the single cell level and to compare corresponding mechanical and viscoelastic responses within the MG-63 model. Mechanical properties assessed included Young’s modulus and viscoelastic parameters, evaluated through the FZ and FK models. This study highlights the interplay between cell morphology and mechanical behavior, offering insights into how each viscoelastic model captures cellular responses to varying mechanical stimuli. In this context, SC is introduced as a compact morphometric descriptor that supports these comparisons and helps summarize shape variability in the present dataset.
2. Theoretical Framework
Understanding cellular behavior requires integrating theoretical frameworks that account for both cell morphology and mechanical properties. This section presents the concepts and models that form the basis of the present study.
2.1. Cell Morphology
Cell morphology refers to the physical appearance and structural features of cells, including their shape, size, and surface architecture. These morphological characteristics are closely linked to the physiological state, type, and function of the cell. Variations in cell shape are related to fundamental processes such as proliferation, migration, differentiation, and apoptosis [28,29,30]. For instance, cancer cells often exhibit irregular shapes, enlarged nuclei, and altered cytoskeletal organization compared with their healthy counterparts. Therefore, analyzing cell morphology serves as a powerful tool for cell classification, disease diagnosis, and monitoring cellular responses to various stimuli or treatments [6,31,32].
Cell shape characterization can be addressed through two distinct approaches: qualitative and quantitative [4]. The qualitative approach involves expert visual evaluation to classify cells based on recognizable morphological patterns, such as fusiform, polygonal, or stellate shapes. In contrast, the quantitative approach combines microscopy with image processing and morphometric analysis (the numerical evaluation of shape, size, and structural attributes) to derive numerical descriptors that reflect cells’ geometric features, enabling statistical comparisons between samples. This study focuses on the characterization of cell shape using morphometric analysis.
2.2. Quantifying Cell Shape Through Morphometry
The quantitative study of shape employs morphometric descriptors, which convert complex contours and surfaces into numerical values that characterize geometric properties. These descriptors capture key aspects such as size, elongation, circularity, and convexity [33]. Table 1 summarizes the most commonly used morphometric descriptors, including their analytical expressions. These descriptors play a key role in morphometric analysis due to their sensitivity to shape features. For example, Circularity and Roundness are widely used to detect morphological deviations from ideal symmetric shapes, thereby enabling discrimination between normal and pathological structures in biomedical imaging.

Table 1.
Morphometric descriptors with formulas and variable definitions.
Despite their considerable utility, these global descriptors may fail to discriminate between shapes with distinct geometries that yield similar values for a given metric, thereby limiting their discriminative power. A typical example is the aspect ratio (AR), which cannot distinguish between contours that have comparable height and width but markedly different boundary complexity. Figure 1 illustrates that the aspect ratio of the nine different regular polygons does not change. Therefore, AR is not an accurate descriptor of cell shape. Analogous limitations arise for Circularity and Roundness, which can assign nearly identical values to objects that are globally circular but possess localized protrusions or invaginations. For these reasons, there is a need for contour-based approaches that capture local variations, such as curvature profiles or advanced decompositions.
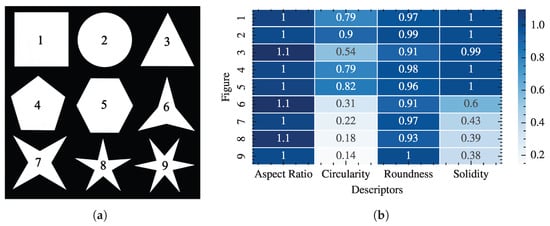
Figure 1.
Comparison between commonly used morphometrics of different regular polygons of the same width and height: (a) Regular polygons labeled 1-9, (b) Heatmap of the corresponding values of Aspect Ratio, Circularity, Roundness, and Solidity for each shape.
2.3. LOCO-EFA Method
Several methodological frameworks have been proposed in the literature to quantify the morphological features of biological structures. Among them is the elliptic Fourier analysis (EFA), which decomposes a closed contour into a series of elliptical harmonics [34]. However, EFA has important limitations, as its Fourier coefficients are degenerate and not independent, which complicates statistical analyses and reduces its effectiveness for robust shape comparisons [35]. To address these issues, Sánchez-Corrales et al. [12] developed the LOCO-EFA method as an enhancement of conventional EFA.
LOCO-EFA eliminates coefficient degeneracy and represents each cell contour as a unique series of modes, enabling a direct association between the number and prominence of protrusions (lobes) and these coefficients. In general, both and EFA modes contribute to the mode, except in specific cases.
Geometrically, each mode can be interpreted as two oppositely rotating circles, each with its own radius and starting point for rotation. Each mode is defined by four parameters , which describe the radii and initial phases of the contributing circles. In addition, a scalar amplitude is assigned to each mode, determined by the radii, the angular distance between the initial phases, and the phase of the primary mode (specifically ) [12], as follows:
Sánchez-Corrales et al. [12] also proposed several shape descriptors, including entropy, XOR (exclusive OR) difference, and cumulative difference, to quantify contour complexity directly from LOCO-EFA modes:
- Entropy is based on Shannon Entropy and represents the complexity of the outline. It increases with the simultaneous contributions of different harmonic modes and is defined as:where , for a given N number of modes analyzed [12].
- XOR difference quantifies the mismatch between the real outline and the outline reconstructed from the LOCO-EFA modes using the exclusive OR operation. As the number of modes increases, the XOR value decreases.
- Cumulative difference integrates the area under the XOR curve to quantify complexity. This parameter is determined by adding the XOR values starting from .
To further exploit the descriptive capabilities of LOCO-EFA, a new descriptor, Shape Complexity (SC), is introduced in this study, which captures the total harmonic content required to represent a contour after size effects are removed. SC sums the amplitudes of the LOCO-EFA modes, yielding a single intuitive value of geometric detail, defined as
where and are related to the size of the cell structure rather than the complexity of its shape, and is the maximum value, where tends to zero.
2.4. Mechanical Properties
The mechanical properties of cells encompass both elastic and viscoelastic responses to external stress or strain. These properties are essential for understanding how cells resist and adapt to mechanical stimuli [36]. The following describes the fundamental models used to quantify these mechanical responses, including classical elastic contact formulations and viscoelastic models such as the FK [37] and FZ models [20].
2.4.1. Foundations of Young’s Modulus
Young’s modulus (E) quantifies the stiffness of a cell and is a fundamental parameter for characterizing its elastic response under mechanical loading. In AFM indentation experiments, E is typically extracted from force–distance curves. In this study, E was determined by fitting the force–distance curves to Sneddon’s model,
where F is the loading force, is the indentation depth, () is the half opening angle of the pyramidal tip, and is the Poisson’s ratio of the cell. Cells are assumed to be incompressible; thus , an assumption widely adopted in the literature when studying cell mechanical properties [38,39,40].
2.4.2. Viscoelastic Parameters
Viscoelastic parameters are fundamental for characterizing the mechanical behavior of materials that exhibit both viscous and elastic responses. In the cellular context, these parameters allow us to evaluate how cells dissipate mechanical stress over time. The viscoelastic parameters are obtained by fitting the force–relaxation curves [41], as follows:
where for a pyramidal indenter, denotes the maximum indentation depth, is the Poisson’s ratio of the cell, fixed at 0.5 to account for its nearly incompressible behavior, and is the relaxation function, which characterizes the ratio of stress to strain. One strategy for modeling the function is to use fractional-order models [17]. These models can be derived from mechanical representations that consist of analogous combinations of springs and dampers, such as the FZ model, or from general mathematical formulations, such as the FK model, without relying on an explicit mechanical structure.
The FK model is often preferred for its simplicity, as it requires only two independent parameters [37,42]. Its relaxation function is given by
where is the elastic coefficient, and is a normalization parameter. Without loss of generality, can be taken to be 1 s [42]. The parameter is the order of the fractional derivative, and the operator corresponds to the Gamma function. In this model, corresponds to instantaneous stiffness, whereas captures both the degree of deformability and the capacity of the system to reorganize or fluidize [20].
On the other hand, the FZ model has been adopted in theoretical frameworks to describe viscoelastic behavior and has demonstrated its ability to capture the relaxation phenomenon of cells [20,21]. Figure 2 shows the mechanical analogue of the FZ model, which consists of two elastic elements and one viscoelastic (fractional) element. This model involves four independent parameters [19], and its relaxation modulus can be written as
where is the two-parameter Mittag–Leffler function. The coefficients and are elastic parameters, while does not have a direct mechanical analogue but can be related to a characteristic relaxation time through . The exponent is the order of the fractional derivative [19].
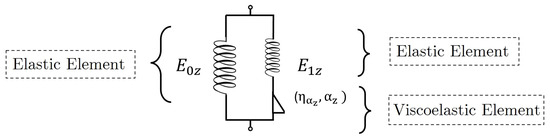
Figure 2.
Schematic representation of the FZ model.
In this model, a low value indicates greater cell deformation capacity, whereas a high value indicates greater stiffness. In addition, a low value of implies a high capacity for system reorganization; that is, a higher fluidity [20].
3. Methodology
To characterize the morphological and mechanical properties of the cells, a custom-built optical microscope was coupled to an AFM. Cells were seeded and incubated for 24 h before measurements. During AFM experiments, the cells were maintained in their culture medium, and stress–relaxation tests were performed, while optical images of the probed cells were acquired using the coupled microscope. To define the measurement set, an empirical visual screening was carried out to identify the most representative cell morphologies. Based on this assessment, a group of 24 individual cells was selected and classified into three groups according to their morphological characteristics. This sample size is consistent with AFM-based single-cell mechanics studies, where similar numbers of cells have been reported due to the demanding nature of the technique [18,43].
3.1. Experimental Arrangement
An AFM NTEGRA model (NT-MDT Spectrum Instruments) coupled to a modified OpenFlexure flat-top microscope (MOF-AFM) was used to perform the measurements [44]. The dimensions of the optics module of the OpenFlexure flat-top microscope were modified to fit within the AFM sample holder and reach the sample plane. The microscope focus mechanism was assembled from 3D-printed parts, mounted on an acrylic board, and connected to an Arduino and a Raspberry Pi, as shown in Figure 3a. Adjustable-height legs were added beneath the acrylic board to raise or lower the microscope, accommodating the upward motion of the AFM sample holder used to position the sample under the probe. The MOF-AFM was placed under a custom-made table with an oval-shaped hole in the center to allow free movement of the microscope. The AFM was then mounted on the table, ensuring that the MOF-AFM lens could extend into the AFM without interfering with the sample holder, as illustrated in Figure 3b.
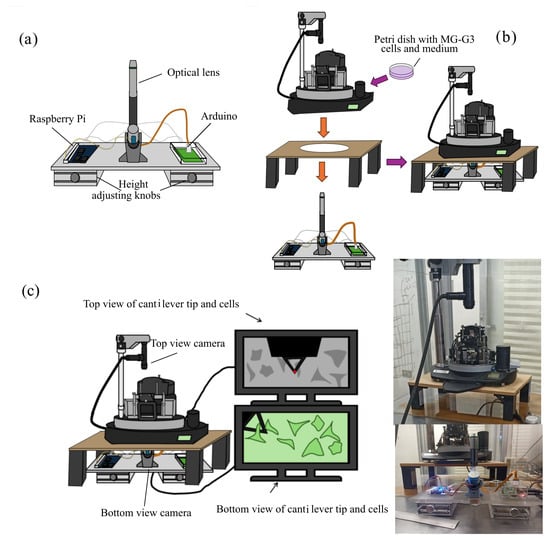
Figure 3.
Experimental setup. (a) Modified Openflexure microscope; (b) coupling of the AFM and inverted microscope; (c) schematic representation, and photographs of the complete setup of the optical inverted microscope coupled with the AFM.
Once both microscopes were positioned, they were connected to their respective displays and controllers. The optical microscope integrated into the AFM was used to align the laser with the cantilever, whereas the MOF-AFM was used to capture cells. Figure 3c shows the complete setup.
3.2. Cell Culture and Sample Preparation
MG-63 human osteosarcoma cells were obtained from the American Type Culture Collection (ATCC; Manassas, VA, USA; catalog no. CRL-1427; http://www.atcc.org accessed on 1 December 2025) and handled following ATCC guidelines. Cells were expanded in 25 cm2 culture flasks (Corning, NY, USA). For AFM experiments, cells were seeded in 3.5 cm Petri dishes and cultured in DMEM/F-12 supplemented with 10% fetal bovine serum (Gibco, Thermo Fisher Scientific, Waltham, MA, USA) and 1% penicillin–streptomycin (Gibco). Cultures were maintained at 37 ∘C in a humidified incubator with 5% CO2 for 24 h to allow adhesion. Subsequently, the dishes were transferred to the AFM stage for measurements.
3.3. Optical Imaging and Stress Relaxation Measurements by AFM
Cell culture was placed on the AFM stage to perform image acquisition and force–relaxation experiments. Before force measurements were performed, an image of the cells was captured using MOF-AFM (see Figure 4a). A target cell was then selected for stress–relaxation experiments using AFM, as shown in Figure 4b. The selected cell was first indented at a loading rate of 3 m/s. The loading rate was subsequently increased to 12 m/s for a second indentation and finally returned to 3 m/s for a third indentation. This sequence was then repeated for a different cell. During the stress relaxation experiments, both force–distance and force–relaxation curves were recorded. Each cell was labeled to ensure an accurate association between the image and the corresponding force curve.
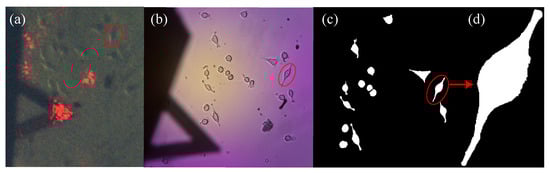
Figure 4.
Views of MG-63 cells. (a) Image acquired with the optical microscope integrated into the AFM. (b) Image obtained using the custom-made inverted optical microscope. (c) Binary mask of indented cells. (d) Binary mask of a single cell.
All experiments were performed at a controlled loading force of nN using a Bruker SNL-10 probe (cantilever B, Bruker Corporation, Billerica, MA, USA). The cantilever has a nominal spring constant of 0.12 N/m, an air resonance frequency of 23 kHz, and a pyramidal tip with a nominal radius of 2 nm, according to the manufacturer’s specifications. Experiments were conducted at room temperature and completed within one hour after cells were removed from the CO2 incubator. This workflow is consistent with other AFM measurements on living cells [45,46,47].
3.4. Image Analysis
Original cell images were loaded into Fiji (ImageJ, version 2.14.0/1.54r) [48]. Each image was first converted to 8-bit grayscale, and the spatial scale was calibrated using the cantilever tip length as a reference. Cell contours were then obtained through a user-guided segmentation workflow: the intensity threshold was interactively adjusted to generate a binary mask, internal holes were filled, and adjacent cells were separated using the watershed tool when necessary. Throughout this procedure, the segmentation was manually supervised using the ROI Manager tool of Fiji, and corrected so that each binary mask accurately represented the outline of a single cell (Figure 4c). From these masks, Fiji provided standard morphological descriptors, including projected area, perimeter, circularity, and contour length.
The resulting binary masks were subsequently used as input for the LOCO-EFA methodology [12]. To standardize the analysis and represent all cells on a common image size and scale, each mask was embedded in a square canvas and resampled to a fixed resolution of 512 × 512 pixels, preserving the original aspect ratio and centering the cell within the frame. This normalization step ensured that all masks shared the same spatial support, allowing LOCO-EFA to extract contour-based descriptors under consistent geometric conditions.
3.5. Force Curve Analysis
Force curves were fitted using the function curve_fit from scipy.optimize module in the SciPy library [49]. Force-distance curves were fitted to Equation (4), whereas force–relaxation curves were fitted to Equation (5). In the latter case, the relaxation function, , was evaluated using Equations (6) and (7), corresponding to the FZ and FK models, respectively.
3.6. Statistical Analysis
Statistical comparisons between groups were performed using the non-parametric Kruskal–Wallis test for pairwise analyses. This test evaluates the null hypothesis that the medians of all groups are equal, implying that any observed differences are due to random variation. The null hypothesis was rejected when the p-value was less than 0.05. Statistical significance was denoted as follows: * for and ** for .
4. Experimental Results
4.1. Morphology Analysis
Figure 5 shows the 24 analyzed cells, labeled from 1 to 24 in ascending order of SC (Equation (3)). Cells were categorized into three groups based on their SC value. The group boundaries were defined empirically from the observed SC distribution and visually apparent morphological transitions. Integer cutoffs at 60 and 90 were therefore selected because they align with these transitions. The resulting groups are defined as Group I (SC ), Group II (60 < SC), and Group III (SC > 90), shown in blue, green, and red, respectively.
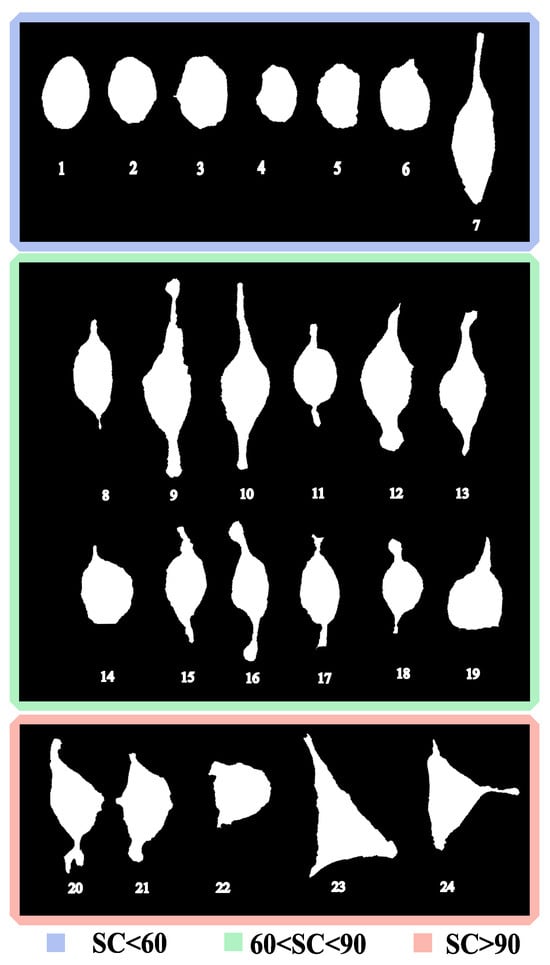
Figure 5.
Contour of the MG-63 cells measured. Cells were ordered by their SC value and classified into three groups, indicated by the colored frames: (blue), (green), and (red). Therefore, the classification used and in Equation (3). Each cell is identified with a number for easy reference, a higher number indicates larger SC.
For SC < 60, cells are predominantly rounded. Numerically, they exhibit high circularity , low aspect ratio , and high solidity . These values confirm their compactness and isotropy. Importantly, all cells in this group remain below , making 60 a consistent boundary before the sharp structural changes observed in cell 8. An exception is cell 7, which, although included in this group due to its SC value (), exhibits lower circularity and a more elongated profile than the other rounded cells. Morphologically, it could be associated with Group II; however, when the integer threshold is fixed at 60, it remains within Group I.
Cells in Group II adopt elongated and irregular morphologies. Here, cells present a sharp drop in circularity ( compared with in Group I), an increase in aspect ratio ( compared with ), and larger perimeters (m relative to m). These descriptors indicate that Group II corresponds to an intermediate stage, in which cells lose their rounded morphology but have not yet reached the highly complex shapes observed beyond SC .
For cells in Group III, the classification captures an apparent discontinuity in shape complexity. While Group II extends up to cell 19 with SC ≈ 84, the next cell (cell 20) already presents SC values close to 98, creating a numerical gap that justifies setting the upper threshold at 90. This transition is also supported by morphological descriptors: compared with Group II, cells in Group III display larger perimeters ( vs. ), reduced solidity ( vs. ), and persistently low circularity ().
In addition to the SC classification, each cell was evaluated using conventional descriptors (area, perimeter, circularity, and aspect ratio) and metrics derived from the LOCO-EFA method, such as entropy and cumulative difference. Entropy (see Figure 6b) shows low values for circular cells and increases as they develop lobes or adopt polygonal or triangular shapes. In contrast, the CD descriptor (see Figure 6c) clearly separates circular and elliptical morphologies from more complex geometries. Finally, Figure 6g,h display area and perimeter, highlighting substantial variability in cell size; notably, cells with tend to be smaller.
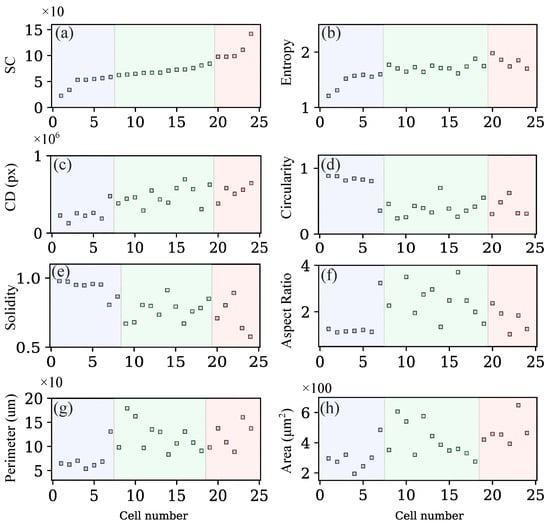
Figure 6.
Morphological features measured for each cell shown in Figure 5: (a) shape complexity, (b) entropy, (c) cumulative difference (CD) in pixels, (d) circularity, (e) solidity, (f) aspect ratio, (g) perimeter, and (h) area.
Quantitative Validation of SC-Based Grouping
Although SC cutoffs were defined by visual inspection, we assessed their reliability using a multivariate k-Nearest Neighbor (k-NN) analysis [50] that incorporates the available morphometric descriptors (area, perimeter, circularity, aspect ratio, roundness, solidity, and entropy). We evaluated k-NN configurations by varying the weighting scheme, feature scaling, and distance metric, and quantified the quality of the resulting three-group partition using internal clustering metrics (silhouette, Calinski–Harabasz, and Davies–Bouldin). Based on these metrics, the selected configuration was weights = uniform, scaler = robust, and metric = cosine, using all_numeric as the feature set.
The value of k was set using the practical rule , where n is the number of cells; since , we used . Figure 7 shows the cells ordered by and compares the threshold-based assignment with the k-NN predictions. For , we observed disagreements (overall agreement ). The agreement suggests that the descriptor alone captures most of the multivariate structure defined by the conventional morphometric features. For the remaining 3 cells, 2 of them correspond to cells whose neighborhood in feature space is closer to an adjacent group, which is expected for samples located near the fixed SC cutoffs. In addition, the quality of the k-NN-induced partition was quantified using internal metrics computed with cosine distance, yielding a silhouette of , a Calinski–Harabasz index of , and a Davies–Bouldin index of .
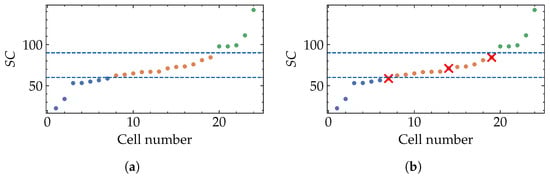
Figure 7.
Comparison between the SC-threshold stratification and a multivariate neighborhood-based consistency analysis. (a) Cells are ordered by increasing and grouped using fixed cutoffs (blue dashed lines) at and . (b) k-NN predictions using the full set of conventional morphometric descriptors (area, perimeter, circularity, aspect ratio, roundness, solidity, and entropy). Red × marks cells where k-NN disagrees with the SC-threshold assignment.
Two of three of the SC-k-NN disagreements correspond to clear boundary cases when a continuous descriptor is discretized. Cell 7 has but exhibits a noticeably elongated silhouette, making it closer to Group II in multivariate feature space. Conversely, cell 19 lies at the upper end of Group II and shows increased irregularity/protrusions consistent with the onset of Group III-like morphology. Finally, cell 14 falls within but remains relatively compact/rounded, and is therefore grouped with Group I by k-NN.
4.2. Influence of Cell Shape on Mechanical Properties
To evaluate the influence of cell shape on mechanical properties, the data obtained from fitting the 24 force–distance (Figure 8a) and force–relaxation (Figure 8b) curves for each indentation with the different models were grouped according to the SC classification shown in Figure 5. For each indentation, a statistical analysis was performed to identify significant differences among the three groups.
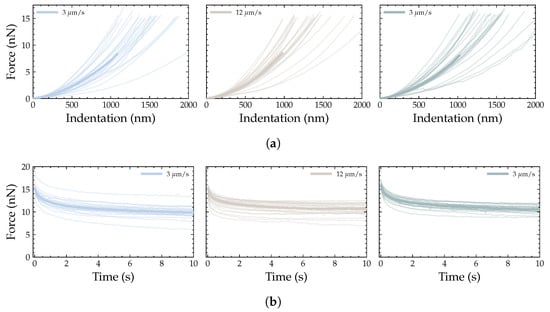
Figure 8.
(a) Force-distance curves and (b) force–relaxation curves obtained at the three loading rates used in this study; the shaded region shows all measured curves and the highlighted line denotes the median.
4.2.1. Estimation of Young’s Modulus
Figure 9 shows the median Young’s modulus values for the three groups. Values were obtained by fitting the force–distance curves with Equation (4). The value of E for cells in Groups II and III is higher than that for cells in Group I at all three indentation depths; this indicates that cells with larger SC are stiffer. However, statistically significant differences are present only in the first and third indentations.
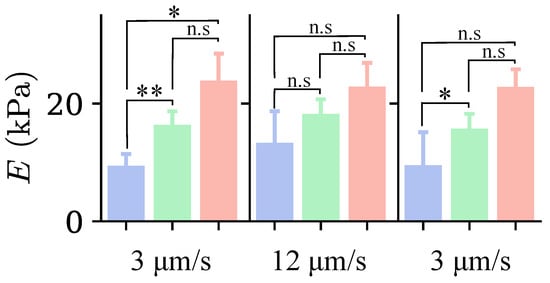
Figure 9.
Median values of Young’s modulus for each cell group identified in Figure 5, for the three indentations, with colors indicating the group as in Figure 5. The loading rate corresponding to each indentation is indicated at the bottom of the graph. n.s. indicates non-significant differences (); * , ** .
4.2.2. Fractional Kelvin
Figure 10 displays the median values of the parameters and for the three groups and the different indentations. These values were obtained by fitting the force–relaxation curves with Equations (5) and (6). For all three indentations, the value of is higher in cells from Groups II and III compared with those in Group I. This result confirms what we observed earlier with Young’s modulus: a greater SC corresponds to greater rigidity. Nevertheless, statistically significant differences are present solely in the first and third indentations.
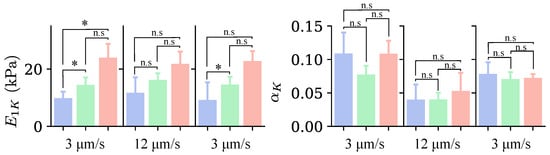
Figure 10.
Median values for the parameters obtained from the curve fit with the FK model for each group of cells identified in Figure 5, for the three indentations, with colors indicating the groups of cells as in Figure 5. The loading rate corresponding to each indentation is indicated at the bottom of the graph. n.s. indicates non-significant differences (); * .
Regarding the parameter , there is no clear pattern, suggesting that the cell shape does not influence it. Furthermore, in the third indentation, the differences between the groups are indistinguishable.
4.2.3. Fractional Zener
Figure 11 presents the median values of the parameters , , , and for the three cell groups and the different indentations. These values were obtained by fitting the force–relaxation curves with Equations (5) and (7). Regarding the parameter , in the first indentation, the values for Groups II and III are higher than those for Group I, indicating that cells in Group I are more deformable, with statistically significant differences observed only between Groups I and II. This behavior remains in subsequent indentations; however, the differences are not statistically significant.
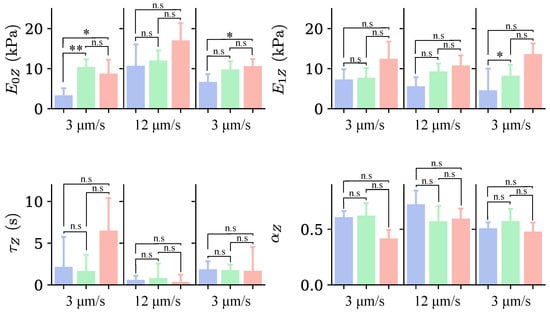
Figure 11.
Median values for the parameters obtained from the fit with the FZ model for each group of cells identified in Figure 5, for the three indentations, with colors indicating the group of cells as in Figure 5. The loading rate corresponding to each indentation is indicated at the bottom of the graph. n.s. indicates non-significant differences (); * , ** .
The trend of the values obtained for the parameter indicates that the stiffness of cells in Groups II and III is greater than the stiffness of cells in Group I. Thus, cells with larger SC are stiffer. However, the differences are not statistically significant. This behavior is consistent in the three indentations.
The parameter appears to be higher for Group III in the first indentation. However, the data are highly dispersed, and the differences are not statistically significant. In the second indentation, the values of the three groups are similar, as they are in the third indentation. For the parameter , cells in the third group have a smaller value, indicating greater stiffness. However, this behavior is present only in the first indentation. For the second and third indentations, there is no evident pattern.
4.3. Influence of Loading Rate on Mechanical Properties
To elucidate the effect of loading rate on cellular response and identify parameters that reflect it, a comparison was made across the different indentations. This comparison was conducted both within cell groups and across the overall cell population.
4.3.1. Estimation of Elastic Parameters
The parameters that measure the elastic properties of the cell include the Young’s modulus (E) in the Sneddon model, in the FK model, and and in the FZ model. Table 2 provides an analysis by Group, showing the percentage change in these parameters relative to the initial indentation value. The effect of the loading rate on the elastic parameters varied across models. In the second indentation, when the loading rate was increased, the parameter E increased by 39% in cells from Group I, while the increases for the other groups remained below 25%. The parameters and , corresponding to the FK and FZ models, respectively, displayed changes of less than 25% in all cell groups. Conversely, within the FZ model, the parameter increased by 95% in Groups I and III. Although some groups showed notable changes, these were not statistically significant. For the third indentation, where the loading rate matched that of the first indentation, the change in the elastic parameters was less than 25% except for parameter , which decreased by 31% compared with the first indentation.
Table 2.
Percentage increase (↑) or decrease (↓) in mechanical parameters for the second and third indentations for each cell group, relative to the median values from the initial indentation. Note that the values increasing or decreasing by more than 25% were marked. * 0.05, ** 0.01.
Figure 12 depicts the behavior of the elastic parameters observed in individual groups, which is also reflected in the analysis of all cells. For the second indentation, E presents notable changes (); has a practically constant value; shows the greatest changes, with statistically significant differences () and remains nearly constant, with a slight decrease in the average value compared with . The differences between the first and third indentations were not significant.
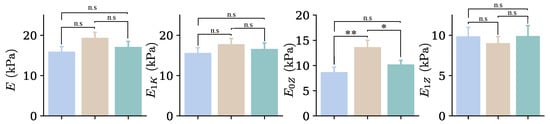
Figure 12.
Mean values of Young’s modulus and elastic parameters for both the FK and FZ models, obtained from the entire set of cells for the three indentations performed at loading rates of 3 m/s (blue), 12 m/s (beige), and 3 m/s (green). n.s. indicates non-significant differences (); * , ** .
4.3.2. Estimation of Viscous Parameters
The viscosity of the cells in the FK model is determined by , while in the FZ model, it is governed by and . Table 2 presents a group-by-group analysis of these parameters. For the second indentation, the parameters and decreased significantly, with changes exceeding 50% in most groups. Regarding the parameter , only Group III showed an increase of 42% from the initial value, and the rest remains unchanged. For the third indentation, the parameters and partially returned to their initial values. In Groups I and II, the changes were below 25%. For the third group, the changes exceeded those of the first two groups but remained lower than those recorded in the second indentation. Regarding the parameter , the change did not exceed 25%.
Figure 13 shows that the behavior of the viscous parameters observed in individual groups is also reflected in the analysis of the entire cell population. In the second indentation, the parameters and decrease significantly, . In the third indentation, these parameters partially return to their initial values. Moreover, the difference between the first and third indentations is not statistically significant.
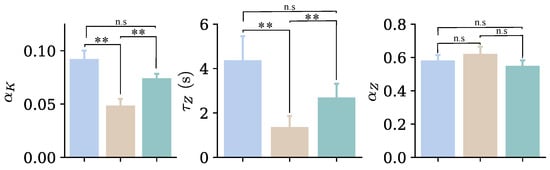
Figure 13.
Mean values of the parameters that account for the viscous part of cells for both the FK and FZ models, obtained from the entire set of cells for the three indentations performed at loading rates of 3 m/s (blue), 12 m/s (beige), and 3 m/s (green). n.s. indicates non-significant differences (); ** .
5. Discussion
5.1. Morphology
Figure 5 highlights the pronounced morphological heterogeneity observed in MG-63 cells, even within the same culture. Traditional metrics for quantifying cell shape include aspect ratio and circularity or form factor [4,26]. However, the aspect ratio has limitations, particularly when distinguishing between shapes that differ markedly in morphology but share similar elongation ratios. For example, circular and triangular cells produce similar aspect ratios, as shown in Figure 6c. Likewise, although circularity effectively separates circular cells from irregular ones, it cannot discriminate between elongated cells, lobed cells, and polygonal shapes, as illustrated in Figure 6d. As a result, multiple metrics are often required to analyze cell morphology, since no single descriptor can capture its full complexity. Nevertheless, even the combined use of several conventional parameters does not always ensure an accurate quantification of morphological features.
When cells are sorted by entropy (see Figure 6b), elliptical and round cells are shown to have the lowest values, while cells with longer lobes have the highest values. However, the middle section of this classification does not seem to follow any particular pattern regarding shape. This lack of information in the middle section prevents entropy from accurately describing cell shape on its own. Nevertheless, it can be used to identify cells with either low or high complexity.
The XOR descriptor exhibits an unclear pattern for distinguishing specific morphologies. Extreme values (both high and low) were observed in elongated cells, while cells with rounder bodies, regardless of the number of lobes, fell within an intermediate range. These results suggest that this descriptor is primarily helpful for separating elongated cells from the others in the sample, but lacks the precision needed to discriminate between more complex morphologies.
A morphological pattern emerges when cells are organized by their SC values (see Figure 6a). Cells with SC values below 60 generally exhibit round or elliptical shapes with few or no lobes, becoming more elongated as the SC value approaches 60. For SC values , cells exhibit longer and more pronounced lobes, with spindle shapes that become shorter as SC increases. Cells with SC values near 90 show a D-shaped form, while those above 90 have triangular shapes with pronounced lobes.
Figure 14 shows representative cell images in an SC-Entropy plane, with SC as the horizontal axis and entropy as the vertical axis. For low SC (<60) and low Entropy (<1.4), cells exhibited circular shapes and smooth contours. As entropy increases (1.4 < Entropy < 1.8), cells become slightly distorted, exhibiting ovoid contours and small irregularities along their boundaries. For cells in Group II (60 < SC < 90), their shapes are clearly elliptical bodies with at least one prominent lobe protruding from the main contour for Entropy between 1.4 and 1.8. As entropy increases (>1.8), cells become spindle-shaped, showing two prominent lobes. Finally, cells with SC > 90 exhibit high Entropy (>1.8) with triangular or D-shaped morphologies and three pronounced lobes. These results illustrate the complementary nature of SC and entropy descriptors. Entropy primarily quantifies contour irregularities, ranging from smooth to highly irregular boundaries, whereas SC reflects the presence and number of lobes, capturing morphological complexity.
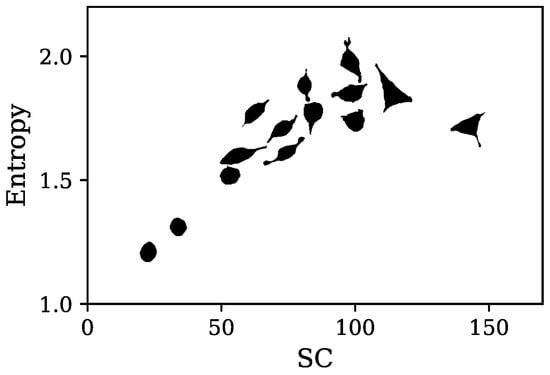
Figure 14.
Representative cell contours plotted in the SC-entropy plane. Each silhouette is positioned at the SC and its corresponding cell’s entropy values.
In addition, the description provided by the SC could be suitable to explore processes such as epithelial to mesenchymal transition, which is accompanied by pronounced changes in cell shape, including the emergence of protrusive features [51]. By capturing lobe-related aspects of morphological complexity, SC is a promising morphometric descriptor; however, its broader applicability and biological relevance should be assessed in future work.
5.2. Influence of Cell Shape on Mechanical Properties
When examining the mechanical characteristics of cells using AFM spectroscopy, it is often observed that even within the same cell line, different indentation depths occur at an identical loading rate, highlighting cellular heterogeneity [20]. The mechanical properties and morphology of cells are influenced by the cytoskeleton’s conformation [52,53]. Thus, elucidating the factors that contribute to deviations in cellular response to stress or strain can be achieved by studying mechanical properties in combination with cell morphology. This study uses the SC descriptor to classify cells based on morphology. Then, it examines their mechanical properties according to this classification while preserving a fixed loading rate.
When cells were grouped by their SC values, a clear trend in elastic parameters emerged across the different mechanical models. Specifically, elongated cells or those with more pronounced lobes tended to be stiffer than circular cells (see Figure 9, Figure 10 and Figure 11). This relationship between SC and the mechanical response of MG-63 cells indicates that SC could serve as a useful descriptor for organizing morphological variability that may be associated with the mechanical properties of cells.
Although cytoskeletal measurements were not included in the present work, previous studies indicate that cytoskeletal remodeling is related to cell shape, polarity, and stiffness. In particular, vimentin overexpression has been reported to increase cell stiffness in epithelial cancer models [54,55], and vimentin reorganization has been associated with changes in cell polarity and morphology during epithelial to mesenchymal transition [56]. These reports suggest that SC may be a relevant descriptor for studies that aim to jointly examine morphology, mechanics, and cytoskeletal organization. However, it remains to be determined whether the relationship between SC and stiffness observed in MG-63 cells is also present in other cancerous and non-cancerous cell lines. In addition, it would be valuable to evaluate the SC descriptor using complementary experiments such as immunofluorescence staining and cytoskeletal perturbations, including pharmacological modulation of actin and microtubules.
In the viscosity-related parameters, there was no clear relationship with any of the metrics used to quantify cell morphology, unlike those measuring elasticity or rigidity. The absence of statistical significance in viscosity-related parameters is likely due to the limited sample size (24 cells). These preliminary trends should therefore be interpreted cautiously, and future studies with larger cohorts and additional cell models will be necessary to determine whether consistent patterns in viscous behavior can be established.
5.3. Influence of Loading Rate on Mechanical Properties
5.3.1. Elastic Parameters
Another widely recognized factor in determining cell mechanical properties is the loading rate [43,57,58,59]. Although most studies have used a single model to analyze this effect, the current work presents a comparative analysis using the Sneddon model and two viscoelastic models (FK and FZ), revealing distinct behaviors in the elastic parameters as the loading rate increases. First, the elastic modulus in the Sneddon model increased slightly, but the change was not statistically significant. Secondly, for the FK model, the parameter remained nearly constant. In contrast, the FZ model showed that increased significantly, whereas remained nearly constant, with a slight downward trend. This discrepancy, rather than being a contradiction, reflects the response of cellular components, as explained below.
The Sneddon and FK models exhibited no statistically significant changes in the elastic parameters when the loading rate increased from 3 to 12 m/s. These findings align with those of Garcia et al. [57], who reported that at low modulation frequencies (0.2–4.0 Hz), corresponding to loading rates between 0 and 20 m/s, the elastic modulus remains unchanged. However, Figure 15 shows that a higher loading rate resulted in a reduced indentation depth for the same applied force, indicating a cellular response to the increased rate. This aligns with Weber et al. [58], who attributed this behavior to strain stiffening caused by the higher loading rate. Consequently, Young’s modulus and the elastic parameter of the FK model failed to fully capture the cellular response to this increase.
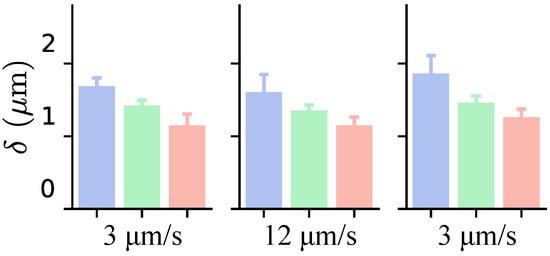
Figure 15.
Median values of maximum indentation depth for each cell group identified in Figure 5, across three indentations. Loading rates for each indentation are indicated at the bottom of the graph. Each color corresponds to a different cluster to which the cell belongs.
In contrast, the FZ model provided deeper insights. The parameter increased significantly, while remained constant or decreased slightly as the loading rate increased. This behavior suggests a link between and cytoskeletal component deformation. While it is challenging to attribute to a specific cellular component, vimentin likely plays a significant role, as it exhibits strain stiffening [60,61], given that reduced deformation corresponds to lower stiffness. However, further experiments are needed to elucidate the contributions of various cellular components.
Unlike , the parameter increased significantly. Furthermore, this change depended on the cell’s shape. This indicates that the cell’s response to faster deformation depends on the conformation of its internal components and suggests that captures the stiffening of a viscoelastic material at higher strain rates. This finding supports the notion that is related to the deformation capacity of cells proposed in a previous work [20], because when a viscoelastic material slowly deforms, its internal structure has time to reorganize, flow, or relax in response to the applied force. In contrast, at higher strain rates, the material lacks sufficient time to adjust, leading to increased resistance to deformation. This manifests in cells as a lower indentation depth for the same applied load. This behavior suggests that MG-63 cells become less deformable as loading rates increase, with the third group being the least deformable.
In this sense, the FZ model successfully captures both the cell’s stiffness, arising from the deformation of its internal elements, and the strain stiffening induced within these elements by an elevated loading rate. These explain why changes in E were not significant: the increase in stiffness from the higher loading rate was offset by the reduction in stiffness from the decreased deformation, yielding negligible changes in Young’s modulus. Furthermore, the results suggest that the parameter is associated with the information captured by the parameter .
These findings highlight the importance of selecting an appropriate model. While simplicity with few free parameters is desirable, an accurate representation of system behavior is essential. In this context, the FZ model provides a more reliable representation of cellular responses.
5.3.2. Viscous Parameters
The parameters associated with viscosity undergo abrupt changes as loading rates increase. The parameter decreases significantly, indicating a more solid-like behavior. This parameter may characterize the cellular resistance to deformation, analogous to the role of in the FZ model. Thus, likely reflects the stiffening response induced by changes in deformation rate, a phenomenon described by in the FZ model.
In contrast, the relaxation time of the FZ model decreases significantly, indicating more fluid-like behavior. This finding differs from the predictions based on the parameter , which suggest a decrease in cells’ ability to deform; however, given the viscoelastic nature of cells and the fact that the viscoelastic parameters strongly depend on the time scale of the mechanical perturbation [62]. It becomes imperative to consider how quickly the force or deformation was applied. This consideration motivated the evaluation of Deborah’s number, defined as the ratio of the material’s relaxation time to its deformation time, [63]. Figure 16 shows an increase in Deborah’s number, indicating that the material behaves more like a solid under faster loading conditions, as indicated by the parameters and .
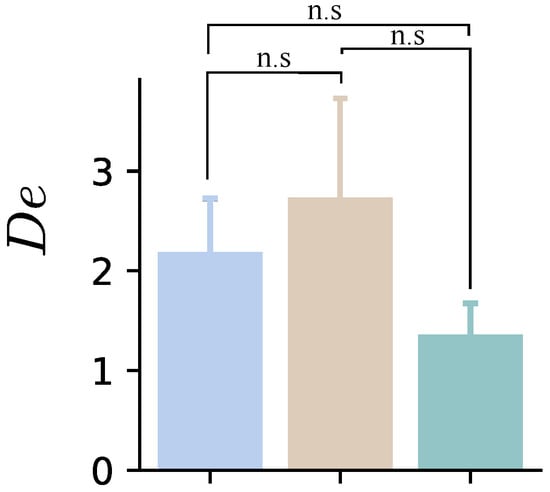
Figure 16.
Mean values of the Deborah number obtained from the entire set of cells for the three indentations performed at loading rates of 3 m/s (blue), 12 m/s (beige), and 3 m/s (green). n.s. indicates non-significant differences ().
As mentioned earlier, there is no clear relationship between cell shape and the parameters associated with cell viscosity. However, an important observation is that the differences between groups are minimal in the first indentation but disappear entirely by the third indentation. Weber et al. [43] demonstrated that, under fixed loading rates and fixed forces, relaxation curves can follow the same path. This suggests that the changes observed in our study are primarily driven by the second indentation performed at a loading rate of 12 m/s. This highlights the importance of accounting for loading rates when characterizing cells’ mechanical properties. Moreover, analyzing the relaxation behavior of cells subjected to successive indentations at varying loading rates could provide insights into their recovery capacity. This approach may serve as a methodology for evaluating internal cell damage induced by different treatments.
6. Conclusions
The instrumentation employed in this study demonstrated versatility and cost-effectiveness. The coupling of both microscopes enabled simultaneous evaluation of cellular mechanical and morphological properties, achieving optimal results without the need for more expensive equipment. The SC descriptor proved to be an effective tool for quantifying cell-shape complexity in the MG-63 osteosarcoma model. Its quantitative nature provides a reliable method for describing irregular geometries and complements conventional morphometric descriptors when characterizing the morphological variability observed in this cell line. While SC is a promising morphology cell descriptor, this study remains preliminary and exploratory. A broader applicability and biological relevance should be assessed in future studies by extending the analysis to additional cancer and non-cancer cell lines and experimental conditions. Furthermore, the aspect ratio should be used with caution, as it does not adequately represent the geometry of irregular cell shapes, such as polygonal ones.
The analysis of mechanical properties revealed a correlation between cell morphology and stiffness. MG-63 cells with complex, lobed shapes exhibited greater stiffness, indicating that polygonal cells are mechanically more rigid compared with circular ones. Increasing the loading rate from 3 to 12 m/s increases cell stiffness, as evidenced by reduced deformation under the same applied force. The parameters and from the FZ model effectively capture this relationship, reflecting the combined effect of stiffness and deformation capacity. In contrast, Young’s modulus did not show significant changes in stiffness due to compensatory effects between increased stiffness and decreased deformation. On the other hand, the FK model captures this behavior through the parameter , reflecting a more solid-like material.
The FZ model provided a more detailed and accurate description of the cell response to the two applied loading rates compared to the FK model. Nevertheless, further experiments across a broader range of cell lines are necessary to fully understand the cell’s physical properties, identify potential descriptors, and determine the most critical parameters for optimizing measurement outcomes.
Author Contributions
Conceptualization, J.L.M. and M.R.-N.; Data curation, G.V.-C., D.F.Z.-G., G.C.D.-G. and M.R.-N.; Funding acquisition, J.G.A.-C. and J.L.M.; Investigation, G.V.-C., A.F.-M., M.R.-N. and G.C.D.-G.; Methodology, D.F.Z.-G., D.G.Z.-T., C.R.-P., M.A.B., J.L.M., J.G.A.-C. and M.R.-N.; Resources, D.G.Z.-T., C.R.-P., J.L.M., M.R.-N. and J.G.A.-C.; Software, G.V.-C., D.F.Z.-G. and M.R.-N.; Supervision, J.L.M. and M.R.-N.; Validation, D.F.Z.-G., J.L.M. and M.R.-N.; Visualization, D.F.Z.-G., G.C.D.-G. and M.A.B.; Writing—original draft, G.V.-C., D.F.Z.-G., D.G.Z.-T., C.R.-P., M.A.B., J.L.M., J.G.A.-C. and M.R.-N.; Writing—review and editing, G.V.-C., D.F.Z.-G., G.C.D.-G., J.G.A.-C. and M.R.-N. All authors have read and agreed to the published version of the manuscript.
Funding
This work was supported by the Science, Humanities, Technology, and Innovation (SECIHTI) program through project CF-2023-I-1865.
Institutional Review Board Statement
Ethical review and approval are waived for this study. The MG-63 human osteosarcoma cell line was obtained from ATCC (Manassas, VA, USA; CRL-1427). The study did not involve human participants or animal experiments.
Informed Consent Statement
No formal written consent was required for this study.
Data Availability Statement
Dataset and code available on request from the authors.
Conflicts of Interest
The authors declare no conflicts of interest.
References
- Lai, J.; Li, X.; Liu, W.; Liufu, Q.; Zhong, C. Global, regional, and national burden and trends analysis of malignant neoplasm of bone and articular cartilage from 1990 to 2021: A systematic analysis for the Global Burden of Disease Study 2021. Bone 2024, 188, 117212. [Google Scholar] [CrossRef]
- Liu, P.; Lv, H.; Li, Y.; Liu, Z.; Yang, X.; Hu, H. Global bone cancer incidence and death rate analysis at 40 years. Discov. Oncol. 2025, 16, 1087. [Google Scholar] [CrossRef] [PubMed]
- Kaatsch, P.; Strothotte, J.; Becker, C.; Bielack, S.; Dirksen, U.; Blettner, M. Pediatric bone tumors in Germany from 1987 to 2011: Incidence rates, time trends and survival. Acta Oncol. 2016, 55, 1145–1151. [Google Scholar] [CrossRef]
- Yu, H.; Lim, K.; Xiong, S.; Tan, L.; Shim, W. Functional morphometric analysis in cellular behaviors: Shape and size matter. Adv. Healthc. Mater. 2013, 2, 1188–1197. [Google Scholar] [CrossRef]
- Alizadeh, E.; Lyons, S.; Castle, J.; Foss, J.; Prasad, A. Is Shape of Cancer Cell Correlated with its Invasiveness? Biophys. J. 2017, 112, 124a–125a. [Google Scholar] [CrossRef]
- Lyons, S.; Alizadeh, E.; Manheimer, J.; Schuamberg, K.; Castle, J.; Schroder, B.; Turk, P.; Thamm, D.; Prasad, A. Changes in cell shape are correlated with metastatic potential in murine and human osteosarcomas. Biol. Open 2016, 5, 289–299. [Google Scholar] [CrossRef] [PubMed]
- Alizadeh, E.; Castle, J.; Taylor, C.; Xu, W.; Prasad, D. Cellular morphological features are predictive markers of cancer cell state. Comput. Biol. Med. 2020, 126, 104044. [Google Scholar] [CrossRef]
- Prasad, A.; Alizadeh, E. Cell Form and Function: Interpreting and Controlling the Shape of Adherent Cells. Trends Biotechno 2019, 37, 347–357. [Google Scholar] [CrossRef]
- Ingber, D. How cells (might) sense microgravity. FASEB J. 1999, 13, S3–S15. [Google Scholar] [CrossRef]
- D’Anselmi, F.; Valerio, M.; Cucina, A.; Galli, L.; Proietti, S.; Proietti, S.; Dinicola, S.; Pascualato, A.; Manetti, C.; Ricci, G.; et al. Metabolism and cell shape in cancer: A fractal analysis. Int. J. Biochem. Cell Biol. 2011, 43, 1052–1058. [Google Scholar] [CrossRef]
- So, C.L.; Robitaille, M.; Sadras, F.; McCullough, M.H.; Milevskiy, M.J.; Goodhill, G.J.; Roberts-Thomson, S.J.; Monteith, G.R. Cellular geometry and epithelial-mesenchymal plasticity intersect with PIEZO1 in breast cancer cells. Commun. Biol. 2024, 7, 467. [Google Scholar] [CrossRef]
- Sánchez-Corrales, Y.E.; Hartley, M.; Van Rooij, J.; Marée, A.F.; Grieneisen, V.A. Morphometrics of complex cell shapes: Lobe contribution elliptic Fourier analysis (LOCO-EFA). Adv. Healthc. Mater. 2018, 145, dev156778. [Google Scholar] [CrossRef] [PubMed]
- Alberts, B.; Johnson, A.; Lewis, J.; Morgan, D.; Raff, M.; Roberts, K.; Walter, P. Molecular Biology of the Cell; Garland Science: New York, NY, USA, 2002. [Google Scholar]
- Garcia, D.; Garcia, R. Determination of the viscoelastic properties of a single cell cultured on a rigid support by force microscopy. Nanoscale 2018, 10, 19799–19809. [Google Scholar] [CrossRef]
- Lekka, M.; Laidler, P.; Gil, D.; Lekki, J.; Stachura, Z.; Hrynkiewicz, A. Elasticity of normal and cancerous human bladder cells studied by scanning force microscopy. Eur. Biophys. J. 1999, 28, 312–316. [Google Scholar] [CrossRef] [PubMed]
- Schillers, H.; Rianna, C.; Schäpe, J.; Luque, T.; Doschke, H.; Wälte, M.; Uriarte, J.J.; Campillo, N.; Michanetzis, G.P.; Bobrowska, J.; et al. Standardized nanomechanical atomic force microscopy procedure (SNAP) for measuring soft and biological samples. Sci. Rep. 2017, 7, 5117. [Google Scholar] [CrossRef] [PubMed]
- Rodríguez-Nieto, M.; Mendoza-Flores, P.; García-Ortiz, D.; Montes-de Oca, L.M.; Mendoza-Villa, M.; Barrón-González, P.; Espinosa, G.; Menchaca, J.L. Viscoelastic properties of doxorubicin-treated HT-29 cancer cells by atomic force microscopy: The fractional Zener model as an optimal viscoelastic model for cells. Biomech. Model. Mechanobiol. 2020, 19, 801–813. [Google Scholar] [CrossRef]
- Weber, A.; Benitez, R.; Toca-Herrera, J.L. Measuring biological materials mechanics with atomic force microscopy-Determination of viscoelastic cell properties from stress relaxation experiments. Microsc. Res. Tech. 2022, 85, 3284–3295. [Google Scholar] [CrossRef]
- Schiessel, H.; Metzler, R.; Blumen, A.; Nonnenmacher, T. Generalized viscoelastic models: Their fractional equations with solutions. J. Phys. A 1995, 28, 6567. [Google Scholar] [CrossRef]
- Ovalle-Flores, L.; Rodríguez-Nieto, M.; Zárate-Triviño, D.; Rodríguez-Padilla, C.; Menchaca, J.L. Methodologies and models for measuring viscoelastic properties of cancer cells: Towards a universal classification. J. Mech. Behav. Biomed. Mater. 2023, 140, 105734. [Google Scholar] [CrossRef]
- Duque-Gimenez, G.C.; Zambrano-Gutierrez, D.F.; Rodriguez-Nieto, M.; Menchaca, J.L.; Cruz-Duarte, J.M.; Zárate-Triviño, D.G.; Avina-Cervantes, J.G.; Ortiz-Bayliss, J.C. Viscoelastic characterization of the human osteosarcoma cancer cell line MG-63 using a fractional-order Zener model through automated algorithm design and configuration. Sci. Rep. 2025, 15, 31436. [Google Scholar] [CrossRef]
- Dufrêne, Y.F. Towards nanomicrobiology using atomic force microscopy. Nat. Rev. Microbiol. 2008, 6, 674–680. [Google Scholar] [CrossRef]
- Eaton, P.; West, P. Atomic Force Microscopy; Oxford University Press: Oxford, UK, 2010. [Google Scholar]
- Krieg, M.; Fläschner, G.; Alsteens, D.; Gaub, B.M.; Roos, W.H.; Wuite, G.J.L.; Gaub, H.E.; Gerber, C.; Dufrêne, Y.F.; Müller, D.J. Atomic force microscopy-based mechanobiology. Nat. Rev. Phys. 2019, 1, 41–57. [Google Scholar] [CrossRef]
- Magazzù, A.; Marcuello, C. Investigation of Soft Matter Nanomechanics by Atomic Force Microscopy and Optical Tweezers: A Comprehensive Review. Nanomaterials 2023, 13, 963. [Google Scholar] [CrossRef] [PubMed]
- Young, K.M.; Xu, C.; Ahkee, K.; Mezencev, R.; Swingle, S.P.; Yu, T.; Paikeday, A.; Kim, C.; McDonald, J.F.; Qiu, P.; et al. Correlating mechanical and gene expression data on the single cell level to investigate metastatic phenotypes. iScience 2023, 26, 106393. [Google Scholar] [CrossRef]
- Sun, B.; Fang, Y.; Li, Z.; Chen, Z.; Xiang, J. Role of cellular cytoskeleton in epithelial-mesenchymal transition process during cancer progression. Biomed. Rep. 2015, 3, 603–610. [Google Scholar] [CrossRef]
- Clark, A.; Paluch, E. Mechanics and Regulation of Cell Shape During the Cell Cycle. Results Probl. Cell Differ. 2011, 53, 31–73. [Google Scholar] [CrossRef]
- Lovegrove, H.; Hulmes, G.; Ghadaouia, S.; Revell, C.; Giralt-Pujol, M.; Alhashem, Z.; Pena, A.; Nogare, D.; Appleton, E.; Costa, G.; et al. Interphase cell morphology defines the mode, symmetry, and outcome of mitosis. Science 2025, 388, eadu9628. [Google Scholar] [CrossRef] [PubMed]
- Povea-Cabello, S.; Oropesa-Ávila, M.; Cruz-Ojeda, P.; Villanueva, M.; de la Mata, M.; Suárez-Rivero, J.; Álvarez Códoba, M.; Villalon, I.; Cotán, D.; Ybot-Gonzalez, P.; et al. Dynamic Reorganization of the Cytoskeleton during Apoptosis: The Two Coffins Hypothesis. Int. J. Mol. Sci. 2017, 18, 2393. [Google Scholar] [CrossRef]
- Kruyer, A.; Dixon, D.; Angelis, A.; Amato, D.; Kalivas, P.W. Astrocytes in the ventral pallidum extinguish heroin seeking through GAT-3 upregulation and morphological plasticity at D1-MSN terminals. Mol. Psychiatry 2021, 27, 855–864. [Google Scholar] [CrossRef]
- Seal, S.; Yang, H.; Vollmers, L.; Bender, A. Comparison of Cellular Morphological Descriptors and Molecular Fingerprints for the Prediction of Cytotoxicity- and Proliferation-Related Assays. Chem. Res. Toxicol. 2021, 34, 422–437. [Google Scholar] [CrossRef] [PubMed]
- Pincus, Z.; Theriot, J. Comparison of quantitative methods for cell-shape analysis. J. Microsc 2007, 227, 140–156. [Google Scholar] [CrossRef] [PubMed]
- Caple, J.; Byrd, J.; Stephan, C.N. Elliptical Fourier analysis: Fundamentals, applications, and value for forensic anthropology. Int. J. Leg. Med. 2017, 131, 1675–1690. [Google Scholar] [CrossRef]
- Haines, A.J.; Crampton, J.S. Improvements to the method of Fourier shape analysis as applied in morphometric studies. Palaeontology 2000, 43, 765–783. [Google Scholar] [CrossRef]
- Peng, X.; Zhao, L.; Huang, Q.; Kong, L.; Wang, G.; Ye, Z. Single cell mechanics analyzed by atomic force microscopy and finite element simulation. Phys. Scr. 2024, 99, 045510. [Google Scholar] [CrossRef]
- Takahashi, R.; Okajima, T. Comparison between power-law rheological parameters of living cells in frequency and time domains measured by atomic force microscopy. Jpn. J. Appl. Phys. 2016, 55, 08NB22. [Google Scholar] [CrossRef]
- Nolan, D.; Lally, C. Coupled finite element–agent-based models for the simulation of vascular growth and remodeling. In Numerical Methods and Advanced Simulation in Biomechanics and Biological Processes; Elsevier: Amsterdam, The Netherlands, 2018; pp. 283–300. [Google Scholar] [CrossRef]
- Hubrich, H.; Mey, I.P.; Bruckner, B.R.; Muhlenbrock, P.; Nehls, S.; Grabenhorst, L.; Oswald, T.; Steinem, C.; Janshoff, A. Viscoelasticity of native and artificial actin cortices assessed by nanoindentation experiments. Nano Lett. 2020, 20, 6329–6335. [Google Scholar] [CrossRef]
- Radmacher, M.; Fritz, M.; Kacher, C.M.; Cleveland, J.P.; Hansma, P.K. Measuring the viscoelastic properties of human platelets with the atomic force microscope. Biophys. J. 1996, 70, 556–567. [Google Scholar] [CrossRef]
- Darling, E.M.; Zauscher, S.; Guilak, F. Viscoelastic properties of zonal articular chondrocytes measured by atomic force microscopy. Osteoarthr. Cartil. 2006, 14, 571–579. [Google Scholar] [CrossRef]
- Efremov, Y.M.; Kotova, S.; Timashev, P. Viscoelasticity in simple indentation-cycle experiments: A computational study. Sci. Rep. 2020, 10, 13302. [Google Scholar] [CrossRef]
- Weber, A.; Iturri, J.; Benitez, R.; Toca-Herrera, J.L. Measuring biomaterials mechanics with atomic force microscopy. 1. Influence of the loading rate and applied force (pyramidal tips). Microsc. Res. Tech. 2019, 82, 1392–1400. [Google Scholar] [CrossRef]
- Collins, J.; Knapper, J.; Stirling, J.; Mduda, J.; Mkindi, C.; Mayagaya, V.; Mwakajinga, G.A.; Nyakyi, P.T.; Sanga, V.L.; Carbery, D.; et al. Robotic microscopy for everyone: The OpenFlexure microscope. Biomed. Opt. Express 2011, 11, 2447–2460. [Google Scholar] [CrossRef] [PubMed]
- Rico, F.; Roca-Cusachs, P.; Gavara, N.; Farré, R.; Rotger, M.; Navajas, D. Probing mechanical properties of living cells by atomic force microscopy with blunted pyramidal cantilever tips. Phys. Rev. E 2005, 72, 021914. [Google Scholar] [CrossRef] [PubMed]
- Lima, I.; Silva, A.; Sousa, F.; Ferreira, W.; Freire, R.; de Oliveira, C.; de Sousa, J. Measuring the viscoelastic relaxation function of cells with a time-dependent interpretation of the Hertz-Sneddon indentation model. Heliyon 2024, 10, e30623. [Google Scholar] [CrossRef] [PubMed]
- Singh, S.B.; Rajput, S.S.; Patil, S.; Subramanyam, D. Protocol for measuring mechanical properties of live cells using atomic force microscopy. STAR Protoc. 2024, 5, 102870. [Google Scholar] [CrossRef]
- Schindelin, J.; Arganda-Carreras, I.; Frise, E.; Kaynig, V.; Longair, M.; Pietzsch, T.; Preibisch, S.; Rueden, C.; Saalfeld, S.; Schmid, B. Fiji: An open-source platform for biological-image analysis. Nat. Methods 2012, 9, 676–682. [Google Scholar] [CrossRef]
- Virtanen, P.; Gommers, R.; Oliphant, T.E.; Haberland, M.; Reddy, T.; Cournapeau, D.; Burovski, E.; Peterson, P.; Weckesser, W.; Bright, J.; et al. SciPy 1.0: Fundamental algorithms for scientific computing in Python. Nat. Methods 2020, 17, 261–272. [Google Scholar] [CrossRef]
- Guo, G.; Wang, H.; Bell, D.; Bi, Y.; Greer, K. KNN model-based approach in classification. In Proceedings of the OTM Confederated International Conferences “On the Move to Meaningful Internet Systems”, Sicily, Italy, 3–7 November 2003; Springer: Berlin/Heidelberg, Germany, 2003; pp. 986–996. [Google Scholar]
- Kalluri, R.; Weinberg, R.A. The basics of epithelial-mesenchymal transition. J. Clin. Investig. 2009, 119, 1420–1428. [Google Scholar] [CrossRef]
- Guo, M.; Ehrlicher, A.J.; Mahammad, S.; Fabich, H.; Jensen, M.H.; Moore, J.R.; Fredberg, J.J.; Goldman, R.D.; Weitz, D.A. The role of vimentin intermediate filaments in cortical and cytoplasmic mechanics. Biophys. J. 2013, 105, 1562–1568. [Google Scholar] [CrossRef]
- Mendez, M.; Restle, D.; Janmey, P. Vimentin enhances cell elastic behavior and protects against compressive stress. Biophys. J. 2014, 107, 314–323. [Google Scholar] [CrossRef]
- Liu, C.Y.; Lin, H.H.; Tang, M.J.; Wang, Y.K. Vimentin contributes to epithelial-mesenchymal transition cancer cell mechanics by mediating cytoskeletal organization and focal adhesion maturation. Oncotarget 2015, 6, 15966. [Google Scholar] [CrossRef]
- Sivagurunathan, S.; Vahabikashi, A.; Yang, H.; Zhang, J.; Vazquez, K.; Rajasundaram, D.; Politanska, Y.; Abdala-Valencia, H.; Notbohm, J.; Guo, M.; et al. Expression of vimentin alters cell mechanics, cell-cell adhesion, and gene expression profiles suggesting the induction of a hybrid EMT in human mammary epithelial cells. Front. Cell Dev. Biol. 2022, 10, 929495. [Google Scholar] [CrossRef] [PubMed]
- Mendez, M.G.; Kojima, S.I.; Goldman, R.D. Vimentin induces changes in cell shape, motility, and adhesion during the epithelial to mesenchymal transition. FASEB J. 2010, 24, 1838. [Google Scholar] [CrossRef]
- Garcia, P.D.; Guerrero, C.R.; Garcia, R. Time-resolved nanomechanics of a single cell under the depolymerization of the cytoskeleton. Nanoscale 2017, 9, 12051–12059. [Google Scholar] [CrossRef] [PubMed]
- Weber, A.; Zbiral, B.; Iturri, J.; Benitez, R.; Toca-Herrera, J.L. Measuring (biological) materials mechanics with atomic force microscopy. 2. Influence of the loading rate and applied force (colloidal particles). Microsc. Res. Tech. 2021, 84, 1078–1088. [Google Scholar] [CrossRef]
- Bernick, K.B.; Prevost, T.P.; Suresh, S.; Socrate, S. Biomechanics of single cortical neurons. Acta Biomater. 2011, 7, 1210–1219. [Google Scholar] [CrossRef] [PubMed]
- Patteson, A.E.; Carroll, R.J.; Iwamoto, D.V.; Janmey, P.A. The vimentin cytoskeleton: When polymer physics meets cell biology. Phys. Biol. 2020, 18, 011001. [Google Scholar] [CrossRef]
- Rölleke, U.; Kumari, P.; Meyer, R.; Köster, S. The unique biomechanics of intermediate filaments–From single filaments to cells and tissues. Curr. Opin. Cell Biol. 2023, 85, 102263. [Google Scholar] [CrossRef]
- Mathieu, S.; Manneville, J.B. Intracellular mechanics: Connecting rheology and mechanotransduction. Curr. Opin. Cell Biol. 2019, 56, 34–44. [Google Scholar] [CrossRef]
- Larson, R.G. The Structure and Rheology of Complex Fluids; Oxford University Press: New York, NY, USA, 1999. [Google Scholar]
Disclaimer/Publisher’s Note: The statements, opinions and data contained in all publications are solely those of the individual author(s) and contributor(s) and not of MDPI and/or the editor(s). MDPI and/or the editor(s) disclaim responsibility for any injury to people or property resulting from any ideas, methods, instructions or products referred to in the content. |
© 2026 by the authors. Licensee MDPI, Basel, Switzerland. This article is an open access article distributed under the terms and conditions of the Creative Commons Attribution (CC BY) license.