Abstract
Plasmonic nanohole arrays (NAs) integrating Au and hydrogen-responsive Mg enable dynamic spectral tuning via the Mg → MgH2 transition. Using finite-difference time-domain (FDTD) numerical simulations, we systematically investigate how layer sequence, Au/Mg ratio, total thickness, and stacking number govern extraordinary optical transmission (EOT) resonances. Mg–Au–Mg architectures exhibit the strongest hydrogen response, delivering resonance shifts up to 275 nm and FoM > 1, owing to direct plasmon–hydride coupling at surface Mg layers. Varying the Au/Mg ratio reveals a trade-off: Mg-rich stacks maximize spectral tunability but suffer from broadened, unstable resonances, while Au-rich stacks sustain sharp modes with limited sensitivity; optimal performance arises at intermediate compositions. Thickness dependence shows that ultrathin films (<50 nm) achieve giant shifts (>600 nm) with high contrast, whereas thicker multilayers lose responsiveness. Finally, stacking analysis uncovers an odd–even effect, with Mg-terminated arrays providing larger shifts than Au-terminated ones. These results establish design rules for hydrogen plasmonic sensors, emphasizing resonance engineering through rational layer ordering and composition control.
1. Introduction
Hydrogen is increasingly regarded as a cornerstone of future sustainable energy infrastructures owing to its high gravimetric energy density and carbon-free combustion products [1]. However, the widespread adoption of hydrogen technologies requires reliable monitoring systems, as hydrogen is colorless, odorless, and highly flammable even at low concentrations [2]. For safety-critical and industrial applications, sensors must therefore combine high sensitivity, fast dynamic response, stability across variable environments, and scalability for integration into practical devices. Despite significant progress, conventional semiconductor- and electrochemical-based hydrogen sensors often fall short in one or more of these aspects [3,4], motivating the search for alternative approaches that exploit fundamentally different transduction mechanisms.
In recent years, plasmon-mediated hydrogen detection has attracted growing attention as a promising optical route, offering label-free detection, remote readout, and compatibility with miniaturized photonic platforms. A variety of plasmonic strategies—including nanodisks, nanostripes, core–shell nanoparticles, and chiral metasurfaces—have been explored to transduce hydrogen-induced optical property changes into measurable plasmonic resonance shifts or intensity modulations. Comprehensive reviews have summarized progress in this rapidly growing field [5,6,7], encompassing both localized and propagating surface plasmon systems. Compared with these designs, nanohole arrays (NAs) stand out because their extraordinary optical transmission (EOT) resonances are sharp, tunable, and highly sensitive to dielectric perturbations, making them ideal for refractive index and gas-sensing applications [8,9]. Beyond plasmonic transduction, other optical hydrogen sensing phenomena such as gasochromic effects—where hydrogen absorption triggers color or transparency changes in transition-metal oxides [10]—have also demonstrated high sensitivity and stability. While gasochromic sensors provide visually interpretable signals and straightforward architectures, plasmonic sensors offer faster response times, enhanced design flexibility, and compatibility with nanophotonic integration. A comprehensive understanding of how these optical transduction mechanisms compare and complement each other is essential for advancing next-generation hydrogen sensing technologies.
Metals such as palladium and magnesium undergo hydrogenation-driven changes in optical constants [11], thereby enabling direct optical transduction of hydrogen absorption. Magnesium is especially attractive in this context, as its hydrogenation induces a large, reversible modulation in dielectric function while offering lightweight and earth-abundant properties [12,13]. When integrated with gold, which contributes both plasmonic robustness and fabrication reproducibility, hybrid nanostructures can, in principle, deliver strong optical signatures of hydrogen uptake with improved stability and design flexibility [14,15,16,17]. However, the parameter space that governs the sensing characteristics of such systems—including relative thickness ratios, stacking order, and the number of layers—remains insufficiently mapped. In particular, while multilayer plasmonic NAs offer opportunities for tailored optical responses and improved sensing figures of merit, the interplay between structural configuration and sensing performance is not yet well understood.
Here, we provide a comprehensive computational investigation of Au–Mg–Au and Mg–Au–Mg three-layer NAs, systematically analyzing how the Au/Mg ratio, total multilayer thickness, and number of layers govern resonance wavelength shifts, linewidth evolution, figure of merit, and transmission modulation upon hydrogen exposure. Compared with previous systems, the Au/Mg nanohole arrays developed here directly integrate the plasmonic robustness of Au with large-index modulation of Mg/MgH2, enabling ultralarge, reversible resonance shifts while maintaining narrow spectral features. This synergistic behavior addresses the long-standing trade-off between sensitivity and stability in optical hydrogen sensing. By disentangling the interplay between plasmonic confinement and hydrogenation-induced dielectric transitions, this work establishes clear design principles for optimizing sensitivity and stability in hydrogen plasmonic sensors, thereby advancing the rational engineering of multifunctional nanophotonic architectures.
2. Materials and Methods
FDTD calculation: Numerical simulations were carried out using the commercial finite-difference time-domain software (FDTD Solutions, Version: 8.24.2502, Lumerical, Vancouver, BC, Canada) to obtain both optical transmission spectra and spatial distributions of the near-field electric intensity in the nanohole arrays (NAs). Specifically, the nanoholes were modeled as circular apertures with diameters of 200 nm on a hexagonal lattice of 500 nm periodicity. To emulate an infinite lattice, a single unit cell containing one central nanohole and four quarter holes at the boundaries was constructed. The simulation unit cell dimensions were set to 500 × 866 × 1400 nm3, with periodic boundary conditions in the x-y plane and perfectly matched layers (PML) along z. A non-uniform mesh with mesh accuracy of 4 and mesh refinement of conformal variant 1 was employed. All transmission spectra were obtained under normal incidence of a linearly polarized plane wave, with the electric field polarized along one of the principal lattice vectors (x-axis) of the hexagonal nanohole array (Figure S1a). The EOT response was verified to be nearly polarization-independent, and the simulations with different polarizations yielded resonance shifts within 1 nm (Figure S1b). Therefore, single-polarization excitation was adopted for all reported spectra. Frequency-domain monitors were placed to extract transmission spectra and field intensity maps at selected resonant wavelengths.
The simulations employed bulk, frequency-dependent dielectric functions for all materials. The wavelength-dependent optical constants of Au were taken from Palik’s Handbook of Optical Constants of Solids (Academic Press, 1985) [18]; those of metallic Mg and MgH2 were adopted from Palm et.al.’s paper [11]. All datasets were implemented as tabulated n and k spectra without adjustment. To emulate hydrogen exposure, the dielectric function of Mg was replaced by that of its hydride phase (MgH2) according to Ref. [11]. The simulations thus represent the steady-state optical response of the material before and after complete hydrogenation. No kinetic or diffusion processes were included, as the focus is on equilibrium optical properties rather than transient hydrogen absorption dynamics. No significant interference from non-reducing gases (such as N2, Ar, or O2) is expected, as the observed optical modulation originates solely from the specific Mg → MgH2 phase transformation. While we note that ultrathin films may exhibit slightly weaker modulation than bulk material owing to scattering and surface oxidation, the use of bulk data provides a well-validated upper bound for the dielectric contrast and is adequate for the comparative design analysis performed here.
3. Results
3.1. Fundamental Optical Response of Three-Layer NAs
The schematic in Figure 1a illustrates the three-layer NA architectures examined in this study. The nanostructured arrays (NAs) consist of a 100 nm-thick metal trilayer patterned with circular holes (200 nm diameter, 500 nm pitch) arranged in a hexagonal lattice on a glass substrate. The nanohole geometry supports EOT, arising from resonant coupling of incident light to surface plasmon polaritons (SPPs) at metal–dielectric interfaces and to localized modes within the nanoholes [19]. These resonances are strongly influenced by changes in both the external dielectric environment and the intrinsic optical properties of the constituent layers, providing an effective platform for hydrogen sensing. The geometric parameters were determined using plasmonic dispersion analysis, empirical EOT design rules, and practical considerations of colloidal-lithography fabrication. For a hexagonal lattice, the in-plane reciprocal vector of the first-order (1, 0) Bragg mode is . Substituting the optical constants of Au, Mg, and the substrate into yields an EOT resonance around 680–730 nm for p = 500 nm, allowing operation within the visible to NIR range using cost-effective Si or InGaAs sources and detectors while keeping Pd absorption moderate. The hole-to-pitch ratio was set to d/p = 0.40, following reported EOT scaling trends [20]: transmission increases approximately as (d/p)4 up to ~0.5, linewidth broadens beyond this limit, and film stability declines when d/p < 0.3 due to lattice strain during hydriding. A 200 nm hole diameter, therefore, provides an optimal balance between transmission strength, spectral sharpness, and mechanical robustness, and is conveniently achieved by oxygen-plasma shrinking of 500 nm polystyrene spheres used in large-area colloidal lithography [21].
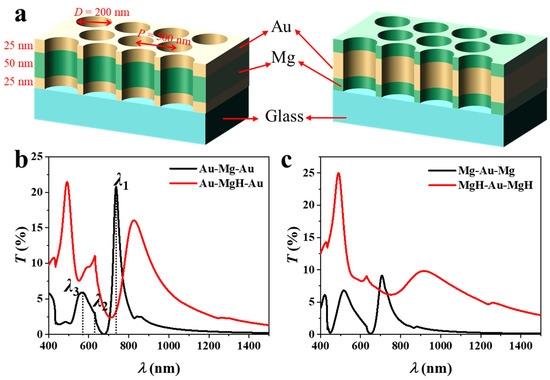
Figure 1.
(a) Schematic illustration (not to strict scale) of three-layer nanohole arrays with Au–Mg–Au (left) and Mg–Au–Mg (right) stacking, indicating layer thicknesses, hole diameter, and periodicity parameters. The transmission spectra of (b) Au–Mg–Au and (c) Mg–Au–Mg NAs before and after hydrogen exposure.
Two stacking sequences are compared: Au–Mg–Au (left) and Mg–Au–Mg (right), each comprising layers with thicknesses of 25–50–25 nm. The representative layer thicknesses fall within the experimentally accessible range and were chosen to balance plasmon confinement and transmission efficiency. Transmission spectra before and after hydrogen exposure are presented in Figure 1b (Au–Mg–Au) and Figure 1c (Mg–Au–Mg). In the Au–Mg–Au system (25–50–25 nm), three distinct resonances are observed. The first resonance (λ1) corresponds to the (1, 0) Bragg mode at the Au/glass interface; the second (λ2) is assigned to the (1, 1) Bragg mode at the same interface; and the third (λ3) arises from the (1, 0) Bragg mode at the Au/air interface [22]. Modes λ2 and λ3 typically overlap, yielding a broadened spectral feature. To quantitatively verify the dispersion behavior, the resonance wavelength was fitted using the SPP dispersion relation [23]:
where and are the wavelength-dependent dielectric functions of the metal and dielectric, respectively. The fitted λ values reproduce the simulated spectral peaks with deviations below 2–3%, confirming the quantitative consistency of the obtained EOT resonances with the SPP dispersion model. Upon hydrogenation of the Mg layer, the dielectric constant changes markedly due to the formation of MgH2, resulting in a spectral redshift of Δλ1 = 88 nm. The resonance linewidth increases to 152 nm (FWHM), producing a moderate figure of merit (FoM = Δλ/FWHM = 0.58). Concurrently, the peak transmission decreases slightly (ΔT1 = −5%), indicating that hydrogen absorption both redshifts and damps the plasmonic response. Note that λ1 represents the primary EOT resonance and serves as the conventional feature for sensing applications. Therefore, in the following discussion, we focus on the sensing performance associated with λ1, with Δλ1 and ΔT1 hereafter denoted simply as Δλ and ΔT.
The Mg–Au–Mg configuration exhibits a notably stronger response (Figure 1c). Here, the dominant resonance originates from hybridized SPPs supported by the central Au layer, symmetrically coupled to Mg layers on both sides. Placing Mg at the exterior interfaces enables direct modulation of the plasmonic response upon hydrogen uptake. As a result, the spectral redshift is substantially larger (Δλ1 = 208 nm) compared with the Au–Mg–Au design. Although the linewidth also broadens (FWHM = 201 nm), the FoM increases to 1.03—nearly twice that of the Au–Mg–Au structure. Remarkably, the transmission peak exhibits a modest enhancement (ΔT1 = +1%), in contrast to the damping observed in the Au–Mg–Au case. This finding suggests that Mg-rich surface configurations preserve stronger plasmonic coupling after hydrogenation. These results demonstrate that the layer sequence exerts a critical influence on the optical and sensing characteristics of multilayer NAs. Configurations with Mg as the outermost layer (Mg–Au–Mg) enable stronger electromagnetic field interaction with hydrogen-sensitive Mg, leading to larger spectral shifts, improved FoM, and favorable intensity modulation. These insights emphasize the importance of rational layer ordering in the design of plasmonic sensing architectures, where both electromagnetic mode distribution and hydrogenation-induced dielectric changes must be simultaneously optimized. Possible hydrogen-sensing mechanisms in the Au/Mg nanohole arrays can be attributed to the dielectric modulation arising from the reversible Mg → MgH2 transition. Upon hydrogen exposure, Mg acts as a hydrogen-absorbing medium, forming MgH2 with a wide bandgap and drastically different optical constants. The resulting change in the complex permittivity perturbs the coupled surface-plasmon and cavity modes, producing pronounced spectral redshifts and transmission variations. Au layers, while not forming hydrides, facilitate H-atom spill-over and preserve plasmonic coherence. The combined plasmon–hydride coupling thus defines the dominant sensing mechanism in these multilayer NAs.
It should be noted that the simulated optical responses correspond to the two limiting cases of pristine Mg and fully formed MgH2, which capture the maximum dielectric contrast responsible for the observed shifts. In realistic nanohole environments, hydrogen absorption may proceed through intermediate MgHx (0 < x < 2) states whose coexistence could yield gradual, partially reversible spectral evolution. Additionally, surface curvature and nanoscale confinement can alter hydrogenation kinetics. Although Au itself does not form a stable hydride, prior studies [10] show that hydrogen initially adsorbs on nanostructured Au and may spillover into adjacent Mg layers. Such Au-H interactions are included qualitatively in our interpretation but are expected to contribute only minor optical modulation compared with the strong dielectric transition of Mg → MgH2. In addition, the interdiffusion between Mg and Au can, in principle, occur under thermal or prolonged hydrogen exposure. However, prior studies have shown that substantial Mg–Au alloying is only observed at temperatures above approximately 150 °C, whereas the hydrogenation conditions considered here (<80 °C) are far below this threshold. Under such conditions, the diffusion length of Mg within Au is on the order of a few nanometers, negligible relative to the layer thicknesses (25–70 nm). Consequently, interfacial sharpness is preserved, and its influence on the simulated optical response and the interpreted sensing trends is minimal. Should marginal intermixing arise experimentally, it would primarily reduce the dielectric contrast at the interfaces, leading to slightly smaller resonance shifts without altering the qualitative conclusions regarding layer sequence and structural optimization.
3.2. Effect of Au/Mg Layer Ratio
The schematic in Figure 2a illustrates the Au–Mg–Au three-layer NA in which the total thickness is fixed at 100 nm, while the relative Au/Mg ratio is systematically varied by adjusting the Mg layer from 95 nm down to 5 nm. The corresponding thickness sequences are: Au:Mg:Au = 2.5:95:2.5, 5:90:5, 10:80:10, 15:70:15, 20:60:20, 25:50:25, 30:40:30, 35:30:35, 40:20:40, 45:10:45, and 47.5:5:47.5. Prior to hydrogenation (Figure 2b), the transmission spectra exhibit multiple features characteristic of EOT. As the Mg fraction decreases and Au becomes more dominant, the spectra display clear sharpening of the primary resonance accompanied by enhanced peak intensity. This behavior reflects the intrinsically lower ohmic damping and more robust plasmonic response of Au compared with Mg, which reduces resonance broadening and improves transmission contrast. Systematic variation of the Mg thickness also induces a redshift in the resonance wavelength. This evolution can be understood in terms of the effective optical environment experienced by SPPs governing EOT. Metallic Mg exhibits a smaller negative permittivity and stronger absorption than Au, contributing less effectively to collective plasmon oscillations and supporting a shorter effective plasmon wavelength. By contrast, Au possesses a higher plasma frequency and a more negative real permittivity in the visible–near-IR range, enabling stronger confinement of electromagnetic fields at the metal–dielectric interfaces. Increasing the Au fraction thus shifts the average metal permittivity toward more negative values, modifying the dispersion of the coupled plasmonic modes.
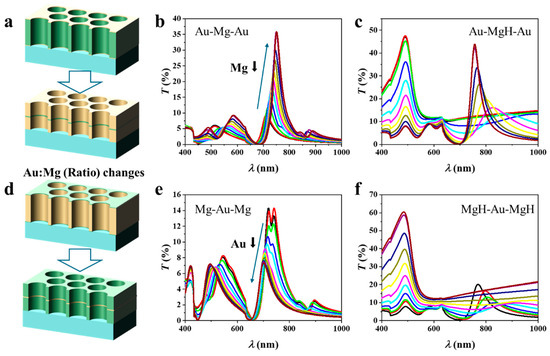
Figure 2.
Three-layer nanohole arrays with a fixed total thickness of 100 nm but varying Au/Mg ratios. (a–c) Au–Mg–Au structures with decreasing Mg thickness show characteristic EOT spectra before hydrogenation and composition-dependent redshifts after hydrogenation, strongest in Mg-rich samples. (d–f) Mg–Au–Mg structures with decreasing Au thickness similarly reveal pronounced hydrogen-induced spectral shifts in Mg-rich configurations.
According to Equation (1), a decrease in the absolute magnitude of the metallic permittivity leads to a longer resonance wavelength. Additionally, reducing the Mg thickness diminishes the contribution of the low-index metallic spacer, thereby increasing field overlap with the hole/dielectric regions. This enhanced penetration elevates the effective refractive index experienced by the plasmonic mode, further driving the resonance toward the red. The observed spectral shifts thus arise from the combined effects of metal dielectric properties and field redistribution within the NA. In addition, our calculations show that increasing the hole diameter (from 140 nm to 240 nm) leads to a predictable redshift of the EOT peak (~30–60 nm) and an increase in transmission amplitude (Figure S2a in Supporting Information (SI)). Importantly, this change does not affect the influence of the material ratio or other factors. For instance, as shown in Figure S2b in SI, the variation in transmission with the material ratio for the Au-Mg-Au arrays with a diameter of 240 nm is consistent with that observed for arrays with a diameter of 200 nm (Figure 2b).
Upon hydrogenation, the optical response follows a markedly different trend (Figure 2c). In Mg-rich samples, large spectral shifts are observed, with Δλ reaching significantly higher values than in Au-rich counterparts. These shifts are attributed to the substantial modification of Mg’s dielectric function upon its conversion to MgH2, which strongly perturbs the coupled plasmon modes. Simultaneously, the transmission intensity decreases, driven by additional absorption and scattering losses in the hydride phase. In Au-rich samples, by contrast, the redshift upon hydrogenation is diminished, but the resonances remain sharper and more stable, consistent with the dominant role of Au in sustaining plasmonic oscillations. These results highlight a clear trade-off between spectral tunability and resonance quality: Mg-rich architectures provide large hydrogen-induced shifts (high Δλ) but suffer from broadened resonances and reduced stability, whereas Au-rich architectures sustain narrower linewidths (high quality factor) but lower sensitivity. The optical response of the NAs can therefore be directly tuned by controlling the Au:Mg ratio.
The schematic in Figure 2d illustrates the Mg–Au–Mg three-layer NA with a fixed total thickness of 100 nm, in which the relative Au:Mg ratio is systematically tuned by reducing the Au thickness from 95 nm to 5 nm while correspondingly increasing the Mg thickness. Figure 2e presents the transmission spectra of the pristine (unhydrogenated) structures. A clear trend is observed: as the Au thickness decreases, the resonance intensity weakens and the resonance wavelength shifts to shorter values (blue shift). The intensity loss originates from the reduced proportion of Au, which is the primary plasmonic medium sustaining coherent SPP modes. In contrast, Mg exhibits stronger ohmic losses and an optical response less favorable for narrow, high-quality resonances, thereby suppressing EOT. The blue shift is consistent with the modification of the effective dielectric environment: as Au is replaced by Mg, the metallic permittivity (εm) becomes less negative, shifting the SPP condition according to Equation (1). Figure 2f shows the corresponding spectra after hydrogenation. A distinct response emerges due to the transformation of Mg into MgH2, which strongly modifies the effective dielectric functions. In Mg-rich samples (low Au fraction), hydrogenation induces pronounced spectral changes: resonances broaden markedly, intensities decrease further, and spectral shifts are enhanced. This behavior arises because MgH2, with its wide bandgap, behaves as a dielectric, producing strong refractive index contrast at the metal–dielectric interfaces that significantly perturbs the plasmonic modes. In Au-rich samples, by contrast, the spectra remain sharper, spectral shifts are smaller, and the resonances are more stable, underscoring the stabilizing role of Au in sustaining SPP oscillations.
Figure 3a summarizes the hydrogen-induced spectral response of the Au–Mg–Au NAs with varying Au:Mg ratios, extracted from the transmission spectra in Figure 2b,c. Four parameters were evaluated: the resonance shift (Δλ), full width at half maximum (FWHM), figure of merit (FoM = Δλ/FWHM), and peak transmission change (ΔT). In the Mg-rich regime (Au layers 2.5–10 nm each), resonances vanish after hydrogenation due to the weak plasmonic response of MgH2. Large spectral shifts are nevertheless observed, reaching Δλ = 274 nm for Au:Mg:Au = 15:70:15 and 137 nm for 20:60:20. These large shifts are accompanied by very broad resonances (FWHM = 318 nm and 201 nm, respectively), yielding modest FoM values (0.86 and 0.68). The pronounced broadening arises from the dominance of Mg, which introduces strong optical losses and degrades plasmon coherence, but simultaneously enhances sensitivity since the Mg → MgH2 transformation strongly perturbs the dielectric environment. At intermediate Au fractions (20–35 nm per side), the spectra display a transition to narrower resonances, with FWHM values reduced to 152, 110, and 44 nm for the 20:60:20, 25:50:25, and 35:30:35 configurations, respectively. Meanwhile, the hydrogen-induced shifts remain moderate (Δλ = 88 nm, 58 nm, and 33 nm), producing balanced FoM values in the range 0.58–0.45. This regime thus achieves an optimal trade-off: the plasmonic stability of Au sharpens the resonances, while the residual Mg content preserves hydrogen sensitivity. In the Au-rich regime (≥40 nm per side), resonances become very sharp (FWHM ≈ 43 nm), but the spectral shifts nearly vanish (Δλ ≤ 6 nm). The FoM consequently drops to 0.14, confirming that high Au content suppresses hydrogen responsiveness. Interestingly, the peak transmission change ΔT in this regime becomes positive (+7–8%), which likely reflects a reduction in plasmonic absorption combined with dielectric modification by the small residual Mg fraction. The Au:Mg ratio dictates a clear trade-off between sensitivity and resonance quality: Mg-rich arrays maximize spectral tunability but suffer from weak and broadened resonances, whereas Au-rich arrays sustain sharp resonances but lose hydrogen response. The optimal compositions lie at intermediate Au fractions, where stable resonances coexist with significant hydrogen-induced modulation.
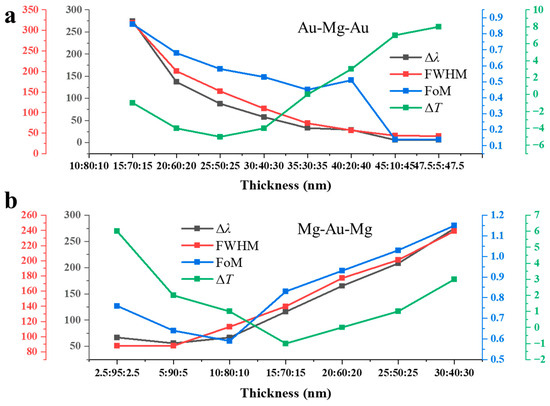
Figure 3.
Composition-dependent hydrogen response of three-layer NAs: (a) Au–Mg–Au structures with varied Au:Mg ratios, showing resonance shift (Δλ), linewidth (FWHM), figure of merit (FoM = Δλ/FWHM), and peak transmission change (ΔT) extracted from Figure 2b,c. (b) Mg–Au–Mg counterparts with varied Au:Mg ratios, showing the same parameters extracted from Figure 2e,f.
Figure 3b summarizes the composition-dependent optical response of Mg–Au–Mg three-layer NAs, extracted from the transmission spectra in Figure 2e,f. In the Au-rich regime (Au ≥ 90 nm, Mg ≤ 10 nm), the hydrogen-induced resonance shifts remain small (Δλ ≈ 56–67 nm), accompanied by relatively narrow linewidths (FWHM ≈ 88 nm). The FoM is below unity (0.64–0.76), and the transmission modulation is weakly positive (ΔT ≈ 1–6%). This behavior reflects the stabilizing role of Au in sustaining sharp plasmonic modes, while the small Mg fraction produces only limited dielectric perturbation upon hydrogenation. At intermediate compositions (Au 70–40 nm, Mg 30–60 nm), both Δλ and FWHM increase substantially. The resonance shift grows from 116 nm at 70 nm Au to 275 nm at 40 nm Au, while the FWHM broadens from ~140 nm to 239 nm. Despite this broadening, the FoM improves, reaching a maximum of 1.15 for the 30:40:30 configuration. These results explicitly demonstrate a composition-dependent trade-off between hydrogen sensitivity and resonance sharpness. Increasing the Mg fraction enhances spectral tunability by amplifying the dielectric change upon the Mg → MgH2 transition, but at the cost of resonance broadening due to increased ohmic losses. Conversely, higher Au content stabilizes the plasmonic mode and yields narrower features but suppresses hydrogen responsiveness. The optimal performance therefore arises at intermediate Au/Mg ratios (e.g., Mg–Au–Mg = 30:40:30), where the balance between plasmonic coherence and dielectric modulation produces Δλ ≈ 275 nm and FoM ≈ 1.15.
3.3. Effect of Total Thickness
Figure 4a shows the schematic of the Au–Mg–Au three-layer NA with a fixed thickness ratio of 15:70:15, selected because this composition yielded the highest FoM (see Figure 3a). In this study, the total thickness ttot is systematically varied from 10 to 300 nm (10, 30, 50, 75, 100, 150, 200, 250, and 300 nm). The corresponding optical transmission spectra before hydrogenation are presented in Figure 4b. As ttot increases from 10 nm (black trace) to 300 nm (violet trace), two distinct trends emerge. First, the overall transmission intensity decreases progressively. Second, the fundamental plasmonic resonance undergoes a systematic blue shift of its peak wavelength. This behavior originates from the metallic character of Mg, which supports tightly confined hybrid plasmonic modes within the nanohole cavity. Increasing ttot reduces the coupling between the upper and lower Au interfaces, thereby lowering the effective refractive index . According to the resonance condition [24],
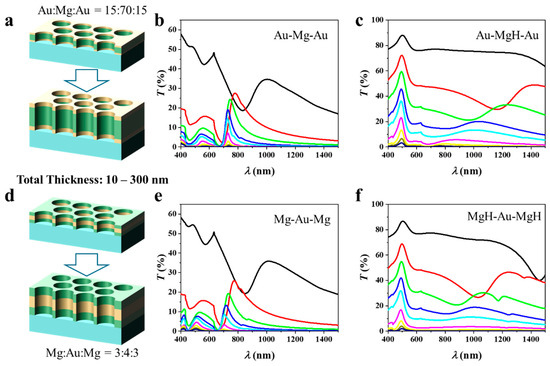
Figure 4.
Thickness-dependent optical response of three-layer nanohole arrays with optimized Au/Mg ratios: (a–c) Au–Mg–Au structure with a fixed thickness ratio of 15:70:15, where the total thickness varies from 10 to 300 nm; (b) transmission spectra before hydrogenation and (c) after hydrogenation. (d–f) Mg–Au–Mg structure with a fixed ratio of 3:4:3 with ranging from 10 to 300 nm; (e) pristine spectra and (f) hydrogenated spectra.
A reduction in drives the resonance wavelength to shorter values, giving rise to the observed blue shift. At the same time, thicker multilayers elongate the plasmon propagation path through the Mg-dominated medium, which enhances absorption and scattering losses. As a result, the transmission amplitude decreases exponentially with thickness [25], consistent with
After hydrogenation in Figure 4c, the optical response is dramatically altered because Mg converts into MgH2, which is an insulating dielectric with a wide bandgap of approximately 5.6 eV. The transformation results in significant changes in the dielectric contrast within the multilayer cavity, thereby modifying the effective refractive index and resonance behavior. In this hydrogenated state, the transmission once again decreases, and the peaks shift to blue as the thickness increases. In contrast to the pre-hydrogenation case with the same thickness, the resonant features shift and extend toward longer wavelengths in the visible to near-infrared range. This redshifted trend originates from the increase in the cavity effective index and the enlarged optical path length when Mg is replaced by its dielectric hydride phase, as captured by the resonance condition [26] .
Figure 4d depicts the schematic of the Mg–Au–Mg three-layer NA, designed with a fixed thickness ratio of 3:4:3, which yields the highest FoM as identified in Figure 3b. In this configuration, the total multilayer thickness ttot is systematically varied from 10 to 300 nm, and the corresponding transmission spectra before and after hydrogenation are shown in Figure 4e,f. In contrast to the Au–Mg–Au configuration, here the noble metal Au serves as the central spacer, while Mg layers are positioned at the top and bottom. This geometry alters the plasmonic–photonic interactions and, consequently, the thickness-dependent optical response. Before hydrogenation, the structure effectively behaves as a metal–dielectric–metal cavity in which metallic Mg strongly couples with the central Au to form hybridized plasmonic resonances. At small thicknesses (10–30 nm), the arrays exhibit pronounced transmission peaks in the visible region. Increasing ttot leads to a systematic reduction in transmission amplitude and a partial blue shift of the resonance maxima. The intensity decay follows an exponential dependence on thickness, consistent with enhanced absorption and scattering within the composite metallic stack. Upon hydrogenation, Mg converts to insulating MgH2, which possesses a high refractive index but negligible free-electron density. This metal-to-dielectric transformation substantially modifies the effective modal index and resonance condition of the cavity. The resulting transmission spectra display two notable features: (i) a pronounced suppression of overall transmission with increasing thickness, reflecting the increased optical opacity of the multilayer, and (ii) retention of the systematic blue-shift trend with thickness.
Figure 5a summarizes the hydrogen sensing characteristics of the Au–Mg–Au NAs presented in Figure 4b,c. In the ultrathin regime (30–50 nm), the structures exhibit both well-defined resonances and pronounced sensitivity to hydrogenation. At 30 nm thickness, a large resonance shift of nm is observed, accompanied by a FWHM too broad to be fully captured within the calculated spectral range (<1500 nm), indicative of strong plasmon–cavity coupling. At 50 nm, the shift decreases to nm with a FWHM of 351 nm, yielding the highest figure of merit (). In this regime, the hydrogen-induced transmission modulation is also most pronounced, reaching at 30 nm and +9% at 50 nm. These large responses underscore the efficient interplay between confined plasmonic modes in Au and the volumetric metal-to-insulator transition of Mg to MgH2, which drastically alters the local dielectric environment. As the total thickness increases beyond 75 nm, the performance degrades progressively. The Δλ diminishes from 304 nm at 75 nm to only 25 nm at 300 nm, consistent with reduced optical penetration depth and weaker field overlap within thicker multilayers. FWHM narrows from 310–362 nm at 75–150 nm to 104 nm at 300 nm, producing resonances that are spectrally sharper but less responsive. The FoM decreases steeply with increasing thickness, from 1.16 at 30 nm and 0.89 at 100 nm to below 0.30 above 200 nm, approaching 0.24 at 250–300 nm. This decline reflects the fact that, although resonances persist, their hydrogen-induced modulation is inadequate for practical sensing. Transmission modulation exhibits a parallel thickness dependence. Thin films produce strong positive contrasts ( at 30 nm, +9% at 50 nm), whereas thicker films show weak or even negative responses ( to above 75 nm). This inversion arises from increased absorption and reflection losses in the thicker Au–Mg–Au cavities, which obscure the dielectric contrast associated with Mg hydride formation. It is noteworthy that ultrathin (<50 nm) Au/Mg multilayers yield the highest FoM (up to 1.40) due to intensified plasmon–hydride coupling, yet their limited mechanical and optical stability constrains practical usage. As thickness increases, plasmonic fields become less coupled to the hydrogen-responsive Mg, leading to diminished Δλ and FoM but improved spectral stability. Thus, sensor optimization requires balancing ultrathin high-sensitivity designs against the robustness of thicker stacks.
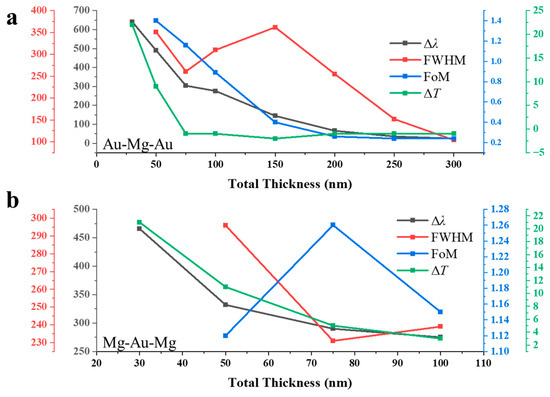
Figure 5.
Hydrogen sensing performance of three-layer nanohole arrays as a function of total thickness: (a) Au–Mg–Au structures (15:70:15 ratio) showing resonance shift (Δλ), linewidth (FWHM), figure of merit (FoM), and peak transmission change (ΔT) extracted from Figure 4b,c. (b) Mg–Au–Mg structures (3:4:3 ratio) displaying the corresponding sensing parameters derived from Figure 4e,f.
Figure 5b presents the hydrogen sensing response of Mg–Au–Mg NAs as a function of the total multilayer thickness. For thin stacks, well-defined resonant features are observed. At 30 nm thickness, the EOT peak undergoes a substantial hydrogen-induced redshift of nm. This shift decreases systematically with increasing thickness, falling to 332 nm at 50 nm, 290 nm at 75 nm, and 275 nm at 100 nm. The monotonic reduction in reflects the diminished sensitivity of the plasmonic mode to the Mg–MgH2 phase transition as the outer Mg layers thicken, effectively screening the electromagnetic field confined within the central Au layer. FWHM shows a moderate narrowing with increasing thickness: 296 nm at 50 nm, 231 nm at 75 nm, and 239 nm at 100 nm. This spectral contraction suggests enhanced modal confinement but also reduced interaction volume with the hydride phase. Correspondingly, the FoM remains relatively favorable in the intermediate regime, reaching a maximum of 1.26 at 75 nm and maintaining comparably high values of 1.12 at 50 nm and 1.15 at 100 nm. These values indicate that although the absolute resonance shifts diminish with thickness, the relative resolvability of spectral changes remains robust within the 50–100 nm range. Hydrogen-induced follows a decreasing trend with thickness. At 30 nm, strong modulation of +21% is observed, which drops to +11% at 50 nm, +5% at 75 nm, and only +3% at 100 nm. This trend underscores that ultrathin Mg–Au–Mg stacks provide highly efficient transduction of hydride formation into measurable optical signals, whereas thicker multilayers progressively lose sensitivity due to increased absorption losses and reduced plasmon–hydride overlap.
The rate of Mg → MgH2 transformation is governed by both hydrogen diffusivity within metallic Mg and the interfacial transport across Au/Mg boundaries. Using literature diffusivity values (D ≈ 10−13–10−11 m2 s−1) [27,28], characteristic diffusion times τ ≈ L2/D are estimated to be <0.1 s for 30 nm Mg layers but several seconds for 200 nm films, consistent with faster responses in ultrathin NAs. In multilayer stacks, Au interlayers locally interrupt diffusion but also create high-density surface entry sites at nanohole walls, effectively shortening diffusion pathways. Consequently, Mg-Au-Mg architectures combine fast surface activation with volumetric hydrogenation, explaining their stronger and quicker optical responses compared to Au-Mg-Au. These analyses further confirm that reducing Mg thickness and optimizing interlayer geometry are key to balancing sensitivity and operational speed. In practice, temperature, ambient humidity, and pressure also influence kinetics. While our FDTD simulations are steady-state, these estimates provide a realistic frame for correlating structural design with expected dynamic response.
3.4. Effect of the Number of Layers
Figure 6 illustrates the optical properties and hydrogen sensing response of Mg–Au–Mg multilayer NAs with a fixed total thickness of 100 nm but varied internal stacking sequences. All structures maintain the optimal thickness ratio of Mg:Au:Mg = 30:40:30 nm, which provided the highest FoM (Figure 3b). The number of layers was systematically increased to examine how stratified stacking modifies plasmonic resonances and their evolution upon hydrogen exposure. The investigated configurations consist of two (Au–Mg), three (Au–Mg–Au), four (Au–Mg–Au–Mg), five (Au–Mg–Au–Mg–Au), and six (Au–Mg–Au–Mg–Au–Mg) layers, as schematically depicted in Figure 6a. The pre-hydrogenation T(λ) (Figure 6b) reveals a distinct odd–even dependence in the position of the dominant EOT resonance. Across all architectures, the primary resonance appears in the 680–740 nm range but exhibits systematic alternation depending on whether the terminating surface is Mg or Au. For even-layer stacks (2, 4, and 6 layers), where Mg caps the structure and directly interfaces with air, the resonance consistently stabilizes around ~700 nm. In contrast, for odd-layer stacks (3 and 5 layers) with Au at the air interface, the resonance undergoes a pronounced redshift. For example, the three-layer structure exhibits a peak near ~730 nm, compared with ~700 nm for the two-layer case, while the five-layer array shows a similar redshift relative to its four-layer counterpart. Reintroduction of a terminating Mg layer (in the four- and six-layer stacks) brings the resonance back toward ~700 nm. This alternating trend indicates that the spectral position of the dominant EOT resonance is governed not by total thickness but by the terminating layer material. Mg termination stabilizes the resonance through stronger dielectric contrast with air, whereas Au termination enhances plasmon–air coupling and effectively increases the optical cavity length, leading to redshifted modes. This behaviour can be conceptually expressed as follows [29]:
where is the effective modal index and the effective cavity length. While the overall multilayer thickness remains constant, the terminal layer alters the boundary conditions of the confined plasmonic mode. Au termination increases via stronger plasmon–air interaction, thereby redshifting the resonance, while Mg termination suppresses this effect, anchoring near ~700 nm.
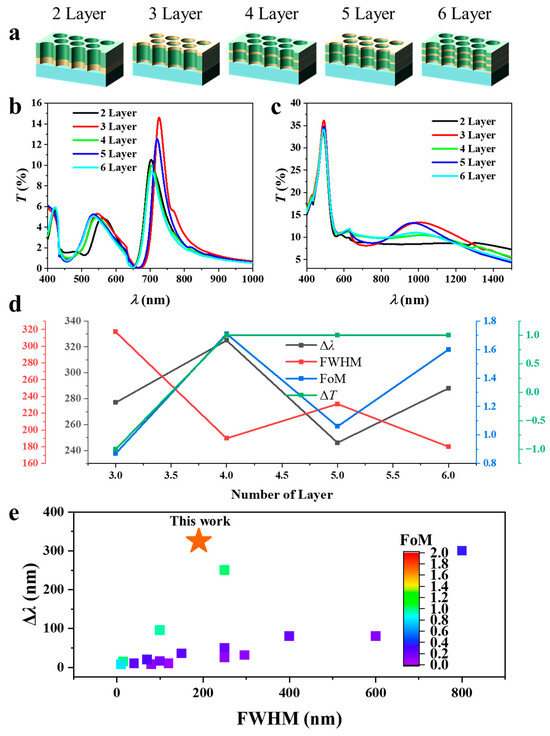
Figure 6.
Optical response and hydrogen sensing performance of Mg–Au–Mg multilayer nanohole arrays with fixed total thickness of 100 nm and varied stacking sequences: (a) Schematics of two- to six-layer configurations (Au–Mg, Au–Mg–Au, Au–Mg–Au–Mg, Au–Mg–Au–Mg–Au, and Au–Mg–Au–Mg–Au–Mg) designed with the optimal Mg:Au:Mg ratio of 30:40:30 nm. (b) Transmission spectra before hydrogenation showing odd–even dependence of the dominant EOT resonance. (c) Transmission spectra after hydrogen exposure, exhibiting strong modifications due to Mg converting into insulating MgH2. (d) Quantitative summary of the composition- and stacking-dependent spectral characteristics, including resonance shifts (Δλ), FWHM, FoM, and transmission changes (ΔT). (e) Plot of state-of-the-art plasmonic hydrogen sensors, plotting maximum Δλ, FWHM, and FoM. The FoM values are indicated by the color bar.
After hydrogen exposure (Figure 6c), the transmission spectra undergo a pronounced transformation due to the metal–insulator conversion of Mg to MgH2. The well-defined EOT resonances around 700 nm are strongly suppressed and broadened, and the spectra flatten considerably. Weaker and less distinct maxima emerge at longer wavelengths in the near-infrared (~900–1200 nm), reflecting the loss of plasmonic support at Mg/Au interfaces and the disruption of strong hybrid plasmon–cavity coupling. Despite this suppression, the odd–even effect observed prior to hydrogenation persists. Even-layer structures (Mg-terminated) exhibit weaker spectral features, whereas odd-layer structures (Au-terminated) display comparatively stronger transmission. However, the peak positions remain similar across all layer counts, indicating that after hydrogenation, the principal effect of layer termination is on resonance intensity rather than spectral position.
Figure 6d summarizes the quantitative spectral characteristics of the Au–Mg multilayer NAs with different stacking numbers in Figure 6b,c. The hydrogenation-induced resonance shift exhibits a non-monotonic dependence on layer number. The largest shift is observed for the four-layer configuration (Au–Mg–Au–Mg) at 325 nm, followed by the six-layer structure (288 nm). While the resonance peak for the two-layer Au–Mg configuration becomes indistinguishable after hydrogenation. By comparison, the three- and five-layer arrays show smaller shifts of 277 nm and 246 nm, respectively. This oscillatory behaviour reflects the odd–even effect observed earlier: even-layer stacks, which terminate with Mg at the air interface, consistently support larger spectral shifts than their Au-terminated, odd-layer counterparts. Physically, Au termination promotes more delocalized plasmonic coupling at the air–metal boundary, whereas Mg/MgH2 termination stabilizes the resonance penetration depth and enhances sensitivity to hydrogen-induced dielectric changes. This alternating resonance behavior originates from the boundary-condition-induced asymmetry of the confined plasmonic modes. When the array is Au-terminated (odd-layer), the enhanced plasmon–air coupling increases the effective modal index and redshifts the resonance. In contrast, Mg-terminated (even-layer) surfaces present elevated dielectric contrast with air, reducing field leakage and stabilizing shorter-wavelength modes. The resultant odd–even oscillation thus reflects a boundary-condition-controlled mode asymmetry rather than a thickness effect.
The FWHM values further distinguish the resonance quality among the architectures. Narrow resonances are obtained in the four-layer (190 nm) and six-layer (180 nm) arrays, consistent with stronger modal confinement and reduced radiative damping. In contrast, the three-layer (317 nm) and five-layer (231 nm) structures yield broader linewidths, indicative of greater optical losses. The FoM reflects these trends: the highest values are achieved in the four-layer (1.71) and six-layer (1.60) architectures, while the three-layer stack produces only 0.87, owing to its broad resonance and limited wavelength shift. The hydrogen-induced transmission modulation remains comparatively small (≈±1%) but shows a termination-dependent sign. The two-layer array (Au–Mg) exhibits a slight reduction (–1%), whereas all other stacks show modest increases (+1%). Although weaker than the resonance shift, this behaviour corroborates the boundary-condition dependence and further underscores the role of surface termination in regulating both spectral response and hydrogen interaction dynamics. Overall, the four-layer structure achieves the highest FoM = 1.96 alongside a large absolute resonance shift (Δλ = 325 nm) and small FWHM = 190 nm, surpassing the best plasmonic hydrogen sensors reported to date [11,15,17,30,31,32,33,34,35,36,37,38,39,40,41,42], as summarized in (Figure 6e).
In realistic device fabrication, Mg films rapidly form a thin MgO passivation layer (<3 nm) upon ambient exposure, which can slightly reduce hydrogen diffusion but preserves optical stability. Incorporating ultrathin diffusion barriers (e.g., Ti, Pd) between Au and Mg can suppress interfacial alloying while preserving plasmonic coherence. Moreover, Au capping layers offer dual functionality—acting as an optical stabilizer and oxidation barrier without severely impeding hydrogen uptake when thinner than ~5 nm. Fabrication imperfections, including ±5 nm layer thickness variations and ±10 nm deviations in hole periodicity, were numerically tested, leading to <3% resonance shifts—well below the characteristic Δλ range (hundreds of nanometers). These analyses confirm that the core design guidelines derived in this work retain validity under realistic fabrication conditions.
4. Conclusions
This work demonstrates that the hydrogen sensing performance of multilayer Au–Mg plasmonic NAs is governed by a delicate interplay between layer sequence, composition ratio, total thickness, and stacking configuration. Direct comparison of Au–Mg–Au and Mg–Au–Mg structures reveals that Mg-terminated configurations enable stronger plasmon–hydride interaction, producing a resonance redshift of 208 nm with FoM = 1.03 and ΔT = +1%, nearly twice the FoM of Au–Mg–Au (Δλ = 88 nm, FoM = 0.58, ΔT = –5%). Varying the Au/Mg fraction uncovers a trade-off between sensitivity and resonance sharpness: Mg-rich arrays exhibit very large shifts, up to 274 nm for Au:Mg:Au = 15:70:15, but suffer from broadening (FWHM = 318 nm), while Au-rich arrays sustain sharp resonances (FWHM ≈ 43 nm) but negligible sensitivity (Δλ ≤ 6 nm). The optimal balance emerges at intermediate compositions, such as Mg–Au–Mg (30:40:30), achieving Δλ = 275 nm and FoM = 1.15. Thickness dependence further shows that ultrathin stacks (<50 nm) provide exceptional responses, with Δλ = 641 nm and FoM = 1.40 at 50 nm in Au–Mg–Au, and Δλ = 466 nm with FoM = 1.26 at 75 nm in Mg–Au–Mg. However, performance degrades with increasing thickness, as Δλ falls below 30 nm and FoM drops below 0.3 at 300 nm. Finally, stacking analysis uncovers an odd–even termination effect, with Mg-capped multilayers exhibiting the largest shifts (up to 325 nm in four-layer stacks) and highest FoM values (1.71), surpassing their Au-terminated counterparts. These findings establish clear design principles: high-performance hydrogen plasmonic sensors are best achieved with Mg–Au–Mg architectures of intermediate composition and ultrathin dimensions, where plasmonic coherence and dielectric modulation are optimally balanced.
Supplementary Materials
The following supporting information can be downloaded at: https://www.mdpi.com/article/10.3390/technologies13120564/s1, Figure S1. (a) Simulation configuration and (b) Transmission spectra of the nanohole arrays with different polarization angles. The polarization angle in (a) was defined as 0°; Figure S2. (a) Transmission spectra of Au (25 nm)-Mg (50 nm)-Au (25 nm) arrays with different diameters. (b) Transmission spectra of Au-Mg-Au arrays (diameter = 240 nm) with different Au:Mg:Au ratios.
Author Contributions
B.A. conceptualized the research. J.F. and Y.L. performed the calculation and data analysis. X.C. and M.C. helped with the data analysis. B.A. wrote the paper with input from all authors. All authors have read and agreed to the published version of the manuscript.
Funding
This work was supported by the National Natural Science Foundation of China (grant nos. 62105043).
Institutional Review Board Statement
Not applicable.
Informed Consent Statement
Not applicable.
Data Availability Statement
All data supporting the findings of this study can be found in the Supplementary Material. Additional information can be obtained from the corresponding author upon reasonable request.
Conflicts of Interest
The authors declare that they have no known competing financial interests or personal relationships that could have appeared to influence the work reported in this paper.
References
- Akpasi, S.O.; Smarte Anekwe, I.M.; Tetteh, E.K.; Amune, U.O.; Mustapha, S.I.; Kiambi, S.L. Hydrogen as a clean energy carrier: Advancements, challenges, and its role in a sustainable energy future. Clean Energy 2025, 9, 52–88. [Google Scholar] [CrossRef]
- Menon, S.K.; Kumar, A.; Mondal, S. Advancements in hydrogen gas leakage detection sensor technologies and safety measures. Clean Energy 2025, 9, 263–277. [Google Scholar] [CrossRef]
- Hubert, T.; Boon-Brett, L.; Black, G.; Banach, U. Hydrogen Sensors—A review. Sens. Actuators B Chem. 2011, 157, 329–352. [Google Scholar] [CrossRef]
- Darmadi, I.; Nugroho, F.A.A.; Langhammer, C. High-Performance Nanostructured Palladium-Based Hydrogen Sensors—Current Limitations and Strategies for Their Mitigation. ACS Sens. 2020, 5, 3306–3327. [Google Scholar] [CrossRef] [PubMed]
- Ai, B.; Sun, Y.; Zhao, Y. Plasmonic hydrogen sensors. Small 2022, 18, 2107882. [Google Scholar] [CrossRef]
- Duan, Q.; Liu, Y.; Chang, S.; Chen, H.; Chen, J. Surface plasmonic sensors: Sensing mechanism and recent applications. Sensors 2021, 21, 5262. [Google Scholar] [CrossRef] [PubMed]
- Cheng, M.; Chen, X.; Zhang, J.; Ye, X.; Ai, B. Closing the loop in next-generation sensing through shadow sphere lithography, plasmonics, and artificial intelligence. Chem. Soc. Rev. 2025, 54, 9876–9920. [Google Scholar] [CrossRef]
- Masson, J.-F.; Murray-Méthot, M.-P.; Live, L.S. Nanohole arrays in chemical analysis: Manufacturing methods and applications. Analyst 2010, 135, 1483–1489. [Google Scholar] [CrossRef]
- Genet, C.; Ebbesen, T.W. Light in tiny holes. Nature 2007, 445, 39–46. [Google Scholar] [CrossRef]
- Longato, A.; Vanzan, M.; Colusso, E.; Corni, S.; Martucci, A. Enhancing Tungsten Oxide Gasochromism with Noble Metal Nanoparticles: The Importance of the Interface. Small 2023, 19, 2205522. [Google Scholar] [CrossRef]
- Palm, K.J.; Murray, J.B.; Narayan, T.C.; Munday, J.N. Dynamic Optical Properties of Metal Hydrides. ACS Photonics 2018, 5, 4677–4686. [Google Scholar] [CrossRef]
- Bogdanović, B.; Bohmhammel, K.; Christ, B.; Reiser, A.; Schlichte, K.; Vehlen, R.; Wolf, U. Thermodynamic investigation of the magnesium–hydrogen system. J. Alloys Compd. 1999, 282, 84–92. [Google Scholar] [CrossRef]
- Wang, T.; Tang, L.; Zhang, Y.; Hong, Z.; Liu, G.; Li, Z.; Chen, J.; Peng, L.; Ding, W. Interaction between Hydrogen and Magnesium Films: From Hydrogenochromism to Applications. ACS Appl. Mater. Interfaces 2025, 17, 8794–8820. [Google Scholar] [CrossRef]
- Wadell, C.; Syrenova, S.; Langhammer, C. Plasmonic Hydrogen Sensing with Nanostructured Metal Hydridese. ACS Nano 2014, 8, 11925–11940. [Google Scholar] [CrossRef]
- Nugroho, F.A.A.; Darmadi, I.; Cusinato, L.; Susarrey-Arce, A.; Schreuders, H.; Bannenberg, L.J.; Fanta, A.B.D.; Kadkhodazadeh, S.; Wagner, J.B.; Antosiewicz, T.J.; et al. Metal-Polymer Hybrid Nanomaterials for Plasmonic Ultrafast Hydrogen Detection. Nat. Mater. 2019, 18, 489–495. [Google Scholar] [CrossRef]
- Luong, H.M.; Pham, M.T.; Guin, T.; Madhogaria, R.P.; Phan, M.-H.; Larsen, G.K.; Nguyen, T.D. Sub-second and ppm-level optical sensing of hydrogen using templated control of nano-hydride geometry and composition. Nat. Commun. 2021, 12, 2414. [Google Scholar] [CrossRef]
- Cheng, M.; Lin, X.; Chen, X.; Chen, C.; Zhang, G.; Ai, B. Enhancing Plasmonic Hydrogen Sensing Through Heterogeneous Multilayer Configurations with Quantitative Mechanism Analysis. ACS Appl. Nano Mater. 2024, 7, 14203–14212. [Google Scholar] [CrossRef]
- Palik, E.D. Handbook of Optical Constants of Solids; Academic Press: Cambridge, MA, USA, 1985. [Google Scholar]
- Ebbesen, T.W.; Lezec, H.J.; Ghaemi, H.; Thio, T.; Wolff, P.A. Extraordinary optical transmission through sub-wavelength hole arrays. Nature 1998, 391, 667–669. [Google Scholar] [CrossRef]
- Garcia-Vidal, F.J.; Martin-Moreno, L.; Ebbesen, T.; Kuipers, L. Light passing through subwavelength apertures. Rev. Mod. Phys. 2010, 82, 729–787. [Google Scholar] [CrossRef]
- Ai, B.; Yu, Y.; Möhwald, H.; Zhang, G.; Yang, B. Plasmonic films based on colloidal lithography. Adv. Colloid Interface Sci. 2014, 206, 5–16. [Google Scholar] [CrossRef]
- Lee, S.H.; Bantz, K.C.; Lindquist, N.C.; Oh, S.-H.; Haynes, C.L. Self-assembled plasmonic nanohole arrays. Langmuir 2009, 25, 13685–13693. [Google Scholar] [CrossRef]
- Kim, T.J.; Thio, T.; Ebbesen, T.W.; Grupp, D.; Lezec, H.J. Control of optical transmission through metals perforated with subwavelength hole arrays. Opt. Lett. 1999, 24, 256–258. [Google Scholar] [CrossRef]
- Piegari, A.; Flory, F. Optical Thin Films and Coatings: From Materials to Applications; Woodhead Publishing: Sawston, UK, 2018. [Google Scholar]
- Pedrotti, F.L.; Pedrotti, L.M.; Pedrotti, L.S. Introduction to Optics; Cambridge University Press: Cambridge, UK, 2017. [Google Scholar]
- Saleh, B.E.; Teich, M.C. Fundamentals of Photonics; John Wiley & Sons: Hoboken, NJ, USA, 2019; Volume 2. [Google Scholar]
- Fukai, Y. The Metal-Hydrogen System: Basic Bulk Properties; Springer: Berlin/Heidelberg, Germany, 2005. [Google Scholar]
- Jain, I.; Lal, C.; Jain, A. Hydrogen storage in Mg: A most promising material. Int. J. Hydrogen Energy 2010, 35, 5133–5144. [Google Scholar] [CrossRef]
- Vahala, K.J. Optical microcavities. Nature 2003, 424, 839–846. [Google Scholar] [CrossRef]
- Lv, X.; Wu, F.; Tian, Y.; Zuo, P.; Li, F.; Xu, G.; Niu, W. Engineering the Intrinsic Chirality of Plasmonic Au@Pd Metamaterials for Highly Sensitive Chiroplasmonic Hydrogen Sensing. Adv. Mater. 2023, 35, 2305429. [Google Scholar] [CrossRef]
- Nugroho, F.A.A.; Bai, P.; Darmadi, I.; Castellanos, G.W.; Fritzsche, J.; Langhammer, C.; Gómez Rivas, J.; Baldi, A. Inverse designed plasmonic metasurface with parts per billion optical hydrogen detection. Nat. Commun. 2022, 13, 5737. [Google Scholar] [CrossRef]
- Liao, C.R.; Xiong, C.; Zhao, J.L.; Zou, M.Q.; Zhao, Y.Y.; Li, B.Z.; Ji, P.; Cai, Z.H.; Gan, Z.S.; Wang, Y.; et al. Design and realization of 3D printed fiber-tip microcantilever probes applied to hydrogen sensing. Light Adv. Manuf. 2022, 3, 5. [Google Scholar] [CrossRef]
- Xu, F.; Ma, J.; Hu, K.; Zhang, Z.; Ma, C.; Guan, B.-O.; Chen, K. Ultrahigh sensitivity of hydrogen detection with a perforated Pd film on a miniature fiber tip. Sens. Actuators B Chem. 2024, 400, 134875. [Google Scholar] [CrossRef]
- Lin, X.; Cheng, M.; Chen, X.; Zhang, J.; Zhao, Y.; Ai, B. Unlocking Predictive Capability and Enhancing Sensing Performances of Plasmonic Hydrogen Sensors via Phase Space Reconstruction and Convolutional Neural Networks. ACS Sens. 2024, 9, 3877–3888. [Google Scholar] [CrossRef] [PubMed]
- Subramanian, S.; Kumar, K.; Dhawan, A. Palladium-coated narrow groove plasmonic nanogratings for highly sensitive hydrogen sensing. RSC Adv. 2020, 10, 4137–4147. [Google Scholar] [CrossRef]
- Luong, H.M.; Pham, M.T.; Madhogaria, R.P.; Phan, M.-H.; Larsen, G.K.; Nguyen, T.D. Bilayer Plasmonic Nano-Lattices for Tunable Hydrogen Sensing Platform. Nano Energy 2020, 71, 104558. [Google Scholar] [CrossRef]
- Farnood, A.; Ranjbar, M.; Salamati, H. Localized Surface Plasmon Resonance (LSPR) Detection of Hydrogen Gas by Pd2+/Au Core/Shell like Colloidal Nanoparticles. Int. J. Hydrogen Energy 2020, 45, 1158–1169. [Google Scholar] [CrossRef]
- Darmadi, I.; Nugroho, F.A.A.; Kadkhodazadeh, S.; Wagner, J.B.; Langhammer, C. Rationally Designed PdAuCu Ternary Alloy Nanoparticles for Intrinsically Deactivation-Resistant Ultrafast Plasmonic Hydrogen Sensing. ACS Sens. 2019, 4, 1424–1432. [Google Scholar] [CrossRef]
- Beni, T.; Yamasaku, N.; Kurotsu, T.; To, N.; Okazaki, S.; Arakawa, T.; Balcytics, A.; Seniutinas, G.; Juodkazis, S.; Nishijima, Y. Metamaterial for Hydrogen Sensing. ACS Sens. 2019, 4, 2389–2394. [Google Scholar] [CrossRef]
- Wang, M.M.; Wang, P.; Zhang, J.; Hou, H.; Li, C.P.; Jin, Y.D. Pd/Ag nanosheet as a plasmonic sensing platform for sensitive assessment of hydrogen evolution reaction in colloid solutions. Nano Res. 2018, 11, 2093–2103. [Google Scholar] [CrossRef]
- Shen, Y.; She, X.Y.; Jin, C.J. Mechanically Reconfigurable Pd Nanogroove Array: An Ultrasensitive Optical Hydrogen Detector. ACS Photonics 2018, 5, 1334–1342. [Google Scholar] [CrossRef]
- Houlihan, N.M.; Karker, N.; Potyrailo, R.A.; Carpenter, M.A. High Sensitivity Plasmonic Sensing of Hydrogen over a Broad Dynamic Range Using Catalytic Au-CeO2 Thin Film Nanocomposites. ACS Sens. 2018, 3, 2684–2692. [Google Scholar] [CrossRef] [PubMed]


Disclaimer/Publisher’s Note: The statements, opinions and data contained in all publications are solely those of the individual author(s) and contributor(s) and not of MDPI and/or the editor(s). MDPI and/or the editor(s) disclaim responsibility for any injury to people or property resulting from any ideas, methods, instructions or products referred to in the content. |
© 2025 by the authors. Licensee MDPI, Basel, Switzerland. This article is an open access article distributed under the terms and conditions of the Creative Commons Attribution (CC BY) license (https://creativecommons.org/licenses/by/4.0/).