Abstract
The proliferation of the Social Internet of Things (SIoT) necessitates robust and scalable trust management systems to ensure secure and reliable interactions among heterogeneous devices. However, existing trust management models often lack scalability for large SIoT environments. To address this, a lightweight trust evaluation model for SIoT, referred to as Micro-Moment (MMTE), is presented here. MMTE evaluates trust based on concise, context specific, repetitive, and high-frequency interactions, termed micro-moments among SIoT devices. The MMTE model is evaluated using the Lysis dataset, which is extracted from a real SIoT environment, and demonstrates superior resource efficiency compared to existing SIoT trust models with significantly lower CPU time, memory, and disk usage. MMTE’s linear complexity and simple design make it more resource efficient and scalable than other lightweight trust models, especially when processing large-scale data in heterogeneous SIoT networks. Moreover, MMTE accurately distinguishes 99.35% of malicious nodes in a simulated smart home environment. Furthermore, a numerical comparison clearly demonstrates that MMTE outperforms existing and recently published trust models in terms of classifying malicious and benign nodes. To enhance scalability, the concept of trust spheres is introduced, and devices with similar trust scores are grouped to streamline processing and storage demands. Sphere Anchors manage the trust spheres and efficiently distribute computational tasks and optimize storage through an adaptive storage strategy. The trust spheres also efficiently manage increasing network sizes, maintaining linear processing times as the traffic load increases, and also outperform existing models in terms of average propagation times. MMTE and trust spheres together provide a robust, scalable, and lightweight solution for trust management in SIoT networks.
1. Introduction
The Social Internet of Things enriches the IoT landscape by considering the social context (i.e., social relationships among things) and user preferences, leading to more personalized and context-aware IoT applications [1]. In SIoT networks, trust management plays a pivotal role in achieving trustworthy collaboration and cooperation among objects [2]. However, many of the existing trust management models do not scale for large SIoT environments [3]. On the other hand, billions of smart objects are connected to the internet and the numbers are still rising. Therefore, scalability has become an intrinsic and demanding requirement for the trust management systems being designed at present as it directly impacts the applicability and deployability of these systems within SIoT networks. To achieve scalability, a trust management system must be able to manage heterogeneous resource constraints of the IoT devices such as computational, resource-efficient storage management, and minimal bandwidth are vital factors that must be considered when developing a trust management framework for heterogeneous systems such as SIoT [4,5,6,7].
Numerous feedback-based trust management systems for SIoT have been developed (e.g., [8,9,10,11,12,13]). However, the use of feedback can have a substantial impact on the effectiveness of these systems and can limit their scalability. For example, it is vital to collect opinions before service delegation to select the most trustworthy service provider and later provide feedback to rate the received services. Industrial IoT environments are densely populated with heterogeneous IoT devices (some among them are battery-sourced). A battery-powered device could potentially consume most of its power in collecting and providing opinions/feedback to the distributed nodes instead of providing or requesting services. Moreover, even in the resource-rich environments, feedback exchange can flood the network with traffic [14]. An alternative mechanism (a lightweight rating/reputation method) can be used to avoid such situations or the feedback exchange could be considered in a cost-aware manner while considering the network view and resources of the IoT devices [15]. Furthermore, consider an IoT environment comprised of thousands of IoT devices, for each transaction, hundreds of opinions will be generated and this could result in excessive network overhead. Though the accuracy of the overall trust score tends to be directly impacted by an increasing number of opinions or quantity of feedback [16], a plausible threshold should be established to consider the appropriate set of nodes only while composing or calculating indirect trust.
Another design consideration/decision directly relates to scalability; once the trustworthiness index has been calculated, a big question arises—how to store and disseminate those values across the SIoT network? Several approaches have been developed by researchers, such as centralized authorities, distributed clusters, or each node maintaining these indexes in its own storage. For centralized storage, the issue of minimal storage capacity has been resolved and there is a relatively low burden on nodes. However, centralized storage becomes a target for adversaries and, if the server goes down, the whole trust management system could collapse. Likewise, using a node’s storage is also not appropriate as the devices have limited storage capacity and they might not be able to store all the trust-related data for the whole of the SIoT network or all nodes of relevance to them. A hybrid approach could perform better in such cases, with the burden being distributed among the nodes and server, but attackers could still identify high-end nodes who hold the majority of the trust information regarding the network [17]. Therefore, a suitable approach must be developed after considering the pros and cons of each option. In a nutshell, scalability in terms of storage and dissemination is equally important for ensuring effective trust management as the SIoT ecosystem grows, because it enables the system to handle the increasing complexity and volume of trust-related transactions, facilitating reliable collaborations in the SIoT environment [18].
The need for a lightweight trust model for SIoT arises because the majority of existing IoT trust management frameworks do not prioritize a lightweight approach [19], because they often incorporate complex methods and extensive data processing to ensure high levels of trust accuracy and resilience against various trust-related attacks. Hence, developing a lightweight trust management framework for SIoT is of paramount importance for several reasons: First and foremost, it lessens the computational and storage load, thereby permitting devices with limited resources to take part in trust management tasks without exhausting their abilities [20]. Secondly, the efficiency and responsiveness of the trust management system are enhanced through its lightweight architecture [21]—rapid processing and evaluation of trust-related information facilitate timely trust decisions, which is vital for real-time interactions within the SIoT networks. Thirdly, given the prevalence of wireless sensor networks or IoT and their inherent bandwidth limitations [22], a lightweight system significantly reduces the amount of data transmission required for trust-related information exchange. This optimization conserves network bandwidth—a valuable resource in scenarios where network resources are scarce or costly. Moreover, the scalability of the trust management system is also enhanced by its lightweight design [23]—by minimizing resource consumption, the system can seamlessly handle a growing number of devices and users without compromising performance or encountering resource bottlenecks. Finally, a lightweight trust management system contributes to the energy efficiency of SIoT devices, particularly those powered by batteries. Through reduced energy consumption, the system extends the operational lifespan of these devices, reducing the frequency of recharging or battery replacements. To address the challenge of scalability and to design a lightweight trust evaluation model for SIoT, this research makes the following contributions:
- A review of existing trust evaluation models for SIoT is provided, focusing on their lightweight characteristics and their effectiveness in addressing scalability challenges.
- A lightweight trust evaluation model (i.e., MMTE) is introduced, which computes trustworthiness based on the concise, context-specific, and high-frequency interactions (i.e., micro-moments) among SIoT devices.
- The MMTE model is evaluated using the Lysis dataset, and a comparative analysis of resource consumption in terms of CPU time, memory and disk usage is conducted among the MMTE model and a few traditional trust models designed for the SIoT to evaluate the lightweight nature of MMTE. In addition, the complexity of the MMTE model is also computed and compared with a lightweight trust model proposed by [24]. A quantitative comparison with the latest trust models designed for the SIoT is also performed to assess the effectiveness of MMTE in terms of classifying benign and malicious nodes.
- The suitability of each micro-moment utilized in the MMTE model is assessed to ensure the model performs as intended even when the trust parameters change. Subsequently, the performance of the MMTE model in terms of distinguishing malicious nodes from benign nodes is assessed in a simulated smart home environment.
- Trust spheres are formed, wherein nodes with limited resources are grouped based on the similarity of their aggregated trust scores (computed using the MMTE model) and abilities. The performance of the trust spheres method is evaluated in the extended simulated smart home environment (i.e., variable count of nodes) in terms of processing and storage efficiency. To conclude, the average propagation times of the trust spheres method are compared with those reported by [3].
The remainder of this paper is structured as follows: Section 2 reviews the relevant literature in this field; Section 3 presents the MMTE model and discusses the dynamic weight assignment based on the selected heuristics; the computation of micro-moments and the evaluation of the MMTE model are detailed in Section 4; Section 5 presents the concept of trust spheres along with their evaluation; Finally, Section 6 concludes and outlines directions for future research.
2. Related Work
A substantial body of literature exists on scalable trust evaluation models designed for IoT environments; however, these schemes cannot always be directly applied to SIoT networks due to their inability to handle the complex and dynamic nature of social interactions, as well as the increased scalability requirements. Therefore, this subsection only reviews the trust management schemes designed for SIoT with a focus on scalability and highlights their strengths and limitations. Subsequently, a brief review of lightweight trust management schemes designed for SIoT is presented, followed by a discussion of the conclusions drawn from this state-of-the-art review.
2.1. Scalable Trust Management Systems for SIoT
A community of interest-based trust management systems was proposed by [25], which focuses on scalability, adaptability, and survivability (i.e., the resiliency of the proposed model—the device’s trust converges to ground truth even in the presence of malevolent nodes). This is an encounter- and activity-based protocol, each node only maintains trust evaluations for a specific number of nodes that share common interests to reduce computational overhead. The trust properties, such as subjectivity, honesty, cooperativeness and community of interests, are considered. The limited storage problem has been considered and a storage management strategy has been suggested for resource-constrained nodes, this way the proposed system is scalable for application in large-scale SIoT systems. In the case of limited or full storage, the storage management module discards previous trust values for the nodes that have trust scores below 50%; however, the effect of this mechanism on the proposed scheme has not been evaluated for SIoT environments. The proposed trust management protocol is only validated through simulations with 400 nodes, whereas real-world IoT systems can be comprised of thousands of devices, leaving its scalability and performance in larger networks unexplored.
Kokoris-Kogias et al. [26] introduced a trust and reputation model for the SIoT (i.e., TRM-SIoT) based on the COSMOS project [27] to enhance scalability and reliability. Each node evaluates the trust value of another node based on its own interactions/experiences. The reputation index can be determined either by consulting a node’s friends or from the management system used in COSMOS. An encoding mechanism has been designed to categorize the malicious behavior of nodes by combining several behavior anomalies such as malicious service provision, recommendations, and oscillating behaviors (i.e., behavioral anomalies are depicted by three-bit numbers, where ‘000’ refers to a completely honest node and the rest of the sequence indicates different degrees of maliciousness). The proposed model excludes malevolent peers from SIoT networks while offering relatively low computational overhead and high scalability due to the hybrid architecture. However, the authors assume that IoT objects have sufficient computational power and ability to connect to the internet and those that do not have this ability cannot be a part of the proposed trust management system. Nevertheless, these devices can use another node in the network as a gateway, but if the network is comprised of strictly resource-constrained nodes or no trustworthy device is available to be used as a gateway, then deploying the proposed model becomes challenging.
Abderrahim et al. [28] developed a context-based trust management system considering several aspects: the scalability and dynamicity of IoT networks (i.e., varying contexts), social relationships, and a device’s ability/attributes. The system is capable of selecting the most trustworthy objects or service providers without requiring a prior history of objects using a decision tree mechanism. The proposed system is comprised of two modules: the trust module computes the contextual and reputation trust, and the learning module is responsible for classifying and predicting node behaviors. The Jaccard index (i.e., a statistic for measuring similarity or diversity between finite sets) has been used to compute social similarity among the objects. An objective approach has been designed to extract different trust values/indexes for varying contexts and services. Trust evaluations are stored in the trust manager and later supplied to the trust management server. Double penalties are imposed on maliciously behaving nodes. The authors acknowledge that IoT devices are resource-constrained and so is their battery life, hence it is not feasible to compute and store trust values on them. Having said that, a centralized architecture is proposed; therefore, a trusted server is always needed to install/configure the proposed scheme—this could lead to a single point of failure if the server is compromised. Moreover, an assumption has been made that it is very rare to find malicious nodes for co-location and co-ownership social relationships; based on this assumption initially high trust values are assigned to the nodes with the aforesaid relationships, and the nodes with relationships other those are rated relatively low during the bootstrapping period—a malicious node with a co-location relationship and a high trust value could benefit from this at least once and attack benign nodes in the network.
Sciddurlo et al. [29] proposed a multi-layered architecture for SIoT to ensure trusted and scalable service provision. Utilizing a fog-based approach, computational tasks are distributed across various layers, enhancing both scalability and fault tolerance. In the initial fog layer, the trust management system assesses the trustworthiness of service providers (i.e., trust is computed by combining the sociality factor, which evaluates direct and indirect social relationships, and the reputation, which aggregates direct feedback, indirect friend feedback, and non-friend feedback to provide a comprehensive trust value for each service provider) and oversees resource availability, directing service requests to reliable and available nodes to prevent network congestion and boost service reliability. The second fog layer integrates blockchain technology to securely share services, relationships, and trust values across different organizations and service domains, thereby maintaining data integrity and scalability. Through computer simulations, the authors have shown that this architecture significantly enhances service provisioning speed and effectively manages high traffic loads better than conventional methods. Furthermore, the advantage of this multi-layered fog computing approach lies in its ability to reduce the burden on individual IoT devices by distributing tasks. However, managing the communication overhead among multiple fog nodes will be a significant challenge to achieve scalability.
Abdelghani et al. [3] proposed a dynamic and scalable multi-level trust management model (i.e., DLS-STM) tailored to SIoT environments. The model introduces a multidimensional trust framework incorporating user trust (i.e., the user’s ability to deliver reliable services and their honesty in offering truthful and representative feedback and recommendations—composed using key metrics such as credibility, reputation, direct experience, rating frequency, rating trends, similarity, relationship strength, and fluctuation); device trust (i.e., the device’s ability to execute the required service—uses the metrics computing capacity, storage capacity, device security, and energy limitation of a device) and service trust (i.e., the ability of a service to meet the user’s request—uses metrics such as response time, availability, success rate, and latency). The model is designed to be resilient against various trust attacks, such as ballot-stuffing, bad-mouthing, self-promotion, discriminatory, on-off, and opportunistic attacks, etc., through an attack detection module that employs machine learning algorithms (i.e., Naive Bayes, Radial Basis Function Networks, and Multi-Layer Perceptron). Nevertheless, in a large-scale SIoT environment, the employed machine learning algorithms can introduce significant overhead due to their computationally intensive nature [30], potentially overwhelming trusted nodes despite the distributed approach, and this will lead to slower response times and decreased overall system performance as the network grows. A hybrid propagation strategy is used, which combines centralized and decentralized approaches to efficiently disseminate trust values within the SIoT network—by leveraging trustful nodes and distributed hash tables for trust calculations and storage, the model alleviates the computational burden on individual nodes, thereby enhancing scalability. However, the reliance on trustful nodes could introduce potential bottlenecks or single points of failure if an adequate count of trustful/fog nodes are not deployed or present in the SIoT network [31,32].
Sagar et al. [33] argues that most of the existing trust models proposed for SIoT are unable to validate their model due to the unavailability of the datasets. Therefore, they proposed a scalable and robust platform named SCaRT-SIoT. The platform is composed of three layers: the perception layer (sensors, actuators, and edge devices), the network layer (routers and gateways), and the application layer (cloud/servers). SCaRT-SIoT employs various trust metrics such as packet delivery ratio (PDR), social similarity (friendships and communities of interest), and direct trust observations to evaluate the trustworthiness of objects within the network. The platform is demonstrated using Raspberry Pi Zero devices integrated with AWS IoT Core as the edge server. The platform records detailed interaction data between objects, including the time of interaction, the IDs of interacting objects, packets forwarded and dropped, PDR, friendships, and community affiliations. However, the platform’s scalability is poorly validated due to its reliance on external cloud services such as AWS IoT Core—in real-world scenarios, network latency and potential cloud service downtime could drastically impair the platform’s ability to handle large volumes of data in real time; the use of basic hardware like Raspberry Pi Zero devices for prototype validation—though these low-cost devices are suitable for basic tasks, they are not indicative of the diverse and often more resource-intensive hardware found in practical SIoT deployments; and the lack of comprehensive performance analysis including stress and load testing to evaluate the platform’s performance under high data loads and increased numbers of connected devices.
Magdich et al. [34] proposed a hybrid trust update method that combines event-driven and time-driven approaches to adapt to the evolving behaviors of SIoT nodes, thereby maintaining accurate and reliable trust scores within the SIoT environments. In addition, the model employs a decentralized architecture for trust propagation, distributing the computation and storage of trust metrics across the network to enhance scalability and reduce the risk of bottlenecks and single points of failure. Experiments are conducted to demonstrate the model’s theoretical scalability by showing that it can maintain high accuracy, precision, recall, and F-measure values even as the proportion of malicious nodes increases. However, the evaluation does not fully capture the complexities and challenges of scalability in real-world SIoT environments such as communication overhead, computational load, varying network conditions, etc.
Rouzbahani and Taghiyareh [35] proposed a scalable trust management system (i.e., SCoTMan) for SIoT that leverages smart contracts and social interactions using the hyperledger fabric platform to calculate both direct and indirect trust values. Direct trust is computed using a Bayesian approach with exponential decay based on satisfaction feedback, while indirect trust is calculated using recommendations from nodes selected on the basis of social metrics such as friendship, interest, and contact similarity, all measured using the Jaccard similarity coefficient. SCoTMan minimizes computational and storage overhead by selectively storing the relevant interaction records. Furthermore, the model incorporates memory constraints to limit the total storage cost by capping the number of memory units each user can use, ensuring that storage remains manageable and scalable as the network grows. The scalability of SCoTMan is validated through experiments under different transaction rates (from 10 to 400 transactions per second) and storage limitations (by setting the maximum number of memory units per user to 10 and 20, as well as an unlimited condition, to ensure efficient operation under real-world constraints). However, the model’s performance under high node turnover rates, which are common in SIoT networks, can lead to frequent recalculations and increased overhead affecting the overall scalability of the model.
Jung et al.’s [4] TASS (i.e., trust augmented social strength framework for SIoT service composition) integrates a social strength metric (e.g., shared usage and spatial proximity) with adaptive trust estimation that combines time-decayed direct evidence and socially weighted indirect recommendations from socially similar peers, thereby enabling decentralized partner selection in SIoT and, in principle, supporting reduced coordination overhead, distributed decision making, and resilience against malicious entities/attacks, which are all vital features for achieving scalability in large, heterogeneous SIoT environments. Older interactions gradually lose influence, while the system adaptively balances personal reliability with community reputation. Nonetheless, their scalability claim remains insufficiently substantiated, and its real-world scale is unclear because there is no empirical analysis of computational and communication costs in large, dynamic networks. Key hyperparameters (i.e., ,,,) are tuned but not stress tested for changing networks or uneven connections.
Moeinaddini et al. [6] proposed a decentralized, self-adaptive trust model (SATM-SIoT) that offloads trust computation to fog nodes, augments local MLP classifiers with federated learning (FL), and employs a MAPE-K loop to adapt the “malicious” threshold based on observed hostility. The authors aimed to couple scalability with adaptivity and resource awareness in SIoT. Each potential service provider is scored using a small set of signals: social connection strength, position in the network, the past reliability of recommenders, a simple capability class for computing and energy limits, and four behavior measures that capture overall quality, usefulness, steadiness, and fluctuation; these signals feed a small neural network on the edge server that classifies providers into broad trust levels, with short rolling histories to cap cost, and repeated bad behavior eventually triggers blocking; periodically the edge servers aggregate their local models so future classifications benefit from wider experience. However, there is no clear accounting of computation, memory, or network overhead per request or per model sharing round; the evaluation is limited to a small simulated setup with optimistic assumptions about reliable links and honest infrastructure. Coordination across edge servers, especially how block decisions propagate and recover, is underspecified, and key thresholds, history sizes, and capability classes are set heuristically without sensitivity or stability analysis.
The presented review covers a spectrum of studies, from early trust management models to recently developed models and platforms for SIoT as detailed in Table 1, with a particular emphasis on scalability. Several key insights have been identified: most trust models, such as [25,26,28], emphasize the aspect of scalability but often fall short in real-world validation and handling large-scale SIoT networks effectively. While real-world validation is feasible, the unavailability of suitable SIoT validation environments poses a significant barrier. Therefore, the proposed work evaluates scalability in a simulated SIoT environment comprising 10,000 nodes. Architectures proposed by [28,29] enhance scalability through centralized and fog-based approaches, yet they fail to address the extensive coordination and overhead issues inherent in such deployments. The proposed trust model (i.e., MMTE) is designed to be lightweight, thereby mitigating the overhead concerns indicated in these studies. Abdelghani et al. [3] presents a scalable model utilizing machine learning but faces potential bottlenecks due to the computational demands of these algorithms. In contrast, the MMTE model avoids computationally complex mechanisms while composing, computing, and aggregating trust or making trust decisions. Sagar et al. [33] demonstrates a platform with practical scalability but is constrained by its dependence on external cloud services and basic hardware, which may not scale efficiently in diverse real-world SIoT environments—the proposed mechanism (i.e., trust spheres) ensures scalability without dependence on external services. The performance of Rouzbahani and Taghiyareh [35]’s model decreases as the node turnover rate increases; conversely, the MMTE model and trust spheres together are engineered to maintain robust scalability ensuring consistent performance despite fluctuations in the node turnover rate. Furthermore, the models (e.g., [3,25,26,28]) have demonstrated their utility in separating malicious nodes from benign ones; MMTE enhances this capability by ensuring more accurate identification of malicious behavior or entities. Moeinaddini et al. [6] made optimistic assumptions regarding trustworthy links, and Jung et al.’s [4] claim of improved scalability remains insufficiently substantiated; however the proposed MMTE model makes no such assumptions and evaluates scalability with a varying number of nodes. In conclusion, while advancements have been made, the practical scalability in large and resource-constrained SIoT environments remains a critical challenge to be addressed, necessitating further research and optimization.

Table 1.
Comparison of Scalability Focused SIoT Trust Models.
2.2. Lightweight Trust Management Systems for SIoT
Cai et al. [24] proposed TIRec (i.e, a lightweight trust inference model), which integrates direct and indirect trust relationships with rating data to enhance service recommendations by introducing a user-weighted centrality metric and employing a lightweight trust path selection algorithm to infer indirect trust relationships effectively countering malicious behaviors and improving recommendation accuracy. Experimental results on three real-world datasets demonstrate that TIRec outperforms existing methods, particularly in scenarios with sparse data and cold start users. The path selection algorithm however uses breadth-first search and constructs offline dictionaries for all users to store comprehensive weighted centrality values. While these processes are intended to be performed offline, the initial computation and storage requirements can be significant, especially in large-scale SIoT networks with many users and trust relationships.
Amiri-Zarandi et al. [20] proposed LBTM (i.e., a lightweight trust evaluation scheme for SIoT utilizing social information of IoT entities and smart contracts on an Ethereum-based private blockchain). Trust in LBTM is computed by combining direct and indirect trust evaluations; direct trust is updated based on feedback from interactions using a time decay factor, while indirect trust is calculated as a weighted average of trust evaluations from other nodes (counselors), with weights determined by social ties and past interactions. The overall trust value is then a weighted sum of these direct and indirect trust values. However, the continuous updating and calculation of direct and indirect trust values require significant computational resources. The trust path selection algorithm and the generation of counselor lists, which involve the computation of social ties and dynamic updates, impose additional processing burdens. Therefore, these processes can strain the limited computational capacities of IoT devices, particularly in large and dynamic SIoT networks.
Hasan et al. [36] target routing in socially oriented and opportunistic IoT and propose a trust-based next-hop selection scheme that fuses two local signals [i.e., social interest compatibility and behavioral reliability via probabilistic inference (i.e., Bayesian updates with Jeffrey’s conditioning)], thereby minimizing computation, memory, and messaging overhead on resource-constrained SIoT. The scheme emphasizes lightweightness by relying only on locally available, firsthand information and single-hop decision making rather than global reputation exchange. Despite the local design, the model maintains a per-interest, per-neighbor state and performs floating-point probability updates; but the work does not quantify RAM per neighbor or MCU-level cycle/energy costs.
Jmal et al. [37] introduced a hybrid trust framework that combines zero-knowledge proofs (ZKPs) for authentication and FL for trust evaluation within SIoT environments. To compute trust, each node locally trains on six lightweight metrics including reputation change rate, rating consistency, rating disparity, temporal rating pattern, negative rating ratio, and proximity-based rating similarity, to classify interactions as normal or malicious. These local model weights are then aggregated into a global trust model via a blockchain coordinated consensus (i.e., FedProx-inspired), enabling decentralized trust evaluation without sharing raw data. This process produces each node’s trust value while preserving privacy and minimizing data transmission. From a lightweightness perspective, this study achieves modest gains through compact proof structures and selective feature sets, but remains computationally heavy in the key generation, model training, and synchronisation phases.
Lightweight solutions for SIoT are available, providing various applications such as securing communications within SIoT networks [38], and implementing privacy-preserving protocols for vehicle-to-grid (V2G) applications in SIoT [39,40] etc. On the other hand, several lightweight trust management systems for IoT, e.g., [19,21,41,42,43] also exist; however, they often do not consider the contextual information inherent in the SIoT environments, such as types of social relationships, interaction history, user preferences, dynamic network topology, etc. Thus, this review is confined to lightweight trust management systems specifically designed for SIoT (summarized in Table 2). It is also noteworthy that most trust management systems in SIoT do not emphasize lightweightness as a key design feature and are more focused on the comprehensive/accurate trust evaluation while ignoring the resource constraints associated with the SIoT paradigm.
Table 2.
Comparison of Lightweightness Focused SIoT Trust Models.
In addressing the challenges of trust management in heterogeneous networked systems such as SIoT, a fundamental dichotomy is always confronted: the comprehensiveness of trust assessment versus resource constraints in data collection, processing, storage, and dissemination [44]. Mostly, trust management frameworks tend to amass extensive records of trust-related data (e.g., opinions/feedback, data regarding prior trust transactions, and data regarding network structure/proximity, etc.). While it is irrefutable that a richer set of trust metrics can potentially yield more accurate trust evaluations, this approach invariably demands significant resource allocation, which is not always possible in the SIoT networks due to limited computational power, energy consumption, memory constraints, communication overhead, scalability issues, and device heterogeneity, etc. Recognizing the necessity to balance thoroughness with efficiency, this work advocates for a strategy that prioritizes the collection of minimal data required for effective trust assessment. To this end, a novel concept of ’micro-moments’ is introduced—concise yet informative snapshots of interactions/moments. This approach narrows the focus to pivotal interactions, streamlining the trust assessment process while maintaining its integrity and relevance. This approach not only aligns with the resource constraints inherent in heterogeneous systems such as SIoT but also offers a pragmatic solution to achieving a balanced and resource-aware trust evaluation. Moreover, as observed with some reputation-based trust management systems, there is a risk of manipulation through Sybil attacks or false feedback. By focusing on direct observation of the device’s behavior in micro-moments, MMTE inherently reduces its vulnerability to such attacks, enhancing the robustness of trust assessments. Furthermore, while many existing systems quantify trust based on the volume of interactions (e.g., frequency of communications or amount of data exchanged), MMTE emphasizes the quality of interactions. This approach recognizes that a few significant interactions can be more telling of a device’s trustworthiness than numerous trivial exchanges because significant interactions often encompass critical tasks that directly impact performance, making them more indicative of a device’s true trustworthiness than a high volume of less consequential activities. While MMTE aims to minimize data collection to enhance efficiency, there is a delicate balance to maintain as insufficient data could lead to incomplete or inaccurate trust assessments.
3. MMTE: Micro-Moment Trust Evaluation Model for SIoT
MMTE is designed to evaluate the trustworthiness of SIoT devices by observing and analyzing micro-moments in their interactions. These micro-moments are short, context-specific instances where data or communication exchanges occur and capture essential aspects of device behavior that can indicate reliability and trustworthiness. MMTE leverages the high frequency, informative, and repetitive nature of such interactions in SIoT enabling a dynamic and granular trust assessment that is also computationally lightweight.
3.1. Interaction Initiation (II)
- Moment: When a device initiates communication with another device (e.g., to provide services to another peer in the network).
- Significance: Indicates how frequently the device seeks to interact with other peers, which indicates its intent to collaborate within the SIoT network.
- Computation:where Total number of Initiations represents how many times a device has started interaction with another peer in the network, Observation Period is the sample period taken, and SF (significance factor) reflects the impact of each type of interaction within the SIoT environment. For example, higher values will be assigned to the interactions that are crucial for network functionality or collaboration (e.g., service provision, relationship establishment, etc.).
3.2. Response to Requests (RTR)
- Moment: When a device responds to service requests in a SIoT environment.
- Significance: Assesses the reliability and timeliness of the device’s response, which is crucial in a service-oriented environment such as SIoT.
- Computation:where is the average response time of device i—this metric assigns higher trustworthiness to nodes with shorter response times, reflecting an inverse relationship between the two.
3.3. Recency of Interactions (RoI)
- Moment: Captures the interaction’s temporal relevance at the time it is being performed.
- Significance: By measuring how frequently a device accesses or provides up-to-date versus outdated information, this metric helps infer the device’s trustworthiness and its preference for fresh data within the SIoT network.
- Computation:where i represents the identifier for each device, is the total number of requests made by device i, and is the time difference for the jth request of device i, indicating how many days/weeks back the requested data pertains to—lower values indicate a preference for more recent data, and more recent interactions indicate higher trustworthiness.
3.4. Error Ratio (ER)
- Moment: When a device encounters an error or irregularity in itself.
- Significance: Provides insights into the robustness and self-awareness of the device, which are key and common aspects of assessing trustworthiness.
- Computation:The exponential decay function ensures that more errors lead to a significantly lower trustworthiness score. Where is a scaling factor and ErrorCount is the number of errors recorded for device i.
3.5. Device Behavior (DB)
- Moment: Monitor and capture device behavior with respect to the given time bins.
- Significance: Abrupt changes in device behavior can signal potential issues (such as trust attacks) or operational malfunctions. Conversely, a uniform pattern of interactions are characterized by a low standard deviation indicating a high level of device reliability.
- Computation:where is the standard deviation of interaction counts per time bin for device i. The standard deviation inversely relates to the trustworthiness score; however, 1 is added to avoid division by zero.
3.6. Spatial Time Consistency (STC)
- Moment: Records the locations of devices and the moment they initiated their interactions within the SIoT network.
- Significance: The longer a device remains at a location, the more trustworthy it is perceived to be, as it has had time to interact within the SIoT network and allow other peers to observe and evaluate its behavior.
- Computation:where is the spatial time consistency score for device i. represent the total time device i spends at location , calculated as the sum of durations between consecutive measurements at this location. is the total operational time for device i across all locations, which is the sum of for all coordinates. The max function operates over all location coordinates , selecting the location where the device spent the greatest proportion of its operational time as the basis for the consistency score.
3.7. Dynamic Assignment of Weights Based on Heuristics
Once all the micro-moments described above against each SIoT device are captured, they must be aggregated into a single trust value. Therefore, a dynamic weighting method based on the heuristics below is employed for weighting these micro-moments. Each device in the SIoT network potentially operates under different conditions, interacts with different nodes, and performs different operations. The following dynamic weighting approach enables the MMTE trust model to consider these individual differences by adjusting weights based on real-time data. This results in a more personalized trust score that accurately reflects the specific context and performance of each device. In each of the heuristics below, the weights either increase or decrease by 5%, 3%, or 2% based on the sensitivity analysis indicating that adjustment is optimal for reflecting significant but not overly drastic changes in the device behavior relative to the median or mean values—smaller adjustments (e.g., 1%) did not sufficiently capture meaningful changes, while larger adjustments (e.g., 10%) resulted in excessive volatility in the trust scores. Furthermore, by examining interaction logs, response times, behavioral patterns, and location data from the Lysis dataset [45] (i.e., a data extracted from a real SIoT environment), baseline metrics (medians and averages) for each heuristic were established. These baselines served as reference points for the described weights adjustment. The selection of this simple approach for weight calculation is intended to avoid introducing unnecessary complexity because the aim is to design a lightweight trust evaluation scheme; therefore, design decisions are carefully made.
- Heuristic # 1: Interaction Initiation (II) score is assigned a higher weight (i.e., 0.20) initially because frequent initiators in SIoT are often crucial for information dissemination in SIoT networks. The value 0.20 signifies that initiating interactions constitutes about 20% of the total trust factor, a value determined through analysis of interaction frequencies and their impact on the network dynamics. Subsequently, during trust assessments, if a device’s IIS surpasses the median across all network devices, its weight increases by 5%. Conversely, if the II score is below the median, the weight decreases by 5%.
- Heuristic # 2 Response to Requests (RTR) is also initially given a weight of 0.20, reflecting its significant role in determining the operational efficiency and reliability of devices within the SIoT networks. For later assessments, if a device’s RTR is faster than the median response time of all devices in the network, its weight is increased by 5% to reflect its superior performance. If it is slower, the weight is decreased by 5% acknowledging potential delays or inefficiencies in its operations.
- Heuristic # 3: Recent activity is a better indicator of current device state and intent than older interactions, which may no longer reflect the device’s current operating context. Therefore, Recency of Interaction (RoI) carries a base weight of 0.15 initially, emphasizing the value of recent and timely data in assessing the trustworthiness of a device. At the time of trust evaluation, devices with interactions newer than the median of all devices receive a 5% increase in their RoI weight. Conversely, devices with older interactions see a 5% decrease in weight, reflecting the decreased relevance of their data.
- Heuristic # 4: Error rate (ER) is again assigned a base weight of 0.20 initially, acknowledging the critical impact of error rates on device trustworthiness in the SIoT networks. This weighting accounts for approximately 20% of the total trust evaluation, with the recognition that devices with lower error rates are fundamentally more dependable. The weight of ER is adjusted based on its performance relative to the average; devices with error rates lower than the average have their ER weight increased by 5%, while those with higher error rates have it decreased by 5%, directly reflecting their operational reliability.
- Heuristic # 5: Device behavior (DB) has a base weight of 0.15, underscoring the importance of consistent and predictable operational patterns in assessing device trustworthiness. This weight, which contributes 15% to the overall trust evaluation, demonstrates that consistent behavior is a reliable indicator of device security and functional integrity. If a device’s behavior is more consistent than the mean level observed across the network, its weight is enhanced by 3%. If its behavior is more variable, the weight is reduced by 3%, accounting for potential reliability concerns.
- Heuristic # 6: Spatial Time Consistency (STC) is initially weighted at 0.10, reflecting the importance of physical location stability in the trustworthiness assessment of SIoT devices. This weight suggests that spatial consistency accounts for 10% of the trust factor, based on evidence that stable location histories correlate with reduced risks of tampering and higher operational predictability. Therefore, devices that demonstrate greater location stability than the average increase their STC weight by 2%, while those with less stability see a reduction of 2%.
When one weight increases above the median or mean, the normalization process ensures that the sum of all weights remains 1 by dividing each weight by the new total sum, thereby increasing the proportion of the adjusted weight and slightly decreasing the proportions of the others:
Finally, the overall trust score is computed by multiplying the value of each micro-moment by its corresponding weight and then summing these products. The overall MMTE trust evaluation framework is represented in Figure 1.
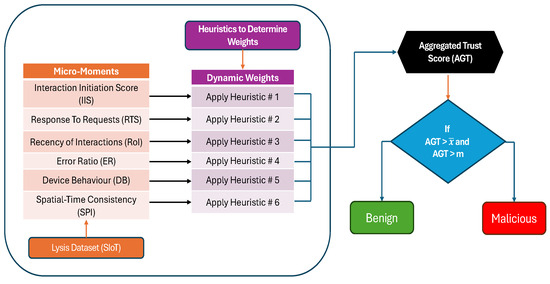
Figure 1.
MMTE Trust Evaluation Framework.
3.8. Illustrative Example: Dynamic Weight Assignment
This example illustrates how the weights are dynamically adjusted based on the values of micro-moments using the described heuristics. Consider two devices, (i.e., a static temperature sensor) and (i.e., a mobile user device), monitored over the same interval ‘T’. frequently initiates interactions (i.e., IIS above the network median), responds faster than the median (i.e., high RTR), has an error rate lower than the average (i.e., low ER), exhibits low variance in its interaction pattern (i.e., high DB score), and operates of the time at a single location (i.e., high STC). According to the heuristics described above, the weights of IIS, RTR, ER, DB, and STC for are slightly increased (by and , respectively) before normalization, leading to an aggregated trust score close to . In contrast, initiates fewer interactions, replies slower than the median, shows a higher than average error rate, exhibits bursty interaction behavior (i.e., high , hence a low DB score), and is distributed across multiple locations with none being dominant (i.e., a low STC score). Its corresponding weights are reduced by the same heuristic rules, and MMTE yields a substantially lower trust score close to 0.3–0.5.
4. Simulation and Evaluation
The Lysis dataset [45] is used to extract the above-detailed micro-moments, which are captured directly by the Lysis SIoT platform; the recorded values reflect the real-world device interactions. Lysis encapsulates over 11,000 queries made by 154 SIoT devices, including smartphones and Raspberry Pi boards, interacting with up to five distinct applications over seven months, from April to October 2017. It records each query’s POSIX timestamp, the requesting device, the targeted application, and normalized spatial coordinates, alongside the temporal difference from the request day. The Lysis dataset is primarily considered for evaluation because it offers data that is produced by an operational SIoT platform rather than synthetic generation. Furthermore, the dataset offers a consistent, well-documented schema (i.e., POSIX timestamps, explicit device/app IDs, and normalized spatial fields) that is required to evaluate the MMTE framework, which also facilitates reproducibility.
4.1. Computation of Micro-Moments
The Interaction Initiation Score for each device is calculated (i.e., the first request made by a device to any application within a specified observation period marks the commencement of an interaction). Each application is assigned a significance factor (ranging from 0.5 to 1.0—these factors are assigned considering the utility and criticality of the application) to reflect its importance in influencing the IIS. Following the assignment of these factors, the IIS for each device is computed using the formula defined in the MMTE trust model above. To compute Response to Requests for each device, response times are produced based on the specific assumptions reflecting the typical operational conditions in such settings, given the dataset contains neither direct nor indirect data for this computation. Response times are usually influenced by network conditions, device capabilities, operational load, and environmental factors. Therefore, devices are segmented into three performance classes: high, medium, and low. High-performance devices, typically newer smartphones in optimal network conditions were assumed to have the fastest response times with a mean of 5 seconds and a standard deviation of 2 seconds. Medium-performance devices were modeled with response times averaging 10 seconds and a standard deviation of 5 seconds, and low-performance devices, such as older Raspberry boards or those in poor network environments, were assumed to have a mean response time of 15 seconds and a standard deviation of 10 seconds—the specific response times and standard deviations are determined through a combination of empirical data. Thereafter, merging data from various applications, simulated response times based on device classification, and computed average response times, scores for each device were derived—this metric inversely relates shorter response times to higher trustworthiness scores, thereby denoting greater reliability and timeliness in responding to requests. Subsequently, the Recency of Interaction for each device is computed using the data available in Lysis (i.e., t_t0 contains the record of temporal difference from the request day/time). Therefore, the mean interaction timestamp for each device (i.e., ‘Average t_t0’) is first computed. A trust score is then derived from this mean by employing an inversion method, where 1 is divided by ‘Average t_t0’—more recent interactions indicate higher trustworthiness. To ensure consistency in scale, these inverted scores are normalized to a range between 0 and 1. The data regarding the error rates corresponding to each device is again not directly available within Lysis. Therefore, to augment real-world data with synthesized error information aiming to assess the reliability of these devices (i.e., smartphones and Raspberry Pi boards) across various applications, realistic error probabilities are assumed and assigned to each application based on their operational characteristics and the devices they were deployed on—1.5% for Battery Level, 3% for Data Viewer, 2% for OBD Car, 3% for Be Right Beach, and 2.5% for Nautical Data—highlighting their reliability and advanced capabilities. Recognizing the inherent reliability differences between smartphones and Raspberry Pi boards, these probabilities are tailored to reflect lower error rates for smartphones given their advanced processing capabilities. Conversely, Raspberry Pi devices were assigned relatively higher error probabilities—7% for Data Viewer, 6% for Be Right Beach, and 5.5% for Nautical Data—acknowledging their varied performance across different Raspberry models and tasks. Through a simulation of 11,000 queries, distributed across the applications and device types, error occurrences are generated based on the predefined probabilities. Thereafter, these errors are aggregated to compute the total error count for each device type, subsequently calculating their respective error rate, where , which is a tunable parameter that adjusts the metric’s sensitivity to the total error count observed for each device type, is kept at 0.01 for initial evaluation. Next, the devices’ interaction patterns captured within the Lysis dataset are used to compute the score against Device Behavior. For this, the date/time values are segmented into weekly time bins. This temporal categorization facilitates the aggregation of data to observe interaction patterns over time. The frequency of device interactions within each time bin is calculated, yielding a distribution that indicates how actively each device interacts or communicates over the analyzed periods. Afterward, the standard deviation of interaction counts for each device across the different time bins is computed. This measure of variability serves as a basis for assessing the consistency of device behavior, with lower variability suggesting more predictable and reliable interactions. To transform this variability into a trustworthiness score, the trust score is inversely related to the standard deviation. Finally, to compute the spatial time consistency index for each device data available in the Lysis is sorted by device and date/time to calculate the duration between consecutive data entries, identifying how long each device stays at particular coordinates. Durations are aggregated by device and location, and each device’s total duration across all locations is calculated to normalize these values. The maximum normalized duration per device is extracted as the spatial Consistency score, reflecting the proportion of time a device spends at its most frequented location.
4.2. Comparison in Terms of Resource Usage
To evaluate the lightweightness of the MMTE model, comparisons are first made with two recently published non-lightweight trust models with distinct applications: one is designed for establishing trustworthy rational friendships in the SIoT networks [46], and the other for detecting and preventing on–off and ballot-stuffing attacks in the SIoT environments [47]. Overall, there is a limited number of trust evaluation models designed for SIoT that clearly document their resource consumption (i.e., in terms of memory, CPU time, and disk space). The said models (i.e., [46,47]) were however selected because they address key and diverse aspects of trust management in SIoT environments, making them ideal benchmarks for evaluating resource consumption. It is important to note that these non-lightweight trust models are effective in their respective trust management applications, but require substantial resources. Demonstrating that the MMTE model can achieve improved trust management performance with much lower resource consumption underscores its suitability for deployment in resource-constrained SIoT environments. Three key performance metrics were analyzed to assess the MMTE model: CPU time, memory usage, and disk usage. CPU time refers to the duration the CPU takes to compute the overall trust scores. Memory usage is the amount of RAM the model requires during its operations, and disk usage is the storage space required by the particular model.
4.3. Resource Consumption Comparison with Non-Lightweight Trust Models
In Figure 2, the MMTE model is labeled as ‘MMTE’, the model from [47] as ‘TA model’, and the model from [46] as ‘SRIoT’. The first subplot illustrates the CPU time required by each model to compute the overall trust scores. It can be seen that the MMTE model is substantially more efficient, requiring only 0.25 seconds. In contrast, the SRIoT model takes 4.58 seconds, while the TA model is the most resource-intensive, demanding the longest CPU time. Likewise, the MMTE model uses the least memory and disk space compared to the other models evaluated. It is important to note that while the SRIoT model requires less disk space, it consumes 10 times more RAM than its disk usage; this high RAM requirement is due to the generation of numerous temporary variables needed for the trust metric computations. Moreover, [46] explicitly mentions that the trust metrics computed in the SRIoT model were only for 70 nodes, and later the model was also evaluated against the same number of nodes. Considering the high RAM usage for so few nodes, the memory requirement would escalate dramatically in an SIoT network comprising hundreds of devices. The TA model is the most resource-intensive. This is primarily due to its reliance on a large dataset to compute the trust metrics specified and the machine learning methods employed to separate malicious nodes from benign nodes. Therefore, a sizable dataset is necessary to train the machine learning models effectively; without adequate data, there is a risk of the model either underfitting or overfitting, potentially leading to inaccurate classification results. Given the analysis above, it is clear that the MMTE model is significantly lightweight compared to other existing models designed for SIoT. Its minimal CPU, memory, and disk usage make it particularly suitable for resource-constrained devices.
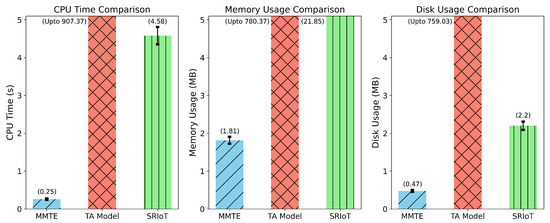
Figure 2.
Resource Consumption Comparison of MMTE with Non-Lightweight SIoT Trust Models (i.e., TA Model [47] and SRIoT Model [46]).
4.4. Complexity Comparison with a Lightweight Model
To further strengthen the claim, the time complexity of the MMTE model is explicitly derived and compared with the reported time complexity of [24] to demonstrate its lightweight nature relative to a benchmark model. Let n denote the number of transactions processed by MMTE. The primary operations involved in the MMTE model include reading data, transforming data, and performing basic aggregations, all of which are , indicating linear complexity.
In addition, the model performs sorting operations with worst-case theoretical complexity;
Therefore, the total time complexity of MMTE is
In practice, the observed performance tends to be closer to linear because sorting is often applied to subsets of the data and due to optimizations in the libraries used (i.e., Pandas and NumPy). However, the total complexity of the model in [24] is
because the model incorporates several complex operations such as building offline centrality dictionaries, trust path searching, calculating next-hop neighbors, and matrix factorization, which involves iterative calculations over three dimensions of data (i.e., ratings, direct trust, and indirect trust). The presence of logarithmic () and multiplicative iterative factors () indicates that the computational load will increase significantly with the complexity of the network and the data dimensions involved. Hence, the MMTE model is significantly lightweight compared to the model described in [24]. It achieves efficient performance through simpler operations that scale at most as , and typically close to , making it suitable for tasks requiring high-volume data (e.g., trust computation for heterogeneous SIoT networks).
4.5. Performance Evaluation of MMTE
The performance of MMTE is first evaluated by examining the impact of modifications to the trust parameters on its effectiveness. Initially, a strict criterion is employed based on the mean and median of aggregated trust scores (i.e., nodes are classified as “benign” if their aggregated trust score exceeds both the mean and median trust scores calculated across all nodes in the network, if a node’s score does not surpass these central tendencies, it is classified as “malicious”). This classification approach uses both the mean, which is the average of all scores and the median, the middle value of the sorted trust scores. This dual threshold ensures a conservative assessment, guarding against the influence of outliers and ensuring that only nodes demonstrating consistently higher trustworthiness are classified as benign. Moreover, this criterion offers robustness against outliers and adapts dynamically as network conditions change, with mean and median values recalculating as new data becomes available. In the evaluation below, the existing micro-moments’ values are increased or decreased, predominantly by 20%; this specific magnitude of change was selected to ensure the observation of statistically significant effects, while also maintaining practical relevance to real-world scenarios. After this classification, the distribution of nodes is illustrated in Figure 3.
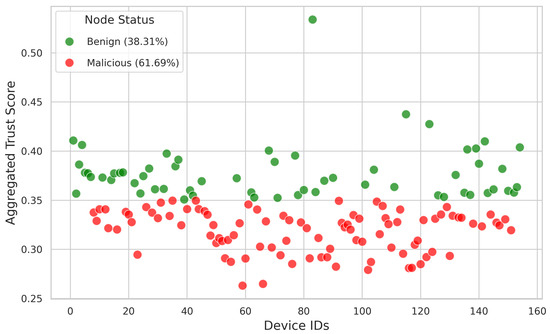
Figure 3.
Node Classification Based on Mean and Median of Aggregated Trust Score.
The trust parameters used for the Interaction Initiation Score (IIS) are first modified and detailed in Table 3 to observe their impact on the aggregated trust score. It is important to recall that Lysis consists of five applications and each application has been assigned a hypothetical significance factor considering the utility and criticality of each application to compute the IIS of each device. The significance factors for each of these applications are first increased by 20% of the existing value, although the maximum value is capped at 1; applications that already have the maximum significance remain unchanged. Once the modifications are applied, it becomes clear that an increase in the IIS positively impacts the overall trustworthiness score of the devices. As depicted in Figure 4, almost 6.5% of the devices have shifted from malicious to benign. Conversely, reducing the significance factors by 20% of the existing value negatively impacts the overall trustworthiness score of the devices, therefore the count of malicious devices is increased within the network by 5.84%. The remaining trust parameters to compute IIS, such as interaction count and observation time, are kept unchanged during the analysis as they are derived from a real SIoT environment.
Table 3.
Significance Factors Used for Interaction Initiation (II).
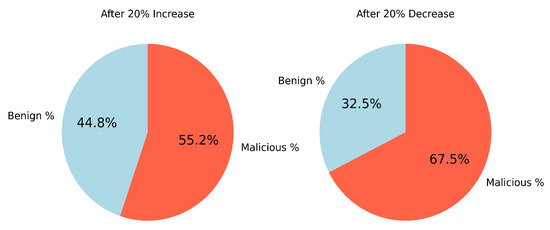
Figure 4.
Impact on II after adjustments are made to the significance factors of interaction initiation.
For Response to Requests, the trust parameters utilized are the mean response time and standard deviation for each device. These values are first increased by 20% from their existing levels and then decreased by 20% from the original values to examine their influence on the overall trust score. Table 4 outlines the specific values used. The analysis shows that an increase in the response times of devices negatively impacts their overall trust scores, leading to a 1.3% decrease in the number of devices classified as benign within the network. Conversely, a decrease in response times results in a 3.25% increase in the number of devices categorized as benign (see Figure 5). A question may arise regarding why the impact on trust scores varies despite increasing and decreasing the values of trust parameters by the same ratio (i.e., 20%). The variation is due to the dynamic weights assigned to these parameters. These weights are adjusted based on the current value of the micro-moments, which means that even uniform changes in the trust parameters can lead to different effects on the overall trust score.
Table 4.
Trust Parameters Used For Response To Requests.
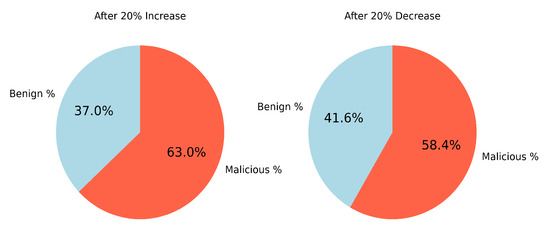
Figure 5.
Impact on RTR after adjustments are made to the significance factors of interaction initiation.
The error rates for the devices used were calculated through a simulation. To assess the impact of changes in these error rates on the aggregated trust scores, the error rates for both smartphones and Raspberry Pi boards were first increased, as detailed in Table 5, and subsequently decreased. Specifically, increasing the error rate by 5% for smartphones and 15% for Raspberry Pi boards resulted in a significant shift, with approximately 11.69% of the devices changing from benign to malicious. Conversely, reducing the error rate by 50% from the initial value led to a 9% increase in the number of devices classified as benign (see Figure 6). This analysis demonstrates that the MMTE model is highly sensitive to errors produced by devices, leading to significant fluctuations in trustworthiness scores when error rates vary.
Table 5.
Error Rate Adjustments.
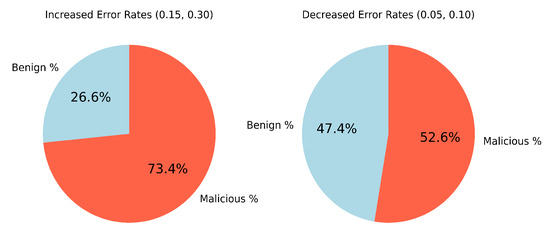
Figure 6.
Impact on ER of Trust Parameters Adjustments.
In the initial analysis, device behaviors were monitored within weekly time bins. To explore the effects of varying the duration of observation periods, the analysis has been extended to include shorter (daily) and longer (monthly) time bins. Recalculation of device behavior using daily bins revealed a 3.9% increase in the proportion of nodes classified as benign. Conversely, extending the observation period to monthly bins resulted in a 3.25% decrease in benign nodes (see Figure 7). These findings suggest that the length of the monitoring period significantly influences the accuracy of device behavior assessments, with longer intervals yielding more consistent and reliable evaluations due to the comprehensive aggregation of data and reduced impact of short-term anomalies. No tunable trust parameters were employed in the calculation of Recency of Interaction (RoI) and Spatial Time Consistency (STC) micro-moments. Therefore, an increase in their values leads to a rise in the aggregated trust score, while a decrease results in a negative impact on the score.
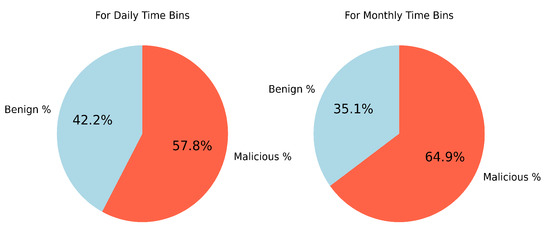
Figure 7.
Impact on DB of Trust Parameters Adjustments.
4.6. Evaluation of MMTE in a Smart Home Building
The accuracy of MMTE model in classifying benign and malicious nodes within a simulated smart home building is assessed. The smart home is a realistic SIoT environment where various devices interact, generating data to compute the micro-moments. A simulated smart home building comprising 154 devices (same as Lysis Dataset), including smart lights, thermostats, cameras, and speakers is created. Each device’s behavior is monitored over a period of 8 weeks to collect data for the micro-moments. The behavior of the 120 benign nodes (micro-moments for benign nodes are generated using normal distributions with higher mean and median values) and 34 malicious nodes (micro-moments for malicious nodes are generated using normal distributions with relatively lower mean values and higher error rates) is simulated. Thereafter, the aggregated trust score for each node is computed using the same weighting heuristics described above. Subsequently, a node was classified as benign if its aggregated trust score was above both the mean and the median, and as malicious otherwise. This approach, however, resulted in a significant misclassification of nodes. The confusion matrix obtained in Figure 8 with these criteria revealed a high number of false negatives (benign nodes incorrectly classified as malicious), resulting in an overall accuracy of 71.14%. This is because of the significant overlap between the trust scores of benign and malicious nodes around the median threshold led to a substantial number of benign nodes being misclassified, resulting in reduced accuracy.
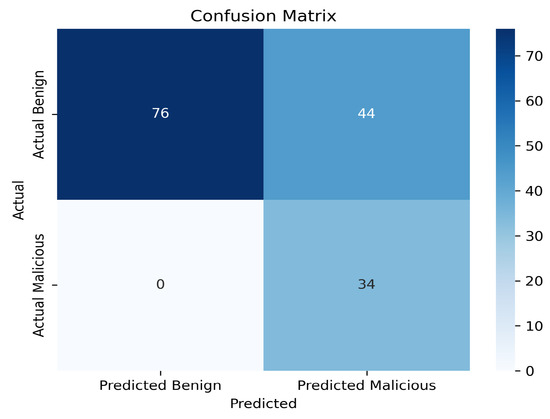
Figure 8.
Confusion Matrix with Mean and Median Criteria.
To address this issue, Youden’s J statistic was employed to find an optimal adaptive threshold that maximizes the difference between the true-positive rate (sensitivity) and the false-positive rate (1-specificity). This method finds the optimal threshold to classify benign and malicious nodes by computing the following:
- ROC Curve Calculation: The ROC curve is generated using the true-positive rate and false-positive rate for various thresholds.
- Youden’s J Statistic: Youden’s index [48] (i.e., J = sensitivity + specificity − 1) was calculated for each threshold. The threshold that maximized Youden’s index was selected as the optimal threshold.
It can be seen from the confusion matrix in Figure 9 that the optimal threshold identified using Youden’s method was extremely effective in separating benign and malicious nodes, significantly improving the classification accuracy (i.e., 99.35%). While these results are promising, it is important to note that they are based on simulated data, and real-world performance may vary due to factors such as noise in the data and the variability of node behaviors. To further assess the suitability of Youden’s optimal threshold and evaluate the accuracy of MMTE, the model was run 10 times for unique data and the aggregated trust scores of the devices were computed using the same criteria as described; the resulting average classification accuracy is 99.12%.
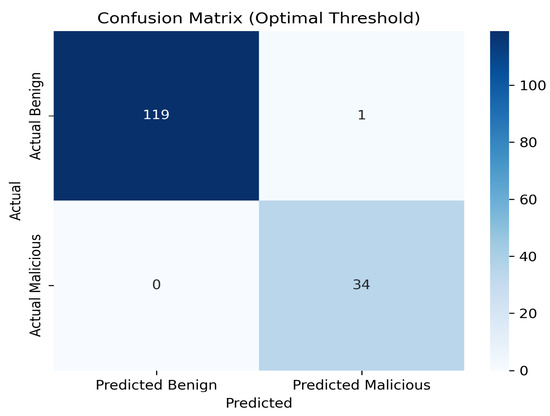
Figure 9.
Confusion Matrix After Using Optimal Threshold.
Table 6 below outlines a comparison of classification accuracy, precision, recall, and F-measure with the studies reviewed in the related works section above. It can be clearly seen how MMTE outperforms all of them in terms of classifying malicious and benign nodes.
Table 6.
Comparison of MMTE Classification Metrics with the Reviewed Related Works.
5. The Trust Spheres
The SIoT ecosystem is conceptualized as a collection of spheres, each sphere symbolizes a cluster of devices bound by a common trust attribute (i.e., aggregated trust score similarity computed from the MMTE model above). This approach simplifies the process by creating dynamic spheres of devices, significantly reduces processing and dissemination load through edge nodes (i.e., Sphere Anchors), and employs an adaptive storage strategy. This method ensures scalability and efficiency as the system can automatically scale up or down adjusting the size and number of trust spheres based on the overall network load and trust score fluctuations.
5.1. Dynamic Trust Spheres Formation
Each trust sphere encompasses devices that have similar trust scores. For example, all devices with an aggregated trust score of approximately 0.6 will be in one sphere—the rationale behind trust-based clustering is to ensure efficient resource management via reliable/trustworthy nodes. To ensure no single sphere becomes overloaded, the capacity of each sphere is dynamically adjusted based on real-time network conditions and device capabilities (i.e., 50 for smart home building). When a sphere reaches this capacity, additional spheres are created as needed. Trust spheres dynamically adjust their boundaries based on real-time trust score evaluations ensuring that devices are always in the most appropriate sphere. By grouping devices into these trust spheres, the system limits the range of data dissemination. Hence, each device only needs to receive trust-related data/updates pertinent to its sphere, significantly reducing the amount of data each device has to process and store. The distribution of nodes in the simulated smart home building after they are assigned to their respective spheres is illustrated in Figure 10.
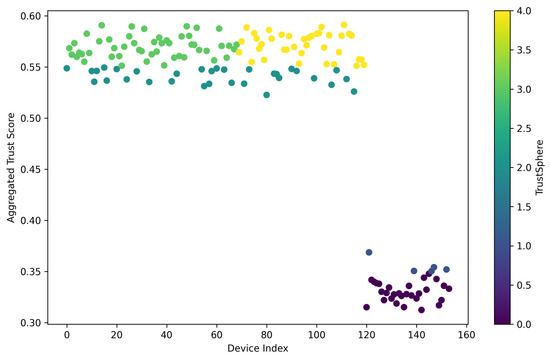
Figure 10.
Distribution of Nodes After the Formation of Trust Spheres.
5.2. Sphere Anchors
Sphere Anchors (SAs) handle the bulk of data processing tasks within their respective spheres, reducing the need for central processing. This decentralized approach distributes the computational load more efficiently. SAs are responsible for continuously monitoring and updating the trust scores of devices within their sphere. They ensure that trust evaluations are up-to-date and reflect the current state of the network. Moreover, they disseminate relevant trust-related data within their spheres ensuring that each device receives the necessary information without being overwhelmed by the network-wide data. By limiting the number of devices per sphere and selecting capable SAs, the SA ensures balanced load distribution across the network. For example, devices in the smart home building were categorized based on their roles when the network was constructed. The high-end devices such as cameras, speakers, and thermostats were therefore considered more capable of handling computational tasks as compared to the rest of the devices (i.e., lights, sensors, and simple actuators, etc.). Within each sphere, the device with the highest aggregated trust score among the high-end devices is selected as the SA. This ensures that the most trusted and capable devices are selected to act as SAs. However, if no high-end devices are available within a sphere, the devices with the highest aggregated trust scores will still be selected as the SA, but the sphere capacity in such cases is dynamically adjusted and massively reduced to maintain efficiency (i.e., five devices per sphere in the smart home building scenario). This approach at least ensures that the most trusted devices are always chosen as SAs. This may impact network performance due to potential limitations in the processing capabilities of these devices; however, it prioritizes maintaining high trustworthiness, which is crucial for the integrity of the SIoT network. Figure 11 illustrates the nomination of SAs within the simulated smart home building environment.
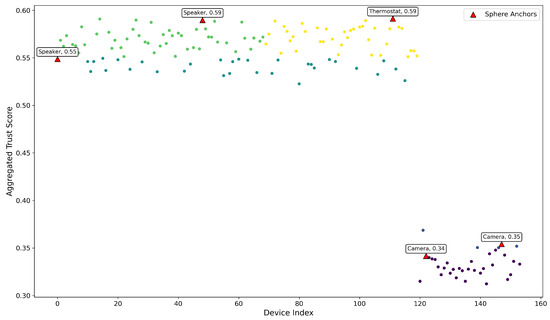
Figure 11.
Sphere Anchors Nominated.
5.3. Adaptive Storage
Trust scores below a certain threshold (e.g., 50%) are managed by the “Echo System.” The Echo System uses a lightweight, streamlined process (i.e., the trust scores are encoded using a simplified binary system (0, 1), which significantly reduces the storage space required per device) to track these lower trust scores using minimal storage and processing power. Instead of continuous monitoring, these trust scores are updated by SAs when transactions occur, ensuring that changes in trustworthiness are promptly reflected. However, high trust scores are stored with more detail (i.e., Timestamped Logs: Each trust score update is logged with a timestamp to track the exact time of changes; Interaction Records: detailed records of interactions that led to trust score updates including information about the interacting devices and the nature of their interactions; Historical Data: a history of trust scores over time to analyze trends and patterns). This adaptive approach ensures efficient use of storage, focusing resources on the most trustworthy and recent trust data. By storing high trust scores with more detail and summarizing lower scores, the resource-constrained devices are not overwhelmed with the storage requirements of detailed trust data that might not be directly relevant or critical to their function.
5.4. Sphere-to-Sphere Communication
Trust spheres communicate with each other using an optimized gossiping protocol [49], which consumes minimal bandwidth and processing power to share insights (i.e., transfer of nodes from one sphere to another) and learn about trust score trends and anomalies. This inter-sphere communication facilitates a network-wide understanding of trust dynamics without overburdening any single part of the system. This reduces the volume of data that each device needs to handle. This means that not every device needs to be involved in every trust-related communication, reducing the network load on individual devices.
5.5. Performance Evaluation of Trust Spheres
The smart home building dataset is duplicated and slightly varied to simulate a larger network of devices (the expansion was performed by replicating and augmenting the original dataset to match the required number of nodes. It is ensured that the expanded dataset maintains the characteristics of the original data while providing a larger scale for testing). This is achieved by adding small random variations to the micro-moment scores to ensure diversity among the simulated devices. Thereafter, devices are grouped into trust spheres based on their aggregated trust scores. Devices with similar trust scores are clustered together forming a sphere. Within each trust sphere, a high-end device with the highest trust score is designated as the SA. The simulation runs for a duration of one week, with interactions occurring every 60 min. During each interaction, trust scores are updated, and corresponding changes in the processing loads are recorded. Throughout the simulation, the processing load is measured in units—a unit represents the computational effort required for a single trust score update and interaction handling by a device using the trust spheres method (i.e., 0.1 units per interaction interval for a regular device, but 0.5 units for an SA per interaction interval for managing trust evaluations and updates within its sphere—the relationship between RAM utilization and CPU time is analyzed for the initial smart home building dataset to determine these specific units).
Figure 12 illustrates the relationship between the number of devices in the extended simulated smart home building and the corresponding total processing load managed by the trust spheres method. A clear linear increase is demonstrated in processing load as the number of devices grows. Specifically, the processing load rises from 50.4 units for 200 devices to 268.8 units for 1000 devices, and further to 2772.0 units for 10,000 devices. This linear relationship highlights a consistent and predictable scaling behavior. The linear increase in processing load further suggests that each additional device contributes a proportionate amount to the overall processing burden. The efficient distribution of processing tasks among Sphere Anchors (SAs) ensures that the network can scale without encountering unexpected performance bottlenecks. Moreover, the linear scaling indicates the robustness of the trust spheres method in handling moderate- to large-scale SIoT networks. As the network size increases, the method continues to manage the processing load effectively. However, for extremely large networks, there may be a need for additional optimization, such as dynamic load balancing and hierarchical trust spheres to further enhance the computational scalability of the trust spheres. In conclusion, the linear scaling of processing load provides confidence in the method’s ability to manage growing network computational demands, making it a robust solution for dynamic and diverse SIoT networks. Subsequently, the same simulation environment is used to evaluate the adaptive storage method employed in the trust spheres. For this, the actual data sizes of trust scores and metadata are calculated in KBs for 200, 1000, and 10,000 nodes. Figure 13 illustrates the total storage utilization across the different counts of nodes.
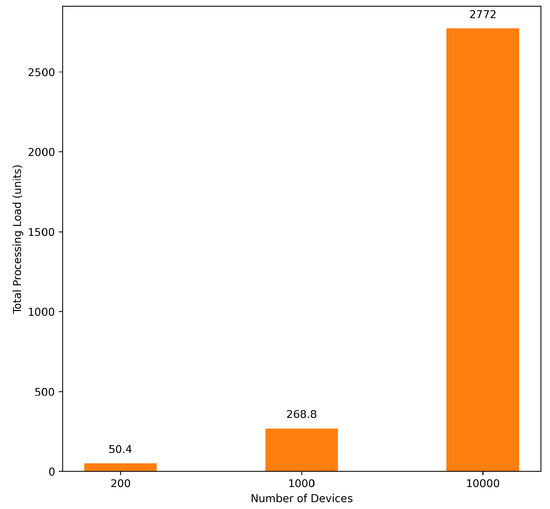
Figure 12.
Processing Load Analysis.
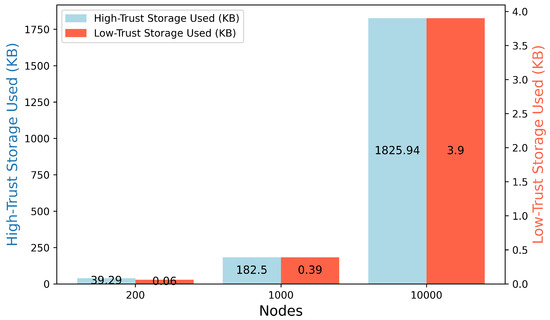
Figure 13.
Storage Analysis.
For all node counts, high-trust storage constitutes the vast majority of total storage used. For instance, high-trust storage accounts for approximately 99.8% of the total storage in the case of 10,000 nodes. Despite the large number of nodes and their detailed trust-related data, the amount of space used remains minimal and the same holds true for low trust scores as well (i.e., 3.90 KB, which is a tiny fraction of the total storage). The results confirm that the adaptive storage strategy is highly efficient at managing both low and high trust scores, which is crucial for maintaining scalability in resource-constrained environments. However, while the detailed trust scores provide valuable information, the storage requirements will be heavily influenced by the proportion of high-trust nodes. Therefore, potential methods (i.e., compressing historical data or selectively logging interaction records based on predefined criteria) can be employed to further optimize the storage of high-trust scores. Overall, this is a significant positive outcome, indicating that the trust spheres method can efficiently scale with the increasing number of devices without facing exponential increases in storage requirements.
Comparison of Propagation Times with DLS-STM
This part of the evaluation is designed to measure the average propagation time for trust information across the extended simulated smart home building environment. For this, the smart home building dataset is expanded to simulate networks of 400, 3000, and 50,000 nodes—these specific node counts are selected to maintain relevance and comparability with the study conducted by [3]. Thereafter, the trust spheres are formed using the same criteria as outlined above. To simulate dynamic changes in the network, trust scores of the devices are periodically updated by adding a small random noise (0, 0.05)—this mimics the real-world variability in trustworthiness due to device behavior and interactions.
The primary evaluation metric is the average propagation time as used by [3], which measures the time taken for trust information to propagate throughout the network. For Trust Spheres, this also includes the time required to update trust scores, re-form Trust Spheres, and re-select Sphere Anchors. The propagation time is measured over 10 iterations to ensure accuracy of the results. The average propagation times for each network size were computed and compared with [3] in Table 7. Overall, the Trust Spheres approach outperforms [3] and exhibits excellent performance for all node counts, making it a robust, lightweight and scalable solution for trust management in the SIoT environments.
Table 7.
Comparison of Average Propagation Times.
6. Conclusions
This research introduces the MMTE model for SIoT, addressing the critical need for scalable and lightweight trust management. The MMTE model leverages high-frequency, context-specific interactions termed “micro-moments” to dynamically evaluate device trustworthiness. This approach is shown to be significantly more resource-efficient compared to existing models, as demonstrated through comparative analysis involving CPU time, memory, and disk usage. The MMTE model’s robustness is further validated through simulation in a smart home environment, showcasing its accuracy in distinguishing benign from malicious nodes. The concept of “trust spheres” is introduced to enhance scalability, grouping devices with similar trust scores to streamline processing and storage demands. The dynamic formation of trust spheres and the role of Sphere Anchors (SAs) in managing these clusters are proven effective, particularly regarding reducing computational overhead and optimizing storage through an adaptive strategy. The trust spheres method is also shown to outperform existing models in terms of average propagation time, reinforcing its suitability for large-scale SIoT networks.
Future research will be focused on implementing the MMTE model in real and diverse SIoT environments to further assess its efficacy. In addition, the aim is to enhance the trust spheres method by exploring hierarchical clustering and investigating the alternative mechanisms for their formation. The adaptive storage method within the trust spheres will also be improved by developing a strategy to manage high trust scores, which currently dominate and consume most of the storage of the nodes. Finally, expanding the model to support cross-domain trust evaluations will enable seamless trust management across different IoT ecosystems.
Author Contributions
Conceptualization, R.U.M.; methodology, R.U.M.; validation, R.U.M.; writing original draft preparation, R.U.M.; visualization, R.U.M.; supervision, A.M. and S.R.; review and editing, A.M. and S.R. All authors have read and agreed to the published version of the manuscript.
Funding
This publication has emanated from research conducted with the financial support of Science Foundation Ireland under Grant number 18/CRT/6222. For the purpose of open access, the author has applied a CC BY public copyright license to any Author-Accepted Manuscript version arising from this submission.
Institutional Review Board Statement
Not applicable.
Informed Consent Statement
Not applicable.
Data Availability Statement
Data sharing does not apply to this article.
Conflicts of Interest
The authors declare no conflicts of interest.
References
- Pliatsios, A.; Lymperis, D.; Goumopoulos, C. S2NetM: A Semantic Social Network of Things Middleware for Developing Smart and Collaborative IoT-Based Solutions. Future Internet 2023, 15, 207. [Google Scholar] [CrossRef]
- Sagar, S.; Mahmood, A.; Sheng, Q.Z.; Pabani, J.K.; Zhang, W.E. Understanding the Trustworthiness Management in the Social Internet of Things: A Survey. arXiv 2022, arXiv:2202.03624. [Google Scholar] [CrossRef]
- Abdelghani, W.; Amous, I.; Zayani, C.A.; Sèdes, F.; Roman-Jimenez, G. Dynamic and scalable multi-level trust management model for Social Internet of Things. J. Supercomput. 2022, 78, 8137–8193. [Google Scholar] [CrossRef]
- Jung, J.; Weon, I. The Social Side of Internet of Things: Introducing Trust-Augmented Social Strengths for IoT Service Composition. Sensors 2025, 25, 4794. [Google Scholar] [CrossRef] [PubMed]
- Becherer, M.; Hussain, O.K.; den Hartog, F.; Zhang, Y.; Zipperle, M. A realistic trust model evaluation platform for the Social Internet of Things (REACT-SIoT). J. Netw. Comput. Appl. 2025, 243, 104302. [Google Scholar] [CrossRef]
- Moeinaddini, E.; Nazemi, E.; Shahraki, A. A new approach on self-adaptive trust management for social Internet of Things. Comput. Netw. 2025, 263, 111187. [Google Scholar] [CrossRef]
- Kumar, G.E.P.; Lydia, M. A Comprehensive Overview on Impact of Trust Models in Internet of Things. In Proceedings of the 2021 IEEE 2nd International Conference on Smart Electronics and Communication (ICOSEC), Trichy, India, 7–9 October 2021; pp. 195–200. [Google Scholar]
- Marche, C.; Serreli, L.; Nitti, M. Analysis of feedback evaluation for trust management models in the Internet of Things. IoT 2021, 2, 498–509. [Google Scholar] [CrossRef]
- Nitti, M.; Girau, R.; Atzori, L. Trustworthiness management in the social internet of things. IEEE Trans. Knowl. Data Eng. 2013, 26, 1253–1266. [Google Scholar] [CrossRef]
- Xiao, H.; Sidhu, N.; Christianson, B. Guarantor and reputation based trust model for social internet of things. In Proceedings of the 2015 IEEE International Wireless Communications and Mobile Computing Conference (IWCMC), Dubrovnik, Croatia, 24–28 August 2015; pp. 600–605. [Google Scholar]
- Marche, C.; Nitti, M. Trust-related attacks and their detection: A trust management model for the social IoT. IEEE Trans. Netw. Serv. Manag. 2020, 18, 3297–3308. [Google Scholar] [CrossRef]
- Azad, M.A.; Bag, S.; Hao, F.; Shalaginov, A. Decentralized self-enforcing trust management system for social Internet of Things. IEEE Internet Things J. 2020, 7, 2690–2703. [Google Scholar] [CrossRef]
- Fan, F.; Zhang, H.; Zhao, D.; Wang, Y.; Liu, B.; Liu, J. Trust Evaluation Model of Social Internet of Things Based on Multi-relationships. In Proceedings of the 2022 IEEE International Conference on Networking and Network Applications (NaNA), Urumchi, China, 3–5 December 2022; pp. 1–6. [Google Scholar]
- Gai, F.; Zhang, J.; Zhu, P.; Jiang, X. Trustontheratee: Atrustmanagementsystemforsocialinternet of vehicles. Wirel. Commun. Mob. Comput. 2017, 2017, 7089259. [Google Scholar]
- Zhang, M.; Xiao, D.; Li, M.; Wang, M. Sparse Trust Inference With Mutual Information Maximization in SIoT. IEEE Trans. Emerg. Top. Comput. Intell. 2025. [Google Scholar] [CrossRef]
- Yadav, R.; Baranwal, G. An efficient trust management using feedback credibility evaluation method in fog computing. Simul. Model. Pract. Theory 2022, 120, 102610. [Google Scholar] [CrossRef]
- Yu, Y.; Yang, H.; Li, Y.; Deng, R.H. Calling Out Trustless Users: A Trust Propagation Scheme for Decentralized Trust Management. IEEE Trans. Serv. Comput. 2025, 18, 2646–2658. [Google Scholar] [CrossRef]
- Umar, M.M.; Almutairi, A.F.; Khan, S. A Score-Based Game Approach Considering Resource Heterogeneity and Social Dynamics for Traffic Optimization in Social IoT Networks. Sensors 2025, 25, 2297. [Google Scholar] [CrossRef]
- Aldawsari, H.; Artoli, A.M. A reliable lightweight trust evaluation scheme for iot security. Int. J. Adv. Comput. Sci. Appl. 2021, 12, 723–731. [Google Scholar] [CrossRef]
- Amiri-Zarandi, M.; Dara, R.A.; Fraser, E. LBTM: A lightweight blockchain-based trust management system for social internet of things. J. Supercomput. 2022, 78, 8302–8320. [Google Scholar] [CrossRef]
- Wardana, A.A.; Kołaczek, G.; Sukarno, P. Lightweight, Trust-Managing, and Privacy-Preserving Collaborative Intrusion Detection for Internet of Things. Appl. Sci. 2024, 14, 4109. [Google Scholar] [CrossRef]
- Snabay Networking. Limitations of a Wireless Network Connection. 2024. Available online: https://snabaynetworking.com/limitations-of-a-wireless-network/ (accessed on 4 March 2024).
- Althaf Ali, A.; Hussain, M.M.; Subramaneswara Rao, A.; Lavanya, S.; Feroz Khan, A. Enhancing Security in the Internet of Things: A Trust-Based Protocol for Resilient Communication. SN Comput. Sci. 2023, 5, 4. [Google Scholar] [CrossRef]
- Cai, B.; Li, X.; Kong, W.; Yuan, J.; Yu, S. A reliable and lightweight trust inference model for service recommendation in SIoT. IEEE Internet Things J. 2021, 9, 10988–11003. [Google Scholar] [CrossRef]
- Bao, F.; Chen, R.; Guo, J. Scalable, adaptive and survivable trust management for community of interest based internet of things systems. In Proceedings of the 2013 IEEE Eleventh International Symposium on Autonomous Decentralized Systems (ISADS), Mexico City, Mexico, 6–8 March 2013; pp. 1–7. [Google Scholar]
- Kokoris-Kogias, E.; Voutyras, O.; Varvarigou, T. TRM-SIoT: A scalable hybrid trust & reputation model for the social internet of things. In Proceedings of the 2016 IEEE 21st International Conference on Emerging Technologies and Factory Automation (ETFA), Berlin, Germany, 6–9 September 2016; pp. 1–9. [Google Scholar]
- IoT-Cosmos. IoT-Cosmos. 2024. Available online: http://iot-cosmos.eu/ (accessed on 23 April 2024).
- Abderrahim, O.B.; Elhedhili, M.H.; Saidane, L. CTMS-SIOT: A context-based trust management system for the social Internet of Things. In Proceedings of the 2017 IEEE 13th International Wireless Communications and Mobile Computing Conference (IWCMC), Valencia, Spain, 26–30 June 2017; pp. 1903–1908. [Google Scholar]
- Sciddurlo, G.; Huso, I.; Striccoli, D.; Piro, G.; Boggia, G. A multi-tiered social iot architecture for scalable and trusted service provisioning. In Proceedings of the 2021 IEEE Global Communications Conference (GLOBECOM), Madrid, Spain, 7–11 December 2021; pp. 1–6. [Google Scholar]
- Segurola-Gil, L.; Zola, F.; Echeberria-Barrio, X.; Orduna-Urrutia, R. NBcoded: Network attack classifiers based on Encoder and Naive Bayes model for resource limited devices. In Proceedings of the Joint European Conference on Machine Learning and Knowledge Discovery in Databases, Bilbao, Spain, 13–17 September 2021; Springer: Cham, Switzerland, 2021; pp. 55–70. [Google Scholar]
- Iqbal, R.; Butt, T.A.; Afzaal, M.; Salah, K. Trust management in social internet of vehicles: Factors, challenges, blockchain, and fog solutions. Int. J. Distrib. Sens. Netw. 2019, 15, 1550147719825820. [Google Scholar] [CrossRef]
- Abbas, W.; Laszka, A.; Koutsoukos, X. Improving network connectivity and robustness using trusted nodes with application to resilient consensus. IEEE Trans. Control Netw. Syst. 2017, 5, 2036–2048. [Google Scholar] [CrossRef]
- Sagar, S.; Mahmood, A.; Sheng, Q.Z.; Siddiqui, S.A. SCaRT-SIoT: Towards a scalable and robust trust platform for social internet of things: Demo abstract. In Proceedings of the 18th Conference on Embedded Networked Sensor Systems, Virtual Event, 16–19 November 2020; pp. 635–636. [Google Scholar]
- Magdich, R.; Jemal, H.; Ayed, M.B. A Hybrid Trust Update Solution for Dynamic Social IoT Trust Management Model. In Proceedings of the 2023 9th IEEE International Conference on Control, Decision and Information Technologies (CoDIT), Rome, Italy, 3–6 July 2023; pp. 662–667. [Google Scholar]
- Rouzbahani, A.; Taghiyareh, F. SCoTMan: A Scalable Smart Contract for Trust Management in Social IoT with Real-World Constraints. IEEE Access 2024, 12, 137836–137850. [Google Scholar] [CrossRef]
- Hasan, A.A.; Fang, X.; Latif, S.; Iqbal, A. Context-Aware Trust Prediction for Optimal Routing in Opportunistic IoT Systems. Sensors 2025, 25, 3672. [Google Scholar] [CrossRef] [PubMed]
- Jmal, R.; Masmoudi, M.; Amous, I.; Sèdes, F. Blockchain-Based Trust Management System for Enhancing Security in SIoT. In Proceedings of the International Conference on Research Challenges in Information Science, Seville, Spain, 20–23 May 2025; Springer: Cham, Switzerland, 2025; pp. 37–51. [Google Scholar]
- Ben Amor, A.; Jebri, S.; Abid, M.; Meddeb, A. A secure lightweight mutual authentication scheme in social industrial IoT environment. J. Supercomput. 2023, 79, 13578–13600. [Google Scholar] [CrossRef]
- Park, K.; Park, Y.; Das, A.K.; Yu, S.; Lee, J.; Park, Y. A dynamic privacy-preserving key management protocol for V2G in social internet of things. IEEE Access 2019, 7, 76812–76832. [Google Scholar] [CrossRef]
- Shen, J.; Zhou, T.; Wei, F.; Sun, X.; Xiang, Y. Privacy-preserving and lightweight key agreement protocol for V2G in the social Internet of Things. IEEE Internet Things J. 2017, 5, 2526–2536. [Google Scholar] [CrossRef]
- Din, I.U.; Bano, A.; Awan, K.A.; Almogren, A.; Altameem, A.; Guizani, M. LightTrust: Lightweight trust management for edge devices in industrial internet of things. IEEE Internet Things J. 2021, 10, 2776–2783. [Google Scholar] [CrossRef]
- Gao, Z.; Zhao, W.; Xia, C.; Xiao, K.; Mo, Z.; Wang, Q.; Yang, Y. A credible and lightweight multidimensional trust evaluation mechanism for service-oriented IoT edge computing environment. In Proceedings of the 2019 IEEE International Congress on Internet of Things (ICIOT), Milan, Italy, 8–13 July 2019; pp. 156–164. [Google Scholar]
- Joshi, G.; Sharma, V. Light-weight hidden markov trust evaluation model for iot network. In Proceedings of the 2021 IEEE Fifth International Conference on I-SMAC (IoT in Social, Mobile, Analytics and Cloud)(I-SMAC), Palladam, India, 11–13 November 2021; pp. 142–149. [Google Scholar]
- Mohammadi, V.; Rahmani, A.M.; Darwesh, A.M.; Sahafi, A. Trust-based recommendation systems in Internet of Things: A systematic literature review. Hum.-Centric Comput. Inf. Sci. 2019, 9, 1–61. [Google Scholar] [CrossRef]
- Marche, C.; Atzori, L.; Pilloni, V.; Nitti, M. How to exploit the social Internet of Things: Query generation model and device profiles’ dataset. Comput. Netw. 2020, 174, 107248. [Google Scholar] [CrossRef]
- Mustafa, R.U.; McGibney, A.; Rea, S. Establishing Trustworthy Rational Friendships in Social Internet of Things. In Proceedings of the 2023 IEEE International Conference on Information Networking (ICOIN), Bangkok, Thailand, 11–14 January 2023; pp. 318–327. [Google Scholar]
- Mustafa, R.U.; McGibney, A.; Rea, S. Trust Analysis to Identify Malicious Nodes in the Social Internet of Things. In Proceedings of the 2023 IEEE International Conference on Software, Telecommunications and Computer Networks (SoftCOM), Split, Croatia, 21–23 September 2023; pp. 1–9. [Google Scholar]
- Šimundić, A.M. Measures of diagnostic accuracy: Basic definitions. eJIFCC 2009, 19, 203. [Google Scholar] [PubMed]
- Altoaimy, L.; Alromih, A.; Al-Megren, S.; Al-Hudhud, G.; Kurdi, H.; Youcef-Toumi, K. Context-aware gossip-based protocol for Internet of Things applications. Sensors 2018, 18, 2233. [Google Scholar] [CrossRef] [PubMed]


Disclaimer/Publisher’s Note: The statements, opinions and data contained in all publications are solely those of the individual author(s) and contributor(s) and not of MDPI and/or the editor(s). MDPI and/or the editor(s) disclaim responsibility for any injury to people or property resulting from any ideas, methods, instructions or products referred to in the content. |
© 2025 by the authors. Licensee MDPI, Basel, Switzerland. This article is an open access article distributed under the terms and conditions of the Creative Commons Attribution (CC BY) license (https://creativecommons.org/licenses/by/4.0/).