Article

Ground Effect Influence on UAV Propeller Thrust: Experimental and CFD Validation

by
Mădălin Dombrovschi
1,2,
Gabriel-Petre Badea
1,2,*,
Tiberius-Florian Frigioescu
1,2,
Maria Căldărar
1 and
Daniel-Eugeniu Crunțeanu
2
1
National Research and Development Institute for Gas Turbines COMOTI, 220D Iuliu Maniu Av., 061126 Bucharest, Romania
2
Doctoral School of Aerospace Engineering, National University of Science and Technology Polytechnic of Bucharest, 011061 Bucharest, Romania
*
Author to whom correspondence should be addressed.
Technologies 2025, 13(12), 542; https://doi.org/10.3390/technologies13120542
Submission received: 29 September 2025 / Revised: 27 October 2025 / Accepted: 12 November 2025 / Published: 21 November 2025
(This article belongs to the Special Issue Aviation Science and Technology Applications)

Abstract

This work investigates the influence of ground effect on the performance of a UAV propeller through a combined experimental, analytical, and numerical approach. A dedicated test bench was designed and constructed to enable controlled measurements of thrust and power under static conditions. During experimental campaigns, it was observed that the measured thrust significantly exceeded theoretical free-air predictions, suggesting the presence of a ground-like amplification effect. To quantify and validate this phenomenon, complementary methods were employed: blade element momentum-based analytical modeling corrected for ground proximity and high-fidelity CFD simulations performed using ANSYS CFX. Three configurations were analyzed numerically—an isolated propeller, a propeller with a motor, and a propeller–motor–mounting plate configuration—highlighting the progressive impact of structural elements on the flow field. The results showed close agreement between corrected analytical predictions, CFD solutions, and experimental data, with deviations below 8%. The presence of the mounting plate induced pressure redistribution and jet reflection, analogous to the helicopter ground effect, leading to thrust amplification of up to 30% relative to free-air conditions. This study confirms the critical role of the experimental setup and mounting configuration in propeller characterization and establishes a validated methodology for capturing ground effect phenomena relevant to UAV propulsion systems.

1. Introduction

Unmanned Aerial Vehicles (UAVs) have become one of the fastest-growing areas of aerospace research and development, with widespread applications in surveillance, logistics, agriculture, disaster response, and environmental monitoring [1,2,3,4,5,6]. Their versatility is largely due to advances in lightweight structures, hybrid and electric powertrains, miniaturized avionics, and autonomous control systems. However, among all subsystems, the propulsion system remains the cornerstone of UAV performance, directly influencing endurance, payload capacity, maneuverability, and even acoustic signatures during operation. Within this context, the propeller is the primary thrust-generating element, making its aerodynamic characterization critical for reliable performance prediction and optimization [7,8].
The aerodynamic behavior of UAV propellers is particularly challenging to predict because they operate at relatively low Reynolds numbers, where viscous effects, laminar–turbulent transition, and blade–wake interactions strongly affect performance. This sensitivity requires careful experimental and numerical investigation to ensure that design choices translate effectively into operational performance. Foundational datasets such as those provided by Brandt and Selig [7] and optimization studies like Bohorquez et al. [8] remain essential for informing propeller selection and for benchmarking computational tools in UAV applications.
To address these challenges, experimental propeller test benches have been developed as indispensable tools for UAV research. By providing controlled and repeatable conditions, they enable the measurement of thrust, torque, rotational speed, and power efficiency while isolating the influence of environmental disturbances. Facilities range from large wind tunnels capable of simulating advancing flight conditions to compact, low-cost thrust stands designed for laboratory use [9]. The work of Zawodny et al. [9] at NASA Langley highlights the potential of specialized tunnels for detailed aerodynamic and aeroacoustic characterization, while Guclu et al. [10] demonstrated the feasibility of lightweight portable rigs for rapid UAV propeller evaluation.
More advanced implementations extend beyond thrust and torque measurement. Gallo et al. [11] reported the development of an aeroacoustic test rig designed to analyze noise generation and interactions in single and coaxial propulsive systems. Siddiqi et al. [12] combined thrust stand measurements with rotating-cup anemometry to better correlate aerodynamic performance with flow characteristics, offering valuable insight into wake development. Similarly, Goli et al. [13] explored the integration of motor–propeller–battery systems, showing how the choice of each component influences efficiency and endurance. These examples underline the importance of test bench design: poor calibration or mounting arrangements can bias measurements, while robust instrumentation ensures accurate validation of theoretical and computational models.
Commercial UAV propulsion test benches, such as those developed by TYTO Robotics, represent well-established solutions for propeller characterization and performance evaluation under controlled laboratory conditions. Although the test bench presented in this study bears resemblance to such commercial systems in its overall configuration, its dimensions and structural parameters were derived from a dedicated safety and stability analysis, rather than standardized design templates. This approach ensured that the stand geometry satisfied both overturning and sliding stability criteria under dynamic loading, thereby guaranteeing operational safety during testing.
Unlike commercial platforms that primarily focus on performance measurement, the present work contributes an analytical methodology for assessing the structural stability of propeller test benches, providing a reproducible way to validate design integrity before physical implementation. Furthermore, the experimental configuration developed here was conceived as a research-oriented system, specifically optimized to study the aerodynamic interactions between the propeller, motor, and nearby surfaces, such as the mounting plate. In this regard, the proposed setup extends beyond conventional test bench applications, serving as a flexible, safety-validated platform for investigating installation-induced effects and ground-effect phenomena that are typically inaccessible using standardized commercial systems.
Alongside experiments, analytical and numerical methods remain central to UAV propeller research. Blade Element Momentum Theory (BEMT) continues to be one of the most widely applied methods due to its simplicity and low computational cost [14]. However, as noted by Zhang et al. [14], it requires correction factors when applied outside of idealized conditions, such as in proximity to surfaces or under unsteady loading. Recent experimental and CFD evaluations by Eldegwy et al. [15] confirmed that such methods remain reliable when properly calibrated, but also highlighted the need for higher-fidelity tools to capture nonlinearities at low Reynolds numbers.
Computational Fluid Dynamics (CFD) has therefore become an increasingly valuable complement to experimental work. Using methods such as Reynolds-Averaged Navier–Stokes (RANS), Unsteady RANS (URANS), sliding mesh, and Multiple Reference Frame (MRF) models, researchers have been able to capture wake development, vortex dynamics, and interactions with supporting structures. CFD also allows parametric studies of blade geometry, ducted versus open-rotor configurations, and inflow conditions that are difficult to replicate experimentally. Zhang et al. [14] provided a compelling demonstration of how coupled experimental and CFD investigations can quantify motion-induced effects, while Eldegwy et al. [15] validated numerical predictions against measured propeller performance across a range of Reynolds numbers.
One of the most significant proximity effects in propeller aerodynamics is the ground effect. When a rotor or propeller operates close to a surface, the induced flow field is modified: downwash is constrained, pressure distributions shift, and thrust is typically amplified relative to free-air operation. This phenomenon is well known in helicopter aerodynamics, but only recently has it been studied extensively for UAV propellers. Kan et al. [16] analyzed the influence of ground effect in forward flight, developing scaling laws that relate thrust augmentation to propeller radius and clearance height. Cai and Gunasekaran [17] extended this analysis to partial ground and ceiling conditions, showing that confinement can either enhance or reduce performance depending on geometry. Conyers [18] provided an empirical evaluation of multirotor ground, ceiling, and wall effects, producing valuable data for control algorithm tuning. Chiew et al. [19] validated a medium-fidelity CFD model capable of capturing wake interaction effects in ground proximity, bridging the gap between low-order and high-fidelity approaches.
Beyond these foundational studies, recent contributions have broadened our understanding of ground effect in more complex configurations. Sanchez-Cuevas et al. [20] characterized its influence on multirotor control stability, providing empirical corrections that have been incorporated into flight control algorithms. Zhu et al. [21] analyzed staggered rotor systems in ground effect, identifying thrust amplification trends that inform multi-rotor UAV layout design. Wu et al. [22] explored extreme ground effect conditions using combined experimental and numerical methods, revealing nonlinear aerodynamic behavior and vortex interactions not captured by simpler models. He et al. [23] proposed generalized rotor in-ground-effect models applicable to both axial and forward flight, offering a predictive framework that unifies disparate observations.
Further research underscores the aeroacoustic and design implications of ground effect. Jordan et al. [24] assessed the aerodynamic and acoustic behavior of small UAV propellers, while Zhang et al. [25] and Yilmaz et al. [26] compared ducted and open-rotor designs, revealing that ducting can exacerbate or mitigate proximity effects depending on clearance. In [27], the authors developed dual test setups to evaluate combined ground, ceiling, and wall effects, demonstrating that confinement geometries significantly affect lift and drag forces. Most recently, Carter et al. [28] modeled the performance of near-surface rotors, offering a compact framework for including ground effect in UAV mission planning and flight simulations.
Taken together, these studies show that ground effect is not a marginal phenomenon but a critical factor influencing UAV propeller performance. Increases in thrust of 20–30% relative to free-air conditions have been documented, with corresponding changes in torque, induced velocity, and noise. Such deviations, if unaccounted for, can lead to overestimation of endurance, misprediction of payload capacity, and control instability in near-ground operations.
Recent work highlights the rising integration of UAVs with surface or marine vehicles and the need for control schemes that guarantee transient bounds under uncertainty. In particular, prescribed performance control (PPC) and related robust compensation methods have been developed for USVs and mixed USV–UAV teams, ensuring bounded tracking errors and robustness to modeling errors and disturbances. Representative examples include PPC with robust bounded compensating techniques for heterogeneous USV–UAV cooperation, as well as recent robust/threshold-based PPC variants for USV path following and trajectory tracking [29].
From a propulsion-physics perspective, accurate aerodynamic modeling of the propeller, including installation effects, is essential to supply trustworthy inputs to such control frameworks. Experiments and simulations consistently show thrust enhancement in ground effect, with the magnitude depending on geometry and separation from the surface; studies report notable increases in C T and altered wake structure near the ground. Recent investigations also quantify how installation/airframe coupling reshapes inflow non-uniformity and loading, reinforcing the need to resolve near-field vortex dynamics when comparing isolated vs. installed configurations [30].
The novelty of this study lies in the development of an integrated analytical–CFD–experimental framework that systematically isolates and quantifies the aerodynamic influence of individual components within a UAV propulsion system. Unlike previous studies that focus solely on either isolated propellers or complete assemblies, the present approach evaluates three distinct configurations, an isolated propeller, a propeller with a motor, and a propeller with a motor and a mounting plate, using a unified test bench and CFD methodology. This structure enables a direct assessment of installation-induced effects, including ground interaction, vortex interference, and pressure redistribution. The resulting workflow establishes a reproducible methodology for validating analytical models under realistic boundary conditions and serves as a reference for future studies on non-conventional propulsion systems.

2. Materials and Methods

2.1. Design and Assembly of the Experimental Test Bench

The test bench was designed as a free-standing and portable experimental platform, capable of safely testing single-propeller propulsion units of varying diameters under static and near-ground conditions. The principal design constraints were defined by the need to (i) ensure structural stability during high-thrust operation, (ii) maintain sufficient rigidity to minimize vibration-induced errors, (iii) allow quick reconfiguration of mounting elements, and (iv) provide unobstructed airflow around the propeller. The overall geometry and mass distribution were therefore established through an iterative analytical process, ensuring that the structure met overturning and sliding stability criteria under the expected maximum thrust load. These calculations are presented and summarized in Table 1 (below).
The mounting plate was deliberately sized larger than those found in commercial systems to replicate the physical interference typically present in industrial UAV installations, where propulsion units are often mounted on wide structural frames or nacelles. Its dimensions (350 × 250 mm) were determined through the aforementioned safety analysis, providing both structural integrity and a realistic aerodynamic obstruction for studying mounting-induced effects. Although simpler stabilization solutions, such as anchoring or ballast, could prevent sliding, the goal was to quantify intrinsic structural stability without external constraints, thereby providing a generalizable analytical method for validating test stand safety and design adequacy prior to fabrication.
The propulsion system employed a T-MOTOR MN1010 KV135 brushless motor (TMOTOR, Nanchang, China) paired with a Flame 100A 14S electronic speed controller (ESC) and a T-MOTOR G30 × 10.5 carbon-fiber propeller. The measurement system consisted of Flintec PA1 single-point load cells connected to HX711 amplifiers and a Raspberry Pi 5 microcomputer for signal acquisition and control.
Figure 1 presents the main development stages of the test bench, illustrating the progressive adjustments that led to the finalized configuration employed in the present study.
The application of the calculation algorithm enabled the determination of the geometric parameters required to ensure compliance with the stability and safety conditions imposed on the test bench. The resulting values define the characteristic dimensions of the assembly, being established on the basis of overturning and sliding equilibrium criteria, as well as on the analysis of the stresses generated by the motor torque on the mounting system. These parameters, considered optimal for guaranteeing an adequate safety factor under dynamic testing conditions, are summarized in Table 1. It should be noted that all data related to the propeller and electric motor parameters were provided by the manufacturer.
The assessment of the test bench stability required the evaluation of several fundamental mechanical criteria, among which the most relevant were overturning resistance, sliding resistance, and the structural stresses generated by the motor torque on the fastening elements. The analysis was performed by comparing the forces and moments acting on the stand against the limiting equilibrium conditions, in order to establish the appropriate safety factor for each potential failure mechanism. To this end, the mathematical relations necessary for quantifying the overturning and resisting moments, the frictional forces mobilized at the contact with the ground, as well as the reactions transmitted to the mounting screws through the applied motor torque, were derived. The formulas describing these relations are presented in the following section and constitute the methodological foundation of the safety analysis.
M O v e r t u r n i n g = F p r o p p × h m o t o r = 200 × 0.898 = 179.6   N m
M R e z i s t = W b e n c h × b = 700 × 0.36 = 252   N m
From Equations (1) and (2), it can be observed that M R e z i s t > M O v e r t u r n i n g , which indicates that the test bench is stable with respect to the overturning phenomenon.
F f r i c t i o n = W b e n c h × μ = 700 × 0.8 = 560   N
According to Relation (3), F f r i c t i o n F p r o p p , which demonstrates that the test bench is stable with respect to sliding.
Having defined the characteristic dimensions and structural parameters that satisfy the stability and strength criteria, the next step consisted of translating these into a three-dimensional model of the test bench. The CAD modeling process enabled the integration of all constructive elements derived from the preliminary analysis, facilitating both the verification of geometric compatibility between components and the assessment of the assembly procedure. Furthermore, this stage provided a solid foundation for detailing the manufacturing process, offering a clear visualization of the final assembly and allowing the identification of potential constructive optimizations prior to the physical realization of the stand.
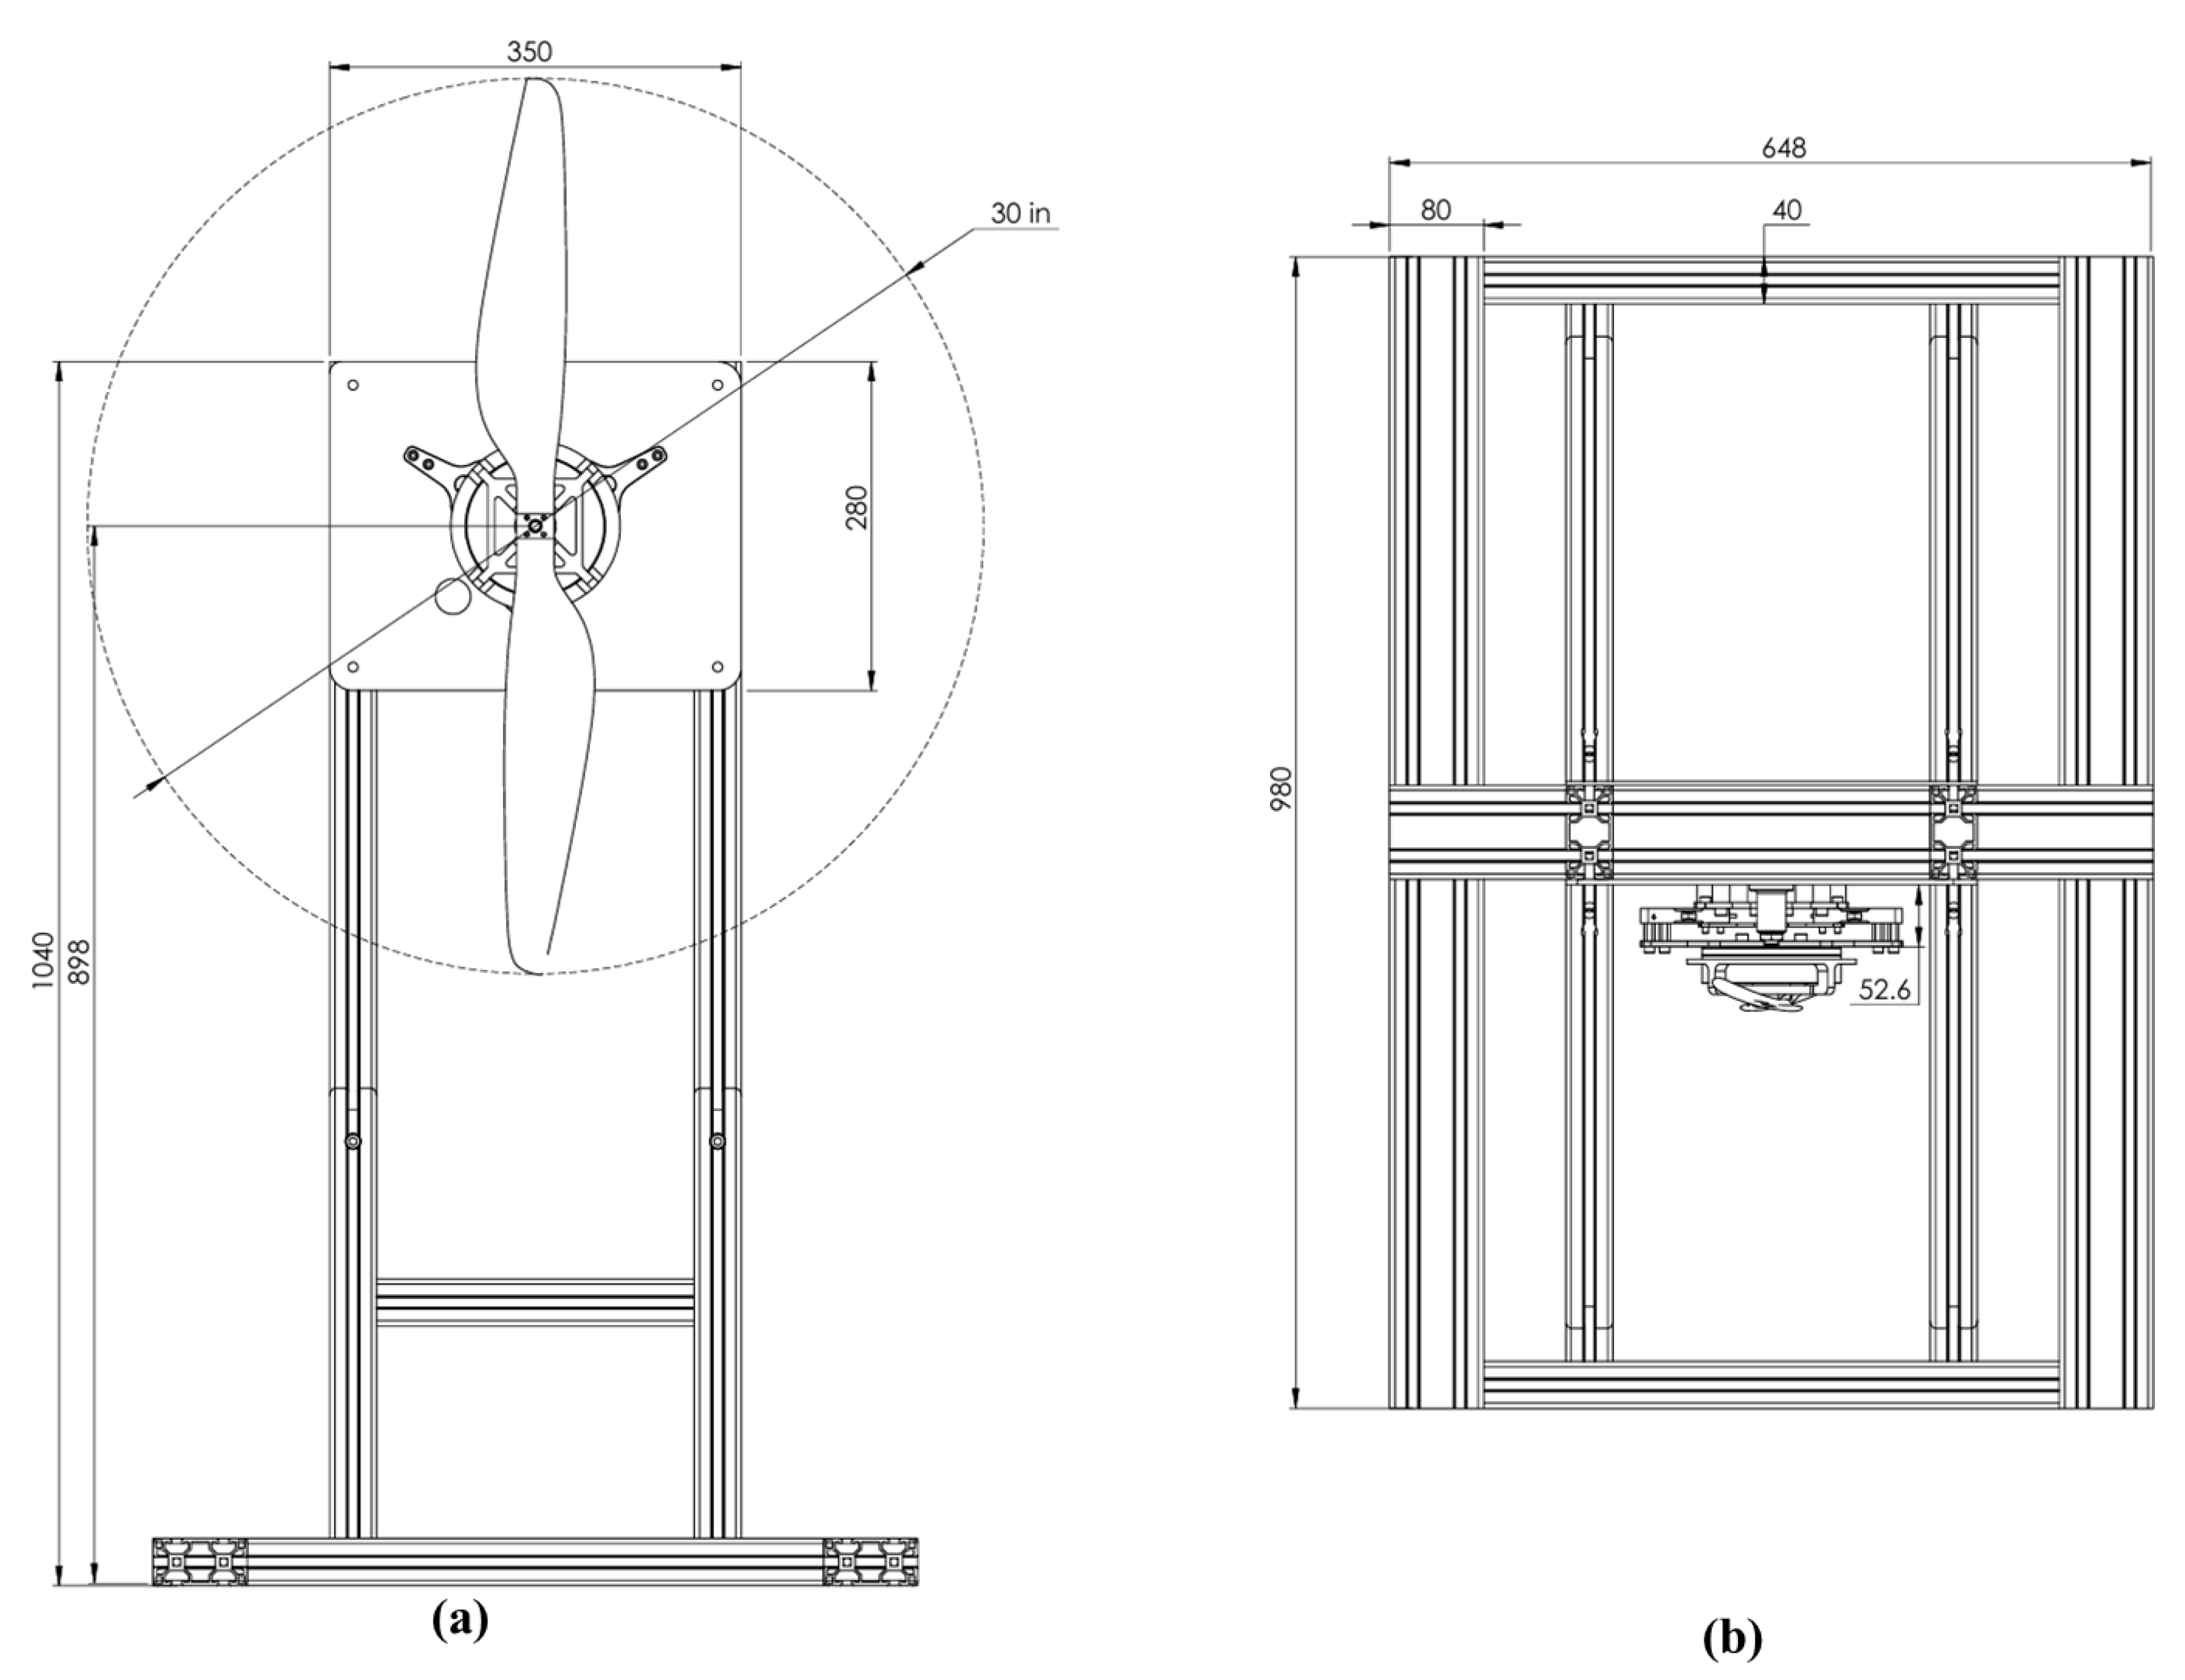
Figure 2 presents the front and top views of the test bench, together with its main components.
For the construction of the test bench structure, aluminum profiles of types 40 × 40 and 40 × 80 with variable lengths were employed, selected according to the design requirements. The fastening elements, as well as the plates intended for mounting the load cells and the propulsion assembly, were manufactured from stainless steel in order to ensure the rigidity and durability required under testing conditions.
Force measurement was carried out using PA1 miniature single-point load cells, manufactured by Flintec. These sensors have a maximum capacity ranging from 0.3 to 20 kg, a nominal output signal of 0.5 mV/V (1.5 mV/V for higher ranges), and an excitation voltage range between 5 and 15 V. The input resistance is specified as 350 ± 15 Ω, the output resistance as 350 ± 50 Ω, and the insulation resistance as a minimum of 5000 MΩ at 100 VDC.
From a mechanical perspective, the load cells can withstand a safe overload of up to 150% of their rated capacity and an ultimate load of up to 300%. They are manufactured from aluminum, feature an IP67 protection rating, and operate within a temperature range of −20 °C to +65 °C, making them suitable for diverse testing conditions [30].
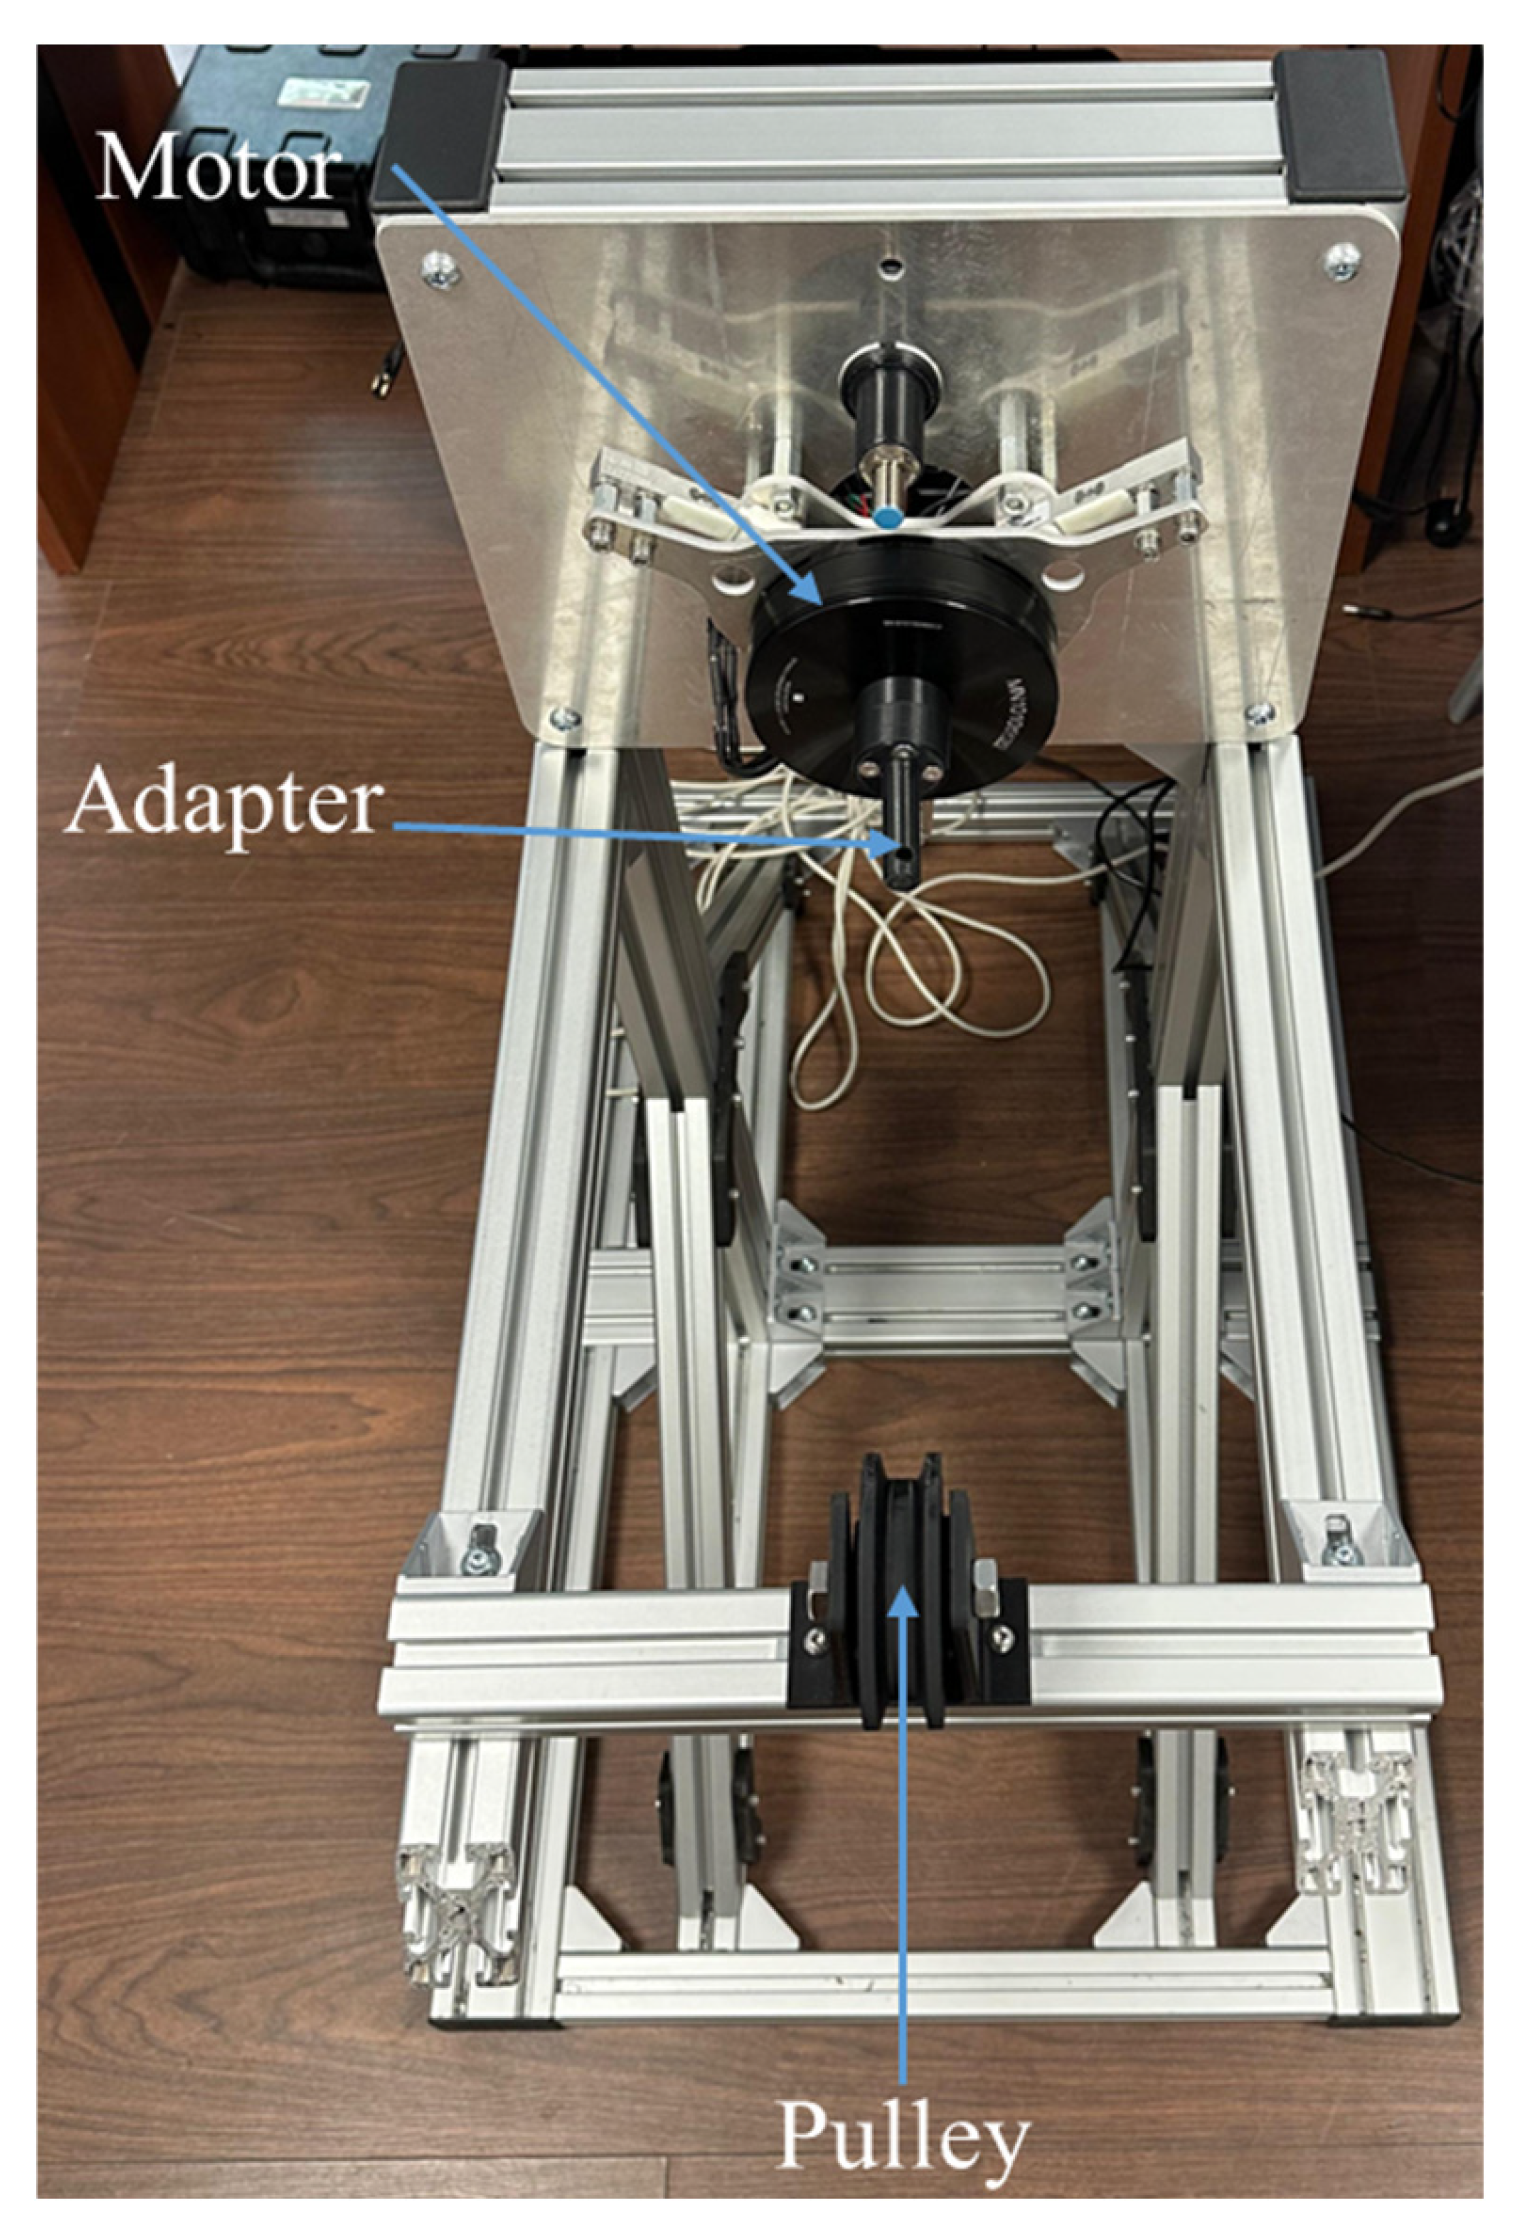
The calibration of the load cells used in the experimental stand was performed using a dead-weight method, implemented directly on the pulley system shown in Figure 3. A reference mass of 2.1 kg was suspended from the system, generating a known force that was used to determine the linear calibration coefficient of each sensor. The procedure was automated through an open-source calibration code designed for HX711 amplifier-based load cells, which computed the relationship between the measured signal and the applied force. To verify calibration accuracy, a series of additional known weights were applied, covering the operational range of the test stand. The measured deviation between the indicated and actual values remained below 3%, confirming the reliability and repeatability of the measurement setup for thrust evaluation.
Although no dedicated vibration-isolation study was carried out, several constructive and procedural measures were taken to minimize vibration-induced errors. The aluminum frame of the stand provides high structural stiffness, while the load cells were mounted on rigid steel plates and preloaded during installation to maintain a constant compression state. The propeller–motor assembly was dynamically balanced before testing, and each measurement point was recorded only after the rotational speed stabilized. These considerations ensured that transient oscillations or structural vibrations had negligible influence on the steady-state thrust measurements.
Rotational speed monitoring was performed using a Hall-effect tachometer, which provides a measurement range between 5 and 9999 RPM with an accuracy of ±3 RPM. The device is equipped with a backlit four-digit display and a response frequency of 100 Hz, ensuring rapid and reliable readings. The sensor itself has a diameter of 12 mm, a detection distance of less than 10 mm, and can deliver an output current of up to 200 mA. Its operational temperature range of 0–50 °C makes it suitable for standard experimental conditions, while its compact dimensions (72 × 36 × 20 mm, mounting slot 68 × 33 mm) facilitate seamless integration into the test bench assembly [31].
The test bench integrates both measurement and control functionalities in a compact and efficient manner. At its core is the Raspberry Pi 5 microcomputer (Raspberry Pi Ltd., South Wales, UK), which serves as the main processing and signal coordination unit. Signals from the load cells are transmitted to HX711 modules that operate as amplifiers and analog-to-digital converters, ensuring proper conditioning and digitization for subsequent processing by the Raspberry Pi. Motor control is achieved via an electronic speed controller (ESC), while a voltage converter stabilizes the power supply for the different modules. The entire stand is powered by two 24 V, 5000 mAh batteries connected in series, delivering the necessary voltage and current to both the actuation subsystem (motor and ESC) and the acquisition and control system. This configuration provides the essential electronic infrastructure for experimental testing, ensuring accurate data acquisition, robust signal processing, and stable actuation control.
For the control of the experimental stand and the acquisition of relevant parameters, a dedicated program was developed in Python 3.10.11 and executed on the Raspberry Pi 5 microcomputer. The structure of the code was designed to integrate multiple measurement and actuation subsystems into a unified workflow, ensuring both motor control and experimental data recording. An interactive mechanism for keyboard command input was also implemented, allowing the user to define the control vector (STOP/START and throttle setting). This provides a simple and direct interface for operating the stand.
Through its modular architecture, the developed application fulfills a dual role: it enables real-time control of the propulsion system while simultaneously serving as a platform for experimental data acquisition. This integrated approach establishes a robust foundation for correlating experimental results with numerical predictions obtained from analytical models and CFD simulations, thereby enhancing the reliability and comprehensiveness of the performance evaluation.

2.2. Analytical Modeling of Propeller Performance

To analytically evaluate the performance of the propeller, the Blade Element Theory (BET) in its two-dimensional form was employed, following the methodology presented in the literature. This approach is widely used in propeller aerodynamics, with applications ranging from the determination of performance for a given blade geometry to solving the direct and inverse propeller problems, as well as estimating aerodynamic characteristics under various operating conditions. In the present case, the objective was to determine the performance parameters of a propeller with known geometry.
To simplify the analytical treatment, a series of assumptions were introduced: the flow was considered axisymmetric and steady; viscous friction effects were neglected; the radial velocity component was ignored, focusing instead on the axial and tangential components; and the aerodynamic laws of the isolated airfoil were applied. Additionally, the analysis was conducted for static conditions, where the free-stream velocity was considered null ( V = 0 ) .
The geometric parameters of the propeller used in the calculations are summarized in Table 2. The analytical evaluation was performed at the mean (50%) blade radius, representing the geometric midpoint between the hub and the tip. This choice ensures a consistent analytical framework for comparing sectional and integrated aerodynamic loads and has been adopted in several static BEMT formulations where the propeller operates in a uniform induced-velocity field. Although performance analyses are sometimes referenced to the 70–75% radial position, particularly for determining local Reynolds number or pitch, the 50% mean-radius approach provides an averaged representation of blade loading that is well suited for static conditions.
The analytical model developed in this study establishes a baseline for subsequent validation through experimental and numerical comparisons. The BEMT-based framework enables the estimation of thrust and torque coefficients under static conditions and serves as a reference for assessing the influence of mounting-induced effects in later analyses. While the current implementation focuses on static thrust evaluation, the same methodology can be extended to forward-flight conditions or wind-tunnel testing, where the inflow velocity and advance ratio are explicitly defined. In such cases, minor modifications to the governing equations, primarily concerning the induced velocity distribution, allow the analytical formulation to remain valid across a broader range of operating regimes.
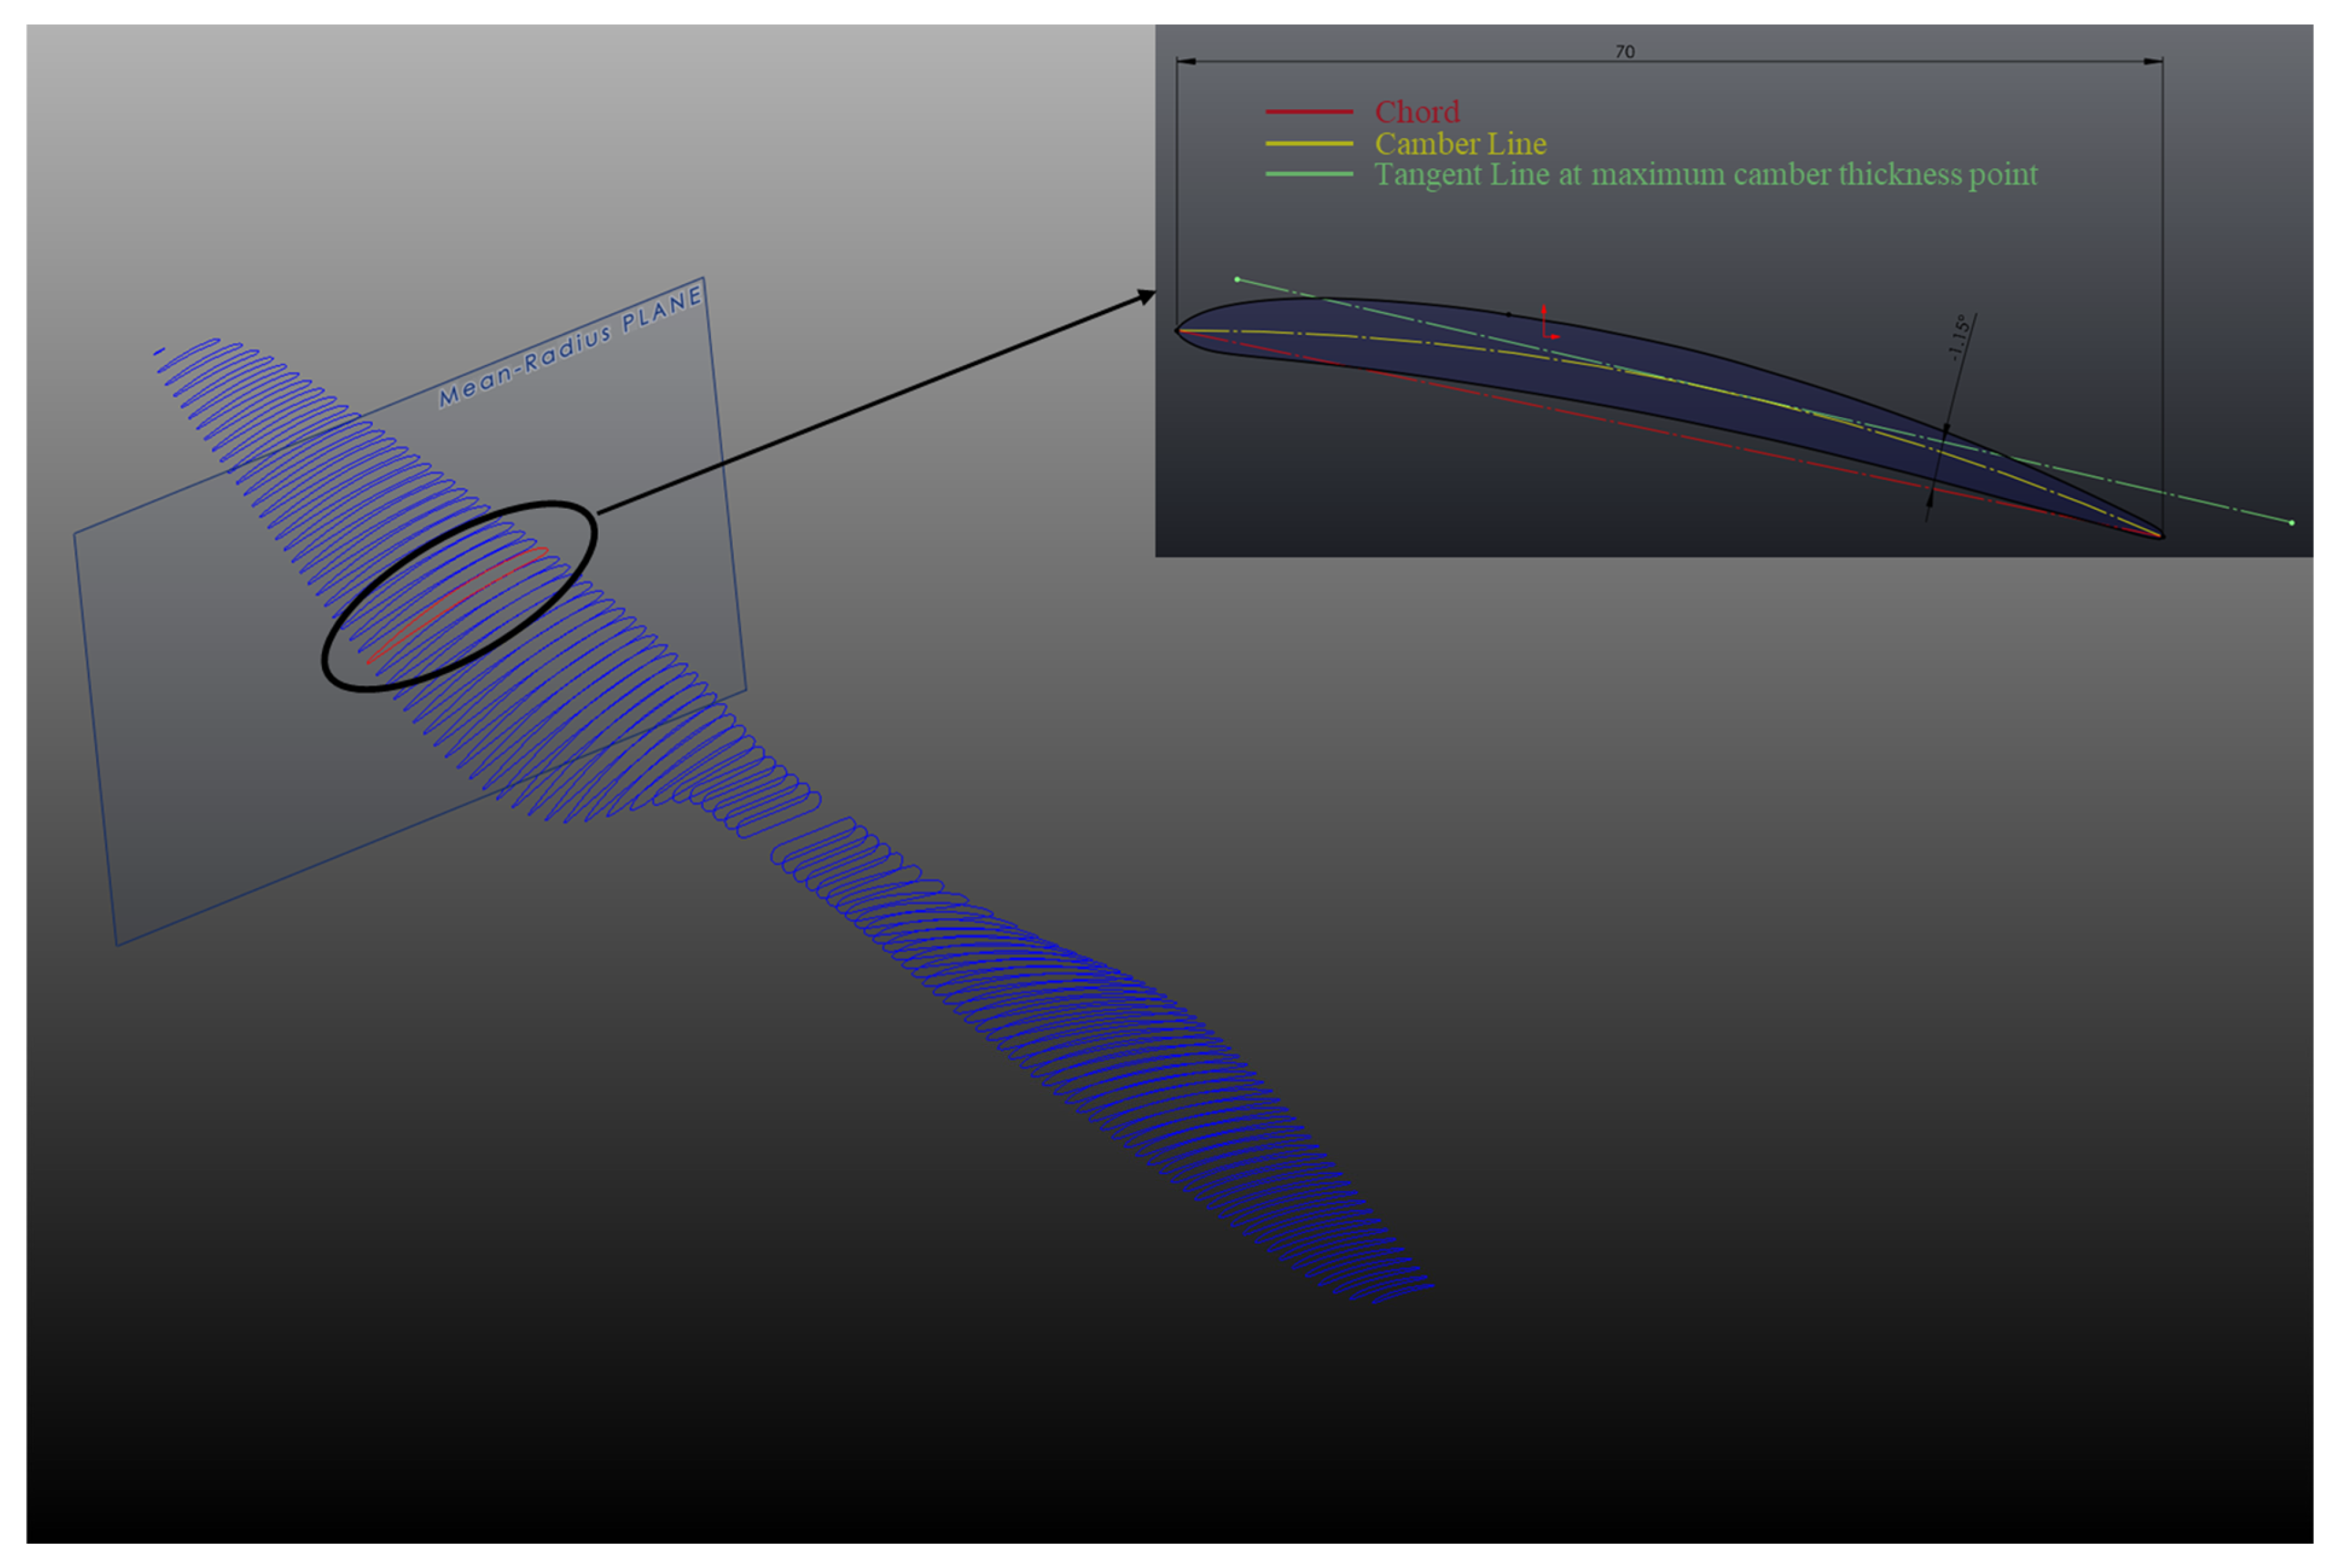
Figure 4 illustrates the three-dimensional geometry of the G30 × 10.5 propeller together with the mean-radius airfoil section used for analytical evaluation. The mean-radius plane (r/R = 0.5) was selected as representative for the overall aerodynamic behavior of the blade. In the inset, the local airfoil geometry is detailed, showing the chord line, camber line, and tangent at the point of maximum camber, which define the local camber angle and chord length employed in the Blade Element Theory calculations.
The first step is to calculate the non-dimensional circulation Γ ¯ as a function of the non-dimensional radius. In this context, circulation represents the strength of the rotational flow induced by the propeller blades and is directly related to the lift generated by each blade element. The non-dimensional circulation is defined as follows:
Γ ¯ = Γ π Ω R 1 2
where the dimensional expression of circulation is given by:
Γ = π b V 2 + Ω r 2 θ f + τ tan 1 V Ω r                  N Ω Γ 4 π V 2 V 2 + N Γ π r Ω r N Ω Γ 4 π r V
By substituting Formula (5) into Formula (4), and taking into account the simplifying assumption that the free-stream velocity is zero ( V = 0 ), the circulation equation in non-dimensional form can be rewritten. After applying some mathematical simplifications, the resulting form of the equation becomes:
Γ ¯ r ¯ V = 0 = N b ¯ 2 16 1 + 16 r ¯ N b ¯ θ f + τ 1 2
It can be observed that Formula (6) contains only a single unknown parameter, namely the blade setting angle θ f . This angle can be determined using Formula (7), which relates the local blade setting angle to the reference pitch angle distribution along the blade span.
θ f r ¯ = θ 0 + 1 r ¯ 1 r 1 ¯ Δ θ r o t
Here, Δ θ r o t represents the difference between the pitch angle at the blade root and that at the blade tip. In the present analysis, this value was considered to be 5°.
By defining all the required geometric and aerodynamic parameters and applying Formula (6), it is possible to determine the performance quantities of interest, particularly the thrust generated by the propeller and the corresponding power consumption.
The thrust generated by the propeller can be determined using the expression presented in Formula (8). This formulation relates the aerodynamic circulation distribution along the blade span to the total force developed, accounting for the contribution of each blade element.
F = π N ρ Ω 2 R 1 4 r 1 ¯ 1 Γ ¯ r ¯ r ¯ N Γ ¯ r ¯ 4 r ¯ d r ¯
Similarly, the power required by the propeller can be calculated using the equation provided in Formula (9). This relation integrates the circulation and induced velocity effects to determine the mechanical power absorbed at the propeller shaft.
P c ( 0 ) = π N ρ Ω 3 R 1 5 2 r 1 ¯ 1 Γ ¯ N Γ ¯ r ¯ r ¯ N Γ ¯ 4 r ¯ r ¯ d r ¯
By applying iterative calculation methods, the results obtained for the studied case indicate a thrust of F = 36.53   N and a shaft power of P c ( 0 ) = 318.47   W . These values represent the analytical estimation of propeller performance under the imposed conditions and form the basis for subsequent comparison with numerical and experimental results.

2.3. Computational Fluid Dynamics (CFD) Analysis

This section presents the CFD simulation methodology employed to investigate the aerodynamic performance of the propeller system. The numerical analysis was designed to complement the analytical estimations and experimental measurements by providing detailed insight into the flow field characteristics. To achieve this, the simulations were structured around three representative geometric configurations, each intended to isolate and quantify the influence of specific components:
  • the isolated propeller, considered in free-stream conditions
  • the propeller coupled with the downstream-mounted motor
  • the complete assembly consisting of propeller, motor, and mounting plate, corresponding to the actual configuration of the experimental stand
Through this stepwise approach, the objective was to identify and quantify the aerodynamic effects generated by each individual component and to establish a reliable correlation between CFD predictions and experimental test results.
To numerically resolve the flow field around the propeller, the governing equations of fluid motion were solved using the Reynolds-Averaged Navier–Stokes (RANS) formulation in a rotating reference frame. The simulations accounted for the effects of rotation, turbulence, and pressure gradients through the appropriate source terms and closure relations. Turbulence effects were modeled using the k–ω Shear Stress Transport (SST) model, which combines the near-wall accuracy of the k–ω model with the robust free-stream behavior of the k–ε formulation. The governing equations employed in this study are presented below.
The flow is modeled by the steady RANS equations in a rotating reference frame attached to the propeller region. Let u  be the relative velocity, ρ  the density, p  the static pressure, μ  the molecular viscosity, and μ t  the eddy viscosity.
Continuity
× ρ u
Momentum (Rotating Frame)
( ρ u u ) = p + × [ μ eff ( u + ( u ) T ) 2 3 μ eff ( × u ) I ] + S Ω
where μ eff = μ + μ t
S Ω = 2 ρ Ω × u ρ Ω × ( Ω × r )
The k–ω Shear Stress Transport (SST) model blends the k–ω model near walls with k–ε behavior in the outer region and limits turbulent shear stress to improve separation prediction.
Transport for turbulent kinetic energy k
( ρ u k ) = P k β * ρ k ω + × [ ( μ + σ k μ t ) k ]
Transport for specific dissipation rate ω
× ( ρ u ω ) = α ω k P k β ρ ω 2 + × [ ( μ + σ ω μ t ) ω ] + 2 ( 1 F 1 ) ρ σ ω 2 1 ω k × ω
The last term is the cross-diffusion term that activates away from the wall through the blending function F 1 .
Eddy viscosity and shear-stress limiter
μ t = ρ ν t = ρ a 1 k m a x ( a 1 ω , S F 2 ) , S = 2 S i j S i j ,     S i j = 1 2 ( u i x j + u j x i )
Production limiter (recommended in SST)
P k = m i n ( τ i j u i x j , 10 β * ρ k ω ) , τ i j = 2 μ t S i j 2 3 ρ k δ i j
Blending functions
F 1 = t a n h ( Φ 1 4 ) , F 2 = t a n h ( Φ 2 2 )
with typical definitions
Φ 1 = m i n [ m a x ( k β * ω y , 500 ν y 2 ω ) , 4 ρ σ ω 2 k m a x ( C D ω , 10 10 ) y 2 ] , Φ 2 = m a x ( 2 k β * ω y , 500 ν y 2 ω )
C D ω = 2 ρ σ ω 2 k ω ω
Model constants (Menter SST):
a 1 = 0.31 , κ = 0.41 , β * = 0.09 , σ k 1 = 0.85 , σ ω 1 = 0.5 , β 1 = 0.075 , σ k 2 = 1.0 , σ ω 2 = 0.856 , β 2 = 0.0828

2.3.1. Isolated Propeller

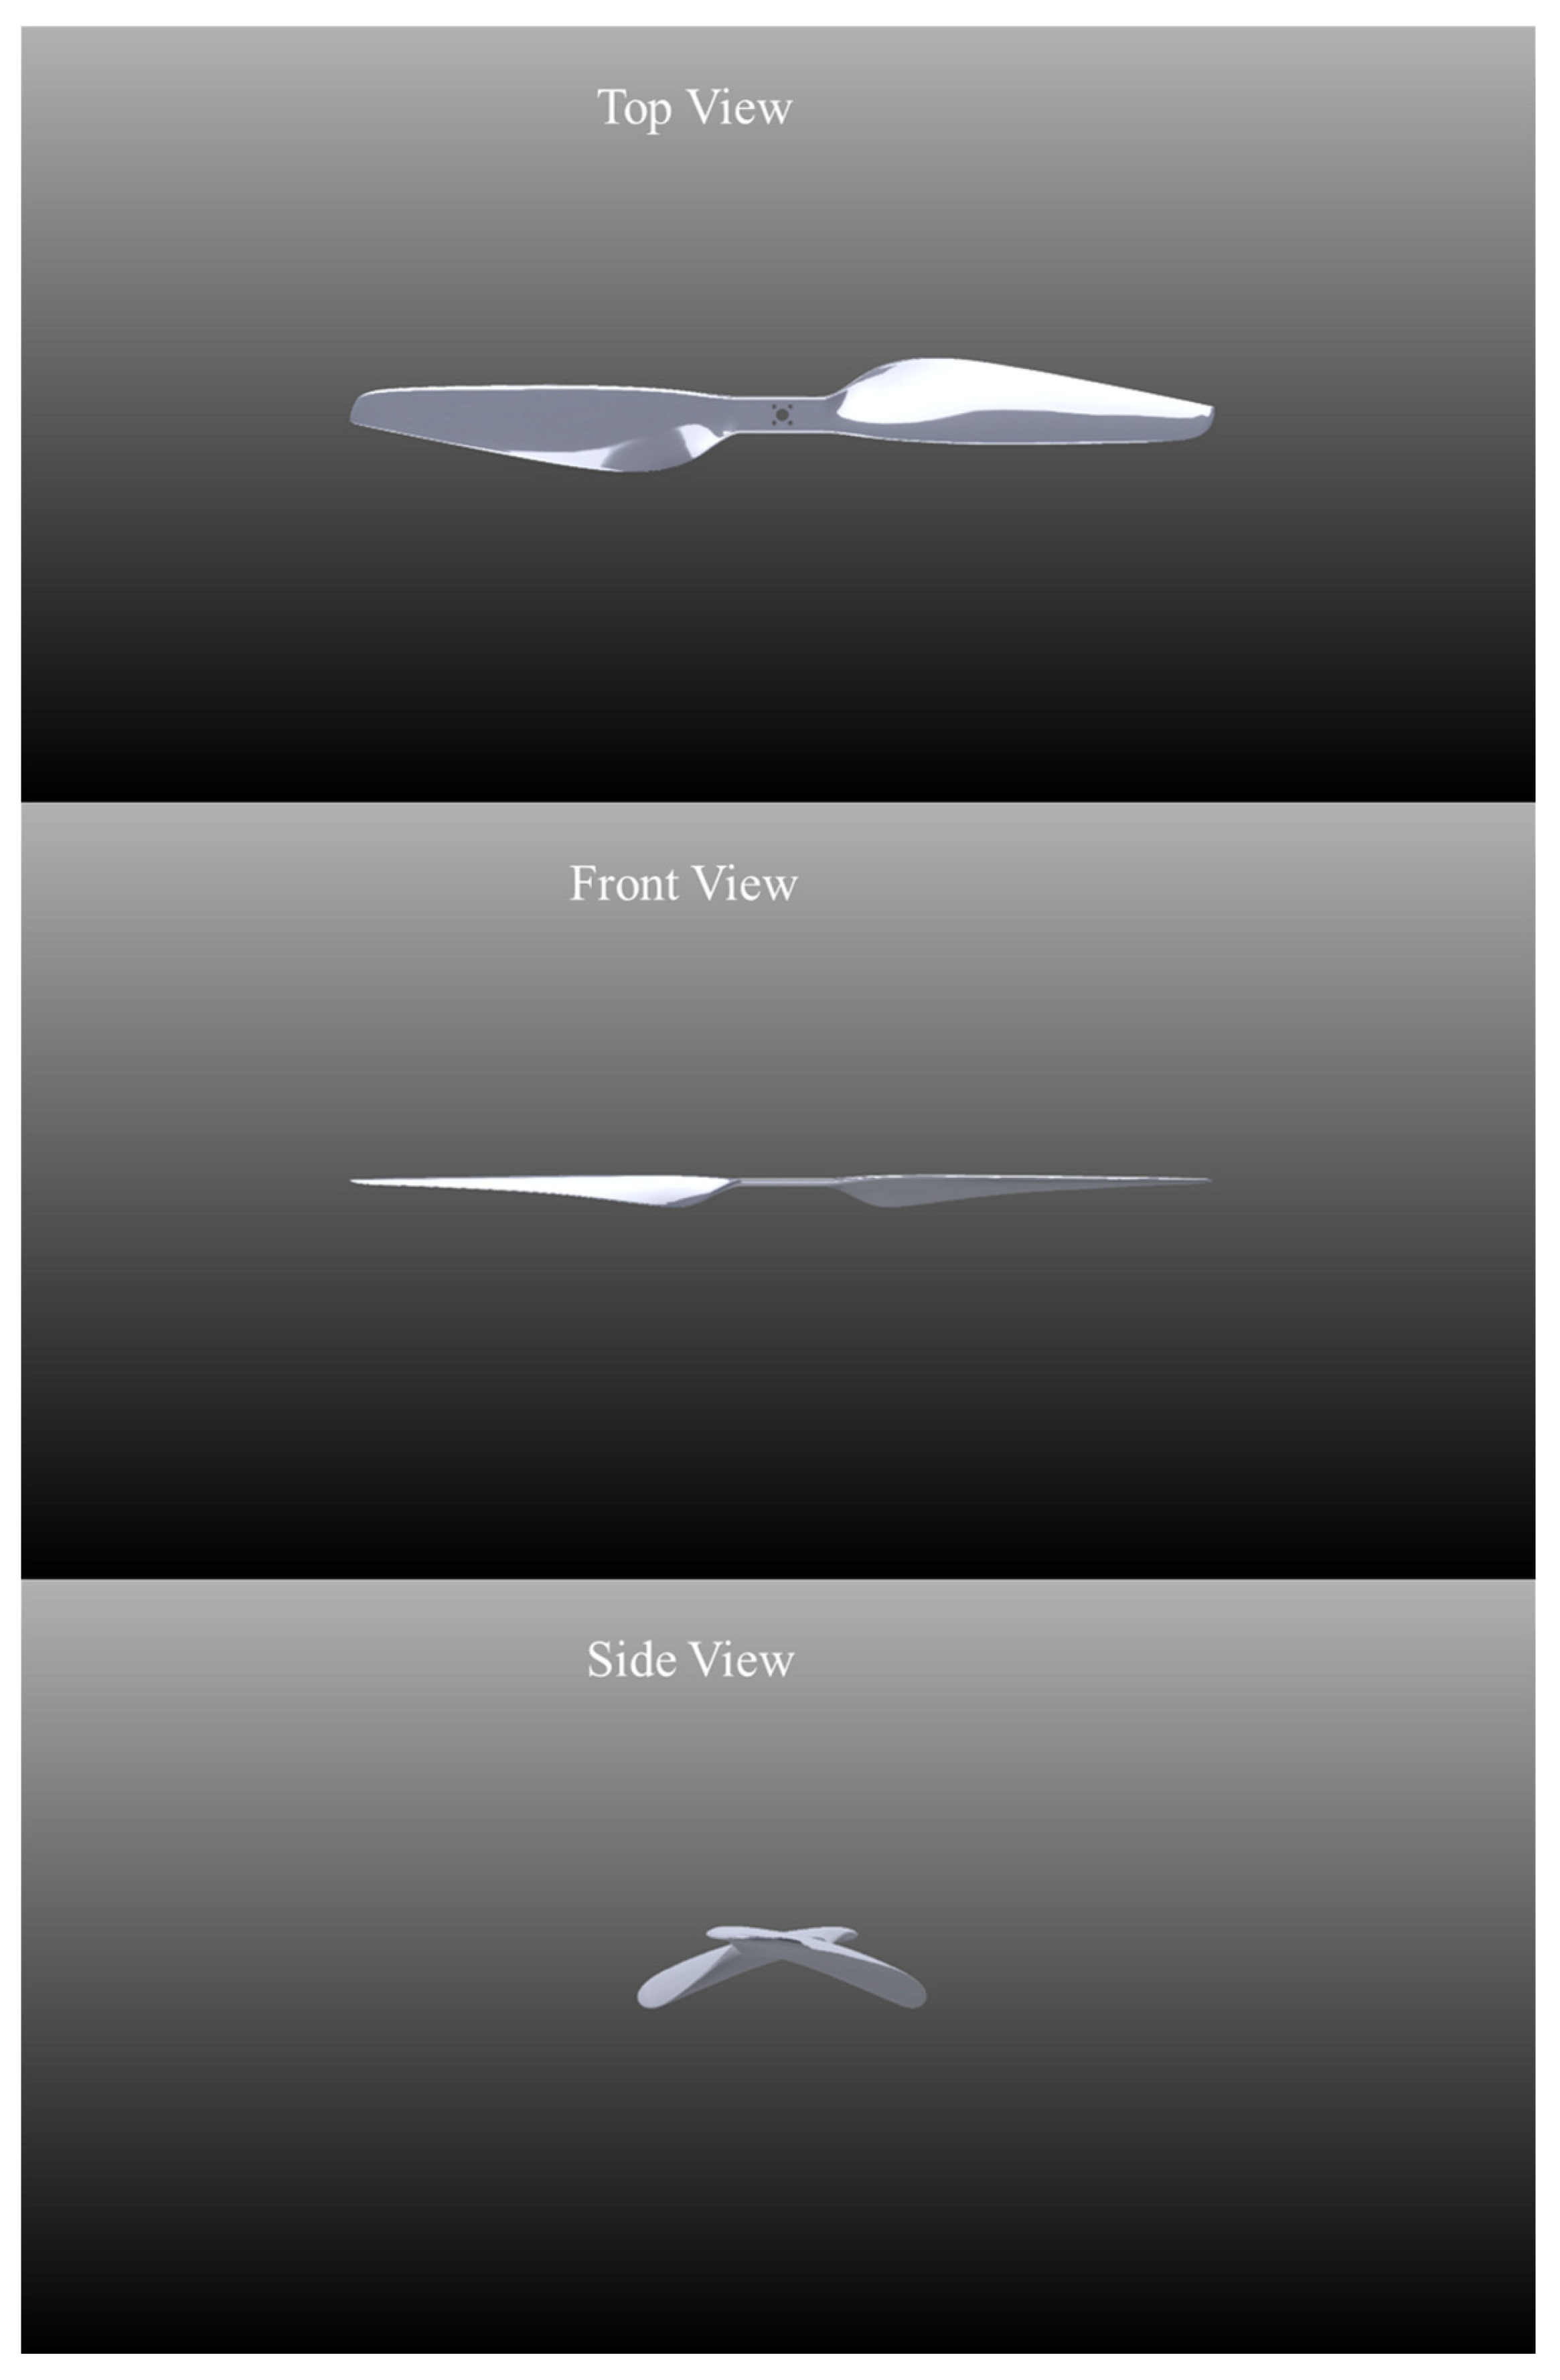
The propeller employed in this study is the G30 × 10.5 model, manufactured by T-MOTOR and made of carbon fiber composite. It has a diameter of 30 inches and a geometric pitch of 10.5 inches, with a hub diameter of 80 mm. The carbon fiber–based composite material ensures high rigidity and superior mechanical strength compared with propellers made from glass-fiber-reinforced plastics, thereby reducing vibration phenomena and improving dynamic stability. The increased stiffness also guarantees precise maintenance of the constant pitch across the full range of rotational speeds, an essential factor for aerodynamic performance and for the reproducibility of experimental results. The optimized geometry of this model, combined with the low specific mass of the composite material, enhances propulsive efficiency and contributes to improved acoustic behavior. The CAD model of the G30 × 10.5 propeller, used both for CFD simulations and for geometric analysis, is presented in Figure 5.
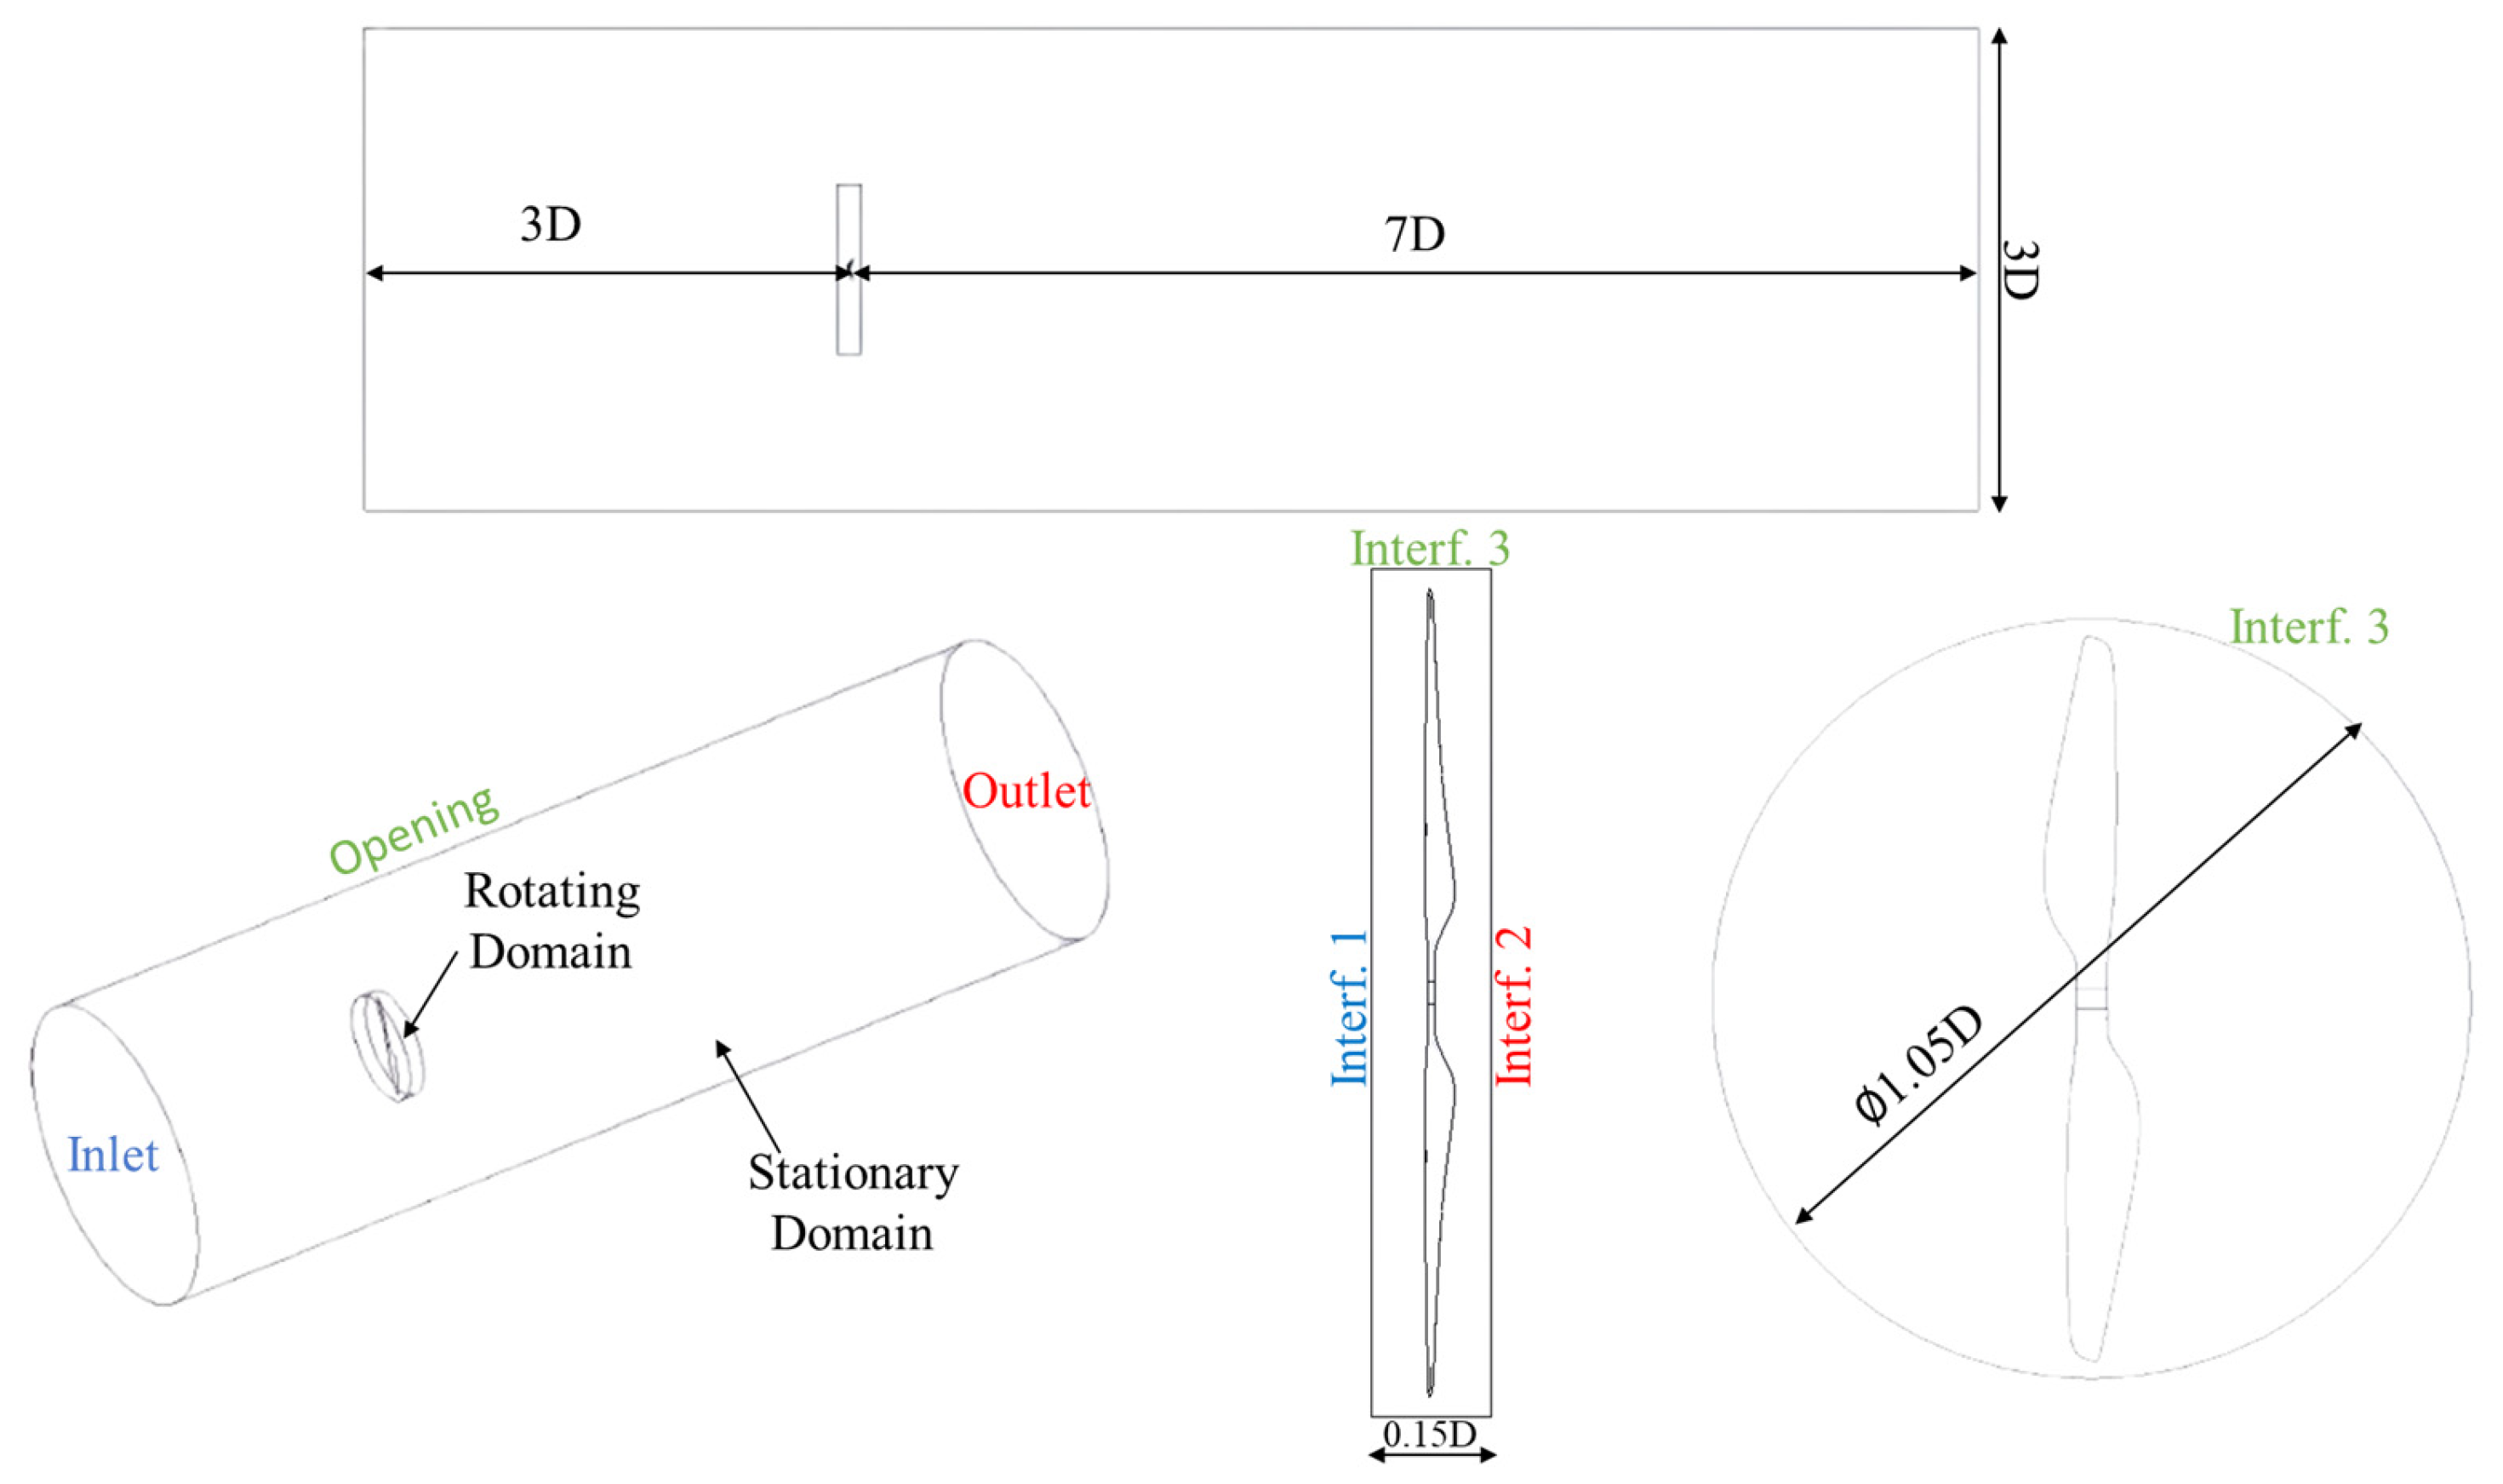
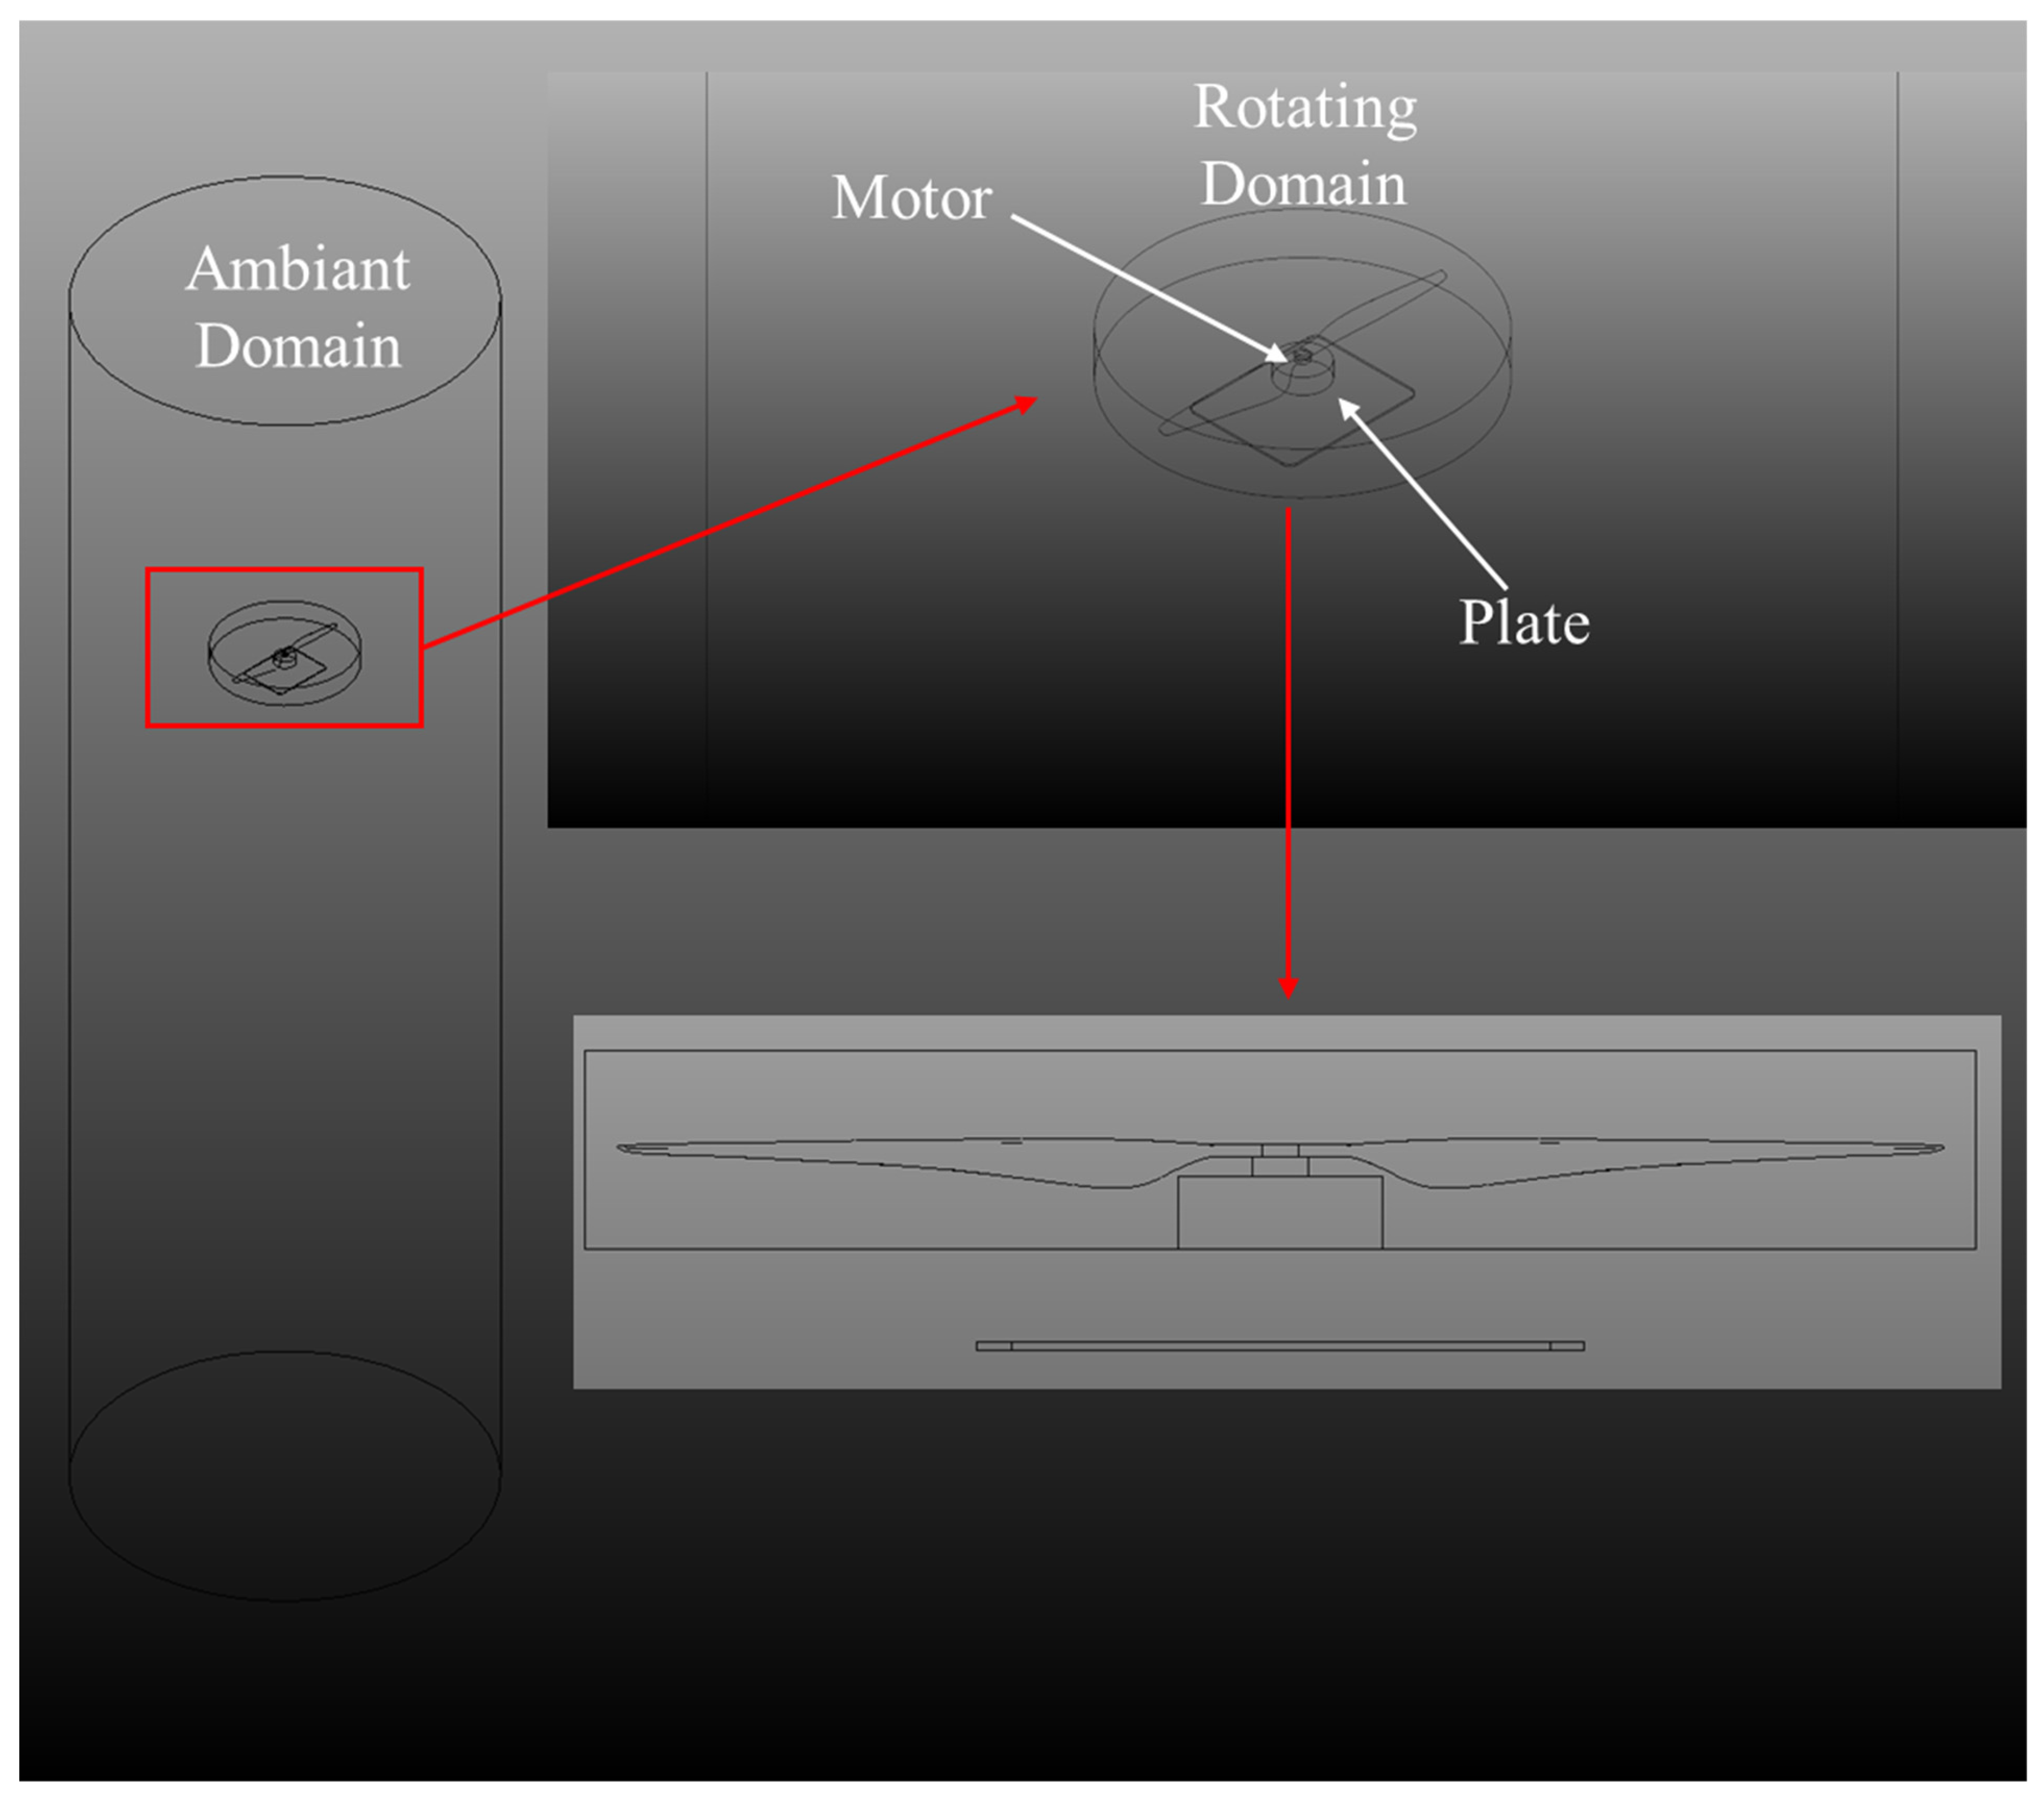
For the preparation of the CFD case, the computational domain was divided into two distinct regions: an outer domain, representing the stationary ambient environment, and an inner domain, corresponding to the rotating volume of the propeller. Between the two regions, three frozen rotor interfaces were defined, allowing the transfer of flow fields (pressure, velocity, and turbulent kinetic energy) between the rotating and stationary domains, thereby ensuring solution continuity.
At the inlet boundary, a total pressure condition (pressure inlet) was imposed, enabling the simulation of operating regimes with an a priori unknown mass flow rate and more accurately reproducing experimental conditions. The outlet boundary was treated as a pressure outlet, while the lateral walls were set as openings in order to prevent artificial reflections and to allow the flow to develop freely. The rotational speed of the rotating domain was set to 2174 rpm. The domain configuration, illustrated in Figure 6, thus enables comparative simulations of the three analyzed configurations (isolated propeller, propeller with motor, and propeller + motor + plate) under conditions closely matching those of the experimental tests.
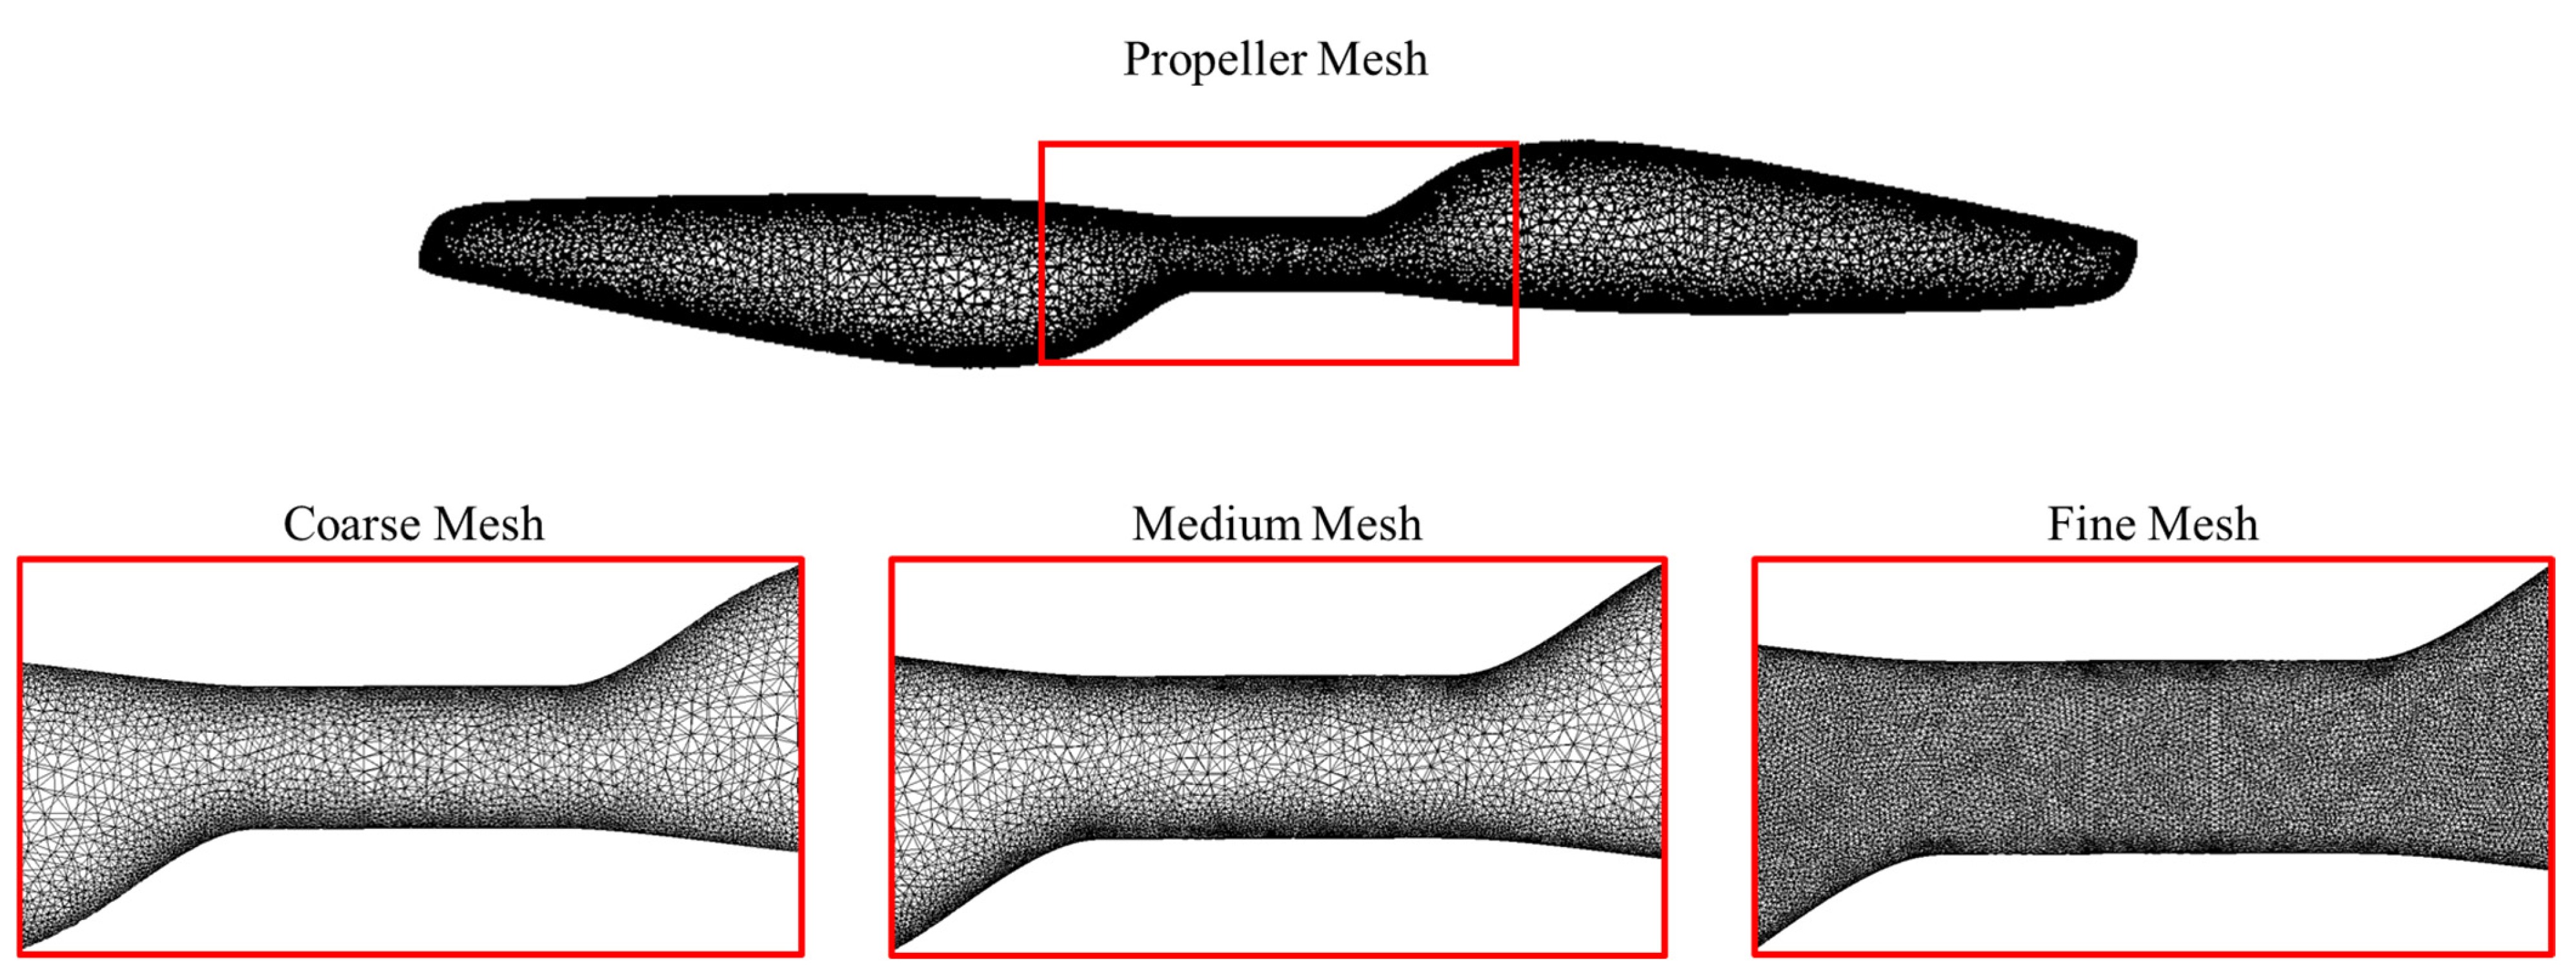
For this case, a structured mesh was generated around the propeller and an unstructured mesh was applied to the remaining domain, resulting in a total of 11,113,303 elements and 3,817,939 nodes. Before finalizing the grid configuration, a mesh sensitivity analysis was conducted using three mesh resolutions—coarse, medium, and fine—to evaluate the influence of grid density on the propeller’s aerodynamic performance. The comparison between these configurations, shown in Figure 7, demonstrated that the medium mesh provided grid-independent results, ensuring an optimal balance between computational efficiency and accuracy. In the vicinity of the propeller surface, successive simulations were carried out to adjust the height of the first cell, ensuring that the resulting y+ values were within the range recommended in the literature for accurate boundary-layer resolution. Following these tests, an average value of y+ ≈ 1.3 was obtained on the propeller surface, which lies within the optimal interval for turbulence modeling using the k–ω SST model. As reported in [32], y+ values of the order of unity confirm both the quality and the accuracy of the mesh, thereby validating the grid employed in this study.
The numerical simulations were performed using the ANSYS 2023 R2CFX solver, which provides a robust framework for analyzing complex flows involving rotor–flow interactions. For turbulence modeling, k–ω SST model was adopted, as it is widely recognized for its accuracy in capturing velocity gradients within the boundary layer and in regions with local flow separation.
Although the k ω SST model provides robust and accurate predictions for separated flows and near-wall gradients, it exhibits certain limitations when applied to low-Reynolds-number regimes such as small-scale UAV propellers. In these conditions, portions of the flow may remain laminar or transitional, and the model’s assumption of fully turbulent behavior can lead to an overprediction of shear stresses and aerodynamic forces. Moreover, the accuracy of near-wall treatment is strongly influenced by mesh quality and y + resolution; insufficient refinement can impair the correct capture of laminar–turbulent transition and localized separation phenomena. Despite these constraints, the k ω SST model was chosen in this study for its proven balance between computational efficiency and physical fidelity in rotating flows, as demonstrated in recent investigations of small rotors and UAV propellers [33,34].
The iterative solution process was closely monitored using strict convergence criteria, with the stopping threshold set to residual values below 10−6 for all governing equations. The adoption of this criterion ensured numerical stability and provided confidence in the accuracy and reliability of the obtained solutions.

2.3.2. Propeller + Motor

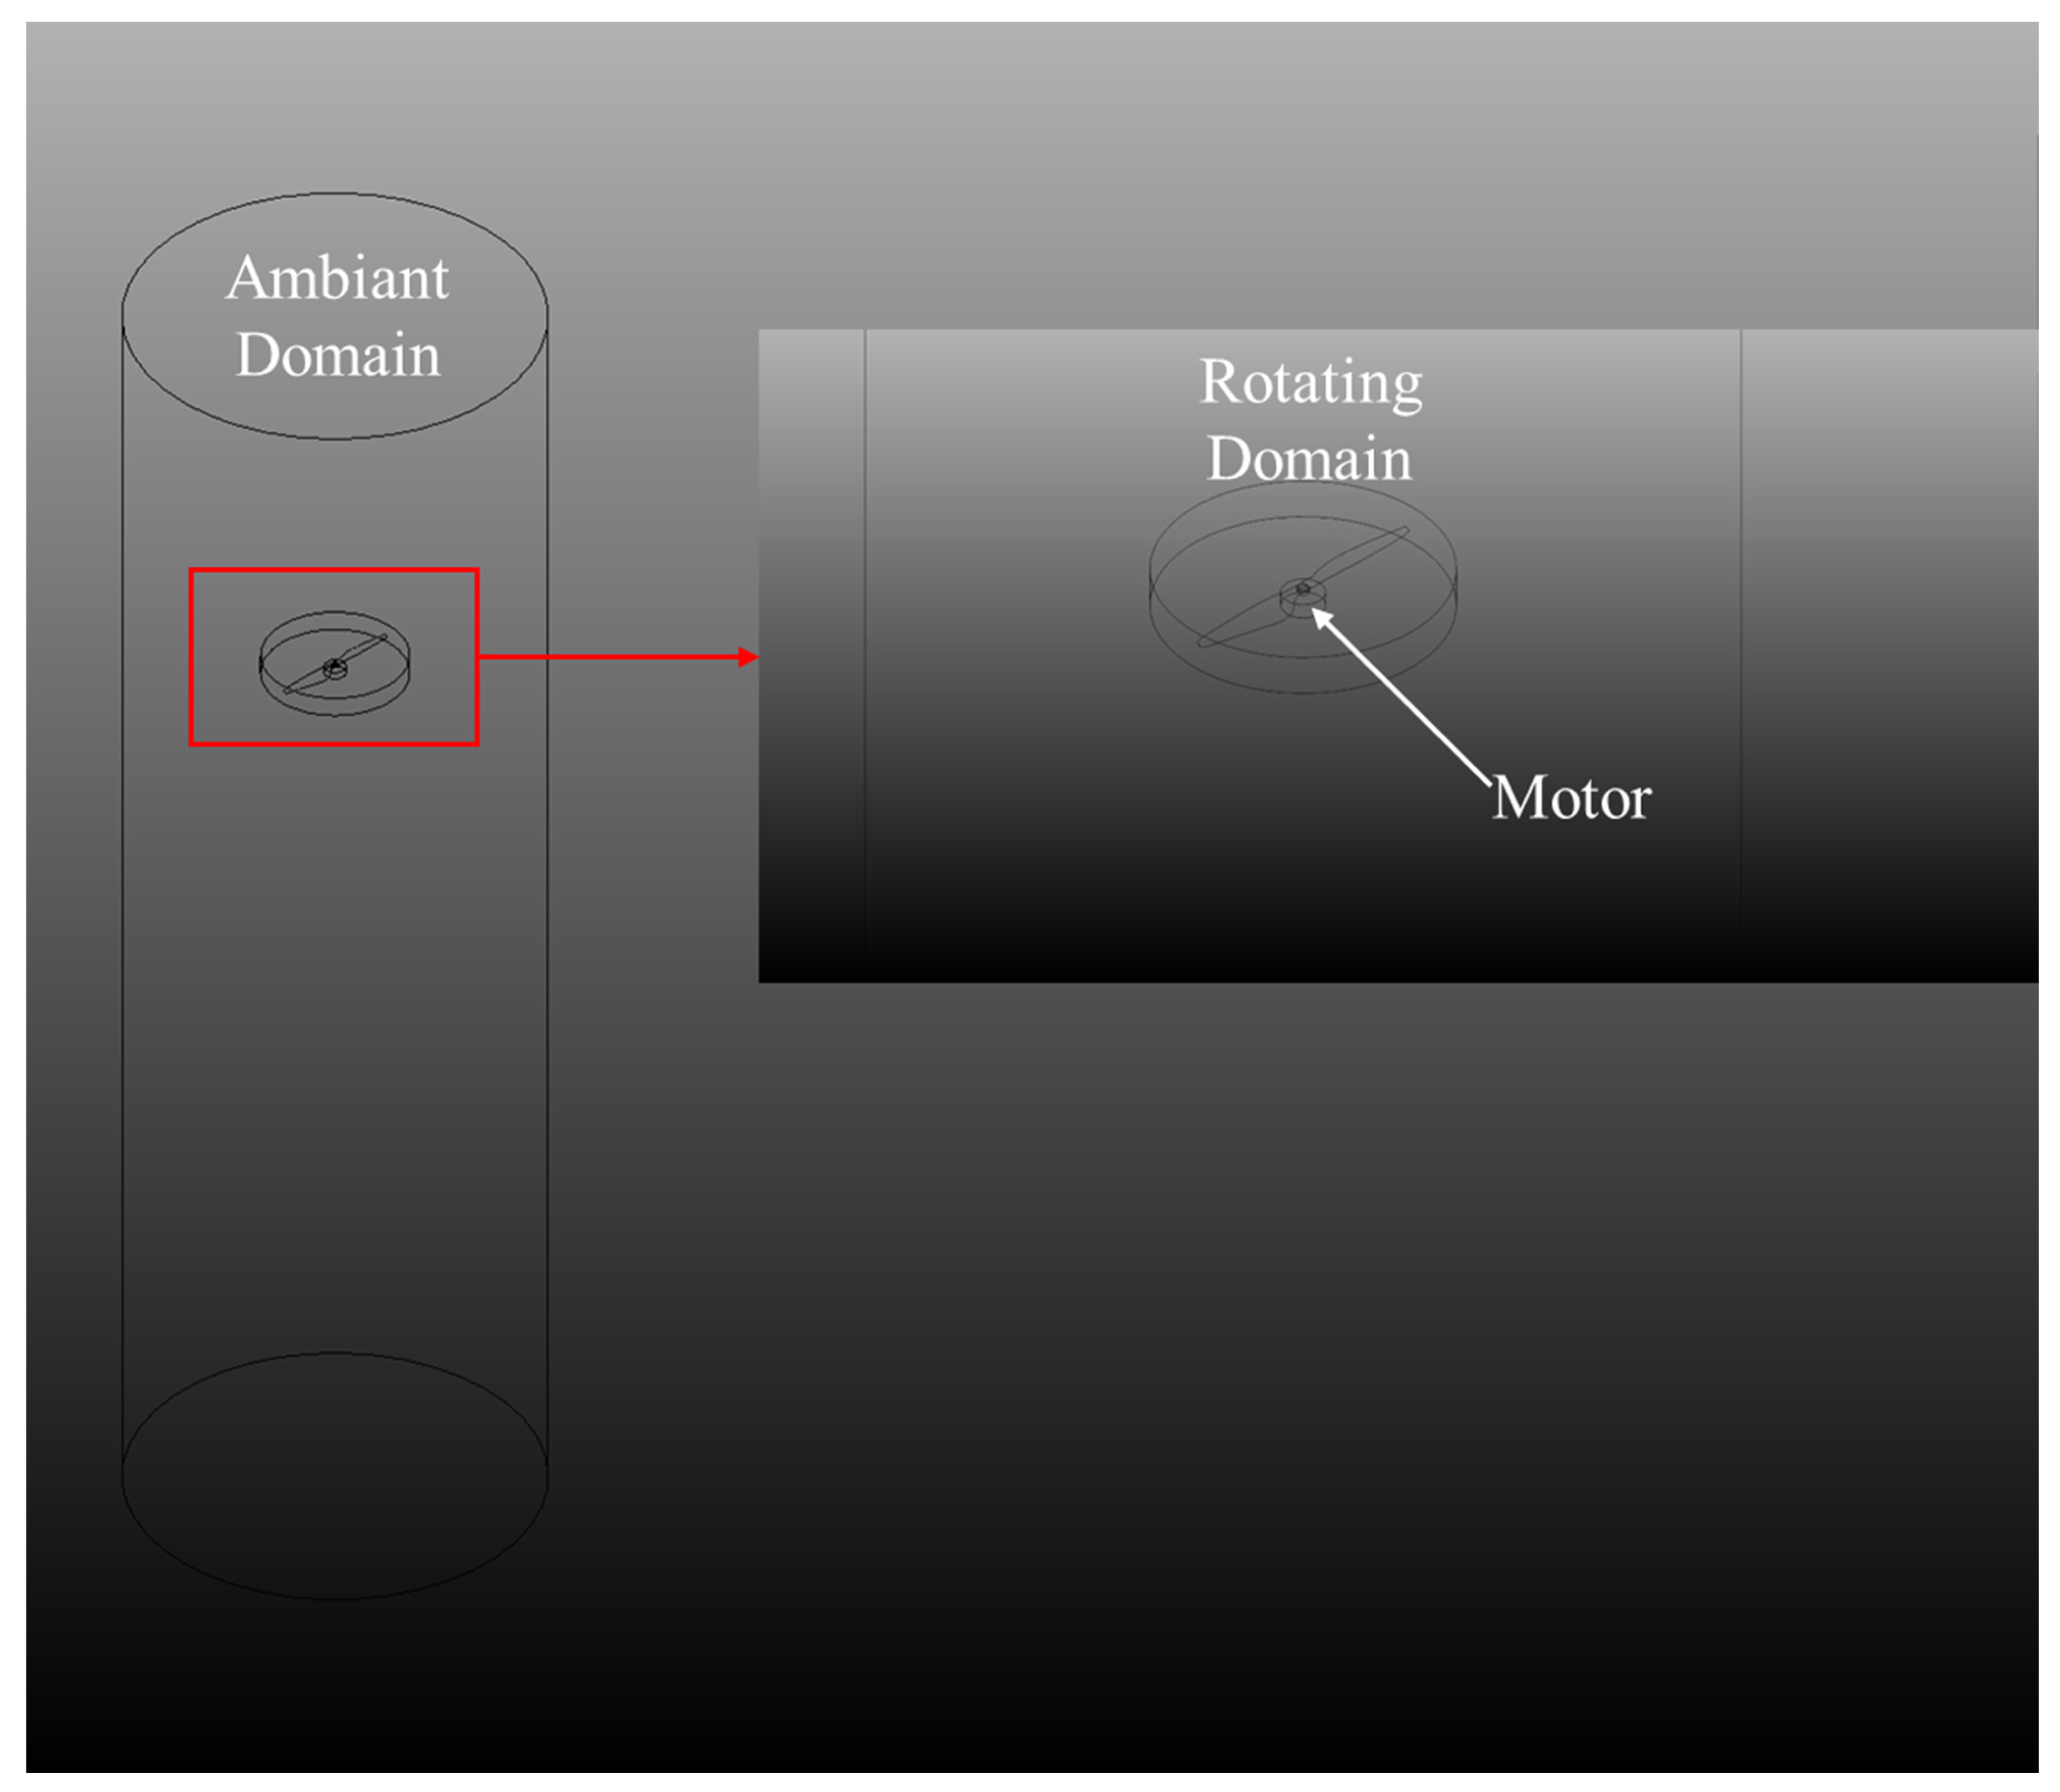
For the second configuration analyzed, the dimensions of the computational domain were kept identical to those described in the previous subsection, thereby ensuring consistency across simulations. The essential difference lies in the introduction of the motor, positioned immediately behind the propeller and tangent to its hub. Figure 8 illustrates the new rotating domain, which now includes both the propeller geometry and the motor body. The boundary conditions were maintained as in the previous case, with the distinction that the external surface of the motor was defined as a wall, in order to highlight its influence on the aerodynamic field generated by the propeller.
The mesh generation settings were kept unchanged from the previous case, thereby maintaining identical refinement criteria in the boundary-layer region and yielding similar y+ values on the propeller surface. The only notable modification was the additional geometric complexity introduced by the motor, which resulted in an increase in mesh discretization. Consequently, the final grid for this case consisted of 13,018,426 elements and 4,026,172 nodes.
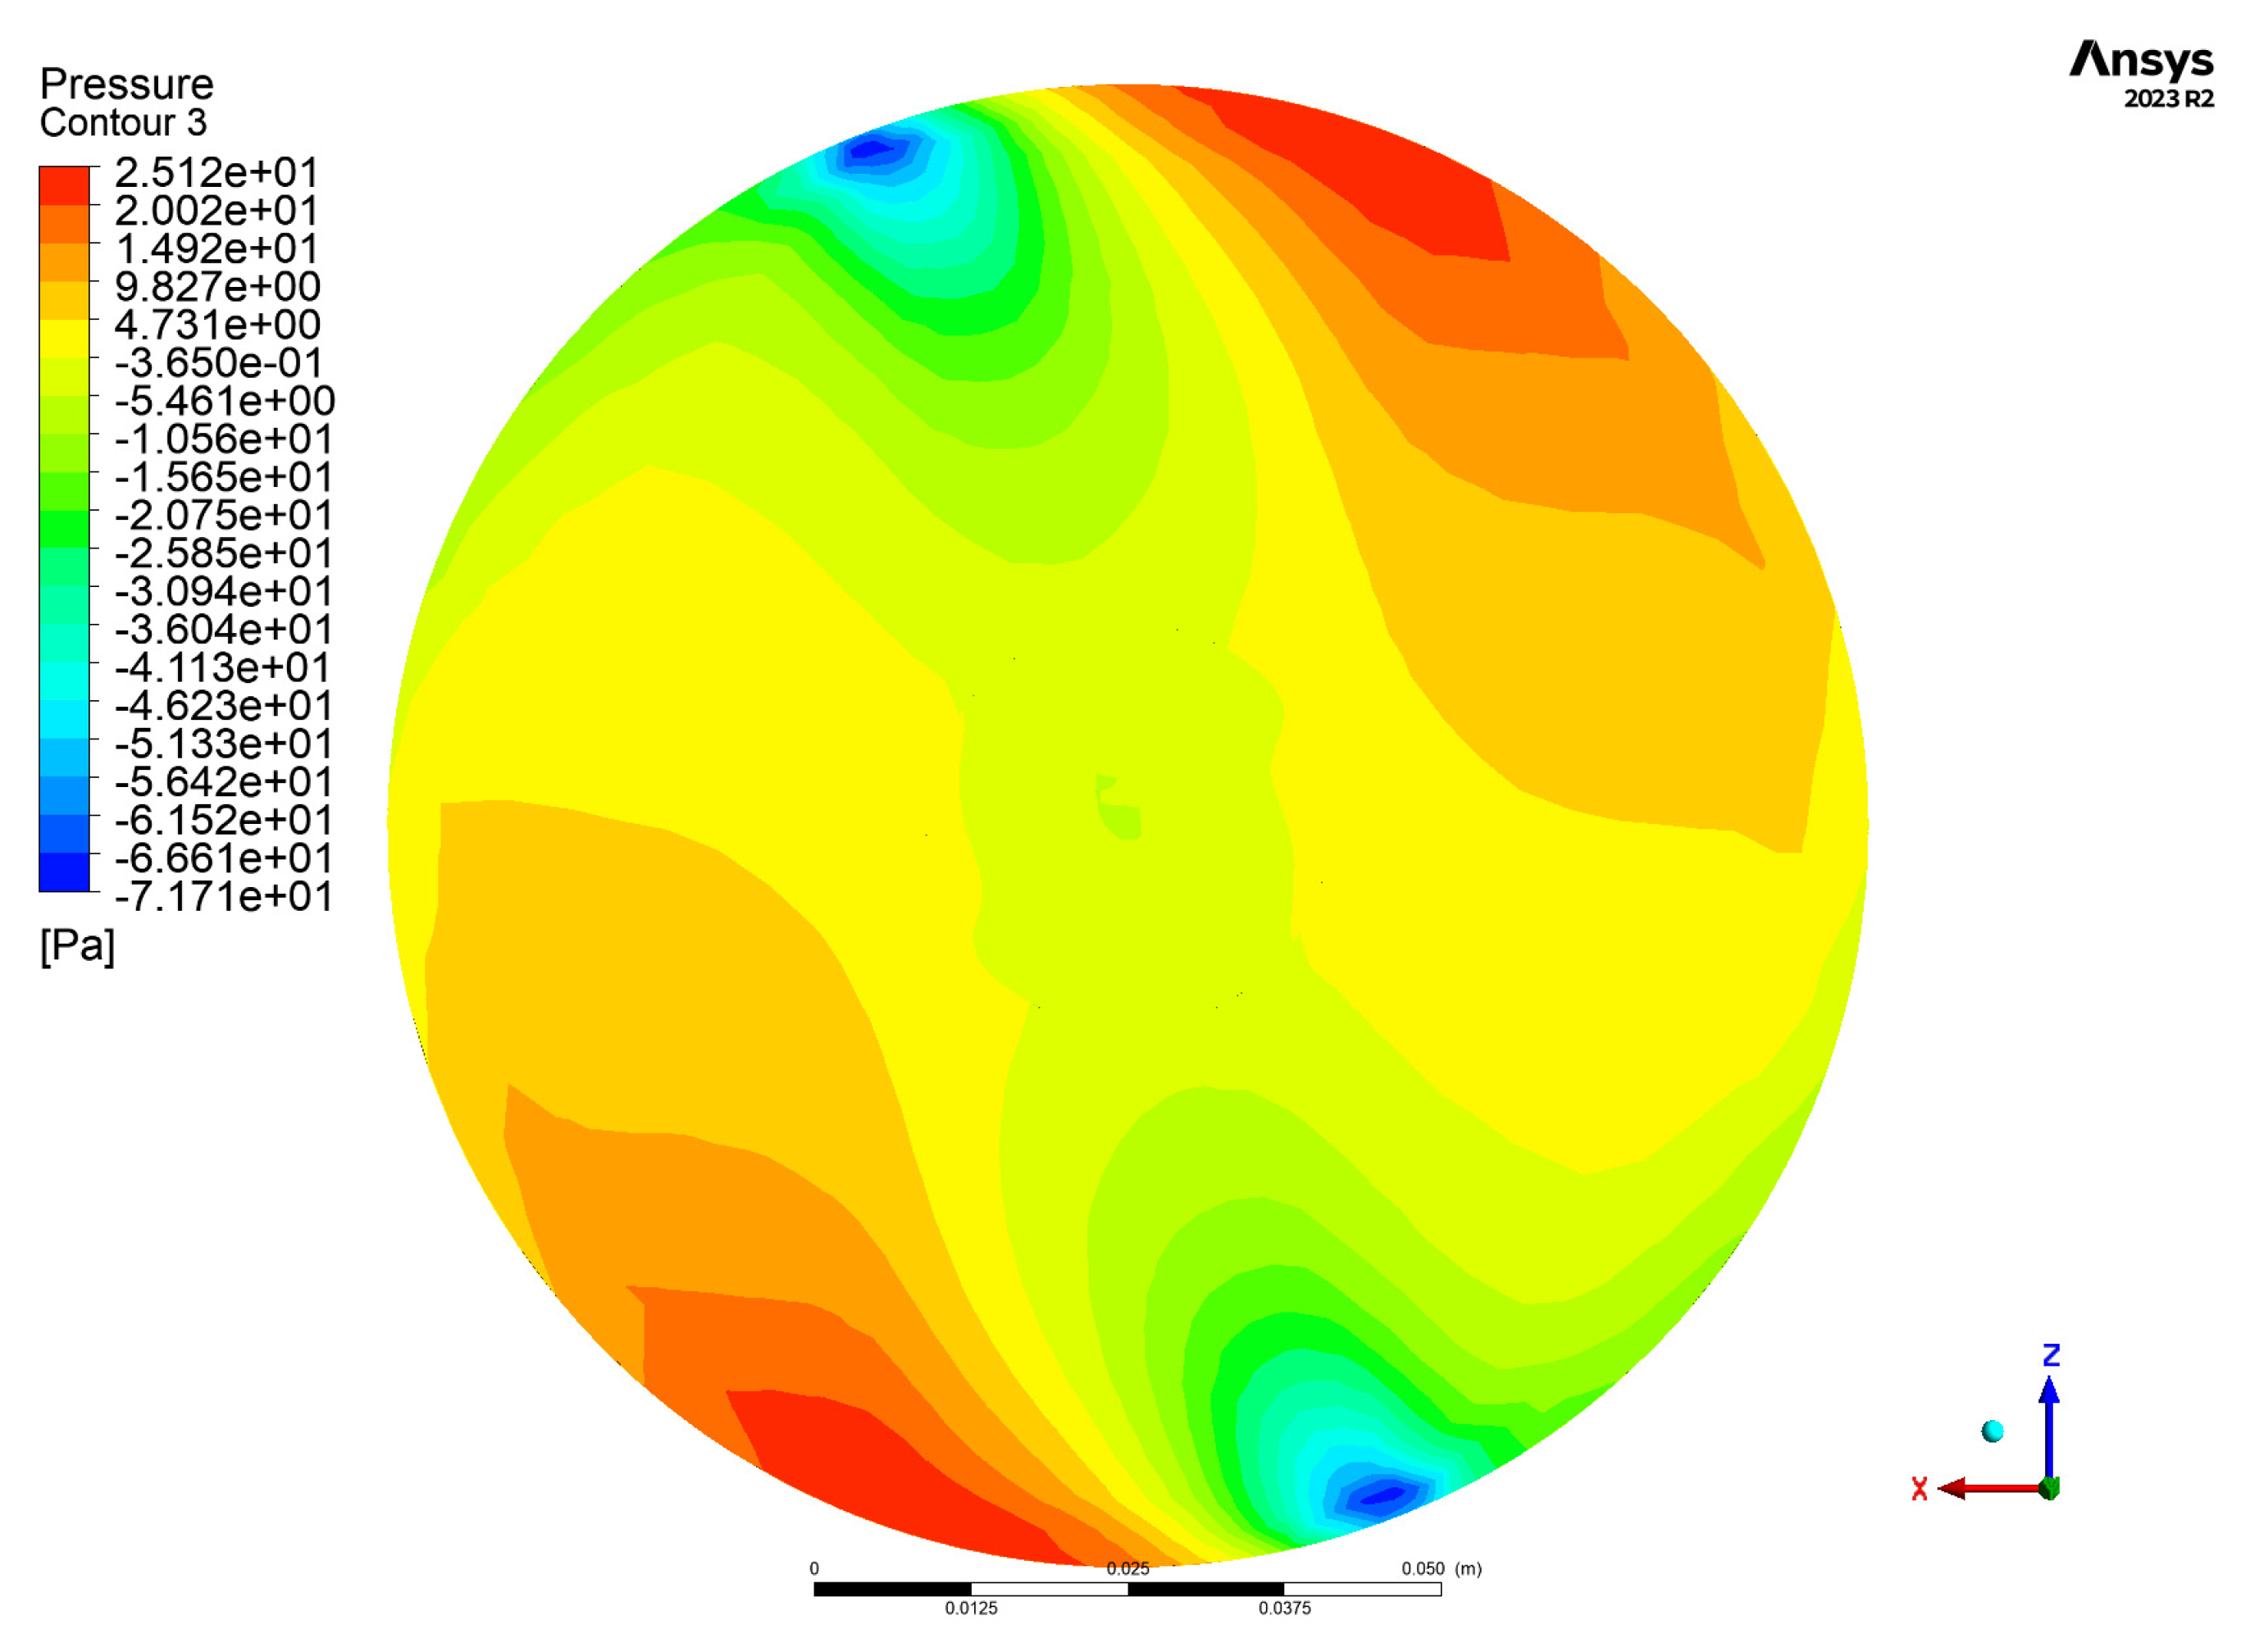
Compared with the first case (isolated propeller), the differences introduced by adding the motor are not significant, which can be explained by the relatively small size of the motor with respect to the propeller disk. With a diameter of approximately 118 mm, the motor does not significantly penetrate the active region of the blades, which is primarily responsible for thrust generation. Nevertheless, its presence induces local modifications in the pressure field, as illustrated in Figure 9.
The pressure distribution on the motor surface highlights areas of slight overpressure in the central region, associated with the direct impact of the propeller jet, as well as lower-pressure regions near the lateral edges, generated by flow acceleration and recirculation effects. These local variations confirm the interaction between the propeller wake and the obstacle introduced by the motor, but without substantially affecting the overall performance of the propulsion system.

2.3.3. Propeller + Motor + Plate

For the third configuration analyzed, in addition to the motor, the mounting plate was also introduced, this component being extracted from the 3D model of the experimental stand. To simplify the case, only the main surfaces of the plate were considered, positioned at a distance of 50 mm downstream of the propeller. The motor fastening brackets were excluded, as their dimensions are very close to those of the motor itself, and their influence on the flow field would have been negligible. The resulting configuration is shown in Figure 10.
As in the previous cases, the domain dimensions and boundary conditions were kept unchanged. However, the introduction of the plate into the ambient domain required the definition of an additional wall boundary condition in order to capture the supplementary effects generated by this component on the pressure distribution and on the wake induced by the propeller.
As in the previous cases, the mesh generation settings were kept identical, maintaining the same refinement criteria and boundary-layer treatment, which ensured similar y+ values on the propeller surface. However, the introduction of the plate into the computational domain increased the geometric complexity and consequently the total number of elements and nodes. For this configuration, the final mesh consisted of 16,562,829 elements and 5,147,109 nodes.
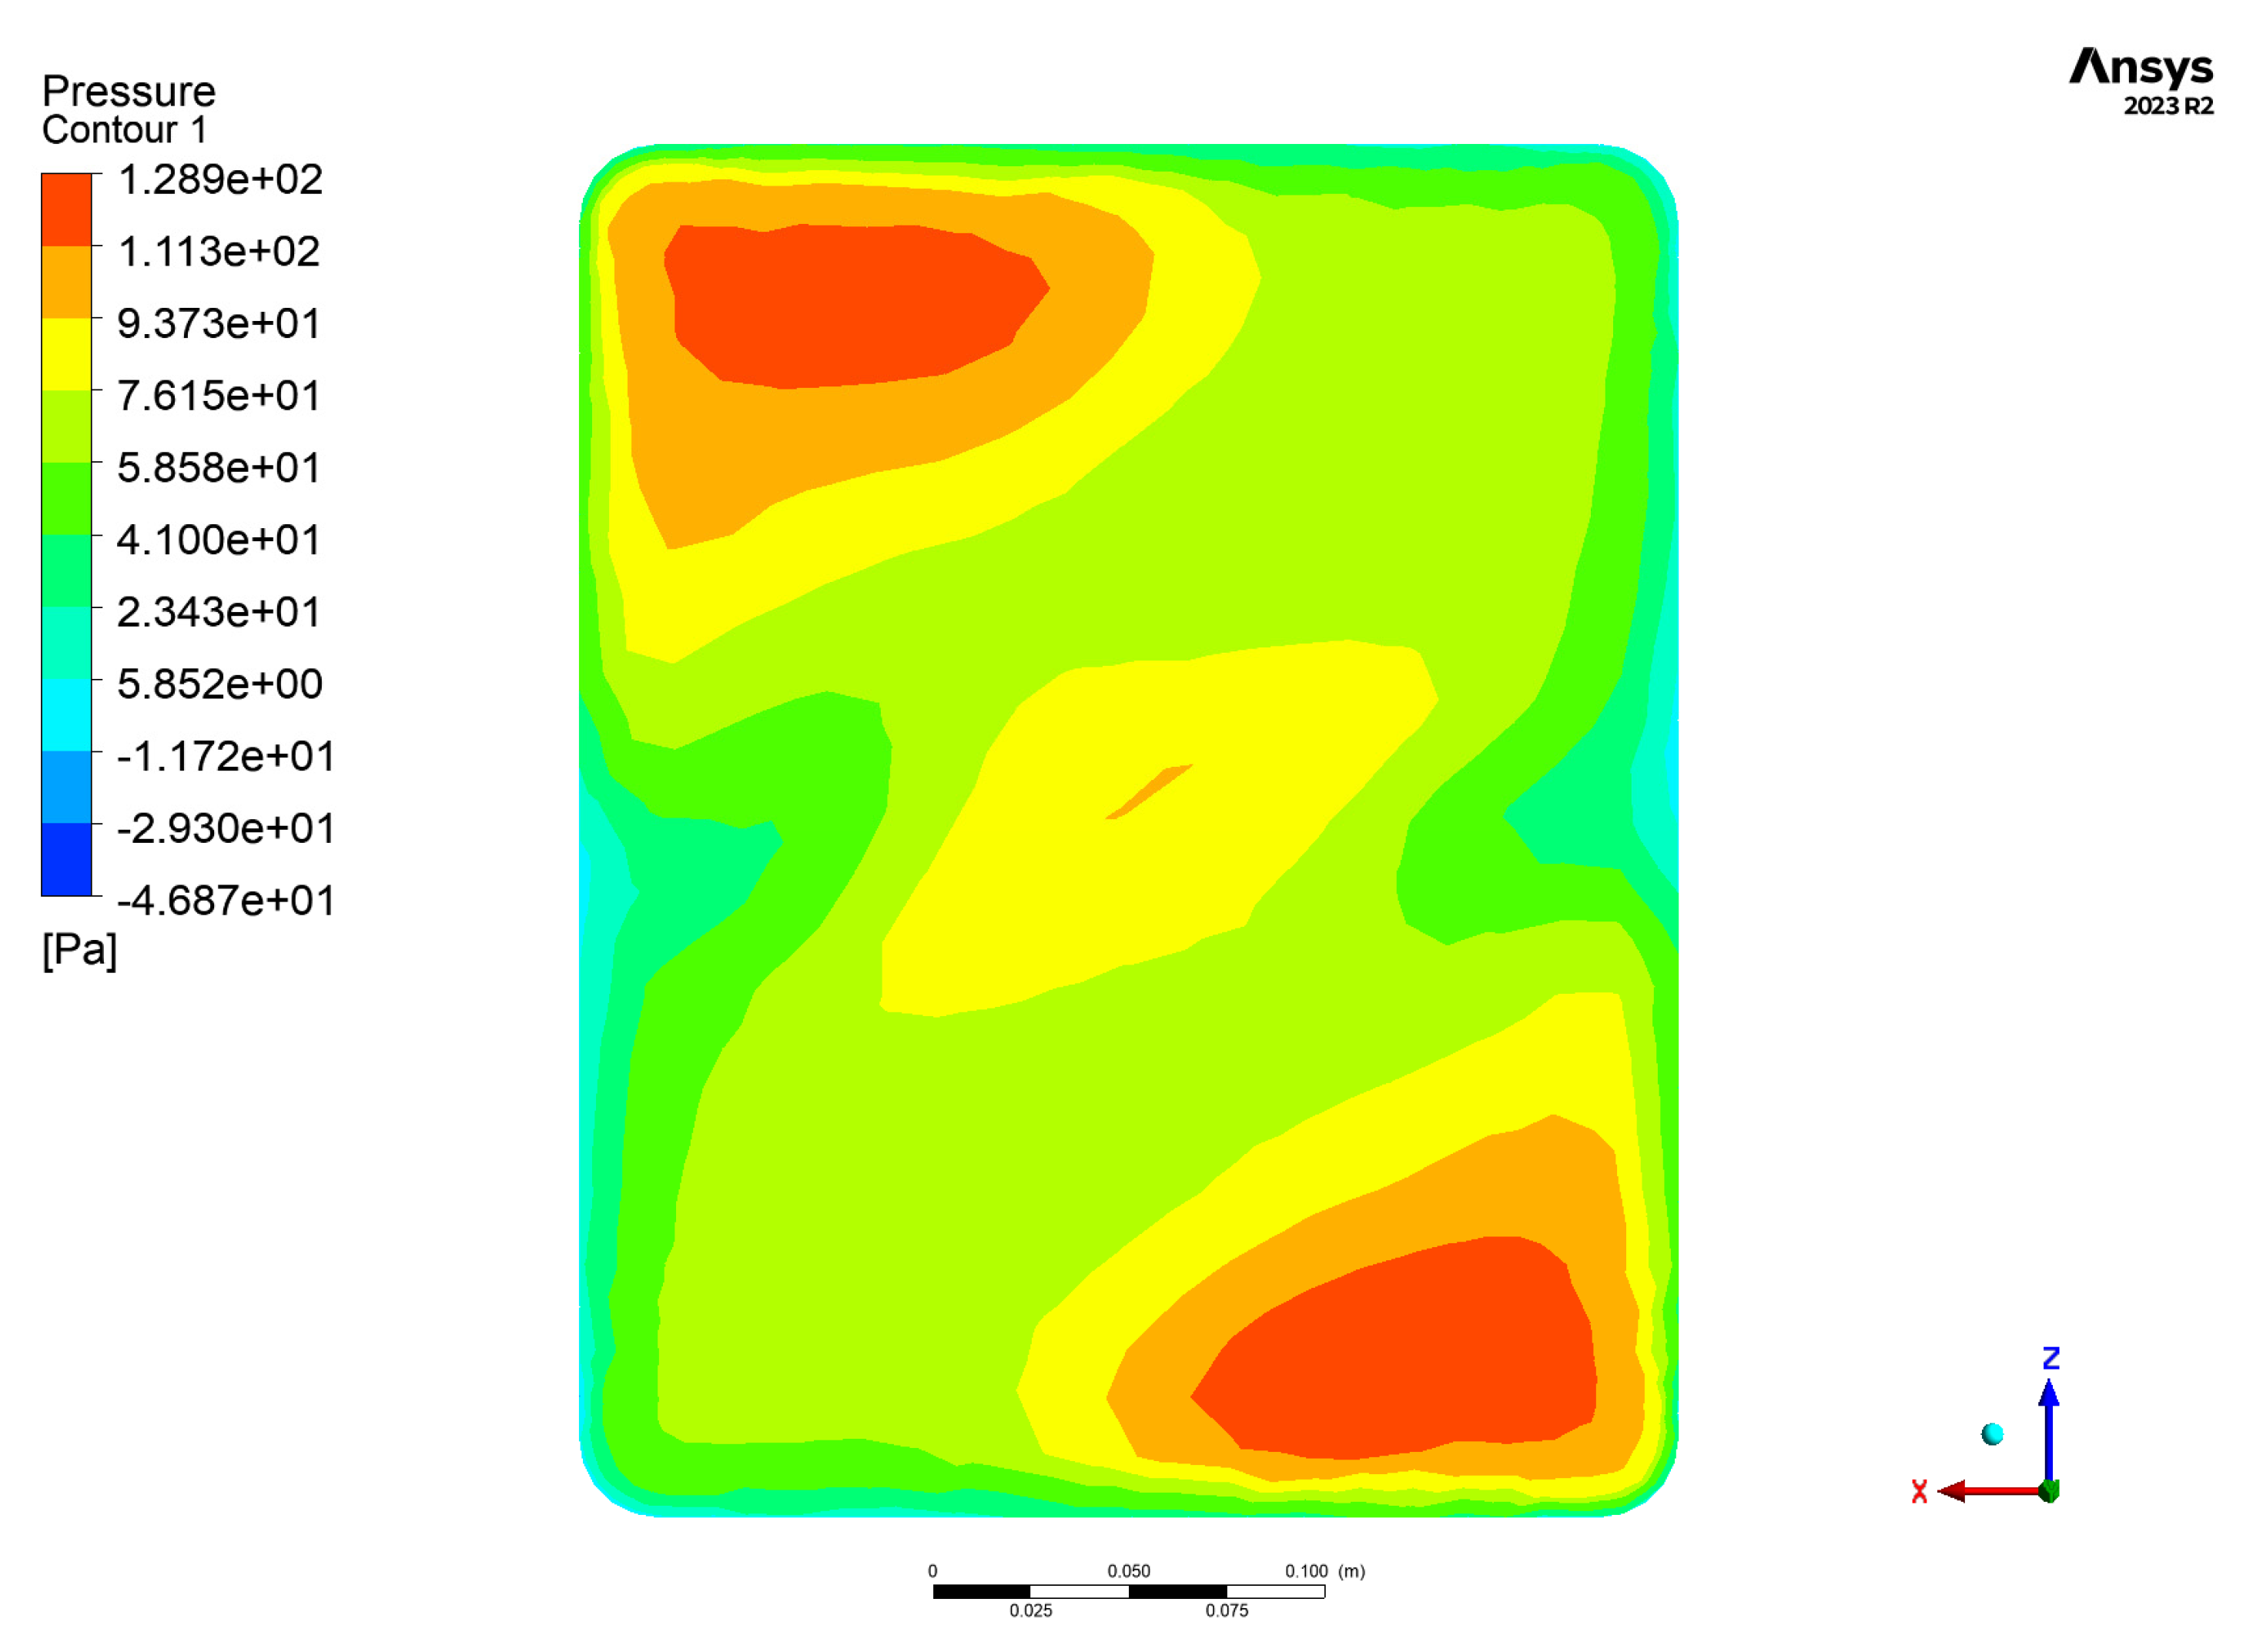
The pressure distribution on the mounting plate for the third configuration is presented in Figure 11. The contour plot highlights the influence of the propeller wake as it interacts with the surface of the plate. Distinct pressure zones can be observed: regions of higher pressure are concentrated near the impact areas of the jet, while lower-pressure regions develop at the lateral extremities, associated with local accelerations and recirculation phenomena. The asymmetric distribution of pressure suggests that the presence of the plate not only modifies the flow field in its immediate vicinity but also introduces localized aerodynamic loads that could affect the structural behavior of the test bench during prolonged operation.
These results confirm the role of the plate as an additional obstacle in the downstream flow, generating secondary aerodynamic effects that were absent in the previous configurations. Although the global thrust of the propeller is not substantially affected, the redistribution of local pressures provides valuable insight into installation effects and their contribution to the overall aerodynamic environment of the experimental stand.

2.3.4. CFD Results

This subsection presents the numerical results obtained from the CFD simulations for the three analyzed configurations: the isolated propeller, the propeller coupled with the motor, and the complete assembly including the motor and the mounting plate. The comparative evaluation of these cases enables a detailed assessment of the aerodynamic characteristics of the system, highlighting both the global performance parameters and the local flow field modifications introduced by each additional component.
The results are organized to illustrate the thrust predicted by the simulations, as well as the pressure and velocity distributions in the near-field and downstream regions. Special emphasis is placed on identifying the installation effects induced by the motor and the mounting plate, and on assessing the extent to which these components influence the overall performance of the propulsion system. By systematically presenting the outcomes of the three configurations, this section establishes a clear foundation for subsequent validation against analytical predictions and experimental measurements.
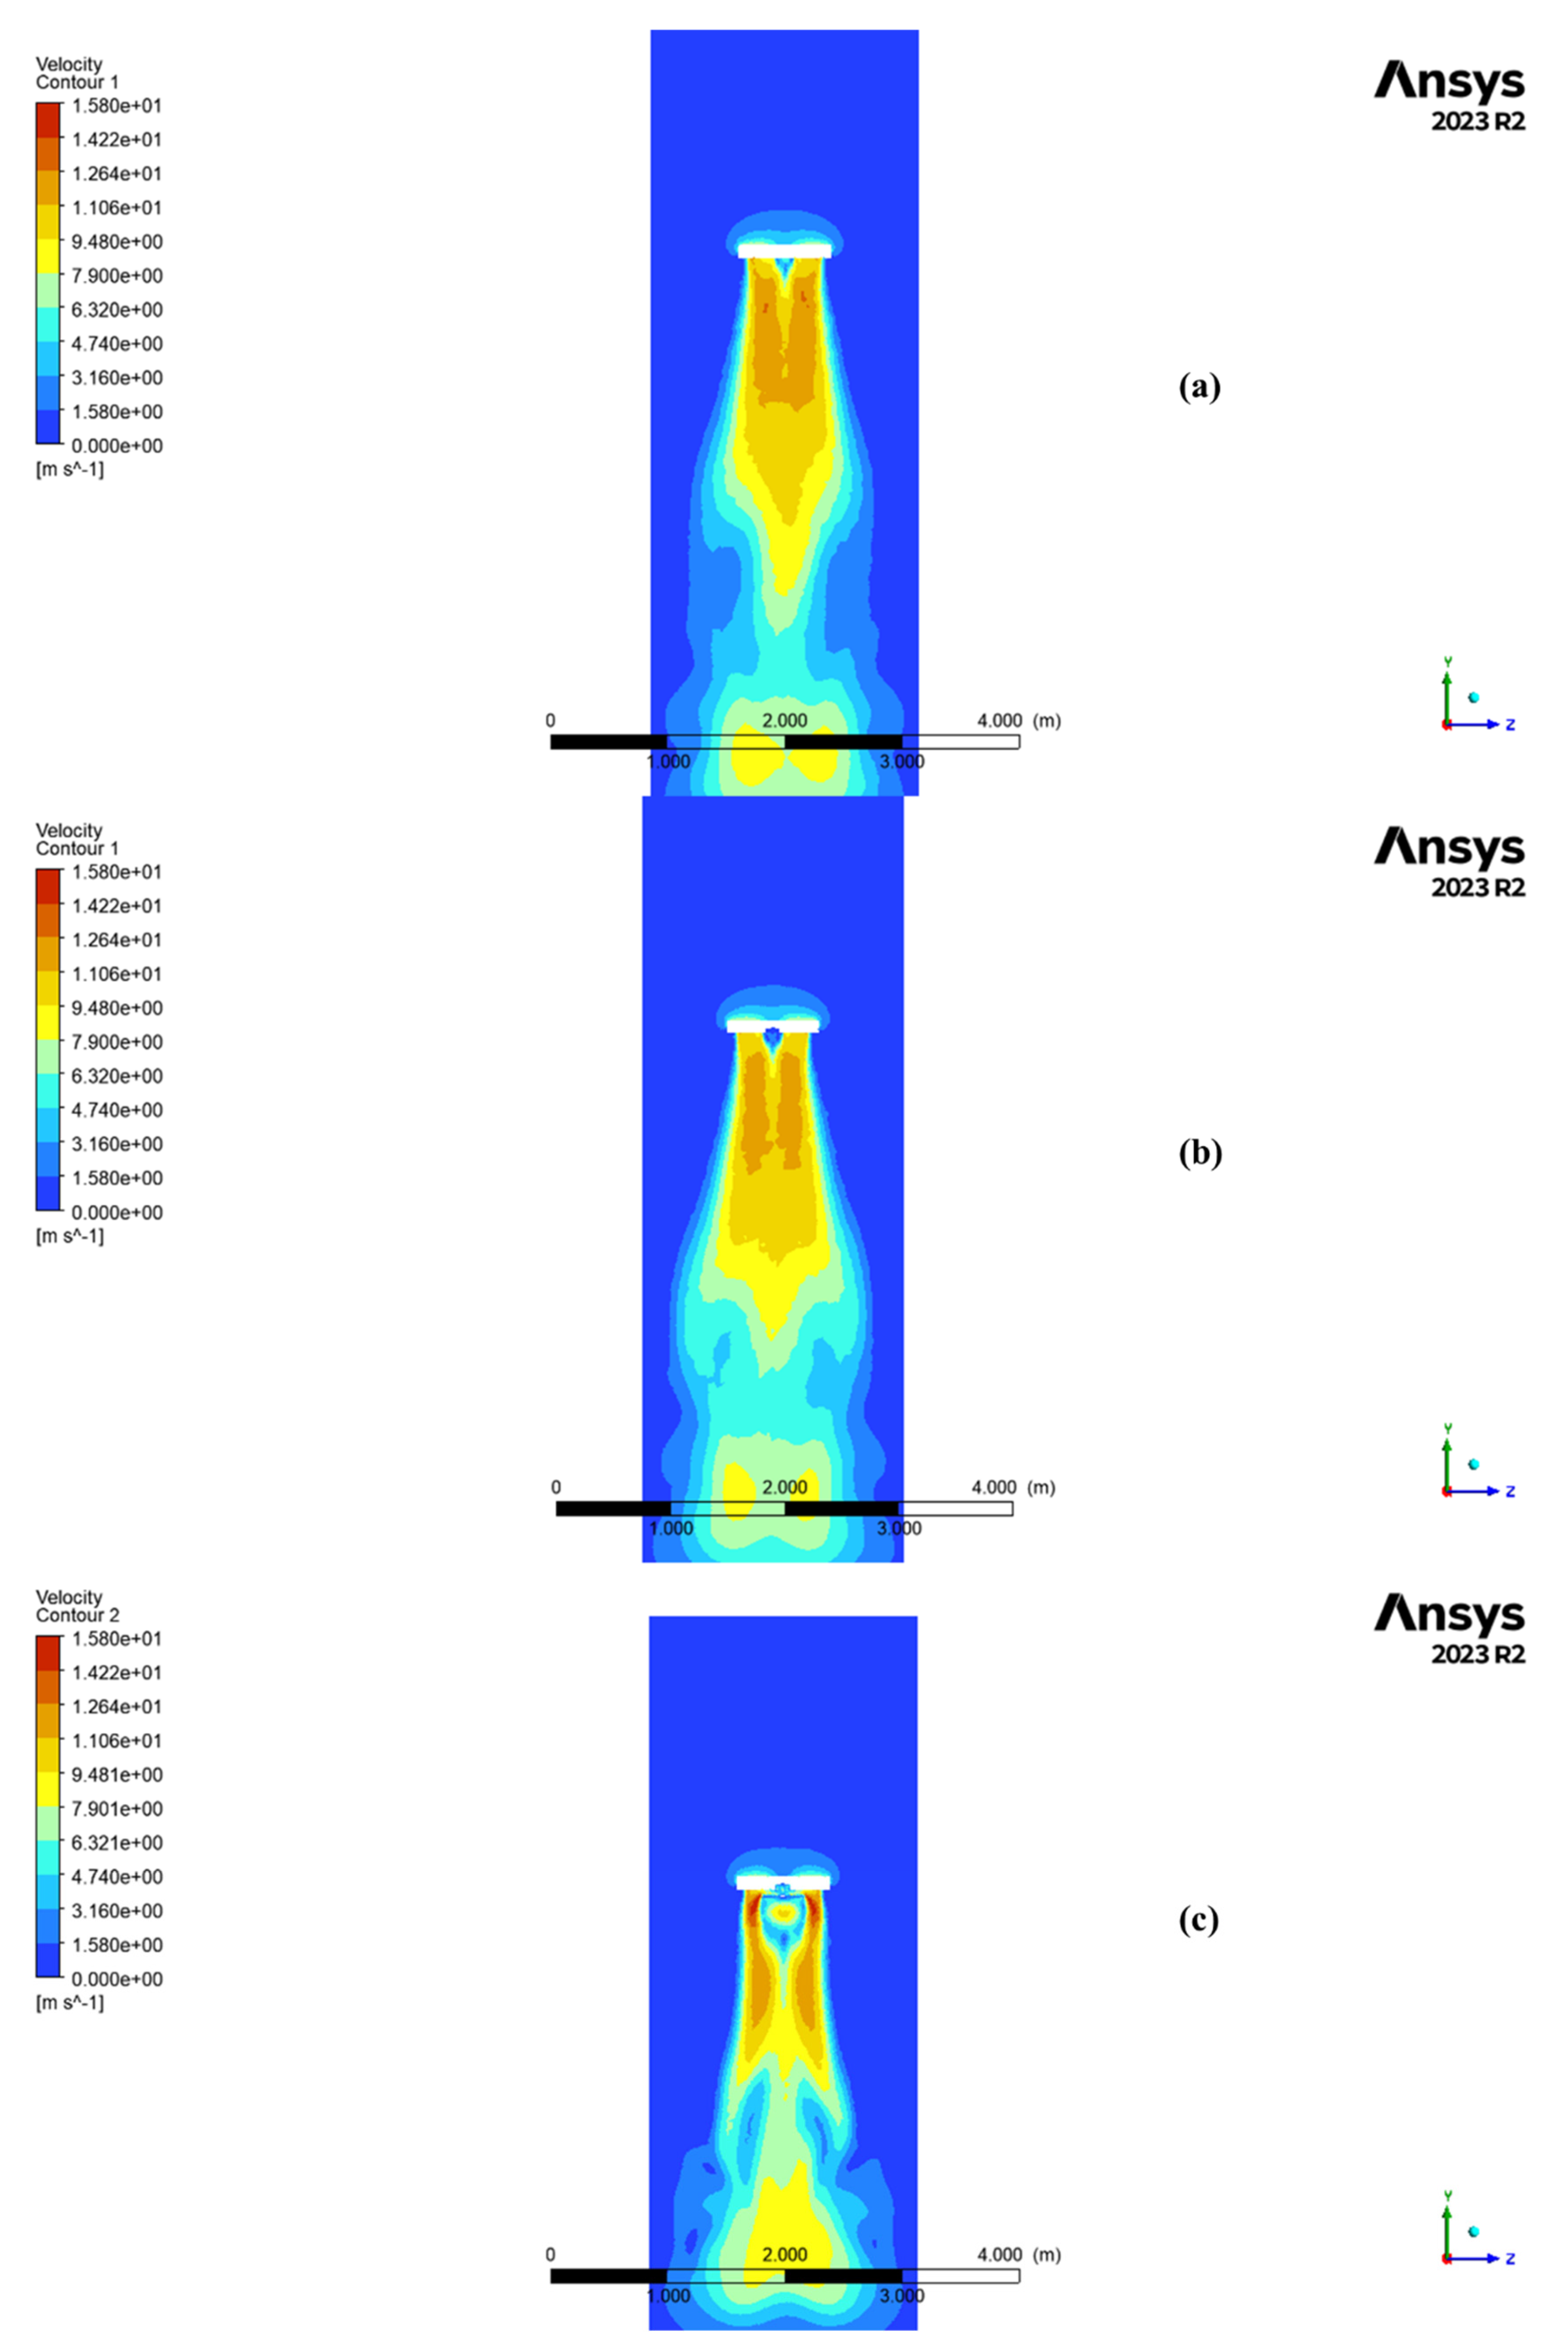
Figure 12 shows the velocity contours in the wake region for the three configurations analyzed: (a) isolated propeller, (b) propeller with motor, and (c) propeller with motor and mounting plate.
In case (a), corresponding to the isolated propeller, the wake is symmetric and well-defined along the axis of rotation. The velocity field displays a clear jet core characterized by high axial velocity values in the central region, gradually decaying toward the periphery. This configuration represents the ideal baseline, as no downstream obstacles interfere with the flow development.
In case (b), where the motor is introduced immediately downstream of the hub, the general characteristics of the wake remain similar to those of the isolated propeller. However, the presence of the motor body induces local velocity deficits in its vicinity, leading to a redistribution of the axial jet. These perturbations are relatively small due to the motor’s limited size compared to the propeller disk, yet they confirm the existence of installation effects.
Case (c), which includes both the motor and the mounting plate, reveals the most significant modifications to the flow structure. The plate acts as a solid obstacle in the path of the induced jet, producing local recirculation zones and velocity reductions near its surface. This interaction alters the symmetry of the wake and redistributes the high-speed jet around the plate edges. While the global thrust performance is not drastically reduced, the velocity contours highlight the localized disturbances and the more complex aerodynamic environment associated with the full test bench configuration.
Overall, the results confirm that while the isolated propeller establishes a clean and symmetric flow field, the addition of installation components (motor and plate) introduces progressively stronger perturbations, which are essential to capture in order to ensure accurate performance predictions and experimental correlation.
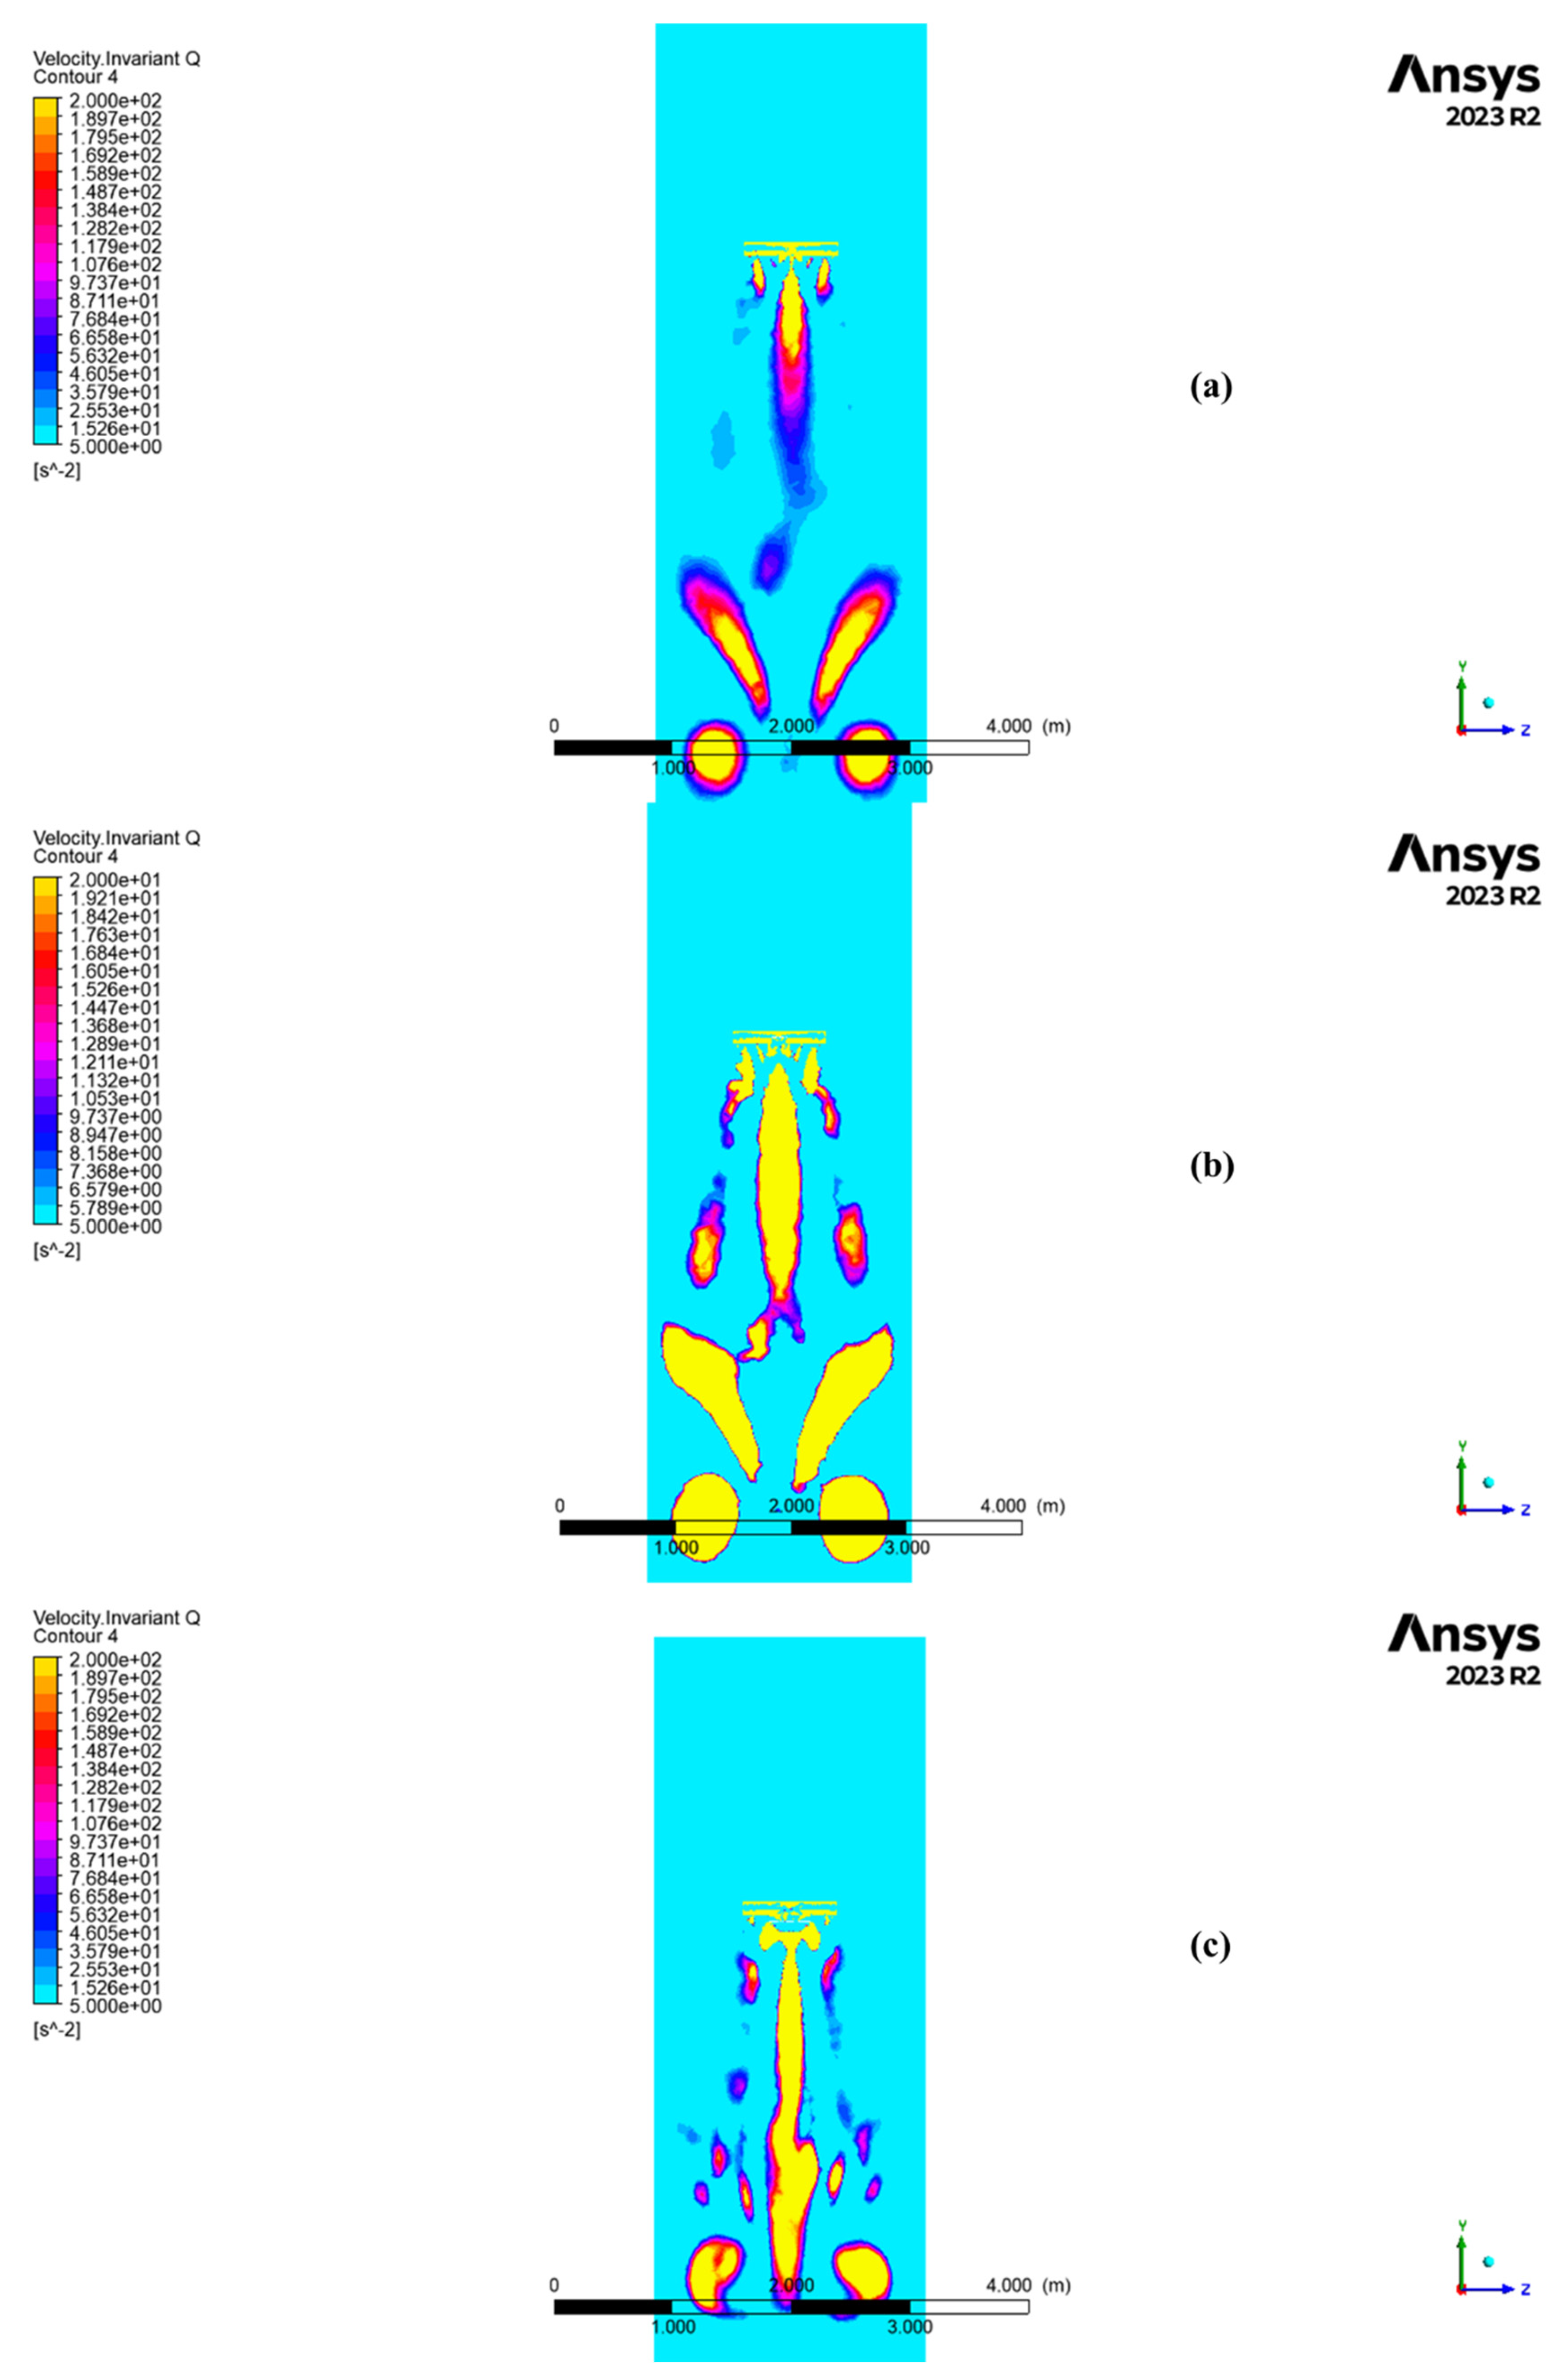
Figure 13 presents the distribution of the Q-criterion for the three simulated configurations, highlighting the evolution of the wake vortex system from the isolated propeller to the complete assembly with motor and mounting plate. In the isolated configuration (Figure 13a), the wake develops as a symmetric, well-defined vortex pair that gradually dissipates downstream, indicating a stable and unobstructed flow. The inclusion of the motor (Figure 13b) introduces a localized disturbance in the near-hub region, breaking the symmetry of the wake and slightly increasing the vorticity concentration due to the blockage and recirculation generated around the motor housing. When the mounting plate is added (Figure 13c), the wake morphology changes significantly, the plate reflects and compresses the vortex structures, forming secondary vortices near the surface and intensifying the local vorticity field. This interaction delays vortex dissipation and increases the induced velocity beneath the propeller, explaining the observed thrust enhancement in underground-effect conditions.
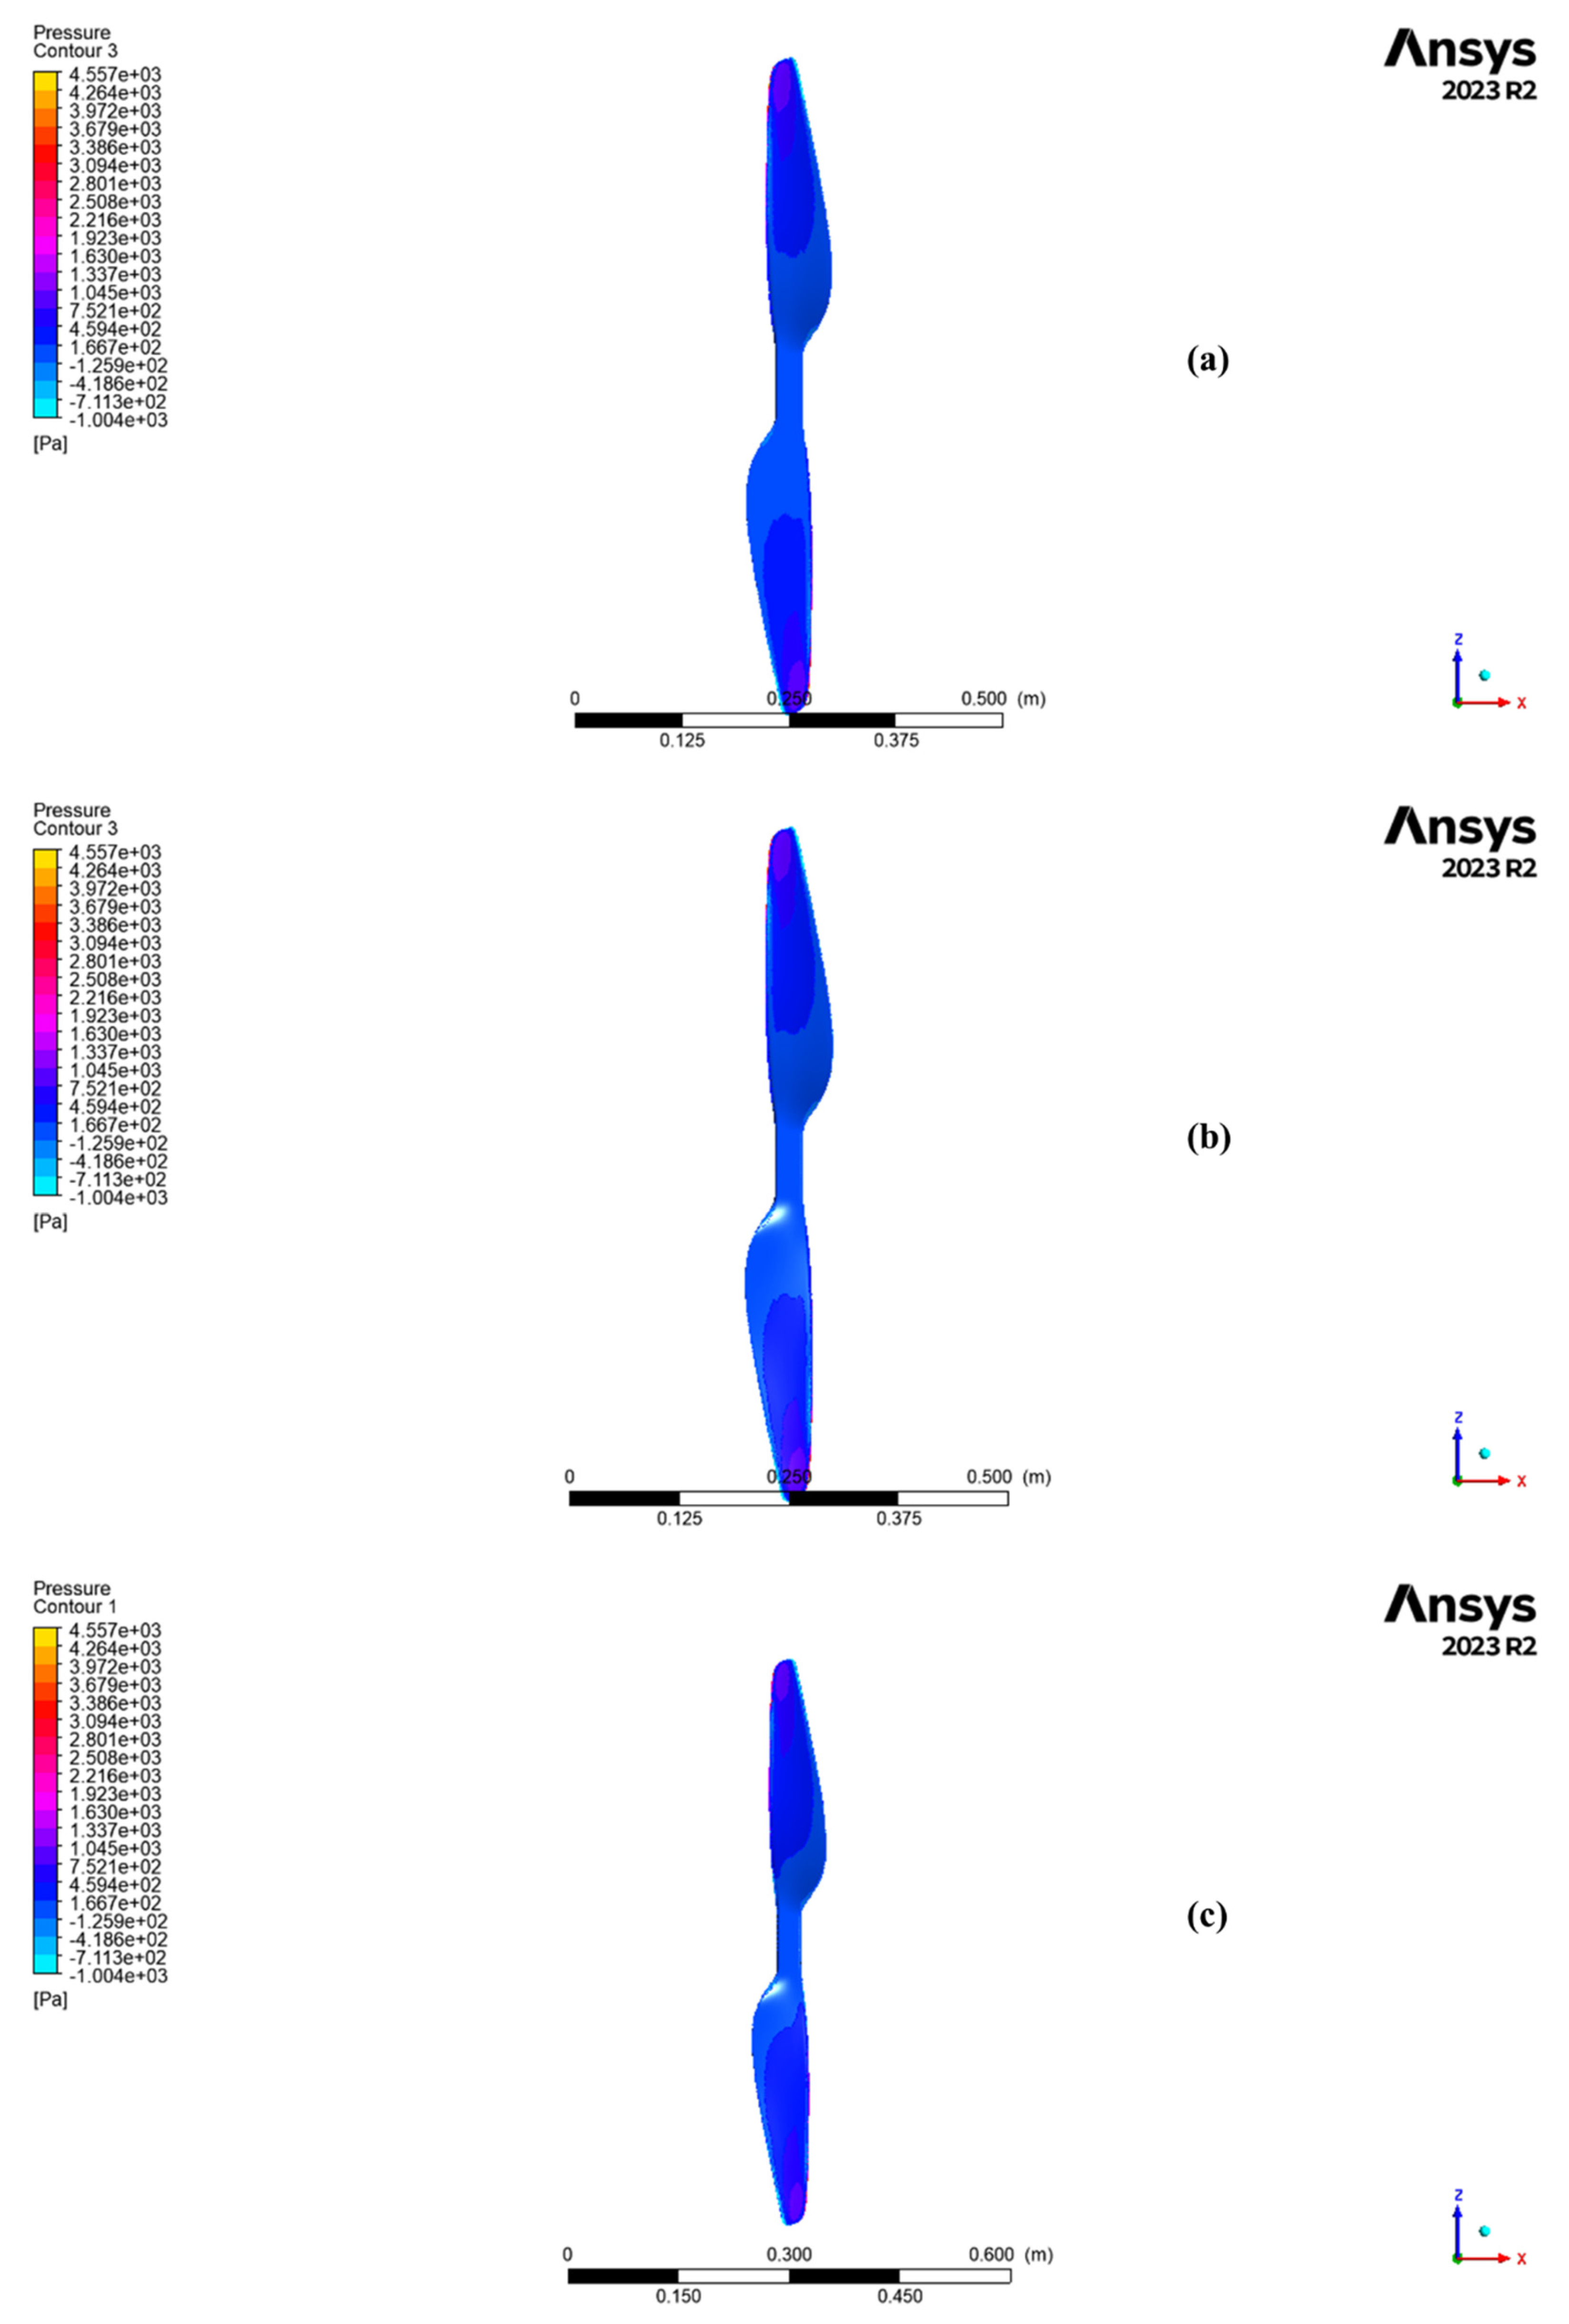
Figure 14 presents the pressure contours on the lower surface of the propeller blades for the three studied configurations.
In case (a), the isolated propeller exhibits a fairly uniform pressure distribution along the blade span. The highest-pressure regions are concentrated near the root, decreasing progressively toward the tip, as expected from classical propeller aerodynamics. This distribution reflects the clean inflow conditions, with the blade generating lift in a stable and predictable manner.
In case (b), the addition of the motor behind the hub introduces slight modifications to the pressure field. While the overall pressure distribution remains consistent with the isolated case, local differences can be observed in the inner blade region. These are associated with the altered inflow conditions caused by the presence of the motor body, which disturbs the wake immediately downstream of the hub. Nevertheless, the impact on the propeller loading remains modest.
Case (c), which includes both the motor and the mounting plate, shows a more pronounced change in the pressure distribution. The interaction between the propeller jet and the plate modifies the pressure recovery on the lower surface, particularly toward the mid- and tip-span regions. Localized pressure increases and redistributions indicate installation effects that slightly alter the aerodynamic loading of the blades. While the general loading pattern is preserved, the plate introduces secondary effects that are important for capturing realistic operating conditions of the experimental stand.
The resulting aerodynamic forces obtained from the CFD simulations for the three analyzed configurations are summarized in Table 3. This comparison highlights the influence of the installation components (motor and mounting plate) on the overall thrust generated by the propeller.
The results presented in Table 3 summarize the thrust forces obtained from the CFD simulations for the three analyzed configurations, together with their deviations from both the analytical model and the reference values provided by the manufacturer.
In the first case (isolated propeller), the computed force of 36.63 N shows excellent agreement with the analytical prediction, with only a 0.5% deviation, and a small 5% deviation relative to the manufacturer’s data. This demonstrates the reliability of the numerical setup under idealized conditions.
For the second case (propeller with motor), the predicted force increases slightly to 37.43 N. The deviation from the analytical model rises modestly to 2.4%, while the deviation from the producer’s data decreases to 3%. This indicates that the presence of the motor induces minor installation effects, but does not significantly alter the global aerodynamic performance.
The third case (propeller + motor + mounting plate) reveals a markedly different behavior, with the predicted thrust rising to 45.7 N. Here, the deviations are substantially larger, at 21% compared to the analytical model and 15% compared to the manufacturer’s data. This increase is directly associated with the ground effect generated by the mounting plate, which enhances the aerodynamic loading on the propeller. While this leads to higher predicted thrust, it also emphasizes the importance of accounting for installation effects when comparing numerical, analytical, and experimental results.
Overall, the results confirm that while the isolated propeller configuration provides values consistent with theory and manufacturer specifications, the inclusion of installation components, particularly the mounting plate, introduces significant aerodynamic phenomena, most notably ground effect, that cannot be neglected in realistic performance assessments.
Table 4 presents the comparative analysis of the thrust forces obtained for the three configurations, emphasizing the incremental contributions of the motor and the mounting plate to the total propulsive performance. The isolated propeller produced a thrust of 36.63 N, serving as the baseline for comparison. The addition of the motor resulted in a modest increase to 37.43 N, corresponding to a relative gain of approximately 2.2%. This slight enhancement can be attributed to the local flow redirection and pressure recovery induced around the motor casing, which affects primarily the hub region where the induced velocities are low. Consequently, the motor’s aerodynamic influence remains secondary, introducing only minor installation effects.
In contrast, the inclusion of the mounting plate led to a significant thrust rise to 45.70 N, an increase of about 24.7% relative to the isolated configuration and 22.6% compared to the propeller–motor case. This pronounced improvement is primarily driven by the ground-effect mechanism produced by the plate, which acts as a reflective surface that intensifies the pressure beneath the propeller and modifies the vortex dissipation pattern. The reflected tip vortices interact with the downward jet, reducing induced losses and stabilizing the near-field wake, as illustrated in Figure 13.
These results demonstrate that the mounting plate accounts for nearly 90% of the overall thrust enhancement, confirming its dominant role in the performance improvement. The motor’s contribution, while measurable, is geometrically confined and aerodynamically limited. Therefore, the combined configuration benefits mainly from the synergistic interaction between the propeller and the mounting plate, highlighting the need to consider installation-induced flow phenomena when assessing propeller performance in realistic setups.

2.4. Experimental Testing Campaign

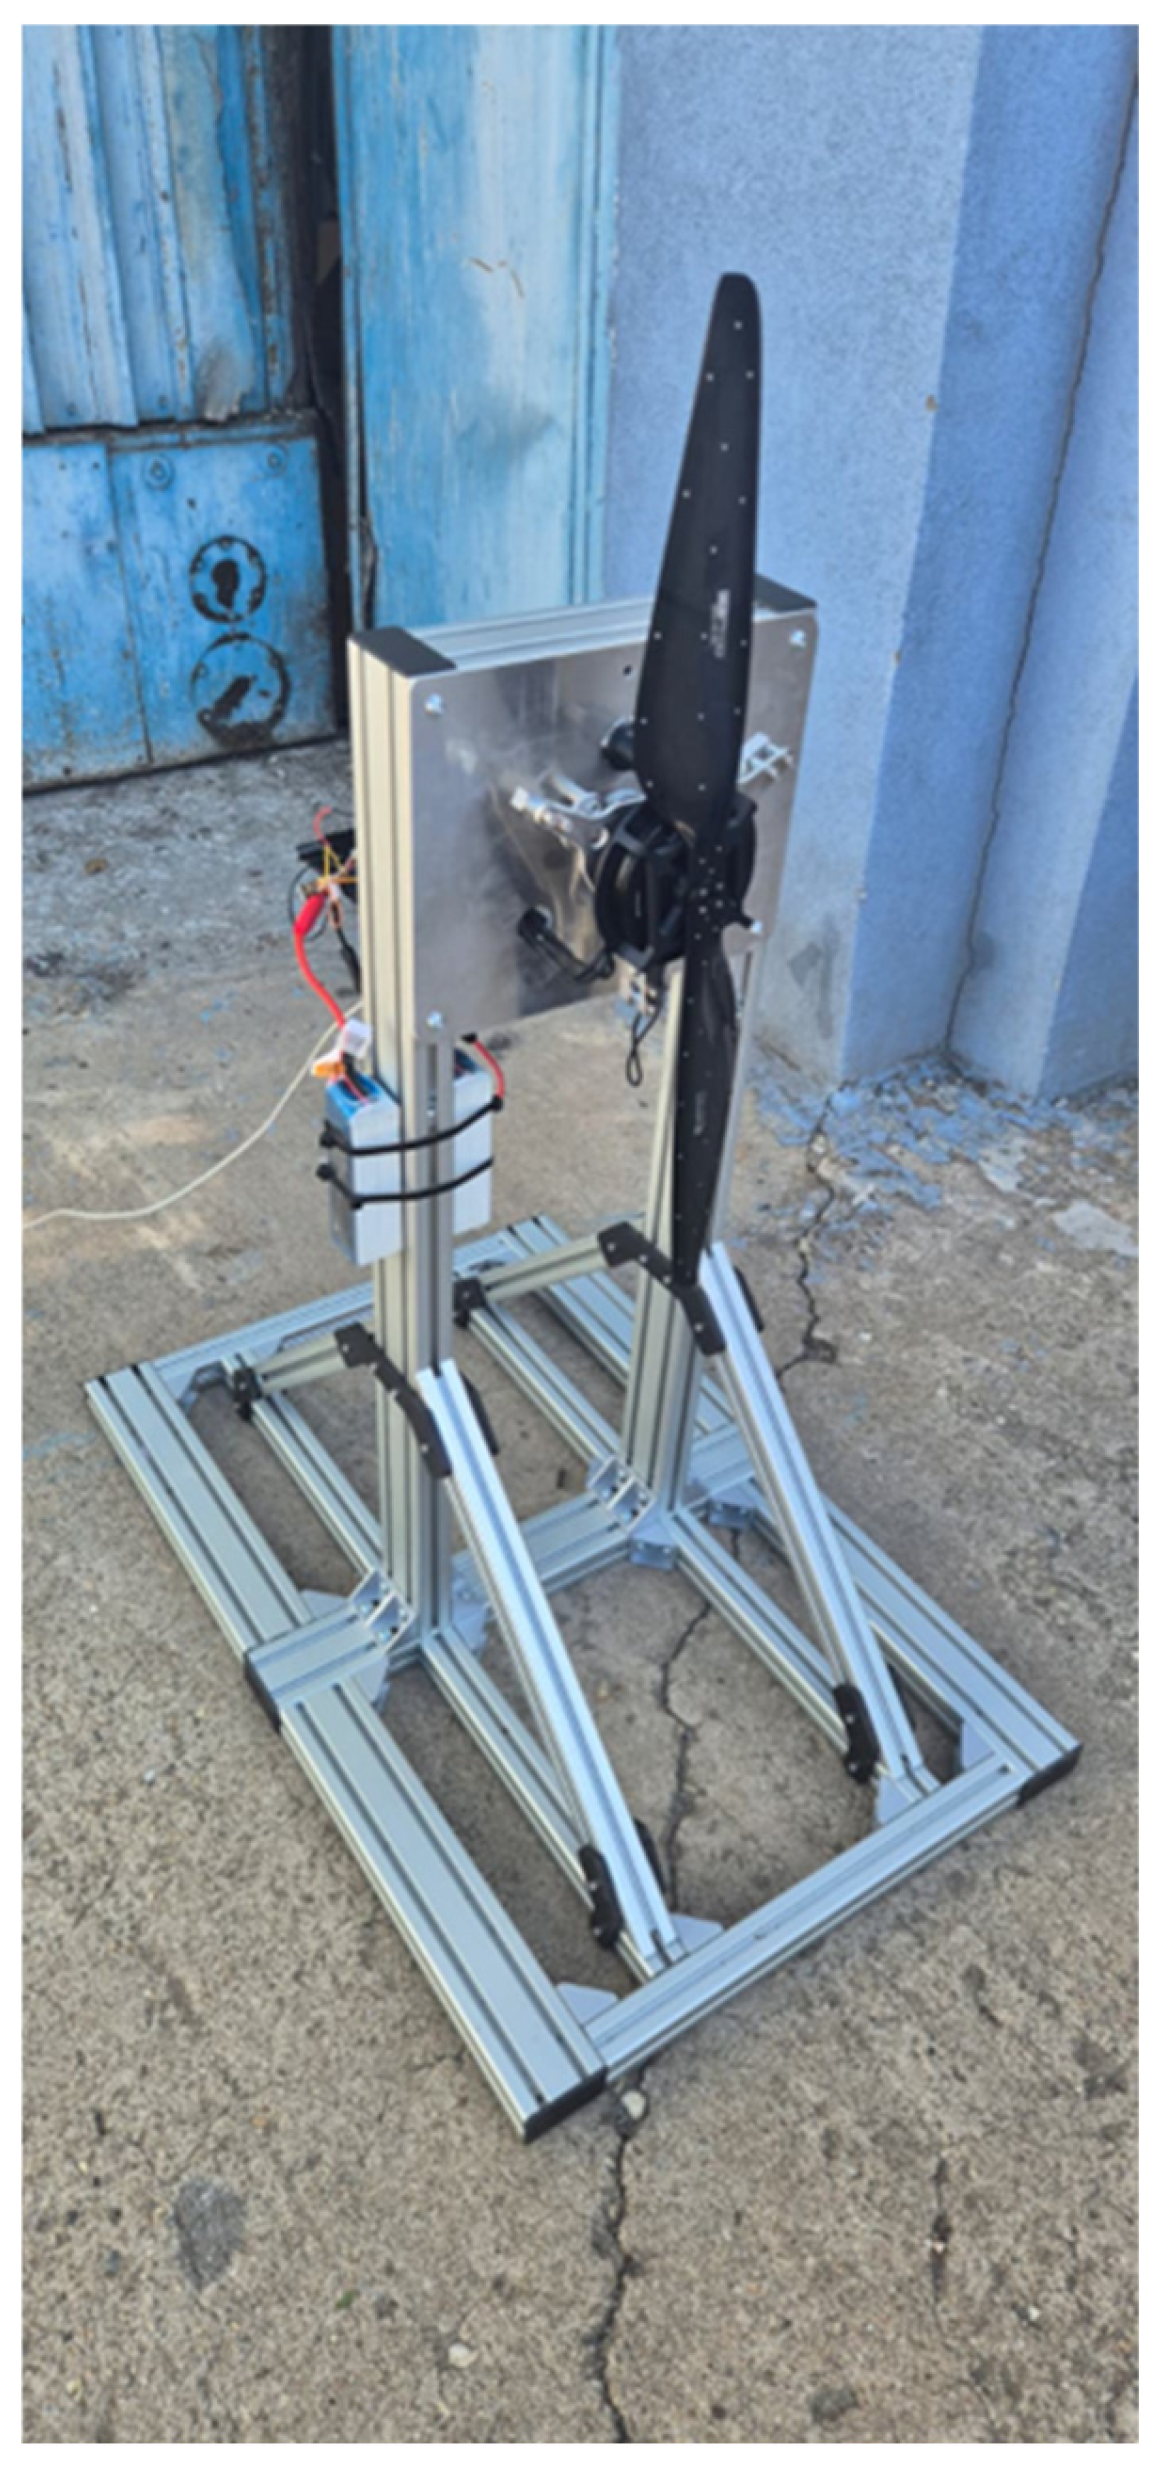
To validate the analytical predictions and CFD simulations, an experimental campaign was conducted using the dedicated test bench developed in this study. The objective of these tests was to directly measure the aerodynamic performance of the G30 × 10.5 propeller under controlled laboratory conditions, with particular focus on thrust generation and the influence of installation effects. The experimental setup replicated as closely as possible the numerical configurations, thereby ensuring consistent comparison across methodologies.
Figure 15 presents the experimental test bench as employed during the testing campaign. The experimental investigation was structured around a total of nine test points, each corresponding to a different rotational speed of the propeller, in order to capture the variation in its aerodynamic and electrical performance across a representative operating range.
During each test, multiple parameters were recorded simultaneously to provide a comprehensive characterization of the propulsion system. The measured quantities included the supply voltage and current, from which the input electrical power was derived, as well as the thrust force generated by the propeller and the corresponding rotational speed. This set of measurements allows for the assessment of both the aerodynamic efficiency and the energy conversion characteristics of the system.
The complete experimental results are summarized in Table 5, which compiles the output data obtained across all nine operating conditions. These results form the basis for subsequent comparison with analytical estimations and CFD predictions, providing a robust validation framework for the methodologies employed in this study.
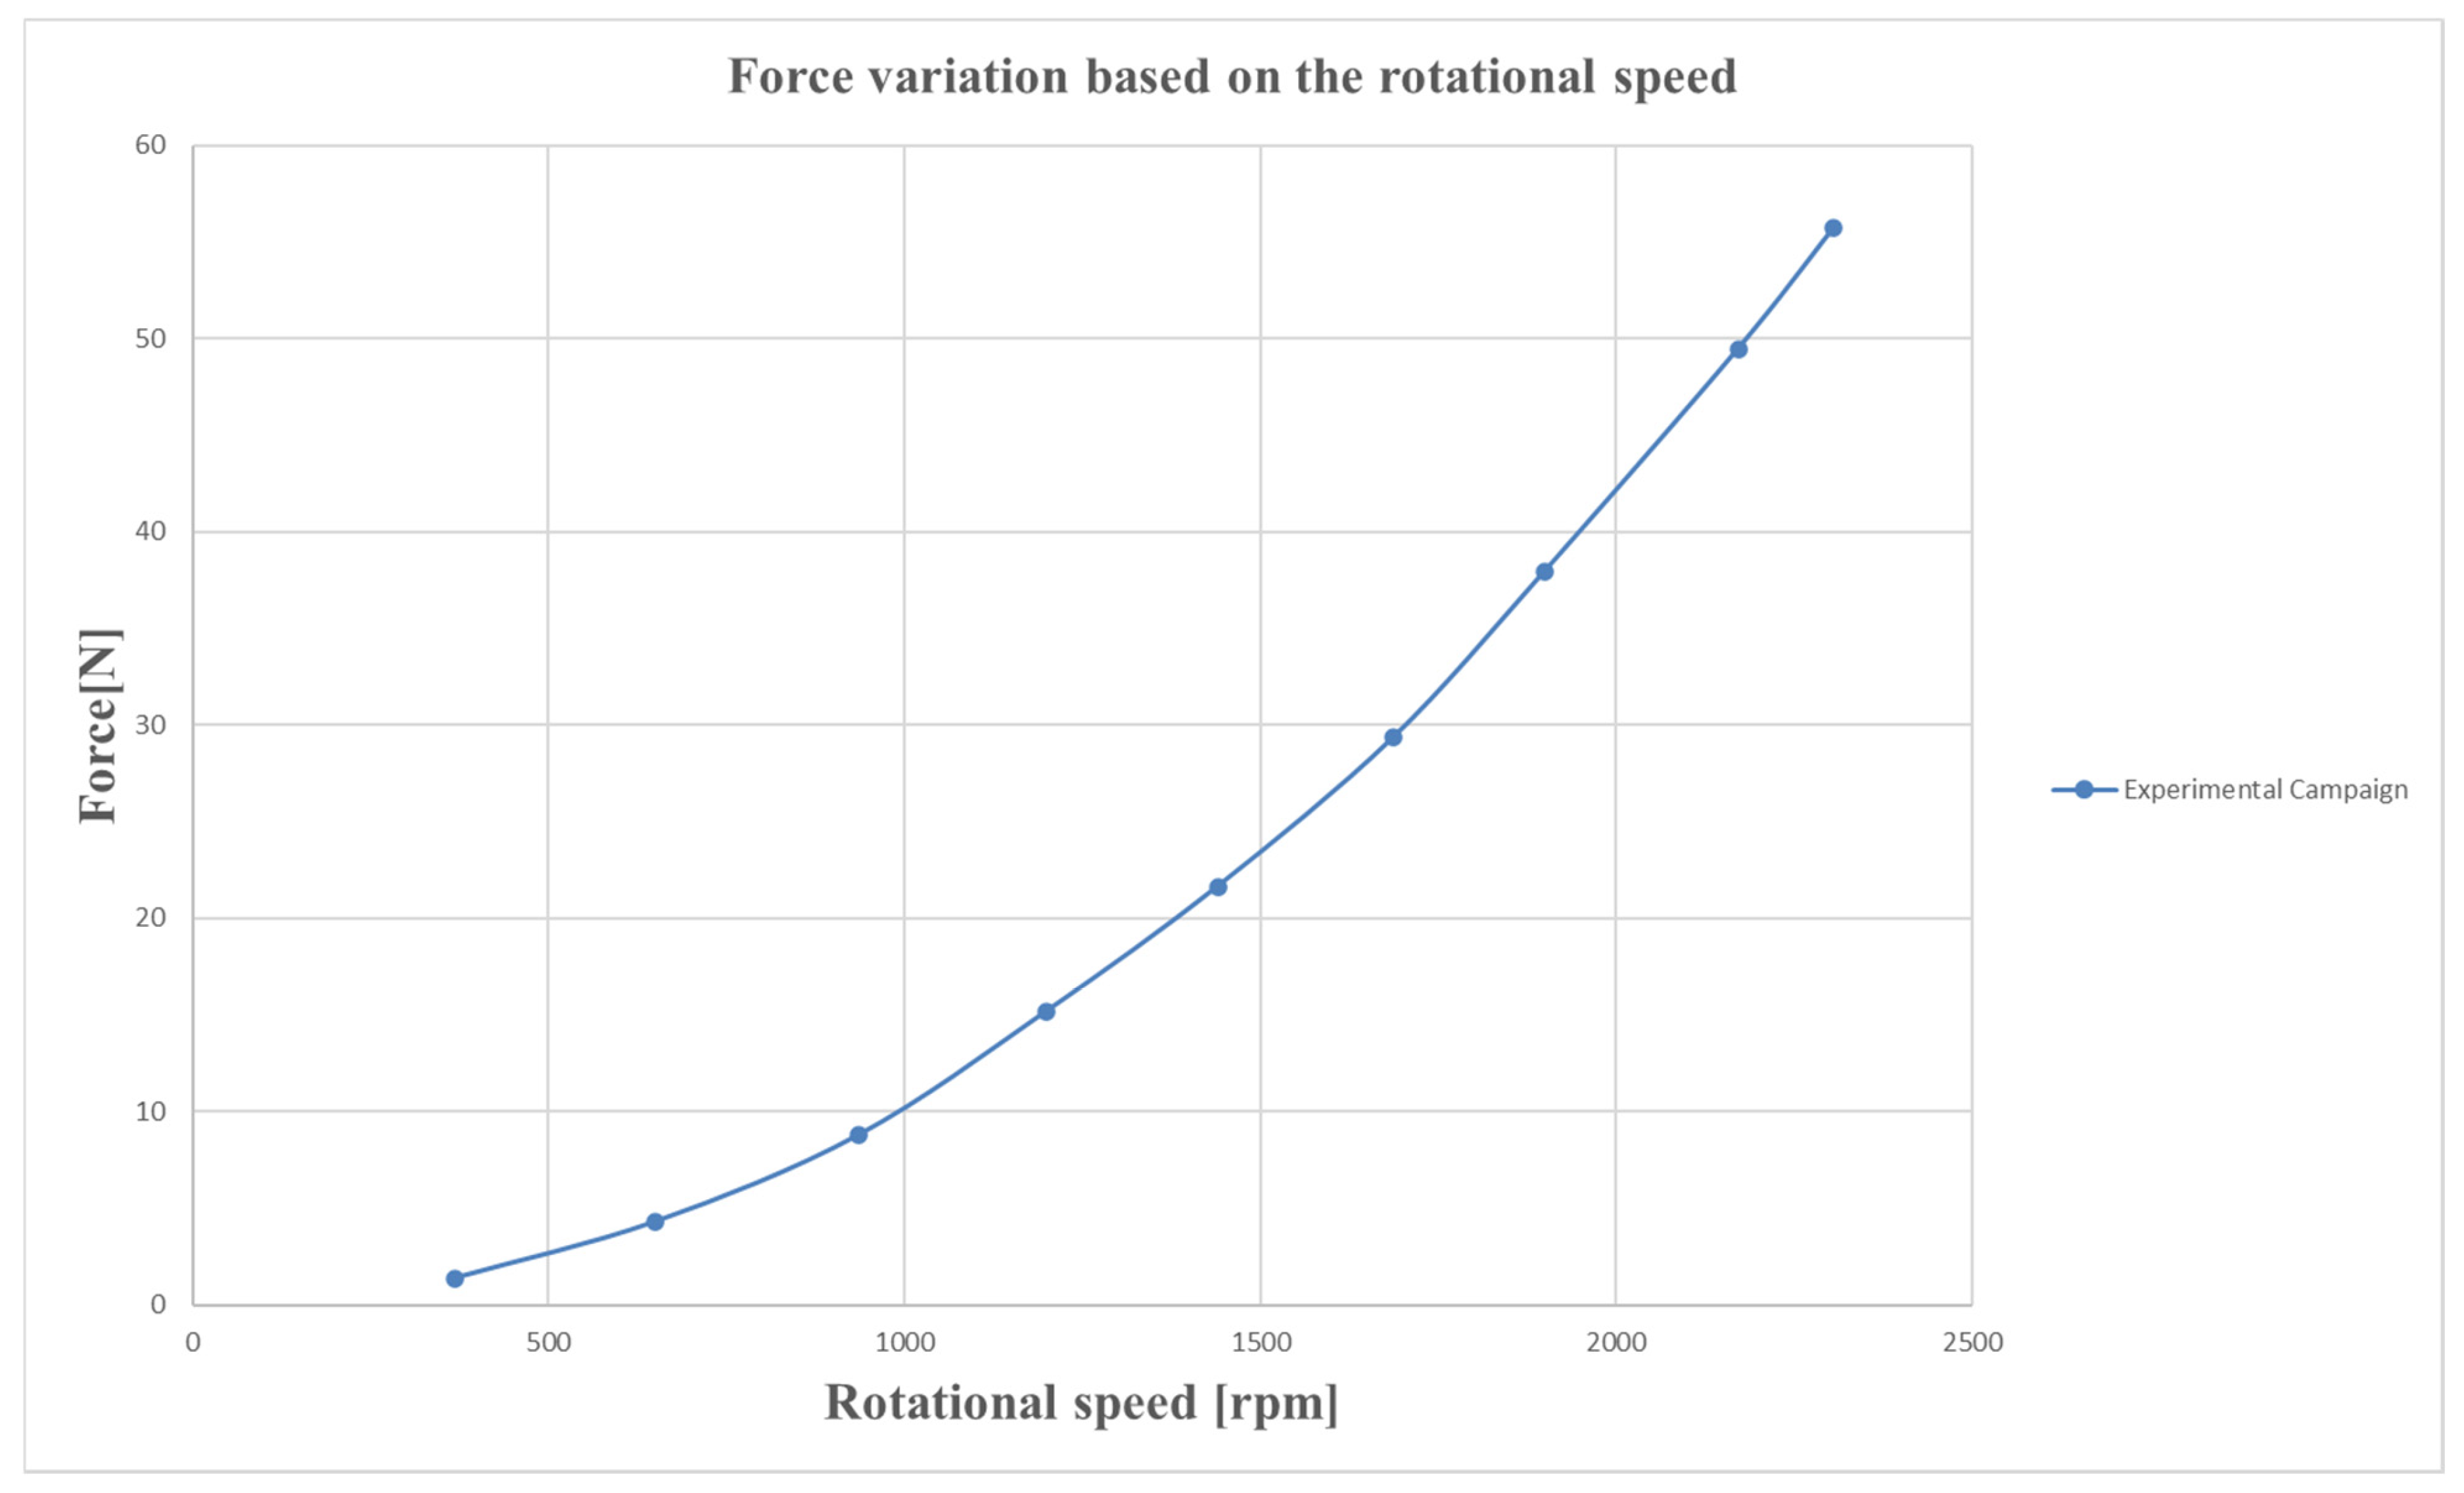
Figure 16 illustrates the variation in thrust force as a function of rotational speed, as obtained during the experimental campaign. The results clearly demonstrate the expected nonlinear correlation between the two parameters: as rotational speed increases, the thrust rises rapidly, following a near-quadratic trend consistent with propeller aerodynamic theory.
The selected rotational speed range of 368–2305 rpm was established to represent the typical operating envelope of the tested propulsion system under realistic UAV flight conditions. The upper limit of approximately 2300 rpm corresponds to about 40% of the motor’s maximum rated speed, which aligns with the typical throttle range used during hover or low-speed maneuvering in multirotor UAVs. Previous experimental and operational data indicate that small and medium multirotor platforms generally sustain 40–50% throttle for steady hover, where the aerodynamic and electrical performance of the propulsion unit is most stable and representative of real flight conditions.
The lower speeds were included to characterize the propeller behavior under partial loading and to ensure a complete mapping of the thrust curve for model validation. This range thus provides both low-thrust calibration points and an upper bound corresponding to realistic hovering regimes, ensuring the results are directly applicable to practical UAV operations.
At lower rotational speeds, the generated forces are modest, reflecting reduced aerodynamic loading on the blades. However, as the speed approaches the upper operating range (beyond 2000 rpm), the force grows significantly, reaching values above 50 N. This strong dependency highlights the sensitivity of propeller performance to angular velocity and confirms the accuracy of the measurement system in capturing the full operating envelope.

3. Results

In order to enable a legitimate comparison between the three approaches, analytical, CFD, and experimental, the analytical method must be refined to account for ground effect. As highlighted in previous studies [35,36,37,38] the proximity of the propeller to a solid surface significantly alters the induced velocity distribution and pressure field, leading to an increase in the generated thrust compared with free-flight conditions. To capture this phenomenon, the analytical model employed in this study was adapted following the formulations proposed in the literature. The refined approach allows the influence of ground effect to be quantified and incorporated into the theoretical predictions, thereby ensuring a consistent and meaningful comparison across all methodologies.
F G E = F × C G E h / R 1
The correction factor for ground effect, denoted as C G E , was introduced into the analytical formulation to account for the increased thrust observed in proximity to the ground. According to the literature, C G E typically falls within the range of 1.2–1.4 for relative clearance values h / R 1 between 0.1 and 0.2 [35,36,37,38]. This empirical adjustment enables the analytical model to more accurately replicate the conditions of the experimental setup, where the presence of the mounting plate induces a clear ground effect.
By applying this correction to the analyzed case, where the analytically predicted free-flight thrust was 36.53 N and the ratio h / R 1 is approximately 0.13, the correction coefficient can be taken as C G E = 1.3 . Consequently, the thrust corrected for ground effect becomes:
F G E = F × C G E h / R 1 = 36.53 × 1.3 47.5   N
In the present case, the experimental configuration corresponds to h / R 1 0.13 , where the literature indicates C G E values close to 1.3. This selection is therefore not arbitrary but physically derived from the empirical ground effect curves reported in [35,36,37,38], which demonstrate that thrust enhancement reaches approximately 30% for this clearance ratio. Applying this correction to the analytically predicted free-flight thrust of 36.53 N yields a ground-effect-corrected thrust of 47.5 N, closely matching both the CFD and experimental trends observed in this study.
This corrected value brings the analytical method significantly closer to both the CFD results and the experimental campaign, confirming that ground effect plays a key role in achieving realistic predictions for the test bench under investigation.
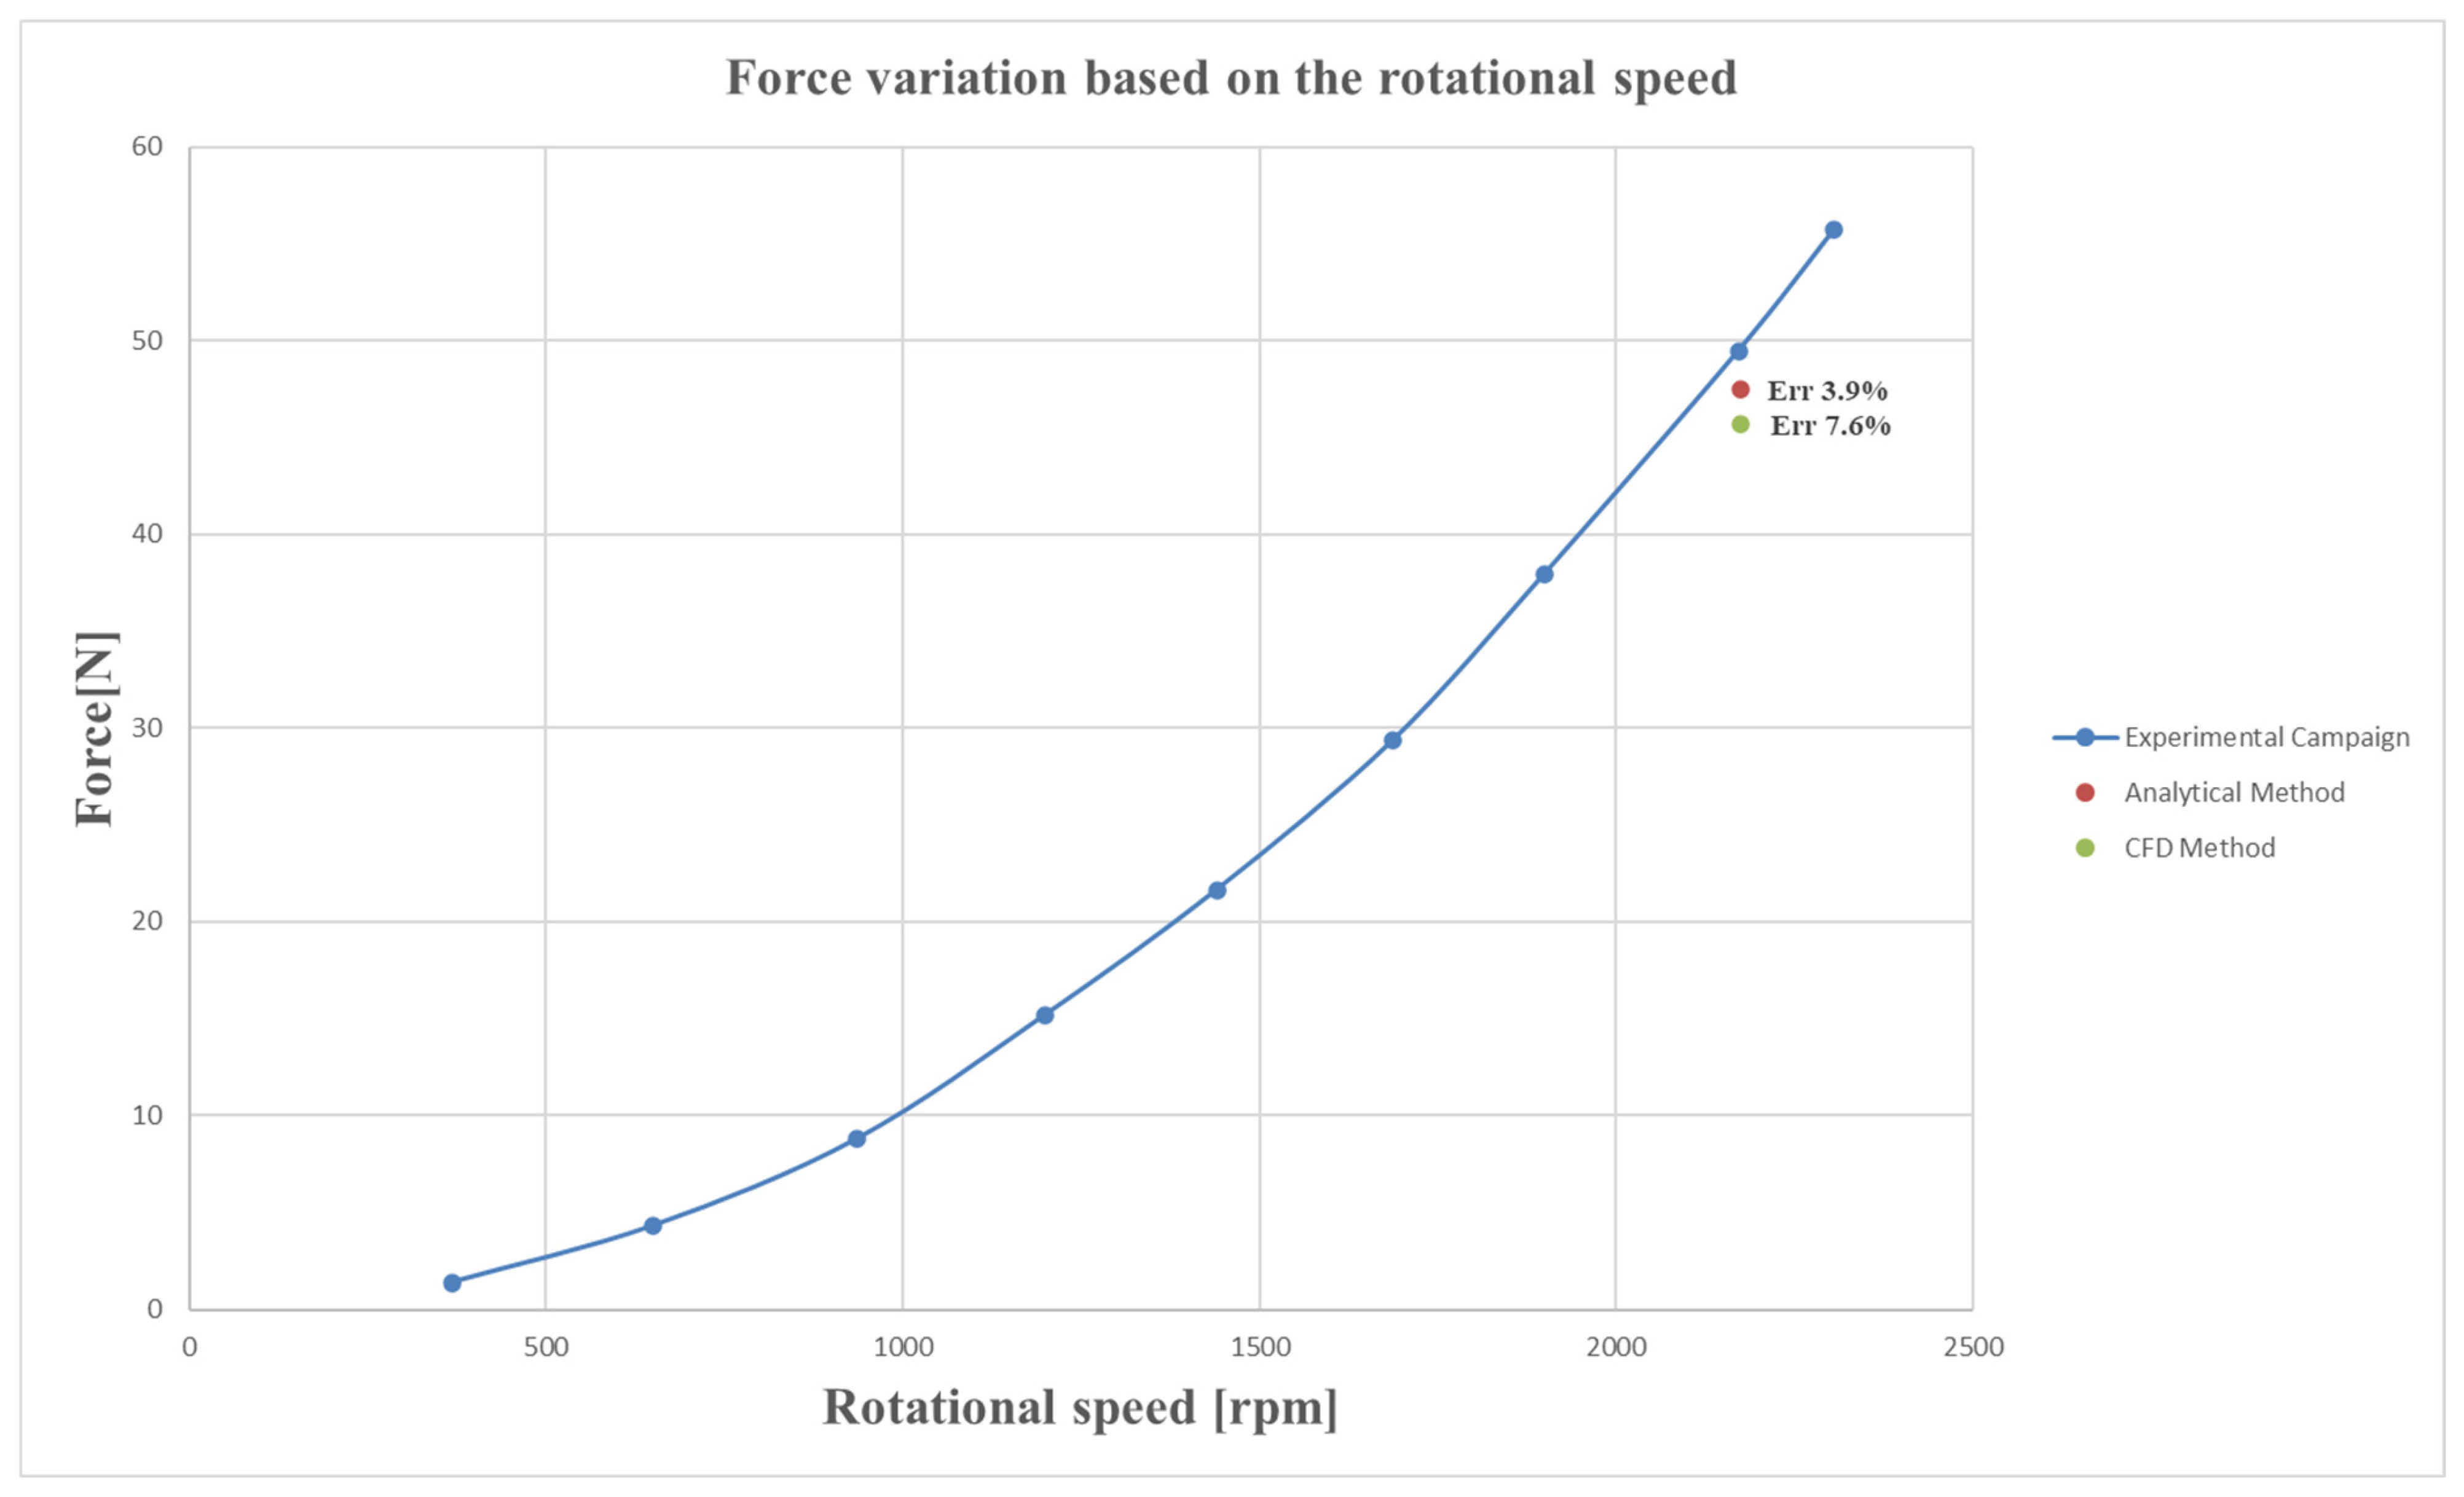
Figure 17 presents the variation in thrust with rotational speed, where the results obtained from the experimental campaign, the analytical method, and the CFD simulations are superimposed. The blue curve corresponds to the experimental measurements, while the red and green markers indicate the values predicted by the analytical method and CFD analysis, respectively, at the reference speed of approximately 2170 rpm.
It can be observed that the analytical and CFD results align well with the experimental trend, confirming the validity of the methodologies employed. The error relative to the experimental data was calculated as 3.9% for the analytical method and 7.6% for the CFD analysis, indicating that the analytically corrected method (including ground effect) provides the closest prediction to reality.
These findings demonstrate that integrating ground effect into the analytical model leads to a more accurate representation of the physical phenomenon observed during the experimental tests, substantially reducing discrepancies. Furthermore, the overall consistency between all three approaches validates the proposed methodology and provides a solid foundation for its application to other propeller geometries.

4. Discussion

Although the experimental setup presented in this study is specific to the developed test bench, the configuration parameters were selected to remain representative of typical UAV propulsion system integrations. The mounting plate dimensions, 350 mm in width and 250 mm in height, correspond to an overall area equivalent to approximately 40% of the propeller diameter (30 in, or 762 mm), while the distance between the propeller plane and the plate surface was set to 50 mm, equivalent to about 6.5% of the propeller diameter. This geometric arrangement is characteristic of industrial UAV platforms, which often employ large-diameter propellers in the 25–30 in range and feature structural mounting plates or nacelle interfaces positioned within 0.05–0.1 D of the rotor disk. Therefore, the aerodynamic interactions and thrust amplification observed in this work are not unique to this configuration, but are representative of common industrial UAV designs where the supporting structure occupies roughly 40% of the propeller diameter and is located at a similar relative distance. Consequently, the findings provide generalizable insight into mounting-induced ground-effect phenomena, offering practical relevance for the aerodynamic optimization of large-scale UAV propulsion systems.
The results obtained in this study confirm the strong influence of installation effects and ground proximity on propeller performance. Compared with previous works [35,36,37,38], which demonstrated that ground effect enhances thrust by altering the induced velocity distribution, the findings here are consistent and provide experimental validation through a dedicated test bench. The analytical method, once corrected with an appropriate ground effect coefficient, was shown to align closely with both CFD predictions and experimental data, reducing discrepancies and confirming the validity of the working hypothesis.
The thrust amplification observed in the third configuration, where the propeller operates in close proximity to the mounting plate, can be attributed to the classical ground-effect mechanisms described in the literature [35,36,37,38]. When the propeller is positioned near a solid boundary, the induced flow is partially restricted, leading to a redistribution of pressure beneath the rotor disk. This results in a local increase in static pressure on the lower surface of the blades and a corresponding reduction in the induced velocity at the slipstream. Consequently, a greater portion of the aerodynamic load is converted into useful thrust rather than kinetic energy of the wake.
Additionally, the presence of the plate generates a reflected jet that interacts with the main flow, enhancing the upward momentum flux and effectively reducing the downwash angle. This interaction modifies the pressure field around the propeller hub and in the near-wake region, producing a net thrust increase typically ranging between 20% and 40% for the height-to-radius ratios considered in this study. The combination of these effects, pressure recovery, jet reflection, and reduced induced losses, explains the significant thrust augmentation observed numerically and experimentally in underground-effect conditions. These results emphasize that simplified analytical approaches, while effective in free-flight conditions, must be refined when replicating test bench or near-ground scenarios, as neglecting these effects may lead to significant underestimations of thrust. In the broader context of UAV propulsion research, this study demonstrates the importance of integrating analytical, numerical, and experimental approaches to achieve reliable performance predictions.
Future work should extend this methodology to different propeller geometries, variable pitch configurations, and higher Reynolds number regimes, as well as to the investigation of acoustic signatures in ground-effect conditions. Such studies would further strengthen the predictive capability of analytical models and support the design of UAV propulsion systems with improved efficiency and reduced environmental impact.

5. Conclusions

This study has presented the development, validation, and application of a dedicated experimental test bench for UAV propellers, supported by a combined analytical, numerical, and experimental methodology. The main outcomes can be summarized as follows:
  • Test bench design and validation—The stand was developed through an iterative design process, ensuring structural stability and measurement accuracy. Its modular architecture enabled reliable acquisition of thrust, torque, and rotational speed, establishing a robust platform for UAV propulsion research.
  • The classical Blade Element Theory (BET) was employed for analytical predictions. To ensure comparability with experimental conditions, the model was refined by incorporating ground effect through a correction factor. This adaptation proved essential for realistic predictions under near-ground conditions, as confirmed by both CFD and experimental data.
  • High-fidelity CFD simulations using ANSYS CFX and the k–ω SST turbulence model provided detailed insights into the aerodynamic field across three configurations (isolated propeller, propeller with motor, and full assembly with mounting plate). The results highlighted how installation effects, particularly the mounting plate, introduce local flow perturbations and significantly amplify thrust due to ground effect.
  • A series of controlled tests were performed across nine operating points, yielding consistent measurements of thrust, electrical power, and rotational speed. The data demonstrated the quadratic dependency of thrust on rotational speed and confirmed the amplification induced by ground effect.
  • When compared at the reference speed of ~2170 rpm, the analytically corrected method showed an error of only 3.9% relative to the experimental campaign, while CFD predictions deviated by 7.6%. This validates the analytical refinement as a reliable predictive tool and confirms the overall consistency of the three methodologies.
Overall, the integration of analytical, CFD, and experimental approaches has provided a comprehensive framework for understanding propeller performance in near-ground conditions. The findings underscore the critical importance of accounting for installation effects and ground proximity when evaluating UAV propulsion systems, as neglecting these factors may lead to substantial underestimations of thrust and efficiency.
From a broader perspective, this study contributes to bridging the gap between idealized theoretical models and realistic operational scenarios for UAV propellers. The methodology established here not only validates the performance of the G30 × 10.5 carbon-fiber propeller but also offers a generalizable framework applicable to other propeller geometries and operating conditions.
Future research should focus on extending this approach to variable pitch propellers, dynamic ground-effect scenarios (e.g., take-off and landing), and acoustic characterization, thereby advancing the design of next-generation UAV propulsion systems with improved performance and reduced environmental footprint.

Author Contributions

Conceptualization, M.D.; methodology, M.D. and T.-F.F.; software, T.-F.F. and M.C.; validation, G.-P.B. and M.D.; formal analysis, M.D. and D.-E.C.; investigation, G.-P.B.; resources, D.-E.C.; data curation, T.-F.F. and G.-P.B.; writing—original draft preparation, M.D.; writing—review and editing, M.C. and D.-E.C.; visualization, T.-F.F.; supervision, D.-E.C.; project administration, D.-E.C. and T.-F.F. All authors have read and agreed to the published version of the manuscript.

Funding

This research was supported by the Doctoral School of Aerospace Engineering, Faculty of Aerospace Engineering, National University of Science and Technology Polytechnic of Bucharest. This article was funded by the PubArt program of the National University of Science and Technology Polytechnic of Bucharest.

Data Availability Statement

The data presented in this study are available on request from the corresponding author.

Acknowledgments

This research was carried out under the “Nucleu” Program, Grant No. 31N/2023, Project PN23.12.03.01, funded by the Romanian Ministry of Research, Innovation and Digitization. The APC was also funded by the Romanian Ministry of Research, Innovation and Digitization through the “Nucleu” Program, Grant No. 31N/2023.

Conflicts of Interest

The authors declare no conflicts of interest.

References

  1. Frigioescu, T.-F.; Crunteanu, D.-E.; Căldărar, M.; Dombrovschi, M.; Badea, G.-P.; Nistor, A. Development and Implementation of an Autonomous Control System for a Micro-Turbogenerator Installed on an Unmanned Aerial Vehicle. Electronics 2025, 14, 1212. [Google Scholar] [CrossRef]
  2. Shakoor, S.; Kaleem, Z.; Baig, M.I.; Chughtai, O.; Duong, T.Q.; Nguyen, L.D. Role of UAVs in Public Safety Communications: Energy Efficiency Perspective. IEEE Access 2019, 7, 140665–140679. [Google Scholar] [CrossRef]
  3. Stone, Z.; Parker, K.A. Unmanned aerial vehicle (UAV) activity elicits little to no response from New Zealand forest birds during wildlife monitoring. Notornis 2022, 69, 25–119. [Google Scholar] [CrossRef]
  4. Dombrovschi, M.; Deaconu, M.; Cristea, L.; Frigioescu, T.-F.; Cican, G.; Badea, G.-P.; Totu, A.-G. Acoustic Analysis of a Hybrid Propulsion System for Drone Applications. Acoustics 2024, 6, 698–712. [Google Scholar] [CrossRef]
  5. Adoni, W.Y.H.; Lorenz, S.; Fareedh, J.S.; Gloaguen, R.; Bussmann, M. Investigation of Autonomous Multi-UAV Systems for Target Detection in Distributed Environment: Current Developments and Open Challenges. Drones 2023, 7, 263. [Google Scholar] [CrossRef]
  6. Badea, G.-P.; Frigioescu, T.-F.; Dombrovschi, M.; Cican, G.; Dima, M.; Anghel, V.; Crunteanu, D.-E. Innovative Hybrid UAV Design, Development, and Manufacture for Forest Preservation and Surveillance. Inventions 2023, 9, 39. [Google Scholar] [CrossRef]
  7. Brandt, J.; Selig, M. Propeller Performance Data at Low Reynolds Numbers. In Proceedings of the 49th AIAA Aerospace Sciences Meeting including the New Horizons Forum and Aerospace Exposition, Orlando, FL, USA, 4–7 January 2011. [Google Scholar]
  8. Bohorquez, F.; Pines, D.; Samuel, P.D. Small Rotor Design Optimization Using Blade Element Momentum Theory and Hover Tests. J. Aircr. 2010, 1, 268–283. [Google Scholar] [CrossRef]
  9. Zawodny, N.; Haskin, H. Small Propeller and Rotor Testing Capabilities of the NASA Langley Low Speed Aeroacoustic Wind Tunnel. In Proceedings of the 23rd AIAA/CEAS Aeroacoustics Conference, Denver, CO, USA, 5–9 June 2017. [Google Scholar] [CrossRef]
  10. Guclu, G.; Tran, H.; Nguyen, E.; Singh, M.; Zaidi, S. Designing and Testing a Test Stand to Evaluate the Performance of a Custom-Built Drone. In Proceedings of the 2024 Regional Student Conferences, Santiago, Chile, 27 January 2024. [Google Scholar]
  11. Theyssen, J. The radiation from railway wheel modes and their effect on loudness, sharpness, and equivalent pressure level. Acta Acust. 2024, 8, 20. [Google Scholar] [CrossRef]
  12. Siddiqi, Z.; Lee, J.W. A computational and experimental study on aerodynamics of motor-driven propellers using thrust stand and rotating cup anemometer. Prog. Comput. Fluid Dyn. Int. J. 2022, 22, 23. [Google Scholar] [CrossRef]
  13. Tzomakas, M.K.; Peppa, V.; Alexiou, A.; Karakatsanis, G.; Episkopakis, A.; Michail, C.; Valais, I.; Fountos, G.; Kalyvas, N.; Kandarakis, I.S. A phantom based evaluation of the clinical imaging performance of electronic portal imaging devices. Heliyon 2023, 9, e21116. [Google Scholar] [CrossRef]
  14. Zhang, Z.; Xie, C.; Wang, W.; An, C. An Experimental and Numerical Evaluation of the Aerodynamic Performance of a UAV Propeller Considering Pitch Motion. Drones 2023, 7, 447. [Google Scholar] [CrossRef]
  15. Eldegwy, M.; Hetta, M.; Nabawy, M.; Mohamady, O. Experimental investigation into the performance of UAV propellers at low Reynolds numbers. In Proceedings of the AIAA SCITECH 2024 Forum, Orlando, FL, USA, 8–12 January 2024. [Google Scholar] [CrossRef]
  16. Kan, X.; Thomas, J.; Teng, H.; Tanner, H.G.; Kumar, V.; Karydis, K. Analysis of Ground Effect for Small-Scale UAVs in Forward Flight. IEEE Robot. Autom. Lett. 2019, 4, 3860–3867. [Google Scholar] [CrossRef]
  17. Cai, J.; Gunasekaran, S.; Ol, M. Effect of Partial Ground and Partial Ceiling on Propeller Performance. J. Aircr. 2023, 3, 648–661. [Google Scholar] [CrossRef]
  18. Conyers, S.A. Empirical Evaluation of Ground, Ceiling, and Wall Effect for Small-Scale Rotorcraft. Ph.D. Thesis, University of Denver, Denver, CO, USA, 2019. [Google Scholar]
  19. Chiew, J.; Aftosmis, M.; Manies, K. Medium-Fidelity CFD Modeling of Multicopter Wakes for Airborne Sensor Measurements. In Proceedings of the Vertical Flight Society’s 78th Annual Forum & Technology Display, Fort Worth, TX, USA, 10–12 May 2022; pp. 1–13. [Google Scholar] [CrossRef]
  20. Sanchez-Cuevas, P.; Heredia, G.; Ollero, A. Characterization of the Aerodynamic Ground Effect and Its Influence in Multirotor Control. Int. J. Aerosp. Eng. 2017, 2017, 1823056. [Google Scholar] [CrossRef]
  21. Zhu, H.; Wei, S.; Nie, H.; Du, Y.; Wei, X. Ground Effect on the Thrust Performance of Staggered Rotor System. Drones 2024, 8, 118. [Google Scholar] [CrossRef]
  22. Wu, Z.; Zhang, T.; Tan, H.; Zhou, H.; Chen, W.; Xie, M. Hovering rotor aerodynamics in extreme ground effect. Chin. J. Aeronaut. 2024, 37, 204–219. [Google Scholar] [CrossRef]
  23. He, X.; Leang, K.K. Rotorcraft in-ground effect models in axial and forward flight. Aerosp. Sci. Technol. 2025, 156, 109748. [Google Scholar] [CrossRef]
  24. Jordan, W.A.; Narsipur, S.; Deters, R. Aerodynamic and Aeroacoustic Performance of Small UAV Propellers in Static Conditions. In Proceedings of the AIAA AVIATION 2020 FORUM, Online, 15–19 June 2020. [Google Scholar]
  25. Zhang, T.; Qiao, G.; Smith, D.; Barakos, G.; Kusyumov, A. Parametric study of aerodynamic performance of equivalent ducted/un-ducted rotors. Aerosp. Sci. Technol. 2021, 117, 106984. [Google Scholar] [CrossRef]
  26. Yilmaz, S.; Erdem, D.; Kavsaoglu, M.S. Performance of a ducted propeller designed for UAV applications at zero angle of attack flight: An experimental study. Aerosp. Sci. Technol. 2015, 45, 376–386. [Google Scholar] [CrossRef]
  27. de Pierrepont Franzetti, I.D.D.M.; Parin, R.; Capello, E.; Rutherford, M.J.; Valavanis, K.P. Ground, Ceiling and Wall Effect Evaluation of Small Quadcopters in Pressure-controlled Environments. J. Intell. Robot. Syst. 2024, 110, 125. [Google Scholar] [CrossRef]
  28. Carter, D.; Zhong, Q.; Quinn, D. Using ground effect to model the performance of small near-water rotors. In Proceedings of the AIAA SCITECH 2024 Forum, Orlando, FL, USA, 8–12 January 2024. [Google Scholar]
  29. Zhang, G.; Xing, Y.; Zhang, W.; Li, J. Prescribed Performance Control for USV-UAV via a Robust Bounded Compensating Technique. IEEE Trans. Control. Netw. Syst. 2025, 12, 2289–2299. [Google Scholar] [CrossRef]
  30. Hanson, L.; Jawahar, H.K.; Vemuri, S.S.; Azarpeyvand, M. Experimental investigation of propeller noise in ground effect. J. Sound Vib. 2023, 559, 117751. [Google Scholar] [CrossRef]
  31. PA1 Miniature Single Point Load Cell|Flintec. Available online: https://www.flintec.com/weight-sensors/load-cells/single-point/pa1 (accessed on 26 September 2025).
  32. Tahometru cu Senzor Hall Maxim 9999 RPM. Available online: https://www.optimusdigital.ro/ro/senzori-senzori-hall/4490-tahometru-cu-senzor-hall-maxim-9999-rpm.html?srsltid=AfmBOoo5yKCV7fCn1jF7QihVJbyr7OsmGtN8MurBAzh3WUJQlzyeBOLZ (accessed on 26 September 2025).
  33. Hassan, T.; Islam, M.; Mizanur Rahman, M.; Ali, A.; Ziyan, A. 180-Evaluation of Different Turbulence Models at Low Reynolds Number for the Flow over Symmetric and Cambered Airfoils. J. Eng. Adv. 2022, 3, 12–22. [Google Scholar] [CrossRef]
  34. Sun, W. Assessment of advanced RANS turbulence models for prediction of complex flows in compressors. Chin. J. Aeronaut. 2023, 36, 162–177. [Google Scholar] [CrossRef]
  35. Newman, S.J. Principles of Helicopter Aerodynamics, 2nd ed.; Leishmann, J.G., Ed.; Cambridge University Press: Cambridge, UK, 2006; 826p, ISBN 0-521-85860-7. [Google Scholar]
  36. McCormick, B.W. Aerodynamics, Aeronautics, and Flight Mechanics, 2nd ed.; Wiley: Hoboken, NJ, USA, 1995. [Google Scholar]
  37. Cai, J.; Gunasekaran, S. Propeller Ground Effect in Forward Flight. AIAA J. 2023, 61, 4378–4390. [Google Scholar] [CrossRef]
  38. Prouty, R. Helicopter Aerodynamics; Phillips Business Information, Inc.: Lebanon, OH, USA, 2009; Volume I, 592p, ISBN 978-0557089918. [Google Scholar]
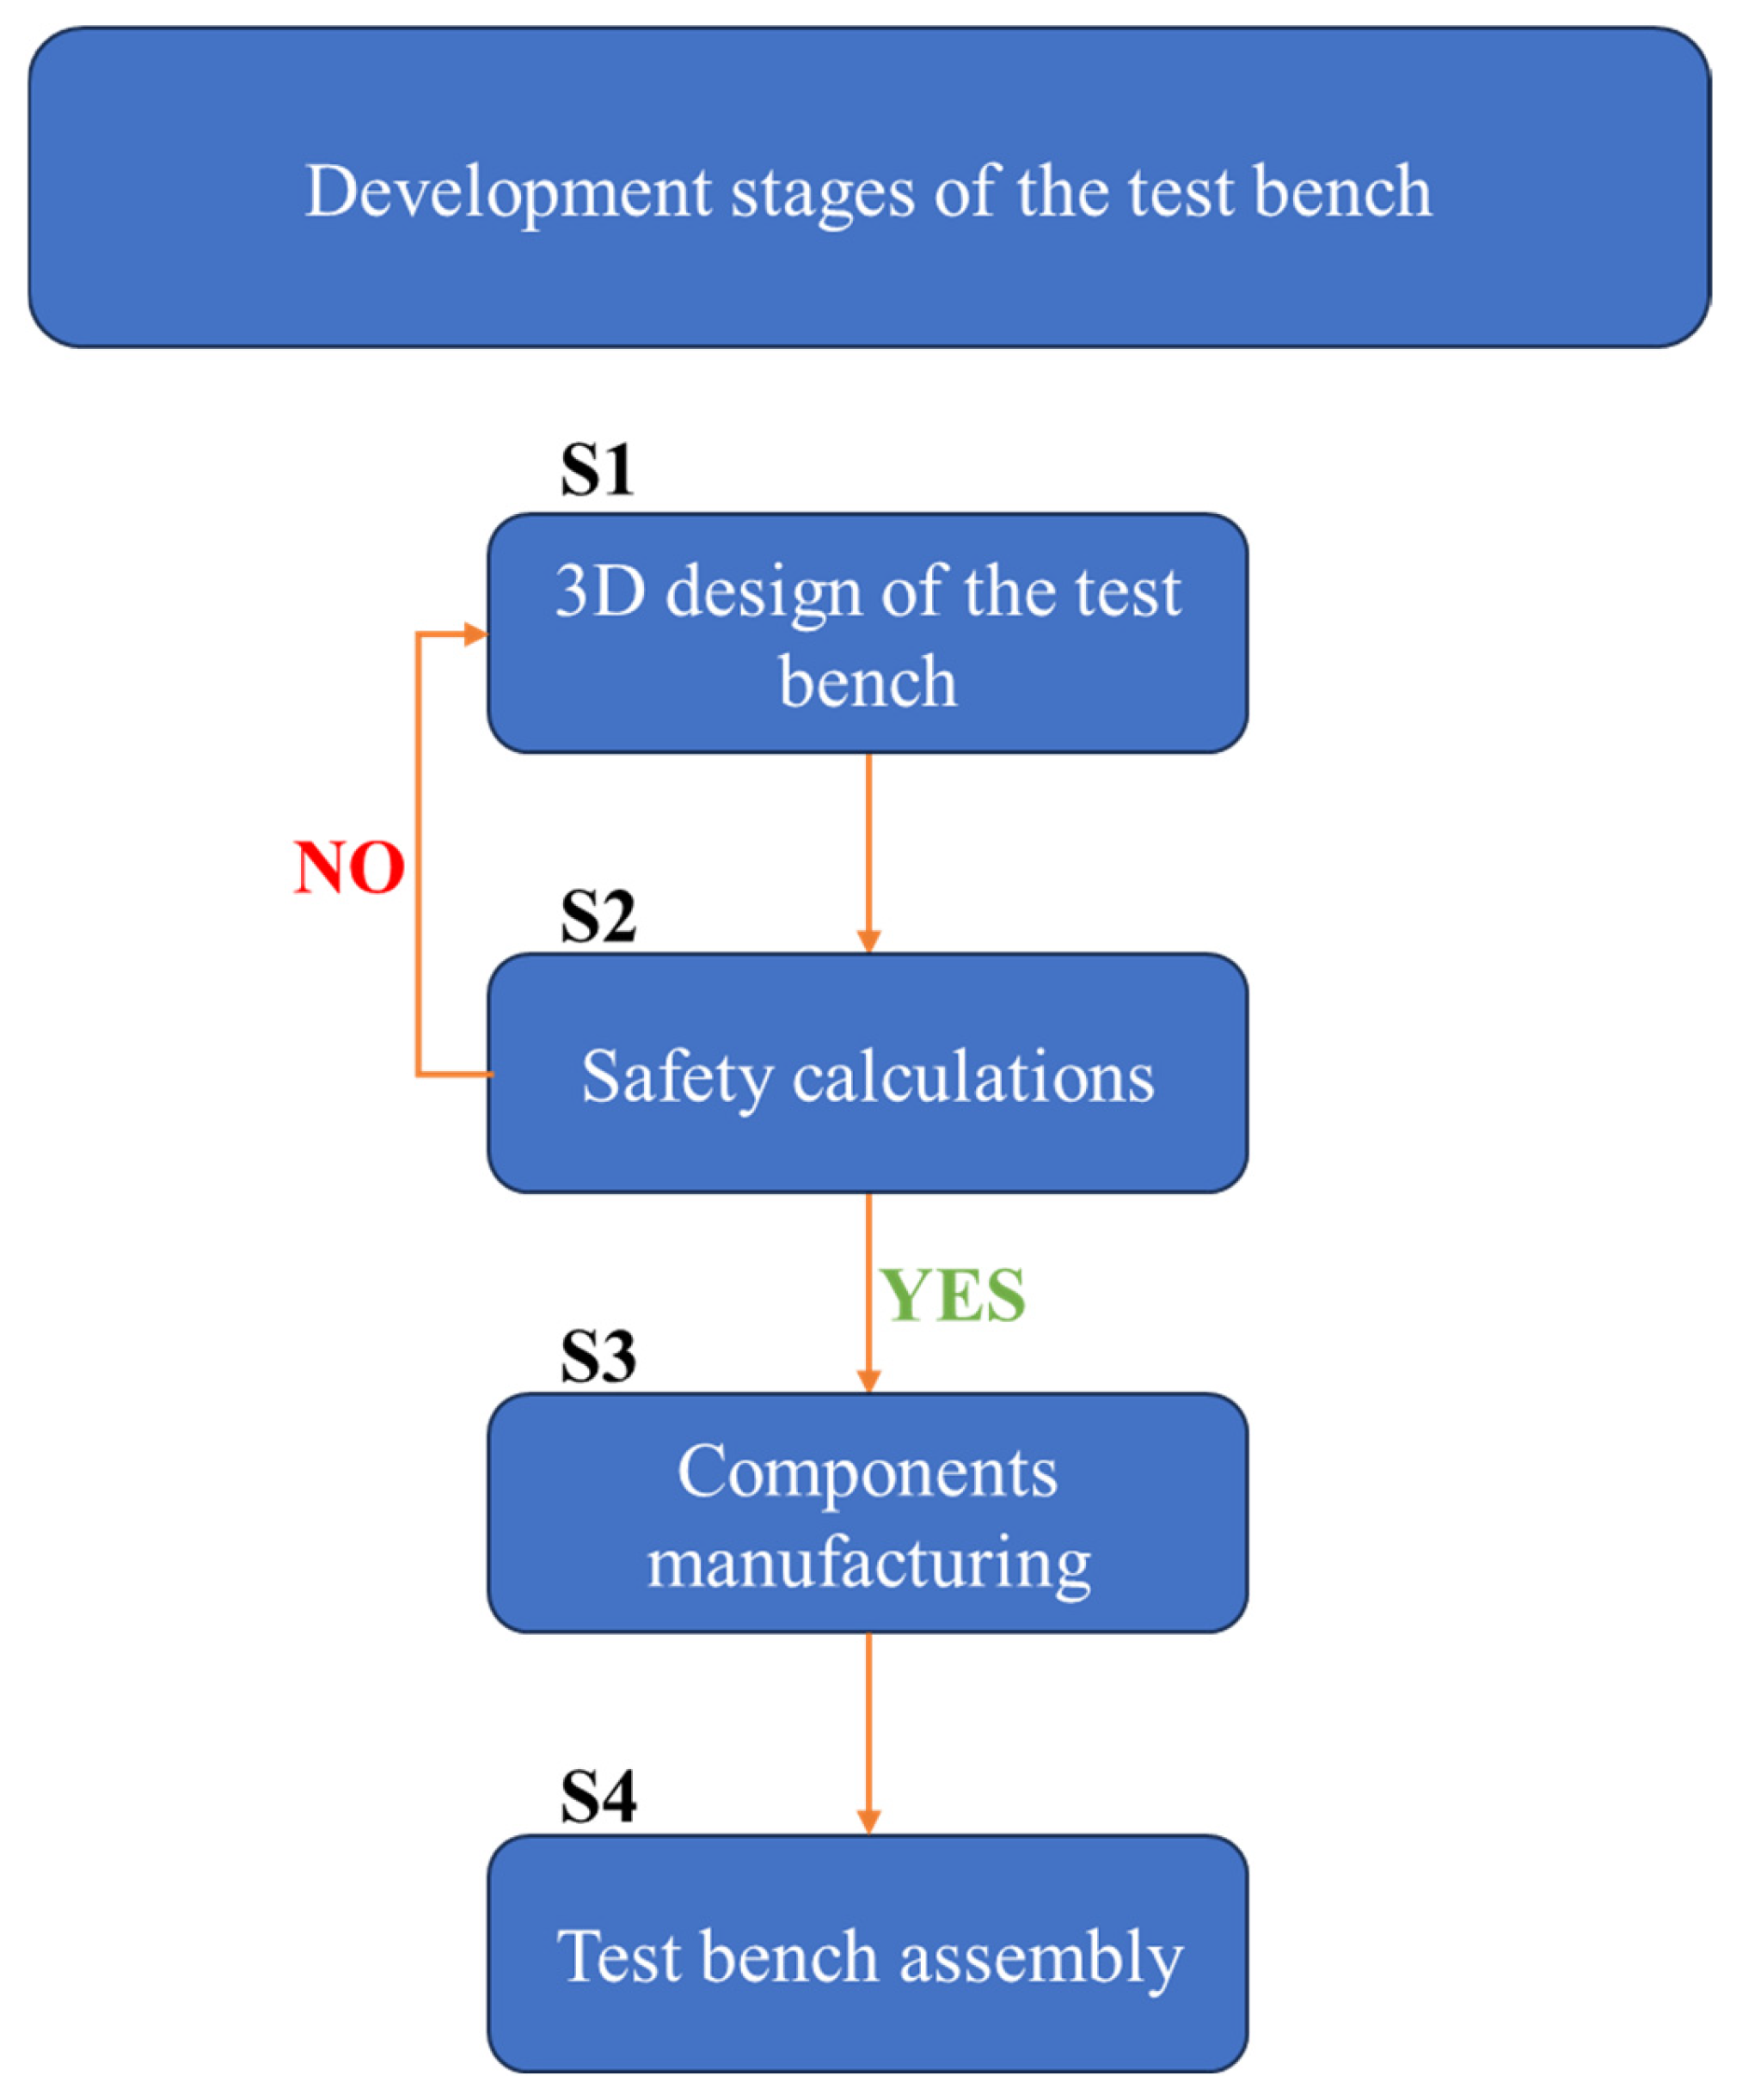
Figure 1. Development stages of the test bench.
Technologies 13 00542 g001
Figure 2. (a) Front view of the test bench 3D model, (b) Top view.
Technologies 13 00542 g002
Figure 3. Experimental test bench with labeled components used for load cell calibration and thrust measurement.
Technologies 13 00542 g003
Figure 4. Propeller geometry and mean−radius airfoil section (r/R = 0.5).
Technologies 13 00542 g004
Figure 5. 3D model of the propeller.
Technologies 13 00542 g005
Figure 6. CFD domain configuration.
Technologies 13 00542 g006
Figure 7. Mesh of the propeller.
Technologies 13 00542 g007
Figure 8. Rotating domain for the Propeller + motor case.
Technologies 13 00542 g008
Figure 9. Pressure distribution on the motor surface.
Technologies 13 00542 g009
Figure 10. Domain modifications for the 3rd case.
Technologies 13 00542 g010
Figure 11. Pressure contour on the mounting plate for the propeller + motor + plate configuration.
Technologies 13 00542 g011
Figure 12. Velocity contour for all the cases, (a) isolated case; (b) propeller + motor case; (c) propeller + motor + plate case.
Technologies 13 00542 g012
Figure 13. Q-criterion contours illustrating the wake vortex structures, (a) isolated case; (b) propeller + motor case; (c) propeller + motor + plate case.
Technologies 13 00542 g013
Figure 14. Pressure contour for all the cases, (a) isolated case; (b) propeller + motor case; (c) propeller + motor + plate case.
Technologies 13 00542 g014
Figure 15. Test bench in the experimental campaign.
Technologies 13 00542 g015
Figure 16. Force Variation.
Technologies 13 00542 g016
Figure 17. Comparison of thrust variation with rotational speed obtained from the experimental campaign, analytical method (with ground effect correction), and CFD simulations.
Technologies 13 00542 g017
Table 1. Test bench geometric parameters.
NameDescriptionValueUnit of Measure
Manufacturer Details
(Propeller + Motor)
F p r o p p Force generated by the propeller200N
M m o t o r Generated momentum by the electric motor25Nm
R s c r e w Bolt Circle Radius of the Motor Mounting Screws0.025m
Geometric parameters h m o t o r Height from the Stand Base to the Motor Center0.898m
b Distance from the Center of Mass to the Overturning Edge0.36m
W b e n c h Test bench Weight700N
Physical Characteristics μ Friction coefficient0.8N/A
Table 2. Geometric characteristics of the propeller.
ParameterDescriptionValueUnit of Measurement
D 1 Propeller Diameter0.76m
R 1 Propeller Radius0.38m
d 1 Hub Diameter0.08m
r 1 ¯ Non-dimensional Radius 0.10526N/A
NNumber of Blades2N/A
nPropeller Rotational Speed2174Rot/min
ΩAngular Velocity227.7Rev/min
bBlade chord0.07m
b ¯ Non-dimensional chord with respect to propeller diameter0.18421N/A
τBlade Profile camber Angle−0.02rad
ρAir density1.225 k g / m 3
θ 0 Reference Angle for Establishing the blade pitch angle9.3°
d r ¯ Radial Increment Step0.02N/A
Table 3. Comparison of CFD-predicted thrust forces with analytical and manufacturer reference values.
Manufacturer Force: 38.72 [N]
Case No.Force CFD [N]Deviation from Analytic [%]Deviation from Producer [%]
136.630.5%5%
237.432.4%3%
345.721%15%
Table 4. Incremental thrust contribution of the motor and mounting plate relative to the isolated propeller configuration.
ConfigurationThrust [N]ΔThrust [%] vs. Isolated
Isolated propeller36.63N/A
Propeller + motor37.43+2.2%
Propeller + motor + plate45.7+24.7%
Table 5. Results of the experimental campaign.
Case No.Rotational Speed [rpm]Voltage [V]Current [A]Force [N]Power [W]
136846.230.41.3818.49
265046.20.74.33234
393546.11.38.7659.93
41200462.215.18101.2
51440463.221.63147.2
6168645.854.629.31210.91
7190045.76.437.96292.48
8217145.559.249.44419.06
9230545.351155.68498.85
Disclaimer/Publisher’s Note: The statements, opinions and data contained in all publications are solely those of the individual author(s) and contributor(s) and not of MDPI and/or the editor(s). MDPI and/or the editor(s) disclaim responsibility for any injury to people or property resulting from any ideas, methods, instructions or products referred to in the content.