Abstract
Sleep spindles, together with K-complexes, are the distinctive patterns of neuronal activity in EEG recordings during stage 2 sleep. When the mechanisms of sleep spindle generation are impaired, e.g., in epilepsy, their quantitative parameters change. The analysis of these changes can provide valuable insights into the formation of epileptiform activity patterns and help to develop an additional tool for more accurate medical diagnosis. Despite the central role of EEG in the diagnosis of epilepsy, disorders of consciousness, and neurological research, resources specifically dedicated to large-scale EEG data analysis are under-represented. In our study, we collect a specialized database of clinical EEG recordings from epilepsy patients and controls during N2 sleep, characterized by rhythmic spindle activity in frontocentral and vertex regions, and manually annotate them. We then quantify four key sleep spindle characteristics using a comparison of manual annotation by a clinician and artificial intelligence technologies. A thorough evaluation of state-of-the-art deep learning architectures for detecting and characterizing sleep spindles in EEG recordings from epilepsy patients is conducted. The results show that the 1D U-Net and SEED architectures achieve competitive overall performance, but their precision-to-recall ratios differ markedly in clinical settings. This suggests that different approaches may be appropriate for each clinical situation. Furthermore, our results demonstrate that epilepsy is associated with significant and quantifiable changes in sleep spindle morphology and frequency. Automated analysis of these characteristics using artificial intelligence provides a reliable biomarker that provides a detailed picture of thalamocortical dysfunction in epilepsy. This approach has great potential for accelerated diagnosis and the development of targeted therapeutic strategies for epilepsy.
Keywords:
sleep spindles; epilepsy; automatic analysis; automatic segmentation; U-Net; SlumberNet; SEED 1. Introduction
Sleep spindles are transient oscillatory events in the electroencephalogram (EEG), typically observed during non-rapid eye movement (NREM) stage 2 sleep (N2), where they occur together with K-complexes as distinctive hallmarks of neuronal activity. They appear as sinusoidal cycles in the 9–16 Hz range, lasting on average 0.5–3 s, with their spindle-shaped envelope inspiring their name [1,2,3]. Generated primarily through thalamocortical interactions, spindles are considered cortical correlates of thalamic function and are thought to reflect the strength and plasticity of thalamocortical networks [2]. They play an essential role in sleep continuity, memory consolidation, and synaptic plasticity, while suppressing external sensory input and facilitating neural reorganization [4,5,6]. Spindle dynamics also develop characteristic profiles across the lifespan, paralleling cortical maturation [2]. Numerous studies have demonstrated strong associations between spindle activity and cognitive performance, including memory, information processing speed, and IQ [5,7,8,9].
Altered spindle mechanisms have been observed in epilepsy, where activity and quantitative parameters can be disrupted [10]. Although mechanisms are not fully understood, several consistent findings have emerged. Spindle density may decrease in certain epilepsies, often coinciding with spike–wave discharges (SWD) [11], which are characteristic 3–4 Hz bilateral events in idiopathic generalized epilepsies [12]. In childhood epilepsy with centrotemporal spikes, reduced spindle activity anticorrelates with spike frequency [13]. Spindle frequency can also be modulated by antiepileptic drugs [14], while increased spindle duration has been observed immediately before seizures in nocturnal frontal lobe epilepsy [15]. Together, these findings suggest that spindle activity changes may serve as biomarkers of epileptic foci. Beyond simple measures such as frequency or count, comprehensive characterization, including duration, amplitude, spatial distribution, and localization, may provide deeper insights into neural dynamics in both health and disease [16].
Despite this importance, spindle research faces persistent challenges. As noted in [17], limited dataset sizes, inconsistent reporting, and poor agreement on detection methodologies complicate studies. EEG analysis is inherently time-intensive, often resulting in small datasets, and highlighting the need for automated spindle detection to increase diagnostic accessibility while reducing expert burden. Certainly, the use of multimodal data, including EEG and other indicators (heart rate, respiration, etc.) an AI technology can ensure the development of a comprehensive approach to the diagnosis of epilepsy. Many researchers are currently developing unique methods for recording such multimodal data, even during overnight monitoring. For example, Chaoke Zou and co-authors [18] developed a smart mattress based on a spherical lens-enhanced plastic optical fiber sensor. This devace employs a dual-channel design and collected data from eight subjects in various sleep postures, including heart rate and respiration parameters. This smart mattress is capable of long-term, stable monitoring of physiological parameters and sleep behavior monitoring, what is critical for monitoring in epilepsy. Besides diagnosing epilepsy, overnight EEG monitoring and the recorded patterns during sleep form the basis for diagnosing other disorders, such as insomnia, hypersomnia, sleep cycle disorders, sleep apnea, and others [19]. The systems being developed for monitoring and detecting, as well as assistance with these sleep disorders, also include a computational sleep-box and a lightweight VR glasses for real-time data processing [20], wearable devices integrated with artificial intelligence [21], bed sensors, ambient room sensors and mobile devices [22]. It is worth noting that deep machine learning technologies are used in data analysis in modern signal sleep monitoring devices.
Deep neural networks (DNNs) now represent the state of the art in spindle detection, surpassing wavelet-based methods [23,24,25,26,27] and classical machine learning [28,29,30,31]. Traditional approaches rely on hand-crafted features [32,33,34], which are labor-intensive and prone to bias. By contrast, DNNs learn hierarchical features directly from raw data, minimizing manual design and improving scalability [35,36,37]. Nevertheless, current models face limitations, including high false positive rates, poor generalizability across datasets due to protocol differences, and computational demands that hinder clinical adoption. These challenges underscore the need for robust, efficient, and clinically viable deep learning models.
The aim of this work is to analyze sleep spindles in EEG recordings from healthy subjects and patients with epilepsy using deep learning. We evaluate different network architectures for automated spindle detection under two strategies: (i) a segmentation-based pipeline, where spindles are first detected and then characterized, and (ii) a segmentation-free pipeline, where spindle characteristics are predicted directly from raw EEG. Performance is assessed using precision, recall, and F1-score to determine the most suitable framework for clinical use. Using the optimal approach, we then compare spindle characteristics between epilepsy patients and controls to investigate alterations in spindle dynamics.
An innovation of the proposed study lies in the creation of a comprehensive sleep-based epilepsy diagnostic tool based on the collection of specialized EEG data and the validation of deep learning algorithms for determining sleep spindle morphological parameters as a quantitative biomarker for epilepsy.
The remainder of this paper is organized as follows: Section 2 describes the materials and datasets. Section 3 details the methodology. Section 4 presents experimental results, including architecture comparison, evaluation of segmentation-based versus segmentation-free approaches, and spindle alterations in epilepsy. Section 5 discusses the implications of our findings, and Section 6 summarizes conclusions and outlines directions for future work.
2. Materials and Data Recording Details
In this study, we perform a retrospective analysis of video-EEG recordings obtained from the archive of the Video-EEG Laboratory Genomed Ltd. (Moscow, Russia). Recordings were acquired during both wakefulness and sleep, with functional activation tests included when clinically indicated. The monitoring duration for each subject ranged from 3 to 10 h. EEG was recorded using the NeuroScope system (BIOLA LLC., Moscow, Russia), with electrodes positioned according to the international 10–20 system.
2.1. Ethics Statement
All study procedures were reviewed and approved by the Bioethics Committee of the Institute of Biology and Biomedicine, National Research Lobachevsky State University of Nizhny Novgorod. This study was conducted in accordance with the Declaration of Helsinki and relevant institutional guidelines.
2.2. Participants
A total of 24 individuals were included in this study: 12 patients with a confirmed diagnosis of epilepsy and 12 neurologically healthy controls.
Both groups (patients with epilepsy and controls) were stratified into the following age cohorts:
- Early childhood (1–3 years): 2 patients (ages 2 and 3);
- Preschool age (4–6 years): 3 patients (ages 4, 5, and 6);
- Primary school age (7–11 years): 6 patients (ages 7, 8, 8, 8, 8, and 10);
- Adolescence (12–18 years): 1 patient (age 12).
The median age in both groups was 7.5 years (range: 2–12 years).
2.3. Data Acquisition and Automatic Preprocessing by NeuroScope Software
EEG recordings were reviewed using both bipolar and monopolar (referential) montages to enable complementary assessment of spatial and temporal activity patterns. The acquisition and display parameters were set as follows:
- Sweep speed: 30 mm/s;
- Sensitivity: 7–15 μV/mm;
- Low-frequency cutoff: 0.5 Hz;
- High-frequency cutoff: 70 Hz;
- Notch filter: 50 Hz (to suppress power-line interference).
Automatic preprocessing was performed using NeuroScope software (version 6.3.2497), which applied standardized filtering and artifact reduction procedures to ensure signal quality and consistency across recordings.
2.4. Sleep Spindle Annotation
Ten-minute segments of stage N2 non-REM sleep, characterized by rhythmic spindle activity (9–15 Hz) in fronto-central and vertex regions, were selected for manual annotation. Spindle markings were independently reviewed by two EEG experts with more than five years of experience. In cases of uncertainty, the final boundaries were determined through consensus.
Sleep spindles were classified into three categories according to amplitude, duration, and morphology, with each category providing unique benefits for optimizing DL model training:
- Definite spindles (SP): amplitude ≥ 20 μV, duration ≥ 1 s, located in fronto-central and vertex regions. SP serve as high-confidence “anchor” examples, offering clean prototypes of frequency, temporal profile, and waveform shape. They reduce noise in the training set and ensure stable learning during early stages.
- Probable spindles (PS): amplitude < 20 μV, duration ≥ 0.5 s, located in vertex and partially fronto-temporal regions. PS capture borderline cases between genuine spindles and other oscillations (e.g., partial arousals, artifacts). Including these examples improves the model’s ability to generalize and reduces overfitting to only idealized patterns.
- Dubious spindles (DS): amplitude 10–15 μV or duration < 0.5 s, isolated in frontal or vertex regions, with unclear morphology. DS act as challenging negative or weakly positive examples. They train the network to reject artifacts and ambiguous oscillations, reflecting the complexity of real-world EEG recordings, particularly in epilepsy. Balanced sampling of these categories across training batches prevents overrepresentation of any one class and improves gradient stability.
The inclusion of “definite,” “probable,” and “dubious” categories encourages the model to learn generalized spindle features rather than overfitting to specific patients or recording systems. This strategy increases robustness to variability in EEG equipment, recording conditions, and age-related signal differences.
The main indicators of the dataset are summarized in Table 1.

Table 1.
Summary of Main Dataset Indicators.
2.5. EEG Data Sets Containing Sleep Spindles
Despite EEG’s central role in epilepsy diagnosis, consciousness disorders, and neurological research, resources explicitly dedicated to large-scale EEG remain under-represented. Indeed, databases associated with the DREAMS project [38] are very restricted in size. The Sleep Heart Health Study also proposes a PSG database derived from a prospective cohort study [39]. However, this large collection failed to become accepted as a standard resource by third parties. Potential causes for this limited use may be associated with the fact that the investigators proposing the database were not aiming to provide an open-access and general purpose archive. Indeed, it is oriented specifically towards the investigation of relationships between sleep-disordered breathing and heart diseases, and its recordings are available only upon special request and approval. Also, the EEG montage (C3-A2 and C4-A1 channels, sampled at 125 Hz) is relatively limited for general-purpose investigations in sleep research.
Another source of databases is PhysioNet. For example, here can be found the CAP sleep database, which include 108 nights with three (or more) EEG channels, from different populations (16 healthy and 92 pathological), targeting the study of cyclic alternating patterns. One can also mention the archive from St Vincent’s University Hospital, which consists of 25 overnight PSGs with two EEG channels from a population of subjects with sleep apnea. Also on PhysioNet the database from [40] is available. It consists of 61 PSGs with two EEG channels, from subjects with mild sleep onset difficulties, recorded at 100 Hz. However, these archives are limited in different aspects (number of channels, sampling frequency, number of records). Also, in our opinion, none of these databases has been widely accepted for benchmarking automated systems.
Note that recently a large-scale, deidentified, and standardized EEG database supporting artificial intelligence-driven and reproducible research in epilepsy and broader clinical neuroscience was released: the Harvard Electroencephalography Database (HEEDB) [41].
It is also worth mentioning crowd-sourcing annotation projects. The most famous of them, Massive Online Data Annotation (MODA) is a web-based open source online scoring platform, which was used in order to produce a large open-source dataset of human-scored sleep spindles (5342 spindles, from 180 subjects). Polysomnographic data for annotation from 180 subjects was sourced from the MASS database. The dataset was split into two ‘phases’, where phase 1 consisted of 100 younger subjects (mean age of years old) and phase 2 consisted of 80 older subjects (mean age of years old). A subset of N2 stage sleep from the C3 channel was sampled from each subject (see methods for details). After that 25 s epochs of this single channel EEG were presented to expert PSG technologists, researchers, and non-expert scorers. As a result, almost 100,000 candidate spindles were identified by all scorers combined.
Nevertheless, a custom databases created for specific needs of a certain study is still required. Therefore, in our study we collected custom database of clinical EEG records from patients with epilepsy and controls during stage N2 non-REM sleep, characterized by rhythmic spindle activity in fronto-central and vertex regions, and manually annotate them.
The dataset containing 24 recordings seems to be quite limited. Nevertheless, there are about 2500 examples of sleep spindles in each recording. According to our numerical experiments, this amount of sleep spindles’ examples turned out to be sufficient for applying deep models. To assess the quality of the models, cross validation scheme was used, which allows us to generalize the results. The results are estimated based on mean scores from the held-out test folds only, and thus represent an estimation of performance on unseen data from unseen subjects.
2.6. The Montreal Archive of Sleep Studies (MASS)
One of the most widely used databases in sleep studies is the Montreal Archive of Sleep Studies (MASS) [42]. It is an open-access collaborative database of laboratory-based polysomnography (PSG) recordings which includes whole-night recordings from 200 participants, 97 males (aged years) and 103 females (aged years). These recordings were pooled from eight different research protocols performed in three different hospital-based sleep laboratories. All recordings feature a sampling frequency of 256 Hz and EEG montage of 4–20 channels plus standard electro-oculography (EOG), electromyography (EMG), electrocardiography (ECG) and respiratory signals. Nevertheless, this database include only healthy controls and therefore is of limited applicability in epilepsy studies.
In this study, we used the SS2 subset, which includes expert annotations of sleep spindles and K-complexes. The SS2 subset contains recordings from 19 healthy subjects (8 males and 11 females). Sleep spindles and K-complexes were annotated by two independent experts: the first expert labeled all 19 recordings, while the second expert labeled sleep spindles in 15 recordings.
EEG data were acquired using the standard 10–20 electrode placement system at a sampling rate of 256 Hz. The primary montage consisted of 16 channels (C3, C4, Cz, F3, F4, F7, F8, O1, O2, P3, P4, Pz, T3, T4, T5, T6), with additional electrodes (Fp1, Fp2, Fpz, Pz, Cz) included depending on the subset and reference CLE channel. The dataset also provides complementary physiological signals, including EOG (4 channels: left, right, up, down), EMG (1 bipolar channel), ECG (1 channel), and respiratory thermistance.
For this work, we considered only the 15 recordings annotated by both experts. Reference labels were obtained by merging their annotations. Obvious labeling artifacts were identified and removed prior to model training.
We employed MASS as a benchmark dataset for the spindle segmentation task. Details of this evaluation are provided in Section 4.1.
3. Methodology
The methodology of this study includes of the following main steps: (i) data preprocessing; (ii) characterization of sleep spindles; (iii) construction and evaluation of deep neural network (DNN) architectures; (iv) sleep event detection; (v) training and evaluation using quantitative metrics.
3.1. Data Preprocessing for Sleep Spindle Analysis
To select the optimal frequency range for band-pass filtering, we first calculated spectrograms for the EEG recordings:
where denotes the EEG sample from a given channel, is the spectral power at frequency k, and N is the length of the fast Fourier transform (FFT), set to 256 sampling points. The step size between consecutive FFT windows was 128 sampling points.
Labels provided in the dataset were mapped onto the spectrograms, resulting in two groups: (i) spectrograms corresponding to sleep spindle segments, and (ii) spectrograms corresponding to non-spindle segments. We then calculated the average spectra for both groups and analyzed their differences for each EEG channel.
As expected, the most prominent differences appeared in the spindle frequency range. Based on these findings, a band-pass filter of –35 Hz was applied to the EEG recordings. Following filtering, each channel was normalized to zero mean and unit variance, and artifacts were attenuated by clipping amplitudes at . However, subsequent experiments demonstrated that normalization was not essential for DNN training, as model performance remained nearly identical with or without normalization.
3.2. Sleep Spindle Characteristics
Sleep spindles are defined by their spectral (frequency content and intra-frequency structure) and temporal (shape and duration) properties [43]. In this study, we quantified four main characteristics: (i) average duration; (ii) average maximal amplitude; (iii) average frequency; (iv) number of spindles, as illustrated in Figure 1.
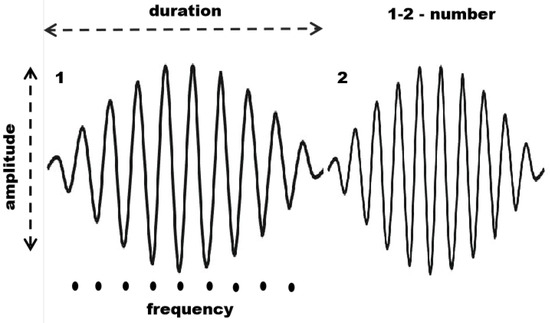
Figure 1.
Main characteristics of sleep spindles: number of spindles, duration, maximal amplitude, and average frequency.
Let x denote a segment of an EEG recording, and be the set of sleep spindles detected in this segment.
The average duration was calculated as:
where and are the start and end times of spindle , respectively.
To compute amplitude and frequency, the EEG signal from each channel was centered:
where is the mean of x over the analysis window.
The average maximal amplitude was then obtained as:
Amplitude values were averaged across all EEG channels.
The average frequency was estimated using zero-crossing counts:
where denotes the number of zero-crossings in the signal x, and represents the signal segment corresponding to spindle . Frequencies were averaged across all channels.
The number of spindles is defined as the cardinality of the set :
Finally, the spindle density was computed as the proportion of recording time occupied by spindles [44,45]:
where T is the duration of the analyzed EEG segment x.
3.3. Performance of DNN Architectures on Pathological Spindles
Automated sleep spindle detection is crucial for advancing sleep research and clinical diagnostics, offering scalability and objectivity beyond manual scoring. While traditional methods, including wavelet analysis [23,24,25,26,27] and classical machine learning (e.g., SVM [28], KNN [29], decision trees [30], bagging classifiers [31]), have laid the groundwork, deep neural networks (DNNs) now represent the state of the art due to their superior ability to learn complex features directly from raw data.
Approaches based on DNN architectures show superior performance with respect to the F1-score. Three main types of DNN architectures can be used in this task: (i) convolutional neural networks (CNN), capable of automatic feature extraction and learning, (ii) recurrent neural networks (RNN), particularly LSTMs, designed for time series processing, and (iii) mixed architectures allowing the benefits of both approaches to be used to improve the quality of sleep spindles detection. Mixed architectures often can be additionally equipped with attention heads or specific data preprocessing or feature selection pipelines, see, e.g., [46,47].
In this study, we investigated two families of DNN architectures: (1) CNNs based on ResNet, and (2) hybrid models combining CNN and recurrent layers.
3.3.1. SlumberNet Architecture
SlumberNet is a convolutional deep learning model based on the residual network (ResNet) architecture, originally developed by Jha et al. [48] to classify sleep stages in mice using EEG and EMG signals. The authors also demonstrated how the model could be adapted for human polysomnographic data.
In our work, we modified SlumberNet for spindle characteristic prediction in a segmentation-free framework. Specifically, the original classification task was reformulated as a regression problem, and an encoder module was added to obtain compressed latent representations of EEG segments. A schematic of the adapted architecture is shown in Figure 2.
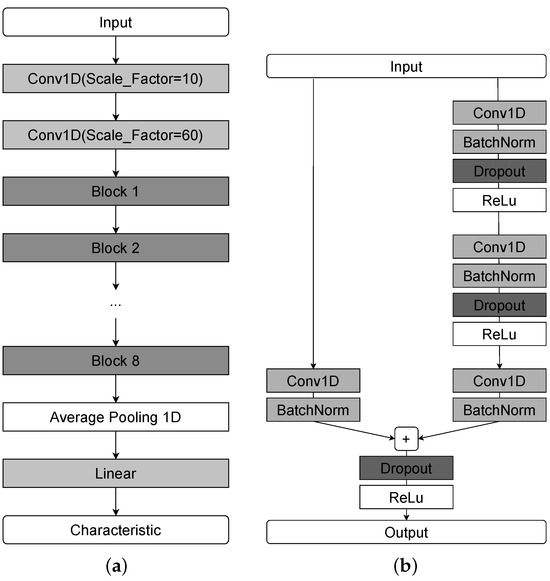
Figure 2.
A schematic representation of the SlumberNet network architecture. (a) Complete model. (b) Structure of a single residual block.
To reduce the original time resolution before residual blocks, we introduced two initial convolutional layers. Each residual block contains convolution, batch normalization, and dropout layers. The network is composed of multiple such blocks (eight in our implementation), followed by a global average pooling layer and a fully connected layer. The compression ratio of the Conv1d layers and the number of residual blocks were optimized via grid search.
3.3.2. U-Net Architecture
The U-Net model is one of the most widely used CNN architectures for segmentation tasks. The 1D U-Net is an adaptation of the original 2D image segmentation model to one-dimensional sequential data, making it well suited for biomedical signal analysis, including EEG. The schematic representation of the 1D U-Net architecture is presented in Figure 3.
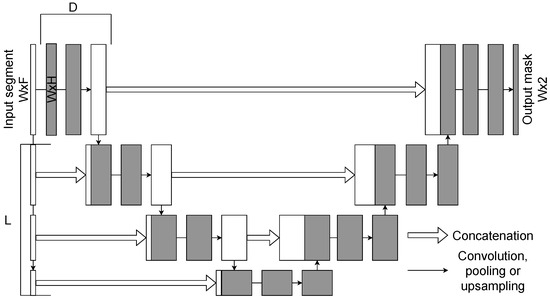
Figure 3.
A schematic representation of the 1D U-Net architecture. Here L is a number of upsampling blocks, D is a number of convolutional layers with residual connections.
Like its 2D counterpart, the 1D U-Net follows an encoder–decoder structure with skip connections. The encoder progressively reduces the temporal resolution of the input through convolution and downsampling layers, while the decoder reconstructs the signal using upsampling layers. Skip connections bridge encoder and decoder stages, ensuring that fine-grained temporal features are preserved.
The network receives an EEG segment of size as its input. The encoder comprises L downsampling blocks, each consisting of convolutions (to increase the number of channels) and D convolutional layers with residual connections. The decoder contains L upsampling blocks, each concatenating the corresponding encoder output and applying convolutions with decreasing channel dimensionality. A final one-dimensional convolution with kernel size 1 produces the output segmentation mask of size .
One of the main advantages of the 1D U-Net is its ability to capture both short- and long-range dependencies in sequential data with relatively low computational cost. Its symmetric encoder–decoder design ensures that information is preserved across different temporal scales, which is essential for accurate spindle segmentation. Input window size, number of encoder/decoder blocks, and convolutional depth D were tuned as hyperparameters via grid search.
In this study, we compared the 1D U-Net and SEED models for the task of sleep spindle segmentation (see Section 4.1).
3.4. Sleep EEG Event Detector
The Sleep EEG Event Detector (SEED) is a state-of-the-art deep learning model for sleep spindle segmentation [49]. It combines CNNs for local feature extraction with bidirectional long short-term memory (BiLSTM) layers for contextual modeling, thereby capturing both fine-grained temporal structure and long-range dependencies in EEG signals.
The SEED workflow consists of three stages: local encoding, contextualization, and sample-wise classification.Input segments contain 5040 time samples, of which the central 4000 samples constitute the prediction window. To mitigate boundary artifacts, 520 samples are appended on each side. The model outputs a dense probability sequence of 500 samples, corresponding to one prediction per 8 input samples.
In the local encoding stage, a convolutional block extracts low-level temporal features and downsamples the signal by a factor of eight, yielding a compressed multivariate time series of length 500. The contextualization stage then applies BiLSTMs to integrate information across distant samples, enabling the network to capture dependencies beyond the receptive field of convolutional filters. Finally, in the classification stage, a one-dimensional convolution followed by a softmax layer produces sample-wise probabilities of belonging to the positive (spindle) or negative (background) class.
The architecture of SEED is illustrated in Figure 4. It begins with two one-dimensional convolutions (kernel size = 3, output channels ), followed by max pooling and convolutional multi-dilated blocks (MDBs), which capture patterns across multiple temporal scales. Boundary shortening is applied to align feature maps, and two dropout layers (, ) provide regularization. Contextual dependencies are modeled by BiLSTMs with hidden units. The final classification stage uses two one-dimensional convolutions (kernel size = 1): the first maps to features, while the second produces two output channels corresponding to event vs. background classes.
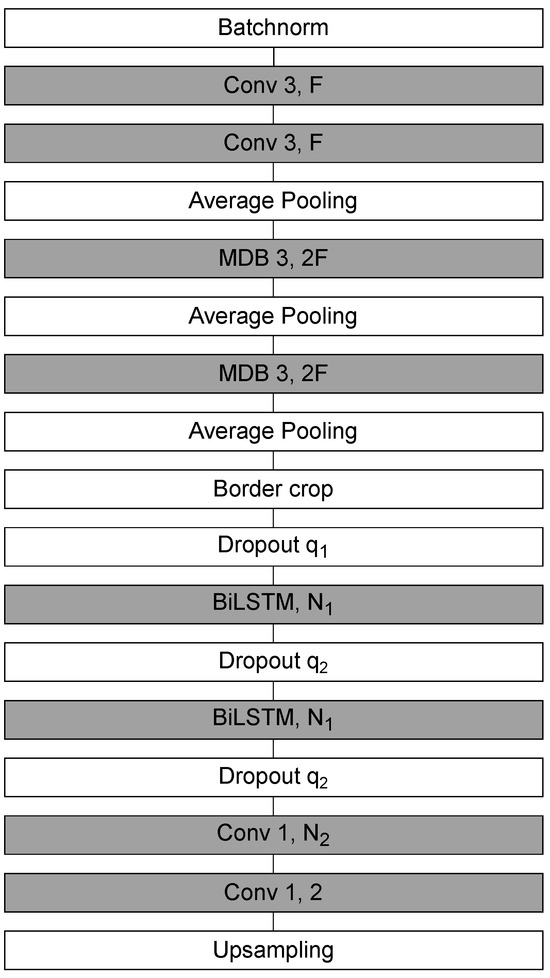
Figure 4.
A schematic representation of the SEED network architecture.
To extend SEED beyond its original design, we introduced several modifications. For segmentation tasks, upsampling layers were incorporated to preserve temporal resolution. For regression tasks, the upsampling layers were replaced with linear layers, and the degree of compression in the early convolutional blocks was increased to obtain more compact latent representations. For regression, the upsampling layers were replaced with 2 linear layers (with output of 256 and 1, respectively) with ReLu activation between them, and the degree of compression in the early convolutional blocks was increased (no additional padding was used) to obtain more compact latent representations.
Model hyperparameters were tuned via grid search. For segmentation, the prediction window size and input expansion were optimized based on the average F1-score across test or cross-validation folds. For regression, the hidden size of the final linear layer was treated as a hyperparameter and optimized according to the mean squared error (MSE) loss.
In this study, we employed SEED in both classification and regression settings (see Section 4.1 and Section 4.2 for details).
3.5. Training Process and Evaluation Metrics
For clinical EEG recordings, model training was carried out using a cross-validation scheme. Given the limited number of subjects, in each iteration all but two recordings were used for training, while the remaining two served as the evaluation set. Thus, 12 partitions are obtained, where there are 2 unique subjects in the current test part, which are not present in the test parts for any of our other partitions. Therefore, by ensuring that the training parts do not overlap with the evaluation in any way within the same partition, we have no data leakage.
This strategy was chosen instead of a single train–test split (used for the MASS dataset) to obtain a more reliable estimate of model generalization across different patients. Performance metrics were averaged across folds, reducing bias from random data partitioning and providing a more robust evaluation in real-world scenarios.
3.5.1. Segmentation-Based vs. Segmentation-Free Approaches
Two strategies for predicting sleep spindle characteristics were compared:
- Segmentation-based approach: Sleep spindles were first detected using DNN models in a sequence labeling framework, where each EEG time point was classified as spindle or non-spindle. Spindle characteristics were then computed from the resulting segmentation.
- Segmentation-free approach: Spindle characteristics were predicted directly from raw EEG segments using regression models, without an intermediate segmentation step.
Within the segmentation-free approach, we examined two subsettings: (i) training a network to predict each characteristic independently, and (ii) training a single network to predict all four characteristics simultaneously using normalized outputs and weighted loss terms. Numerical experiments demonstrated that the multi-output setting consistently underperformed the single-output models in terms of MSE.
A schematic representation of the overall pipeline is illustrated in Figure 5.
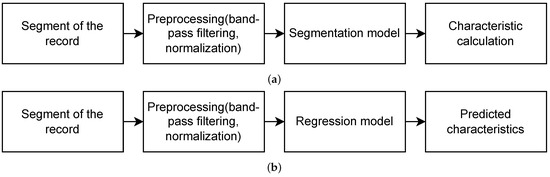
Figure 5.
Pipeline for obtaining sleep spindles characteristics using (a) segmentation-based and (b) segmentation-free approaches.
3.5.2. Loss Functions
For segmentation tasks, the binary cross-entropy (BCE) loss was used:
where n is the number of training samples, is the ground-truth label, and is the predicted probability.
For regression tasks (direct prediction of spindle characteristics), the MSE loss was optimized:
3.5.3. Evaluation Metrics
For segmentation, model performance was evaluated at the level of complete spindle events, not individual samples, using precision, recall, and F1-score:
where , , and denote the numbers of true positives, false positives, and false negatives, respectively.
3.5.4. Hyperparameter Optimization
Hyperparameters were optimized via grid search. For segmentation, the optimal settings were chosen based on the averaged F1-score across folds; for regression, the mean MSE loss was used as the selection criterion. In segmentation, the input window size was set to 4000 samples for the 1D U-Net, and to samples (with boundary padding) for SEED. The predicted label segment length was 4000 samples for both networks. In regression mode, SEED used a hidden layer size of 256 in the final linear block.
4. Results
In this section, we present the principal findings of our study, supported by empirical evidence and quantitative analysis. For each set of experiments, we provide a focused discussion that interprets the results, situates them within existing literature, and highlights their implications for understanding epilepsy-related sleep spindle dynamics in EEG recordings.
4.1. Comparison of DL Architectures for Sleep Spindle Segmentation
We first evaluated the quality of sleep spindle segmentation across different DNN architectures to identify the most suitable model. We compare two main types of models: (i) architectures based only on convolutional layers and (ii) hybrid architectures with convolutional and recurrent layers. Similar comparison of different models based on the MASS and DREAMS databases can be found in [49].
The experiments were conducted on a 10 min EEG fragment for clinical recordings and on standard-length recordings for the MASS dataset. Model performance was assessed using precision, recall, and F1-score, with automatic annotations compared against expert labels on a spindle-by-spindle (event-level) basis.
As shown in Figure 6, both architectures produced accurate spindle segmentations, closely aligned with expert annotations. The quantitative results are summarized in Table 2 (MASS dataset) and Table 3 (clinical dataset).
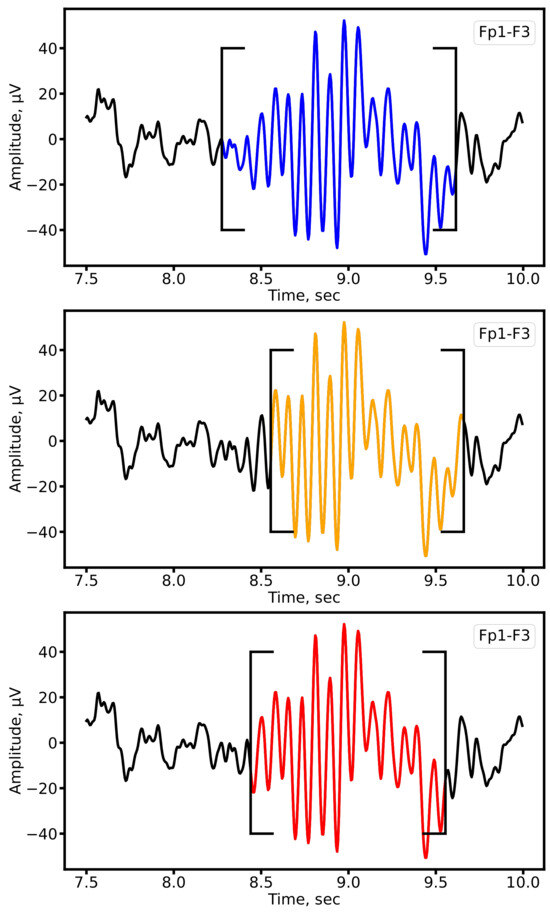
Figure 6.
Example of sleep spindle segmentation on the Fp1-F3 lead of a patient with epilepsy. Expert annotations are shown in blue, automatic segmentation by 1D U-Net in orange, and SEED in red.
Table 2.
Performance of SEED and 1D U-Net for sleep spindle segmentation on the MASS dataset.
Table 3.
Performance of SEED and 1D U-Net for sleep spindle segmentation on the clinical dataset.
The results show that both U-Net and SEED achieve comparable F1-scores on the MASS dataset and clinical data. However, the trade-off between precision and recall differs: SEED exhibits higher precision (fewer false positives), whereas U-Net achieves higher recall (fewer missed spindles). This difference reflects their architectural design: recurrent layers in SEED favor specificity, while U-Net’s convolutional structure prioritizes sensitivity. Depending on the clinical objective, one architecture may be preferable over the other, for example, U-Net when minimizing missed detections, and SEED when reducing false alarms. The obtained results are in good agreement with those presented in [49].
4.2. Comparison of Segmentation-Based and Segmentation-Free Approaches
Next, we compared two strategies for predicting spindle characteristics. The first approach (segmentation-based) derives spindle properties using formulas from Section 3.2 applied to automatically segmented events. The second approach (segmentation-free) directly predicts characteristics using regression networks, bypassing explicit segmentation.
4.2.1. Distribution Analysis
We first compared distributions of spindle characteristics obtained via the two approaches against expert-derived ground truth. This analysis was carried out using CNN-based models (1D U-Net and SlumberNet) and hybrid architectures with recurrent layers (SEED). The distributions are shown in Figure 7. For both model families, the segmentation-based approach produces distributions that more closely match expert annotations. By contrast, direct regression tends to generate overly smoothed (averaged) outputs. An exception is observed with SEED, where amplitude and frequency distributions remain relatively consistent across both approaches.
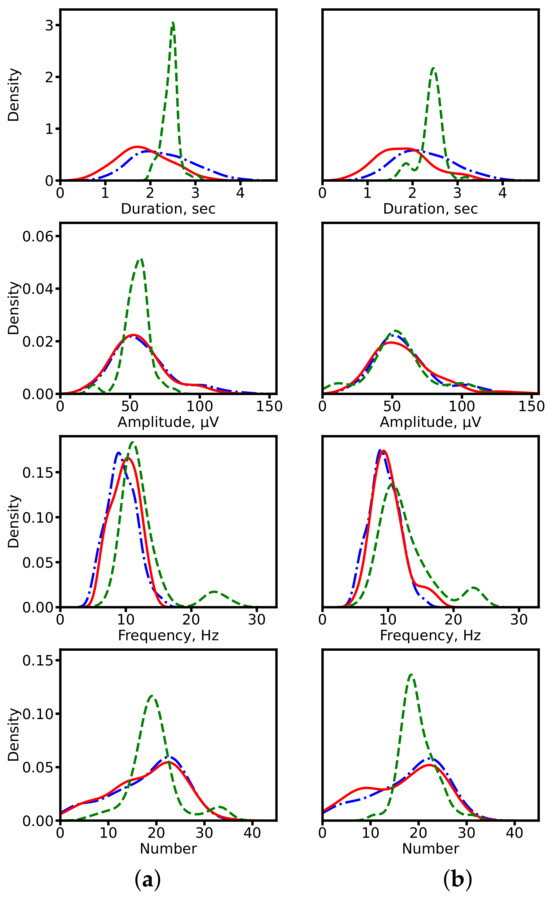
Figure 7.
Distributions of spindle characteristics on clinical data. (a) ResNet-based models (1D U-Net: segmentation-based; SlumberNet: segmentation-free). (b) Hybrid models with recurrent layers (SEED for both approaches). Blue dash-dotted line: expert annotations (ground truth). Red solid line: segmentation-based prediction. Green dashed line: segmentation-free prediction.
4.2.2. Prediction Accuracy
Scatter plots in Figure 8 illustrate the relationship between predicted and expert-calculated characteristics. Segmentation-based predictions cluster more closely around the diagonal (ideal match), while segmentation-free predictions show larger deviations, consistent with their averaging tendency.
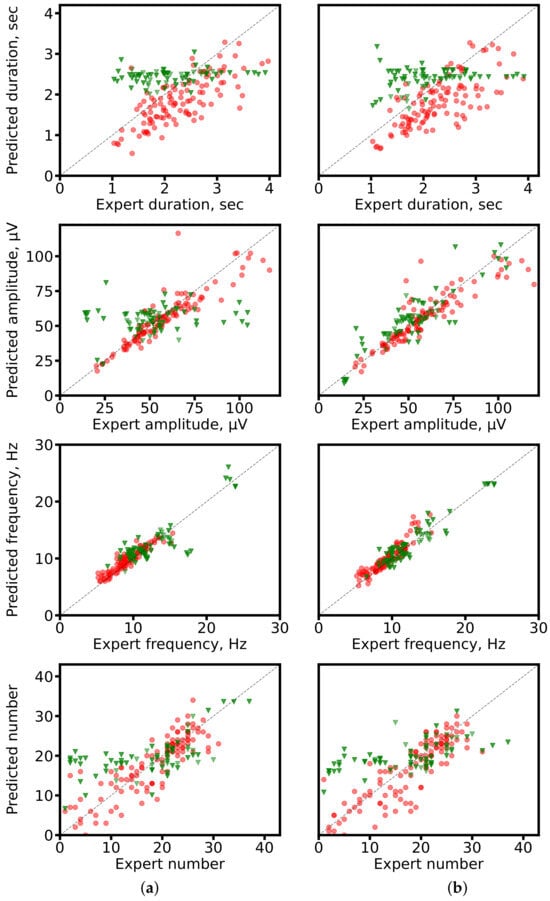
Figure 8.
Scatter plots of predicted vs. expert-derived spindle characteristics. (a) ResNet-based networks (1D U-Net: segmentation-based; SlumberNet: segmentation-free). (b) SEED for both approaches. Red circles: segmentation-based predictions; green triangles: segmentation-free predictions. The gray diagonal marks perfect agreement.
4.2.3. Error Analysis
We further quantified errors using the absolute relative error (ARE), defined as
where x is the expert-derived value and is the model-predicted value. Boxplots in Figure 9 show that segmentation-based approaches consistently achieve lower AREs. Statistical testing (paired t-test, ) confirmed the significance of these differences.
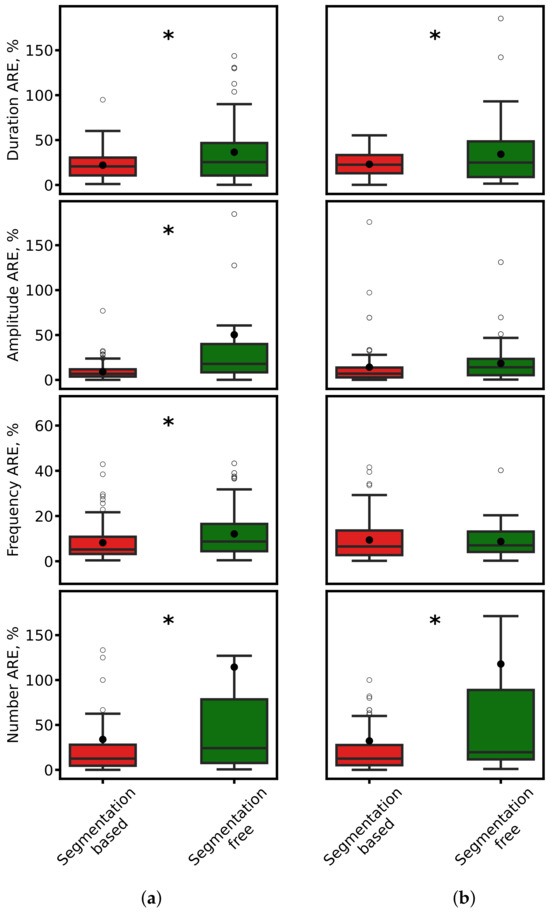
Figure 9.
Comparison of ARE for spindle duration, amplitude, frequency, and count. (a) ResNet-based models. (b) SEED. Red: segmentation-based predictions. Green: segmentation-free predictions. Black dots: mean values. Asterisks: significant differences ().
To better characterize error distributions, we also computed empirical cumulative distribution functions (ECDFs) of ARE (Figure 10). Segmentation-based methods consistently achieve higher fractions of predictions with low error, underscoring their robustness.
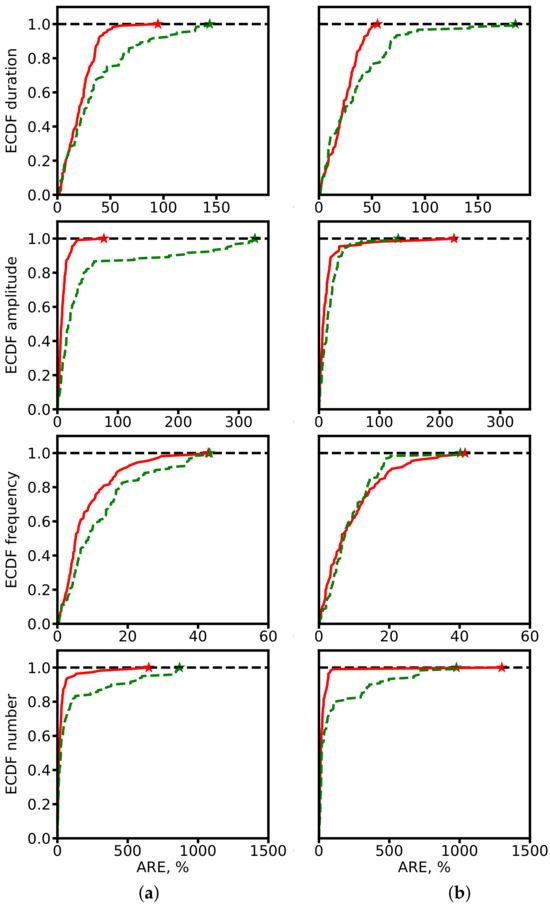
Figure 10.
ECDF of ARE for spindle characteristics. (a) ResNet-based models. (b) SEED. Red: segmentation-based predictions. Green: segmentation-free predictions. Star symbols mark the maximum ARE values at which ECDF reaches 1.
Overall, the segmentation-based approach outperforms segmentation-free regression. The explicit localization of events during segmentation enables more precise estimation of spindle properties. By contrast, direct regression without segmentation must implicitly infer event structure, often leading to information loss and characteristic averaging. These findings suggest that segmentation remains a critical step for accurate and clinically reliable characterization of sleep spindles.
4.3. Alterations in Sleep Spindle Properties in Established Epilepsy
We compared sleep spindle characteristics between patients with epilepsy and control subjects using expert annotations and the outputs of our 1D U-Net segmentation model, which demonstrated superior performance (highest F1-score). Representative examples of sleep spindles from both groups are shown in Figure 11, illustrating clear morphological alterations in the epileptic cohort.
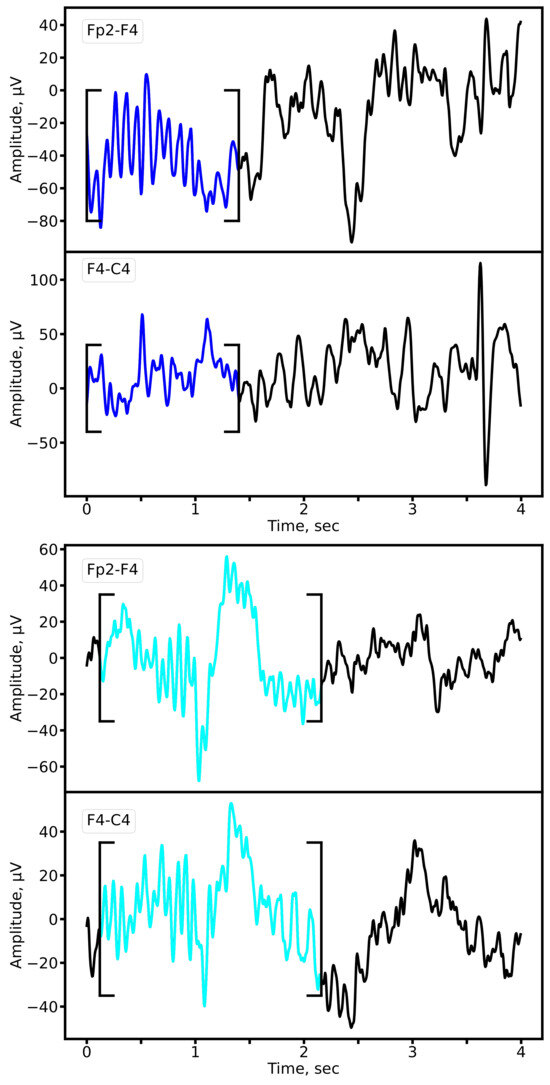
Figure 11.
Representative sleep spindles in the Fp2-F4 and F4-C4 derivations for a patient with epilepsy (upper panel) and a matched control subject (lower panel). Both examples are derived from EEG recordings of 8-year-old subjects from the primary school cohort. Cyan: prototypical spindle; Blue: pathological spindle observed in epilepsy.
Quantitative analysis revealed significant alterations in key spindle parameters in epilepsy. Figure 12 presents the distributions of spindle duration, amplitude, oscillatory frequency, count, and density. The most pronounced and statistically significant group differences were observed in spindle duration and density, a finding consistent across both expert annotations and model-derived segmentations (Mann-Whitney U test, * p * < 0.01 for both comparisons).
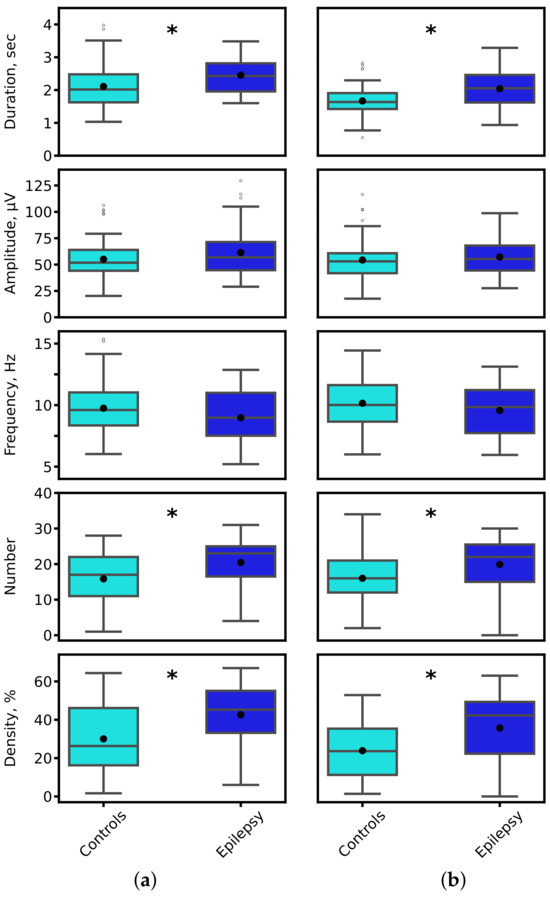
Figure 12.
Distribution of sleep spindle characteristics for control (cyan) and epilepsy (blue) groups. Parameters were derived from (a) expert-annotated (ground truth) and (b) 1D U-Net-predicted spindle segments. Black asterisks denote statistically significant inter-group differences (* p * < 0.01, Mann-Whitney U test).
To evaluate the separability of the two groups in a multivariate feature space, we employed a k-nearest neighbors (KNN) classifier. Spindle density was selected as a key integrative feature, as it encapsulates information on both spindle occurrence and duration. Figure 13 visualizes the decision boundaries generated by the KNN model in two feature subspaces. The analysis demonstrated high group separability, with classification accuracies of 82% (amplitude vs. density) and 85% (frequency vs. density), confirming that the identified alterations in spindle properties provide a robust electrophysiological signature of epilepsy.
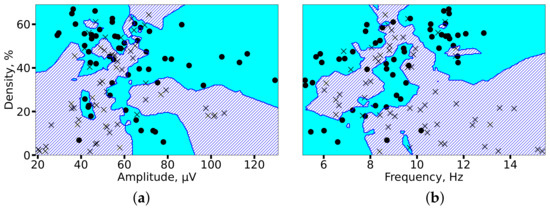
Figure 13.
KNN-based classification of 2 min EEG segments from controls (circles) and patients with epilepsy (crosses). Decision boundaries for each group are shaded in cyan (controls) and blue (epilepsy). High separability is achieved using feature pairs of (a) spindle amplitude and density, and (b) spindle frequency and density, with accuracies of 82% and 85%, respectively.
In summary, our results demonstrate that epilepsy is associated with significant and quantifiable alterations in sleep spindle morphology and incidence. The automated analysis of these features provides a robust biomarker that can reveal a detailed picture of thalamocortical dysfunction in epilepsy. This approach has strong potential to facilitate rapid diagnosis and guide targeted therapeutic strategies.
5. Discussion
This study provides the first rigorous evaluation of modern DNN architectures for detecting and characterizing sleep spindles in EEG recordings affected by epilepsy. We show that while both 1D U-Net and SEED achieve competitive overall performance (F1-scores), their precision–recall trade-offs differ markedly in the clinical setting. This highlights a key insight: model selection cannot rely solely on F1-scores but must be tailored to the clinical objective and tolerance for error type.
5.1. Clinical Model Selection Framework
Our results support a principled strategy for selecting models in clinical practice:
- High-Precision Option (e.g., SEED): Prioritizes minimizing false positives. This is advantageous in diagnostic contexts, where misclassifying epileptiform discharges or noise as spindles can corrupt biomarker quantification and lead to misleading conclusions. In this setting, SEED provides high confidence in detected spindles.
- High-Recall Option (e.g., 1D U-Net): Prioritizes capturing all true spindles, tolerating more false positives. This is valuable for screening or longitudinal monitoring, where the cost of missing altered spindle activity outweighs the burden of reviewing additional candidate events.
This framework empowers clinicians and researchers to select architectures not only based on accuracy but also in alignment with the clinical trade-off between false positives and false negatives.
5.2. Synthesis of Challenges and Contributions
Our work addresses two central challenges in automated sleep EEG analysis:
- Limited annotated clinical data. We mitigate this barrier by introducing a curated dataset of sleep spindles in pediatric epilepsy, showing that DNNs remain effective despite pathological spindle morphology. This resource provides a foundation for future model development and benchmarking in clinical populations.
- Building reliable clinical pipelines. We demonstrate and validate robust spindle segmentation as a key pipeline component. Automating this step reduces expert workload, improves reproducibility, and enables integration of spindle analysis into diagnostic and monitoring workflows.
The divergent performance of the models can be explained by their architectural inductive biases. CNNs such as the 1D U-Net specialize in capturing local patterns, which enhances sensitivity but risks false positives from events with similar local structure. In contrast, hybrid models like SEED leverage bidirectional recurrent layers to integrate long-range temporal dependencies, allowing better discrimination of true spindles from epileptiform discharges or other artifacts, thereby increasing precision.
5.3. Interpretability of the Models’ Outcomes
Although AI systems have repeatedly demonstrated their success in a wide variety of retrospective medical studies, relatively few AI tools have been implemented in medical practice. Critics point out that AI systems may be less useful in practice than retrospective data would suggest; the systems may be too slow or complex to be useful in real-world medical settings, or unforeseen complications may arise due to the way humans and AI interact.
The use of deep learning models in medical data analysis pipelines requires reliability, security, transparency and predictability of model outputs. Deep neural networks can be thought as a “blackboxes”, the outcomes of which are much less interpretable than, e.g., responces given by direct classical statistical and machine learning methods. Nevertheless, as the amount of data in a sample increases, these methods may yield less accuracy on given data. Furthermore, deep learning methods themselves find generalizable predictive patterns in the data. Currently, the application of classical direct statistical methods, machine learning, and deep learning is a subject of debate. Statistics requires the researcher to select a model that takes into account knowledge about the system, while deep neural networks require the selection of a predictive algorithm based on its empirical capabilities. The validity of a model usually depends on how adequately it captures the essence of the data. There are examples of the effective joint application of classical statistical and machine learning methods, such as the bootstrap method, which can be used for statistical inference but also serves as the basis for ensemble methods such as the Random Forest algorithm. The use of multilayer architectures (deep machine learning) significantly improves the accuracy of feature prediction in the datasets, which is usually confirmed by the calculation of prediction quality evaluation metrics. High prediction accuracy, in turn, significantly reduces the number of false predictions, demonstrating the effectiveness of deep machine learning methods in medical data analysis.
We additionally would like to emphasize that the proposed pipeline cannot replace the expert, but rather could serve as part of assisting recommendation system or service. If the answer given by the service is wrong, it can be adjusted directly by an expert. In this case subsequent feature calculations and analysis will be more accurate. Another possible approach that potentially can lead to more explainable and interpretable results is based on hypergraph feature creation and selection, which able to model complex relationships between multiple parameters.
5.4. The Critical Data Gap in Epilepsy Sleep Research
A persistent obstacle in this field is the lack of large-scale, annotated EEG datasets reflecting pathological sleep. Existing public archives, including DREAMS [38], CAP, St Vincent’s, and Kemp et al. [40] on PhysioNet, suffer from small size, limited electrode montages, low sampling rates, or a primary focus on conditions such as sleep apnea. The Montreal Archive of Sleep Studies (MASS) [42] remains a high-quality benchmark, but as it contains only healthy subjects, it is inadequate for studying spindle alterations in epilepsy. Even recent large-scale initiatives such as the Harvard EEG Database (HEEDB) [41] are not designed for spindle-specific research.
The gap extends to spindle annotations. Efforts such as MODA [50] have successfully generated large-scale labels, but these are again based on MASS recordings. Consequently, state-of-the-art models (e.g., DOSED [51], SpindleNet [36], RED-CWT [52], SpindleU-Net [46], and SUMO [53]) have been validated only on normal spindles. Their robustness to pathological morphologies, particularly those altered by epileptiform discharges, remained untested prior to this study. This limitation has slowed the clinical translation of powerful CNN, RNN, and hybrid architectures such as SEED [49] into epilepsy care.
To bridge this gap, we developed a unique database of annotated EEG from pediatric patients with epilepsy and matched controls during N2 sleep. This dataset enables systematic investigation of spindle alterations associated with epilepsy and serves as a benchmark for evaluating advanced DNNs under pathological conditions. Beyond advancing methodology, it provides a translational step toward clinically viable, automated spindle analysis in epilepsy.
6. Conclusions and Future Directions
This study demonstrates the efficacy of deep learning for identifying and analyzing alterations in sleep spindles within EEG recordings from patients with epilepsy. Through a structured investigation, we have established several key findings with significant implications for both neuroscience research and clinical diagnostics.
Our primary contribution is the creation of a novel, expert-annotated dataset of sleep spindles in a pediatric cohort with established epilepsy, addressing a critical gap in publicly available resources that predominantly feature data from healthy subjects. Utilizing this dataset, we rigorously benchmarked state-of-the-art DNN architectures, namely 1D U-Net and SEED, for spindle segmentation. We confirmed that while both models achieve competitive performance, they exhibit a crucial clinical trade-off: the 1D U-Net architecture favors high recall, maximizing the detection of true spindles, whereas the SEED model favors high precision, minimizing false positives. This distinction provides a principled framework for model selection based on specific clinical scenarios, moving beyond a sole reliance on the F1-score.
Furthermore, our analysis definitively established that an automated segmentation step is indispensable for the accurate quantification of spindle characteristics. By applying this optimized pipeline, we identified statistically significant alterations in key spindle parameters, including duration, number and density, in patients with epilepsy compared to matched controls. These quantifiable differences manifest as well-separable clusters in the feature space, confirming that DNN models can effectively capture the pathological signature of epilepsy embedded within sleep microarchitecture.
In summary, this work provides a robust foundation for using automated tools to extract reliable biomarkers from sleep EEG in epilepsy. The precision-recall trade-off we identified offers clinicians a flexible choice between a sensitive screening tool (high-recall model) and a specific diagnostic confirmatory tool (high-precision model).
Future Directions will build directly upon these findings:
- (i)
- Dataset Expansion: Curating a larger, multi-center dataset encompassing diverse epilepsy syndromes and age groups to enhance model generalizability and robustness.
- (ii)
- Clinical Translation: Developing real-time detection algorithms and integrating spindle analysis with other EEG biomarkers (e.g., slow waves, epileptiform discharges) into a unified clinical dashboard to aid diagnosis and monitor therapy response.
- (iii)
- Validation: The essential next step towards clinical implementation is a rigorous external validation of our models and proposed pipeline on a completely independent patient cohort to confirm their efficacy and reliability.
By elucidating the strengths and limitations of different DNN architectures, this study provides valuable guidance for researchers and clinicians, paving the way for advanced, automated tools that can reduce diagnostic latency and improve patient care in epilepsy.
Author Contributions
Conceptualization, A.V.L., L.A.S., T.A.L. and A.N.P.; methodology, N.V.G., A.A.S., A.D.G., A.V.L., A.E.M., S.A.G. and T.A.L.; software, N.V.G.; validation, A.A.S., A.D.G., A.V.L., S.A.G., L.A.S., T.A.L. and A.N.P.; investigation, N.V.G., A.V.L., S.A.G., T.A.L. and L.A.S.; data curation, N.V.G. and A.E.M.; writing—original draft preparation, N.V.G., A.V.L., T.A.L., L.A.S. and A.N.P.; writing—review and editing, A.V.L., T.A.L. and A.N.P.; visualization, N.V.G.; supervision, A.V.L., T.A.L., L.A.S. and A.N.P.; project administration, A.V.L. and T.A.L.; funding acquisition, L.A.S. All authors have read and agreed to the published version of the manuscript.
Funding
This work was supported by the Ministry of Economic Development the Russian Federation (grant No. 139-15-2025-004 dated 17 April 2025, agreement identifier 000000Ц313925P3X0002).
Institutional Review Board Statement
This study was conducted in accordance with the Declaration of Helsinki, and approved by the Ethics Committee of Lobachevsky University (protocol #102, date of approval 27 August 2025).
Informed Consent Statement
Written informed consent has been obtained from the participants to publish this paper.
Data Availability Statement
The data sets generated and/or analyzed during the current study are available from the corresponding authors on reasonable request.
Conflicts of Interest
Author A.A.S. and A.D.G. were employed by Genomed Ltd. The remaining authors declare that the research was conducted in the absence of any commercial or financial relationships that could be construed as a potential conflict of interest.
References
- Loomis, A.L.; Harvey, E.N.; Hobart, G. Potential rhythms of the cerebral cortex during sleep. Science 1935, 81, 597–598. [Google Scholar] [CrossRef]
- Fernandez, L.M.; Lüthi, A. Sleep spindles: Mechanisms and functions. Physiol. Rev. 2020, 100, 805–868. [Google Scholar] [CrossRef] [PubMed]
- Schönauer, M.; Pöhlchen, D. Sleep spindles. Curr. Biol. 2018, 28, R1129–R1130. [Google Scholar] [CrossRef] [PubMed]
- Schabus, M.; Hoedlmoser, K.; Pecherstorfer, T.; Anderer, P.; Gruber, G.; Parapatics, S.; Sauter, C.; Kloesch, G.; Klimesch, W.; Saletu, B.; et al. Interindividual sleep spindle differences and their relation to learning-related enhancements. Brain Res. 2008, 1191, 127–135. [Google Scholar] [CrossRef]
- Kumral, D.; Matzerath, A.; Leonhart, R.; Schönauer, M. Spindle-dependent memory consolidation in healthy adults: A meta-analysis. Neuropsychologia 2023, 189, 108661. [Google Scholar] [CrossRef]
- Staresina, B.P. Coupled sleep rhythms for memory consolidation. Trends Cogn. Sci. 2024, 28, 339–351. [Google Scholar] [CrossRef]
- Dehnavi, F.; Koo-Poeggel, P.C.; Ghorbani, M.; Marshall, L. Memory ability and retention performance relate differentially to sleep depth and spindle type. iScience 2023, 26, 108154. [Google Scholar] [CrossRef] [PubMed]
- Hahn, M.; Joechner, A.K.; Roell, J.; Schabus, M.; Heib, D.P.; Gruber, G.; Peigneux, P.; Hoedlmoser, K. Developmental changes of sleep spindles and their impact on sleep-dependent memory consolidation and general cognitive abilities: A longitudinal approach. Dev. Sci. 2019, 22, e12706. [Google Scholar] [CrossRef]
- Champetier, P.; André, C.; Weber, F.D.; Rehel, S.; Ourry, V.; Laniepce, A.; Lutz, A.; Bertran, F.; Cabé, N.; Pitel, A.L.; et al. Age-related changes in fast spindle clustering during non-rapid eye movement sleep and their relevance for memory consolidation. Sleep 2023, 46, zsac282. [Google Scholar] [CrossRef]
- Sheybani, L.; Frauscher, B.; Bernard, C.; Walker, M.C. Mechanistic insights into the interaction between epilepsy and sleep. Nat. Rev. Neurol. 2025, 21, 177–192. [Google Scholar] [CrossRef]
- Abdelaal, M.S.; Kato, T.; Natsubori, A.; Tanaka, K.F. Temporal and potential predictive relationships between sleep spindle density and spike-and-wave discharges. Eneuro 2024, 11, 1–16. [Google Scholar] [CrossRef] [PubMed]
- Hirsch, E.; French, J.; Scheffer, I.E.; Bogacz, A.; Alsaadi, T.; Sperling, M.R.; Abdulla, F.; Zuberi, S.M.; Trinka, E.; Specchio, N.; et al. ILAE definition of the idiopathic generalized epilepsy syndromes: Position statement by the ILAE task force on nosology and definitions. Epilepsia 2022, 63, 1475–1499. [Google Scholar] [CrossRef]
- Kramer, M.A.; Stoyell, S.M.; Chinappen, D.; Ostrowski, L.M.; Spencer, E.R.; Morgan, A.K.; Emerton, B.C.; Jing, J.; Westover, M.B.; Eden, U.T.; et al. Focal sleep spindle deficits reveal focal thalamocortical dysfunction and predict cognitive deficits in sleep activated developmental epilepsy. J. Neurosci. 2021, 41, 1816–1829. [Google Scholar] [CrossRef]
- Roebber, J.K.; Lewis, P.A.; Crunelli, V.; Navarrete, M.; Hamandi, K. Effects of anti-seizure medication on sleep spindles and slow waves in drug-resistant epilepsy. Brain Sci. 2022, 12, 1288. [Google Scholar] [CrossRef]
- Bernard, C.; Frauscher, B.; Gelinas, J.; Timofeev, I. Sleep, oscillations, and epilepsy. Epilepsia 2023, 64, S3–S12. [Google Scholar] [CrossRef] [PubMed]
- Gonzalez, C.; Jiang, X.; Gonzalez-Martinez, J.; Halgren, E. Human spindle variability. J. Neurosci. 2022, 42, 4517–4537. [Google Scholar] [CrossRef] [PubMed]
- Ujma, P.P. Sleep spindles and general cognitive ability—A meta-analysis. Sleep Spindl. Cortical States 2021, 2, 1–17. [Google Scholar] [CrossRef]
- Zou, C.; Wang, Z.; Xiao, K.; Hu, X.; Wu, D.; Luo, B.; Min, R. Plastic Optical Fiber with Spherical Lens Embedded in Mattress for Sleep Monitoring. IEEE Sens. J. 2025, 25, 17144–17152. [Google Scholar] [CrossRef]
- Bukhari, M.A.A.; Alghtani, M.A.M.; Aljohani, Z.; Qasem, A.; Alhazmi, I. Diagnosis and treatment of sleep disorders: A brief review. Int. J. Med. Dev. Ctries. 2021, 5, 364–369. [Google Scholar] [CrossRef]
- Huang, J.; Ren, L.; Feng, L.; Yang, F.; Yang, L.; Yan, K. AI empowered virtual reality integrated systems for sleep stage classification and quality enhancement. IEEE Trans. Neural Syst. Rehabil. Eng. 2022, 30, 1494–1503. [Google Scholar] [CrossRef]
- Redline, S.; Purcell, S.M. Sleep and Big Data: Harnessing data, technology, and analytics for monitoring sleep and improving diagnostics, prediction, and interventions—An era for Sleep-Omics? Sleep 2021, 44, zsab107. [Google Scholar] [CrossRef]
- Cay, G.; Ravichandran, V.; Sadhu, S.; Zisk, A.H.; Salisbury, A.L.; Solanki, D.; Mankodiya, K. Recent advancement in sleep technologies: A literature review on clinical standards, sensors, apps, and AI methods. IEEE Access 2022, 10, 104737–104756. [Google Scholar] [CrossRef]
- Al-Salman, W.; Li, Y.; Wen, P. Detecting sleep spindles in EEGs using wavelet fourier analysis and statistical features. Biomed. Signal Process. Control 2019, 48, 80–92. [Google Scholar] [CrossRef]
- Tsanas, A.; Clifford, G.D. Stage-independent, single lead EEG sleep spindle detection using the continuous wavelet transform and local weighted smoothing. Front. Hum. Neurosci. 2015, 9, 181. [Google Scholar] [CrossRef] [PubMed]
- Adamczyk, M.; Genzel, L.; Dresler, M.; Steiger, A.; Friess, E. Automatic sleep spindle detection and genetic influence estimation using continuous wavelet transform. Front. Hum. Neurosci. 2015, 9, 624. [Google Scholar] [CrossRef]
- Sitnikova, E.; Hramov, A.E.; Koronovsky, A.A.; van Luijtelaar, G. Sleep spindles and spike–wave discharges in EEG: Their generic features, similarities and distinctions disclosed with Fourier transform and continuous wavelet analysis. J. Neurosci. Methods 2009, 180, 304–316. [Google Scholar] [CrossRef] [PubMed]
- Zhuang, X.; Li, Y.; Peng, N. Enhanced automatic sleep spindle detection: A sliding window-based wavelet analysis and comparison using a proposal assessment method. Appl. Inform. 2016, 3, 11. [Google Scholar]
- Zhou, S.; Zhang, X.; Yu, Z. A sleep spindle detection algorithm based on SVM and WT. In Proceedings of the 2017 29th Chinese Control and Decision Conference (CCDC), Chongqing, China, 28–30 May 2017; pp. 2213–2217. [Google Scholar]
- Hekmatmanesh, A.; Mikaeili, M.; Sadeghniiat-Haghighi, K.; Wu, H.; Handroos, H.; Martinek, R.; Nazeran, H. Sleep spindle detection and prediction using a mixture of time series and chaotic features. Adv. Electr. Electron. Eng. 2017, 15, 435–447. [Google Scholar] [CrossRef]
- Duman, F.; Erdamar, A.; Erogul, O.; Telatar, Z.; Yetkin, S. Efficient sleep spindle detection algorithm with decision tree. Expert Syst. Appl. 2009, 36, 9980–9985. [Google Scholar] [CrossRef]
- Jiang, D.; Ma, Y.; Wang, Y. A robust two-stage sleep spindle detection approach using single-channel EEG. J. Neural Eng. 2021, 18, 026026. [Google Scholar] [CrossRef]
- Bhattacharyya, S.; Ghoshal, S.; Biswas, A.; Mukhopadhyay, J.; Majumdar, A.K.; Majumdar, B.; Mukherjee, S.; Singh, A.K. Automatic sleep spindle detection in raw EEG signal of newborn babies. In Proceedings of the 2011 3rd International Conference on Electronics Computer Technology, Kanyakumari, India, 8–10 April 2011; Volume 1, pp. 73–77. [Google Scholar]
- Wei, L.; Ventura, S.; Lowery, M.; Ryan, M.A.; Mathieson, S.; Boylan, G.B.; Mooney, C. Random forest-based algorithm for sleep spindle detection in infant EEG. In Proceedings of the 2020 42nd Annual International Conference of the IEEE Engineering in Medicine & Biology Society (EMBC), Montreal, QC, Canada, 20–24 July 2020; pp. 58–61. [Google Scholar]
- Wei, L.; Ventura, S.; Mathieson, S.; Boylan, G.B.; Lowery, M.; Mooney, C. Spindle-AI: Sleep spindle number and duration estimation in infant EEG. IEEE Trans. Biomed. Eng. 2021, 69, 465–474. [Google Scholar] [CrossRef]
- Yasuhara, N.; Natori, T.; Hayashi, M.; Aikawa, N. A study on automatic detection of sleep spindles using a long short-term memory network. In Proceedings of the 2019 IEEE 62nd International Midwest Symposium on Circuits and Systems (MWSCAS), Dallas, TX, USA, 4–7 August 2019; pp. 45–48. [Google Scholar]
- Kulkarni, P.M.; Xiao, Z.; Robinson, E.J.; Jami, A.S.; Zhang, J.; Zhou, H.; Henin, S.E.; Liu, A.A.; Osorio, R.S.; Wang, J.; et al. A deep learning approach for real-time detection of sleep spindles. J. Neural Eng. 2019, 16, 036004. [Google Scholar] [CrossRef] [PubMed]
- Tan, D.; Zhao, R.; Sun, J.; Qin, W. Sleep spindle detection using deep learning: A validation study based on crowdsourcing. In Proceedings of the 2015 37th Annual International Conference of the IEEE Engineering in Medicine and Biology Society (EMBC), Milan, Italy, 25–29 August 2015; pp. 2828–2831. [Google Scholar]
- Devuyst, S.; Dutoit, T.; Stenuit, P.; Kerkhofs, M. Automatic sleep spindles detection—overview and development of a standard proposal assessment method. In Proceedings of the 2011 Annual International Conference of the IEEE Engineering in Medicine and Biology Society, Boston, MA, USA, 30 August–3 September 2011; pp. 1713–1716. [Google Scholar]
- Quan, S.F.; Howard, B.V.; Iber, C.; Kiley, J.P.; Nieto, F.J.; O’Connor, G.T.; Rapoport, D.M.; Redline, S.; Robbins, J.; Samet, J.M.; et al. The sleep heart health study: Design, rationale, and methods. Sleep 1997, 20, 1077–1085. [Google Scholar] [CrossRef]
- Kemp, B.; Zwinderman, A.H.; Tuk, B.; Kamphuisen, H.A.; Oberye, J.J. Analysis of a sleep-dependent neuronal feedback loop: The slow-wave microcontinuity of the EEG. IEEE Trans. Biomed. Eng. 2000, 47, 1185–1194. [Google Scholar] [CrossRef]
- Sun, C.; Jing, J.; Turley, N.; Alcott, C.; Kang, W.Y.; Cole, A.J.; Goldenholz, D.M.; Lam, A.; Amorim, E.; Chu, C.; et al. Harvard Electroencephalography Database: A comprehensive clinical electroencephalographic resource from four Boston hospitals. Epilepsia 2025, 66, 3411–3425. [Google Scholar] [CrossRef]
- O’reilly, C.; Gosselin, N.; Carrier, J.; Nielsen, T. Montreal Archive of Sleep Studies: An open-access resource for instrument benchmarking and exploratory research. J. Sleep Res. 2014, 23, 628–635. [Google Scholar] [CrossRef]
- Coppieters’t Wallant, D.; Maquet, P.; Phillips, C. Sleep spindles as an electrographic element: Description and automatic detection methods. Neural Plast. 2016, 2016, 6783812. [Google Scholar] [CrossRef]
- Schiller, K.; Avigdor, T.; Abdallah, C.; Sziklas, V.; Crane, J.; Stefani, A.; Peter-Derex, L.; Frauscher, B. Focal epilepsy disrupts spindle structure and function. Sci. Rep. 2022, 12, 11137. [Google Scholar] [CrossRef]
- Bandarabadi, M.; Herrera, C.; Gent, T.; Bassetti, C.; Schindler, K.; Adamantidis, A. A role for spindles in the onset of rapid eye movement sleep. Nat. Commun. 2020, 11, 5247. [Google Scholar] [CrossRef] [PubMed]
- You, J.; Jiang, D.; Ma, Y.; Wang, Y. SpindleU-Net: An adaptive u-net framework for sleep spindle detection in single-channel EEG. IEEE Trans. Neural Syst. Rehabil. Eng. 2021, 29, 1614–1623. [Google Scholar] [CrossRef] [PubMed]
- Fraiwan, M.; Khasawneh, N. Visual identification of sleep spindles in EEG waveform images using deep learning object detection (YOLOv4 vs. YOLOX). Clust. Comput. 2024, 27, 13607–13620. [Google Scholar] [CrossRef]
- Jha, P.K.; Valekunja, U.K.; Reddy, A.B. SlumberNet: Deep learning classification of sleep stages using residual neural networks. Sci. Rep. 2024, 14, 4797. [Google Scholar] [CrossRef] [PubMed]
- Tapia-Rivas, N.I.; Estévez, P.A.; Cortes-Briones, J.A. A robust deep learning detector for sleep spindles and K-complexes: Towards population norms. Sci. Rep. 2024, 14, 263. [Google Scholar] [CrossRef]
- Lacourse, K.; Yetton, B.; Mednick, S.; Warby, S.C. Massive online data annotation, crowdsourcing to generate high quality sleep spindle annotations from EEG data. Sci. Data 2020, 7, 190. [Google Scholar] [CrossRef] [PubMed]
- Chambon, S.; Thorey, V.; Arnal, P.J.; Mignot, E.; Gramfort, A. DOSED: A deep learning approach to detect multiple sleep micro-events in EEG signal. J. Neurosci. Methods 2019, 321, 64–78. [Google Scholar] [CrossRef]
- Tapia, N.I.; Estévez, P.A. RED: Deep recurrent neural networks for sleep EEG event detection. In Proceedings of the 2020 International Joint Conference on Neural Networks (IJCNN), Glasgow, UK, 19–24 July 2020; pp. 1–8. [Google Scholar]
- Kaulen, L.; Schwabedal, J.T.; Schneider, J.; Ritter, P.; Bialonski, S. SUMO: Advanced sleep spindle identification with neural networks. arXiv 2022, arXiv:2202.05158. [Google Scholar]
Disclaimer/Publisher’s Note: The statements, opinions and data contained in all publications are solely those of the individual author(s) and contributor(s) and not of MDPI and/or the editor(s). MDPI and/or the editor(s) disclaim responsibility for any injury to people or property resulting from any ideas, methods, instructions or products referred to in the content. |
© 2025 by the authors. Licensee MDPI, Basel, Switzerland. This article is an open access article distributed under the terms and conditions of the Creative Commons Attribution (CC BY) license (https://creativecommons.org/licenses/by/4.0/).