Abstract
This paper investigates the relationship between cryptocurrencies and other financial assets, with a particular focus on the dynamics of information flow between developed and emerging markets. To achieve this objective, the study applies a combined methodology of spillover index analysis and network topology based on graph theory. The analysis covers key cryptocurrencies (Bitcoin and Ethereum), stocks, and conventional currencies over the period November 2017 to September 2022, and distinguishes between short-term and long-run dynamics. The empirical findings show that in the short run, Bitcoin and Ethereum predominantly act as net shock transmitters, whereas in the long run, stocks and conventional currencies, together with Bitcoin and Ethereum, become the principal conveyors of spillover shocks. The network topology analysis corroborates these results by revealing the centrality of these assets in the spillover structure. By integrating spillover and network approaches across different markets and time horizons, this study contributes to the literature by providing a more nuanced understanding of how cryptocurrencies interact with traditional financial assets under varying market conditions.
1. Introduction
In recent years there has been an emergence of the digital currency, particularly, cryptocurrency. Cryptocurrency is simply a digital currency where records of transactions are stored on a decentralised system with the use of cryptography. The largest cryptocurrency, Bitcoin, was launched in January 2009, however since its inception, hundreds of other cryptocurrencies have emerged, but with Bitcoin remaining the dominant digital currency. Although they were created as a means of transactional use, they have quickly turned into investment and trading vehicles to the point where investors and asset managers are using them for hedging and speculation purposes. For example, Bouri et al. (2017) analyse whether Bitcoin would be an effective hedge or be considered a safe haven before and after its crash of 2013. Urquhart and Platanakis (2020) investigate whether there are benefits to the addition of Bitcoin in a stock portfolio and conclude that adding Bitcoin to portfolios is beneficial owing to the substantially high risk-adjusted returns. Bouri et al. (2020) analyse downside movements in the S&P 500 and whether cryptocurrencies can provide adequate hedges against those downside periods and they find that Bitcoin, Ripple and Stellar are safe havens for all US equity indices while other cryptocurrencies are only safe havens in selected equity sectors.
Many studies focus on the possible linkages between digital currency market and other financial markets (Bhatnagr et al., 2025; Bellia & Calès, 2025; Corbet et al., 2018; Park et al., 2021; Li et al., 2023; Gubareva et al., 2023; Nekhili et al., 2023). For example, Park et al. (2021) analysed the information flow that occurs between different financial assets and Bitcoin with the use of transfer entropy and concluded that there exists a considerable flow of information between exchange rates and cryptocurrencies. Corbet et al. (2018) investigate the relationship between a few digital currencies, namely Bitcoin, Litecoin and Ripple with other markets like the bond market, the VIX and Gold, and found evidence of isolation of the cryptocurrencies from these other financial markets. (Nekhili et al., 2023) examine the interdependence in the time–frequency domain between liquidity measures of five major cryptocurrencies and seven major fiat currencies. The authors find that there is an increase in liquidity spillover at the peak of the COVID-19 pandemic, reflecting heightened uncertainty and market instability. Moreover, they find that at the peak of the pandemic, the total spillover index is stronger in the long run than the short run, highlighting a possible flight-to-liquidity during periods of stress.
Many of the above-mentioned studies investigated the relationship between cryptocurrencies and different financial assets, focusing mainly on developed economies. It may not be true that the findings ensuing from these studies, on the link between cryptocurrency and other assets, can be inferred to emerging market economies. It is important to note that markets in different stages of their life cycle may have inherently different attributes that need to be taken into consideration (see Mensah & Alagidede, 2017). In addition, the interlinkages between these markets have never been analysed in the context of the network analysis based on graph theory. Network analysis helps in identifying the most influential markets or nodes within the network or system in the context of this paper. Conducting such analysis will help to identify key markets, between digital and conventional markets, that have significant impacts on others due to their size, connectivity, or other factors. Understanding these key markets can be crucial for risk management and strategic planning. Thus, the contribution of this paper is threefold. Firstly, the paper will explore potential spillover or shock transmission between digital currencies, conventional currencies, and stock exchange markets, distinguishing between developed and emerging economies. This analysis will shed light on whether market linkages are influenced by the country’s development level, providing valuable insights for investors and policymakers, considering the differing financial and economic structures in these markets. The Diebold and Yilmaz (2012, 2014) spillover index will be utilised for this purpose. Secondly, the paper will examine whether the linkages and spillovers between digital currency, conventional currency, and stock exchange markets differ in the long term compared to the short term. This is vital for understanding the varying investment timelines and how they affect market relationships. Finally, the paper will enhance further the insight of interlinkage and connectivity between digital and conventional assets by assessing the topography and network structure of these assets based on graph theory.
The insights derived from examining the interlinkage between digital and conventional assets, as presented in this paper, offer substantial benefits for investors, asset managers, and policymakers. For investors, this paper’s findings enable them to strategically balance the high liquidity and volatility of cryptocurrencies with the stability of conventional assets. This approach can lead to improved portfolio diversification, potentially mitigating risks and enhancing returns across various time horizons. Asset managers can leverage the insights from this paper to thoughtfully expand their offerings, incorporating digital assets in response to increasing investor demand. Such a strategy ensures they remain competitive in a market that is constantly evolving. Policymakers, armed with a nuanced understanding of the dynamics between digital and conventional assets, are better positioned to foresee and address systemic risks that might emerge from the digital asset sector. This foresight is crucial in maintaining financial stability and developing a robust, well-informed regulatory framework for digital assets.
2. Literature Review
A number of different studies have analysed the linkages between different markets, be they the digital currency market, the stock market, the conventional currency market, or the bond market, on the link between cryptocurrency and financial assets. Naeem and Karim (2021) make use of the Time-Varying Optimal Copula (TVOC) to investigate the tail dependence between Bitcoin (BTC) and four green financial assets, namely, the Dow Jones Sustainability Index, S&P Global Clean Energy Index, ESG Leader Index and S&P Global Green Bonds. They found that while symmetric co-movement was shown by clean energy, there was a significant black-swan event that characterised dependence. They also found that there is diversification potential for clean energy when considering the higher hedge ratio for Bitcoin. Another study that investigates the dependence between cryptocurrency and financial markets using copulas is by Garcia-Jorcano and Benito (2020). They found that under normal market conditions Bitcoin may be used as a hedge for stock markets.
Elsayed et al. (2022) investigate the volatility and return connectedness between financial assets such as stocks, crude oil, gold, bonds and the USD, as well as global uncertainty measures and the VIX from April 2013 until June 2020. With the use of a Vector Autoregression Time-Varying Parameter model as well as network analyses and dynamic connectedness, they find that total spillover indices had reached considerable levels, as well as high volatility and return spillovers during the selected COVID-19 period across the different markets. Lahiani et al. (2021) investigate the relationship between digital currencies and stock market indices’ returns for some developed and the BRICS from 2016 until 2019. They found that the stock market indices, S&P 500, Nasdaq and DAX 30 all play a role in predicting stock market returns in developed and BRICS countries. Also, Ethereum was a lead predictor of other digital currencies and different stock markets and Bitcoin futures play a significant role in shaping the returns of the digital currencies and stock market index returns tail dependence and mean.
Zeng et al. (2020) also study the relationship from January 2012 to June 2019 between Bitcoin and conventional financial assets, namely stock (S&P), gold and oil. They use a method adopted from Diebold and Yilmaz (2009) in a vector autoregressive system that is used to investigate this dynamic interdependence. They find that this connectedness is weak, but by separating negative and positive Bitcoin returns, they find the existence of a spillover effect between Bitcoin and the conventional assets under consideration is asymmetric. They also conclude that the connectedness of positive Bitcoin returns is weaker than those of negative Bitcoin returns. Another study that also investigated the causal relationship between Bitcoin and different asset classes is by Bhuiyan et al. (2021). They employ a wavelet approach to understand the lead-lag relationship between Bitcoin and a number of other different asset classes like commodities, gold, stock and bond indices, and currencies. They considered data from January 2014 to November 2019. They conclude that the isolation of Bitcoin from their considered asset classes suggest that Bitcoin can offer diversification benefits to interested investors
Another study that considers the relationship between digital currencies and stock markets is (Ghorbel et al., 2024) with the use of a quantile regression approach he investigates the effect of Bitcoin prices during specific normal, bear, or bull markets on stock prices. However, instead of using specific country data, he uses data from the closing levels of the S&P Broad Market Indices (BMI). They conclude that the developed market indices are more positively related to realised variance proxy across the normal, bear and bull markets while the same holds true for bear markets in the emerging market indices, as opposed to being negatively correlated in the normal and bull markets.
The studies touched on above are but a small and refined section of the literature focused on the relationship between digital currencies and different financial assets. They considered different digital currencies and financial assets, different data periods and different methodologies. One such study is Yoon et al. (2019) who make use of a network spillover methodology to analyse the market connectedness among different stock markets, the bond market, currency and commodities, with data considered from December 1999 to June 2016. They find that the S&P 500 is the largest contributor to the return spillover shock of other stock markets. Furthermore, that different asset classes, such as bonds, currency, oil and gold, all reduce total spillover, which in turn offers a diversification benefit to asset managers. While this study considers the potential relationship between different asset markets, it does not consider digital currencies which have, in their own right, become quite a sizeable market. In addition, from the available literature we find, to our knowledge, that no study considers the return spillover connectedness among digital currencies, the stock market and conventional currencies, while at the same time considering an emerging economy versus a developed economy viewpoint. Also, we do not, to the best of our knowledge, find literature that considers this relationship but with different time horizons such as shorter-term return spillover connectedness and longer-term return spillover connectedness. The lack of available literature to provide these insights allows this analysis, therefore, to be undertaken.
3. Methodology
As previously discussed, we will employ the spillover index methodology, proposed by Diebold and Yilmaz (2012, 2014), and the network connectedness, based on graph theory, to assess the extent of cross-transmission of shocks between among digital currencies, the stock market and conventional currencies.
The spillover index finds its base on the dynamic Generalised Variance Decomposition (GVD), such that for a stationary defined as
where the parameter is the vector of endogenous variables, constitutes the autoregressive coefficient matrices, and finally, as usual, corresponds to the independent and identically distributed error vectors.
According to the Wold’s decomposition theorem, Equation (1) can be transformed in a moving average form, defined as:
where constitutes the autoregressive coefficient matrices. These coefficients may assist to define the magnitude of impulse response functions and generalised variance decomposition, defining the effects of specific shocks on the vector .
From Equation (2), Variable j’s contribution to variable i’s H-step-ahead generalised forecast error variance is expressed as
where denotes the variance matrix of (vector of errors), is an vector with 1 on the ith element or being zero otherwise, is the standard deviation in the jth equation of the error term. The details of the spillover index may be obtained by consulting Diebold and Yilmaz (2014).
From the adjacency matrix obtained from the Variable j’s contribution to the variable i’s H-step-ahead generalised forecast error variance, we construct a network graph or connectedness network with the nodes constituted of cryptocurrencies and different financial assets. Our network is weighted and directed, with the weight of the edges determined by the values of the Variable j’s contribution to the variable i’s H-step-ahead generalised forecast error variance. The paper will use some measures of the topography of this network, especially the eigenvector centrality, to determine the most influential nodes or markets among cryptocurrencies and other assets.
We use the Hodrick-Prescott (HP) filter to extract the trend (long-term) and cycle (short-term) components of the main series. It is worth mentioning that the HP filter uses the idea that a time series can be broken down into two components: a non-stationary long-run secular trend and a shorter-run stationary cyclical component. This equation is illustrated as follows:
With representing the long-run trend component and the short-term component.
The Hodrick-Prescott Filter extracts the different components with the use of a penalty, by solving the following:
where corresponds to the goodness of fit, and corresponds to the penalty incurred for deviations. Our lambda parameter, , is in control of the smoothing the created trend series namely . What this means is that as our lambda parameter tends to 0, , the trend component then approximates the actual time series, , while as our lambda parameter approaches infinity, , the trend component approaches linearity to converge to a solution of least squares. Our minimisation formula, Equation (5) aims to maximise the trend component of the time series or can be interpreted as minimising the cyclical component by ensuring that the trend components gradient is minimised.
4. Data, Estimation and Discussion of Results
4.1. Data
This paper aims to differentiate between the economies of emerging and developed countries when examining the cross-transmission of shocks or spillover between cryptocurrency and other financial markets. The choice of the USA as the representative developed country is clear-cut, given its status as the world’s largest and most significant economy. For the emerging economies, South Africa was selected based on its notable contribution to digital currencies as of July 2021, underscored by the index value of global cryptocurrency adoption per country1.
To evaluate the cross-transmission of shocks or spillover effects between cryptocurrency and other financial markets in both developed and emerging markets, we selected Bitcoin (BTC), Ethereum (ETH), and Ripple (XRP) as representatives of the cryptocurrency sector. These were chosen based on their market capitalization and potential for long-term real-world application. For the equity market, we used the All-Share Index (ALSI) for South Africa and the S&P 500 (SP500) for the United States, representing emerging and developed economies, respectively. In terms of currencies, the South African rand per US dollar (USDZAR) and the US Dollar Index (USDX) were selected for South Africa and the USA, respectively. The USDX reflects the USD’s value against a basket of currencies of major US trade partners. The daily data range for our analysis extends from November 2017 to September 2022, chosen based on data availability and the inception dates of various cryptocurrencies. All the variables are sourced from Thomson Reuters Eikon and Yahoo Finance. We calculate our returns as per the below, where is our return and is our price:
In further analysing the data, we turn to the descriptive statistics presented in Table 1. We note that among the digital currencies, only Bitcoin and Ethereum show positive average returns for the selected period, with Ethereum’s returns being marginally positive. In contrast, Ripple experienced negative average returns, which aligns with expectations considering its legal challenges with the U.S. Securities Exchange Commission (SEC)2. Additionally, we observe that all digital currencies have relatively high standard deviation. This reality reflects the well-known volatility characteristic of digital currencies.

Table 1.
Summary Statistics.
We then analyse the selected stock market indices and observe positive averages for both the ALSI and S&P 500 with the latter being higher. Finally, looking at the conventional currencies, we observe similar means but as one would expect we find higher maximums and lower minimums along with higher standard deviation for USDZAR compared to the USDX. Based on the p-values for the Jarque–Bera (J-B) test, we reject normality for all variables. We also consider the Augmented Dickey–Fuller (ADF) test to check for unit root, and we find that they all reject the null hypothesis of unit root, therefore confirm all series are stationary.
4.2. Empirical Results
4.2.1. Analysis of Spillover with Data at Level
In this section we investigate the return spillover connectedness index between cryptocurrency and other assets for variables at level, i.e., without decomposing them into trends and cycles. Table 2 presents the results of each variable (j) contribution to other variable (i)’s H-step-ahead generalised forecast error variance, obtained from a vector autoregressive (VAR) model of order 4. The order is determined based on Akaike Information Criteria (AIC). A look at Table 2 shows that BTC, for example, contributes 30.31% to the 1-step-ahead generalised forecast error variance for ETH. In comparison, it contributes 4.39% and 1.74% to the forecast error variance of ALSI and USDZAR, respectively.
Table 2.
South Africa Total Spillover Index.
Table 2 also reveals that BTC’s total spillover effect on all other variables in the VAR system is 53.98%, whereas ETH exhibits a higher total spillover of 64.58%. On the other hand, USDZAR shows the least total spillover effect, accounting for only 8.59%.
The findings in Table 2 indicate that within a VAR system comprising equity, conventional, and digital market returns, the most significant shock transmissions occur within digital markets. For instance, ETH contributes to 46.06% of BTC’s 1-step-ahead generalised forecast error variance and 24.70% to XRP’s. In contrast, its impact on conventional markets is minimal, contributing only 4.90% to ALSI and 2.77% to USDZAR.
In Table 3, we present the net-pairwise spillover index derived from Table 2’s results. This index quantifies the difference between the total shocks transmitted to and received from other variables. According to Table 3, Bitcoin and Ethereum emerge as net transmitters of shocks within the system, contributing 3.09% and 10.62%, respectively. In contrast, Ripple (the smallest digital currency), the ALSI stock market index, and the conventional currency USDZAR are net recipients of return spillover shocks, with figures of −3.53%, −6.42%, and −3.76%, respectively. Notably, Ethereum is the predominant shock transmitter, accounting for 10.62% of the return shocks in other markets.
Table 3.
South Africa Net-Pairwise Spillover Index.
We next examine the markets of the developed economy, specifically the USA, by detailing both the total spillover index and the net-pairwise spillover index in Table 4 and Table 5.
Table 4.
USA Total Spillover Index.
Table 5.
USA Net-Pairwise Spillover Index.
The results for the USA, a developed economy, mirror those of the emerging economy, with Bitcoin and Ethereum functioning as net transmitters of shocks, having net values of 4.56% and 11.60%, respectively. Conversely, Ripple, the S&P500 stock market index, and the conventional currency USDX are net recipients of return spillover shocks, with figures of −4.62%, −5.35%, and −6.19%, respectively. Notably, the S&P 500’s return spillover contribution of 17.53% to other market in the system, is substantially higher than that of the emerging economy’s stock market index, which is 11.09%. This finding indicates that the S&P 500 exerts a more significant influence in a system comprising digital currencies and the conventional currency. This greater impact aligns with the expected higher integration among various market types in a developed economy. This result is consistent with the findings of Horta et al. (2022), who show that the S&P 500 and other G7 indices exhibited increased integration with cryptocurrencies, particularly during the COVID-19 crisis, thereby suggesting stronger market convergence in periods of stress.
Until now, our analysis of return spillover has predominantly been static. To add a dynamic perspective, we have computed the time-varying total spillover index using a rolling window approach, and these results are graphically represented below. The dynamic spillover is calculated through forecast error variance decomposition, focusing on 1-step-ahead forecasts. For this analysis, the total spillover indices are estimated using a 200-day rolling window.
Figure 1 reveals a similar general trend in both the emerging and developed economies. Notably, for both regions, there is a significant variation during the 2020–2021 period, coinciding with the COVID-19 crisis. This pattern suggests that crises tend to amplify the total spillover across markets (Bonga-Bonga, 2017), a phenomenon evident in both emerging and developed economies. The heightened spillover during these periods implies a potential for contagion between these markets during global crises.
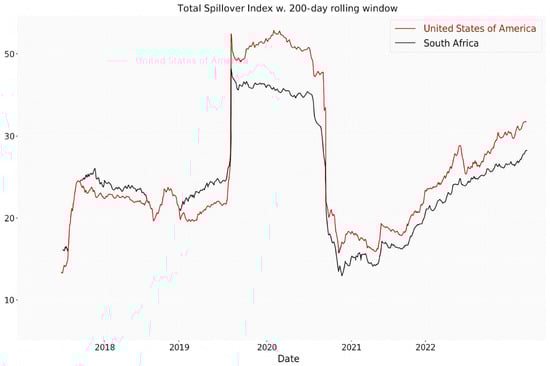
Figure 1.
Total dynamic Spillover index with 200-day rolling window.
4.2.2. Analysis of Spillover with Trend Component
In this section we analyse the spillover by decomposing the main series into trend and cycle components using Hodrick-Prescott filter to infer the characteristics of the spillover in the long and short terms, respectively. We follow Ravn and Uhlig (2002) to set the smooth parameter λ at .
Figure 2 illustrates the decomposition of Bitcoin, serving as an example for the analysis conducted on all series. This figure clearly demonstrates Bitcoin’s high volatility, evident in both its long-term trends and short-term movements. Notably, the short-term data shows a clustering effect, a characteristic commonly observed in high-frequency series.
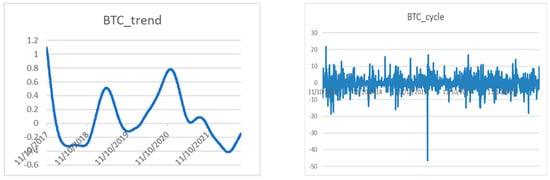
Figure 2.
Trend and cycle components of bitcoin (BTC).
Table 6 and Table 7 present the spillover index results for the trend component in the South African market. These results are in line with those observed in the level data. Ethereum (ETH) remains the primary transmitter of shocks within the system. Similarly, both major cryptocurrencies, ETH and BTC, are identified as net transmitters of shocks. In contrast, XRP, the ALSI stock market index, and USDZAR persist as net recipients of spillover shocks.
Table 6.
South Africa Trend Total Spillover Index.
Table 7.
South Africa Trend Net-Pairwise Spillover Index.
However, the situation is different for the trend components in the USA, as shown in Table 8 and Table 9. Alongside BTC and ETH, the S&P 500 and USDX also emerge as net transmitters of spillover shocks in a system comprising cryptocurrency, equity, and foreign exchange markets. This observation may be attributed to risk-averse investors who, seeking to avoid the high volatility of cryptocurrencies, turn to conventional markets like equities and conventional currencies for long-term investment. This shift could be the driving force behind these markets becoming net transmitters of shocks, a point that will be elaborated on below.
Table 8.
USA Trend Total Spillover Index.
Table 9.
USA Trend Net-Pairwise Spillover Index.
4.2.3. Analysis of Spillover with Cyclical Component
We now shift our focus to the cyclical component of the data, which offers a more nuanced, short-term perspective. This approach is particularly relevant for ‘rebalancing’ strategies employed by investors and asset managers, who often need to adjust portfolios based on shorter-term market fluctuations. Analysing the cyclical component helps in identifying more immediate, transient trends and shocks in the market, which are crucial for making timely investment decisions. The following section presents tables detailing both the total spillover and the net-pairwise spillover indices. These indices are instrumental in understanding the intensity and direction of market influences over shorter periods, thereby providing valuable insights for dynamic asset allocation and risk management strategies.
The findings from the cyclical components for both South Africa and the USA, as detailed in Table 10, Table 11, Table 12 and Table 13, are consistent with the level results. In these tables, BTC and ETH again emerge as the net transmitters of shocks, while the smaller cryptocurrency XRP, along with the equity and currency market returns, are identified as net recipients of spillover shocks. This pattern aligns with the findings of Bonga-Bonga and Mpoha (2024), who observed that return series at the level are predominantly influenced by short-term cycles spanning 2 to 4 days. The similar pattern observed between the return series at level and the cyclical component highlights a key insight: cyclical components often reflect the broader dynamics present in the main series or variables at the level.
Table 10.
South Africa Cycle Total Spillover Index.
Table 11.
South Africa Cycle Net-Pairwise Spillover Index.
Table 12.
USA Cycle Total Spillover Index.
Table 13.
USA Cycle Net-Pairwise Spillover Index.
These findings carry significant implications for asset managers in the context of optimal portfolio allocation. The interconnectedness revealed in long-term analysis should guide asset managers in implementing ‘buy-and-hold’ strategies. This approach leverages the insights gained from long-term market trends and relationships, enabling informed decisions about which assets to retain over extended periods. On the other hand, the insights derived from short-term analysis are crucial for initial asset allocation when adopting portfolio rebalancing strategies. Short-term analysis provides a more immediate view of market dynamics, offering critical information on potential short-term fluctuations. This knowledge is essential for asset managers to adjust their portfolios proactively, ensuring they remain aligned with the ever-changing market conditions and risk profiles. Hence, integrating both long-term and short-term analytical perspectives is key to achieving a balanced and responsive asset management approach.
4.2.4. Network Analysis
The analysis of shock spillover among cryptocurrencies, conventional currencies, and equity market returns can be effectively conducted using network analysis, with graph theory serving as its foundational methodology. The objective of this section is to evaluate the network topology in both long- and short-term spillover scenarios for South Africa and the USA. As previously mentioned, the nodes in our network represent the returns of each asset, while the edges correspond to each asset’s contribution to the 1-step-ahead generalised forecast error variance (shock spillover) of other assets. Key topological attributes to be examined include eigenvector centrality, betweenness, and the community characteristics of the network. This approach will enable a comprehensive assessment of the interconnectedness and influence dynamics of these assets within the financial markets.
Eigenvector centrality measures a node’s influence within a network, identifying nodes that are not only well-connected but also connected to other significant nodes. This metric recognises that a node’s centrality is enhanced not merely by having numerous connections, but by being linked to other highly central nodes as well. In our analysis, we will apply eigenvector centrality to determine and rank the most influential assets among cryptocurrencies, conventional currencies, and equities within the system or network. This will allow us to understand which assets play pivotal roles in the network’s dynamics and how their interconnectedness impacts the overall system.
The betweenness centrality measure will be used to quantify the importance of a node based on its position within the overall network structure. It differs from other centrality measures by focusing on the role of a node as a connector or bridge between different parts of the network. It reflects how often a node acts as a bridge along the shortest path between two other nodes. It is important to note that the identification of a node with high betweenness centrality is vital for information flow and market insight. In fact, asset with high betweenness centrality could assist asset managers to use this information to predict market movements or identify key assets that might act as early indicators of market shifts, given its intrinsic connection with other assets.
In network analysis, a “community” refers to a group of nodes that are more densely connected to each other than to other nodes in the network. Communities are characterised by a high number of links between the members of the community compared to links with nodes outside of the community. This means that nodes within a community tend to interact more frequently or intensely with each other than with nodes outside of it.
Figure 3 and Figure 4 visually represent the network structures for South Africa and the USA, respectively, as previously described. In these network diagrams, communities are distinguished by the colours of the nodes, meaning nodes sharing the same colour belong to the same community. Additionally, the thickness of the edges in these networks is indicative of the strength of the relationship or the magnitude of shock spillover between two nodes. This visual representation aids in understanding the extent of interconnectedness and the intensity of spillover effects within each network, providing a clear depiction of how assets within the same community influence each other.
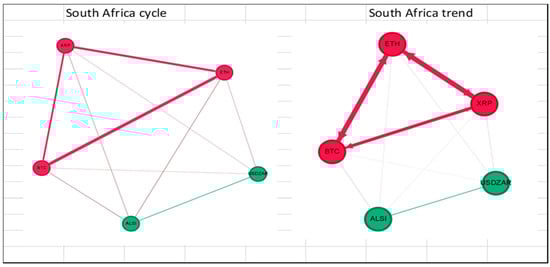
Figure 3.
Network structure of shock spillovers over short and long terms in South Africa.
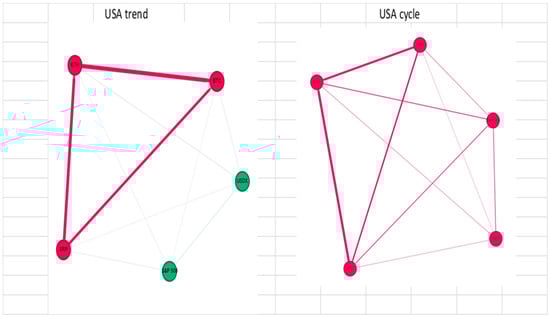
Figure 4.
Network structure of shock spillovers over short and long terms in USA.
The network analysis displayed in Figure 3 reveals that, in South Africa, the network is bifurcated into two main communities, consistent across both short and long-term perspectives. Notably, cryptocurrencies form a distinct group, indicating more frequent and intense interactions among themselves. Several factors may explain this phenomenon. Firstly, cryptocurrencies operate within a relatively isolated digital ecosystem. As Bonga-Bonga (2017) notes, unlike conventional assets, which are deeply integrated into the global financial system, cryptocurrencies primarily interact within their specialised markets. This self-contained environment fosters more interactions among cryptocurrencies compared to conventional assets. Secondly, the frequent interactions between cryptocurrencies can also be attributed to a shared investor base. The decentralised nature of cryptocurrency attracts investors who are knowledgeable about blockchain technology. These investors tend to switch between different cryptocurrencies more frequently, influencing price movements within this asset class. Lastly, the cryptocurrency market is largely speculative. This characteristic means that fluctuations in one cryptocurrency can significantly affect others. Traders and investors, in attempting to capitalise on anticipated market trends, often move funds between different cryptocurrencies, thereby creating interconnected price movements. Such speculative behaviour intensifies the interconnectedness within the cryptocurrency community, as observed in the South African market network.
Figure 4 illustrates a notable difference in the network structure of cryptocurrencies, conventional currencies, and equity assets between long-term (trend component) and short-term analyses in the USA. In the long-term, the network is split into two distinct communities. However, in the short-term analysis, these assets appear to converge into a single community, suggesting a potential integration of cryptocurrency, conventional currency, and equity markets in the short term. This convergence might be largely attributed to rapid advancements in technology, particularly in blockchain and fintech, within developed economies. These technological developments have significantly enhanced transaction efficiency, security, and introduced innovative methods for transferring and storing value across different asset classes.
Yet, it is important to consider the inherent volatility of cryptocurrencies. This volatility frequently deters risk-averse investors, who generally lean towards the relative stability of conventional currency and equity markets for long-term investments, as witnessed in Figure 4. As a result, while short-term market integration mirrors technological advancements and dynamic market conditions, long-term investment choices are still predominantly influenced by conventional risk assessments. This risk assessment leads to market segmentation into two distinct communities over the long term, a division fuelled by the contrasting investment preferences of risk-averse and risk-seeking investors. The former relies in conventional assets in the long-term and the latter maintains their investments in cryptocurrencies, even over extended periods.
Additionally, the observed interaction and community dynamics between equity and conventional currency markets observed in Figure 3 and Figure 4 is well-documented. For instance, research by Bonga-Bonga and Hoveni (2013) showed that portfolio flows into local equity markets can significantly affect the demand for the respective currency, impacting the foreign exchange market, and vice versa.
Table 14 and Table 15 present the eigenvector and betweenness centralities from the network analysis depicted in Figure 4 and Figure 5. According to the results in Table 14, Ethereum (ETH) emerges as the most influential asset within the network, which comprises cryptocurrencies, conventional currencies, and equities. This prominence may be due to its connections with other significant assets in the network. The results also indicate that conventional currencies and equities exert a diminishing influence, ranging from minimal in the short term to virtually non-existent in the long term. ETH’s dominant role is likely attributed to its multifaceted interactions. It not only engages with other cryptocurrencies, as previously mentioned, but also interfaces with equities, functioning as a payment method for shares and other assets. Furthermore, its interactions with conventional currencies are notable, as ETH can be purchased with fiat money and potentially competes with it as a store of value.
Table 14.
Eigenvector centrality of the three types of assets in the short and long terms.
Table 15.
Betweenness centrality of the three types of assets in the short and long terms.
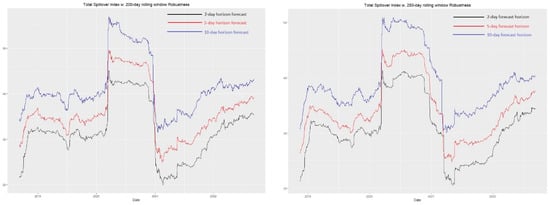
Figure 5.
Dynamics of spillover index with different horizons and window size for South Africa.
Table 15 presents the betweenness centrality findings for the three types of assets, emphasising their network roles. Notably, Ethereum (ETH) demonstrates the highest betweenness centrality in the short term, both in the USA and South Africa. This underscores ETH’s critical role as a connector or bridge between different assets. For instance, rather than using fiat money or conventional currency directly to purchase equities, investors might exchange fiat money for ETH (cryptocurrency) to buy shares in the equity market.
Despite ETH’s short-term significance, the findings from Table 15 indicate that no asset consistently serves as a bridge across the network in the long term. This finding is consistent with the identified asset segmentation, where assets tend to form isolated groups, a trend that becomes more pronounced in the long term. The increasing division into separate communities, evident in both developed and emerging markets over the long term, is likely influenced by the diverse risk tolerances of investors. Those averse to risk generally refrain from holding volatile assets, such as cryptocurrencies, for extended periods.
4.3. Robustness Tests
To verify the robustness of our findings, particularly regarding the spillover index, we implemented two approaches. Firstly, we varied the forecast horizons, examining two, five, and ten-day periods. Secondly, we used different rolling windows while keeping the forecast horizon fixed, specifically analysing 200- and 250-day periods. The results for both approaches, displayed in Figure 5 and Figure 6, consistently show a similar pattern across both countries. Notably, there is an increasing trend in total spillovers at the onset of COVID-19, aligning with our previous discussion.
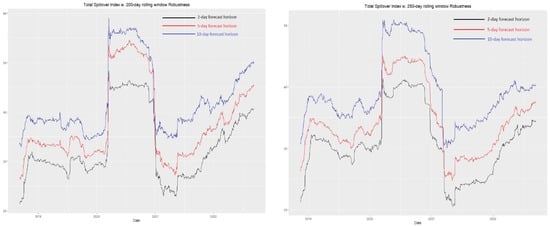
Figure 6.
Dynamics of spillover index with different horizons and window size for the USA.
These findings corroborate the notion of contagion among different assets and markets within the network. They are in agreement with the conclusions of), (Hernandez et al., 2021) and Antonakakis and Kizys (2015), who all found that the total spillovers between selected markets are comparable, irrespective of the size of the rolling window or the forecast horizon used. This consistency across various scenarios further validates our results.
5. Conclusions
This paper investigated the spillover and return connectedness between the cryptocurrency, conventional currency and equity markets in the long and short terms, distinguishing between developed and emerging economies. South Africa and the USA represented emerging and developed economies, respectively. This investigation is based on the spillover index introduced by Diebold and Yilmaz (2014). Moreover, the paper constructed and analysed the network’s topography derived from the spillover shocks. This network’s characteristics and topography were analysed based on graph theory. The results of the empirical analysis show that for the spillover index of the cycle components or short-term span for South Africa and the USA, two cryptocurrencies, namely Ethereum and Bitcoin, are the net transmitters of shocks compared to Ripple, and the stock and the currency markets in the two economies. However, the results of the long-term components show that in the case of the USA, in addition to Bitcoin and Ethereum, as cryptocurrency assets, the stock and conventional currency assets are the net transmitters of spillover shocks in a system constituted of cryptocurrency, equity and foreign exchange markets. The paper attributes this finding to the fact that risk-averse investors, when avoiding highly volatile assets such as cryptocurrency, will shift to conventional assets such as conventional currency and equity assets, providing impetus for these assets for long-term investment.
Furthermore, the analysis of the USA’s network structure for cryptocurrency, conventional currency, and equity assets reveals distinct patterns over different time frames. In the long-term (trend component), the network is split into two separate communities. However, in the short term, these assets merge into a single community, suggesting a short-term integration of cryptocurrency, conventional currency, and equity assets. This short-term integration should be attributed primarily to rapid advancements in blockchain and fintech within developed economies. These technological innovations enhance transaction efficiency and provide new methods for value transfer and storage across various asset types. Conversely, the long-term scenario is shaped by the volatility of cryptocurrencies. This volatility tends to deter risk-averse investors, who prefer the relative stability of conventional assets like currency and equity for their long-term investments. This preference for stability in the long term leads to a segmented market structure, characterised by two distinct communities. This difference in market dynamics over short and long terms highlights the evolving nature of these financial assets in response to both technological advancements and investor behaviour.
The network analysis presented in this paper reinforces earlier findings, particularly highlighting Ethereum’s significant role in the financial networks of both South Africa and the USA, especially in the short term. Ethereum is identified as having high betweenness centrality, meaning it functions as a crucial connector or bridge among various assets within these networks. Its high betweenness centrality in the short term indicates that Ethereum often acts as a key intermediary along the shortest paths between two other nodes in the network. This positioning of Ethereum underscores its importance in facilitating interactions and transactions between different types of assets. By acting as a bridge, Ethereum not only links diverse financial instruments but also potentially influences the flow and distribution of financial information and resources within these networks. This central role, particularly in the short term, highlights Ethereum’s influence in the rapidly evolving landscape of financial markets, where cryptocurrencies are increasingly interacting with conventional asset classes.
The paper’s results offer valuable guidance to investors and asset managers in constructing efficient and diversified portfolios across the three principal asset classes: cryptocurrencies, conventional currencies, and equities. This guidance is tailored to the duration of asset holding and the specific markets or economies where investments are made. For long-term investment strategies, such as buy-and-hold, the findings from the long-term analysis are particularly relevant. These insights can help asset managers understand how different asset classes interact over extended periods, enabling them to make informed decisions about stable and potentially less volatile investments that align with long-term investment goals. Conversely, the results from the short-term analysis are crucial for strategies like portfolio rebalancing, where assets are frequently adjusted and reallocated. This analysis provides insights into the dynamic interactions between asset classes in the short term, offering guidance on initial portfolio allocations and how to respond to rapid market changes.
Understanding the distinct behaviours of these asset classes in different time frames and market conditions allows for more informed investment decisions, whether for immediate portfolio adjustments or for setting up long-term, stable investments. These strategies can be further tailored based on the specific characteristics of the markets or economies in which the investments are made, maximising portfolio efficiency and diversification.
Although the findings of this paper provide valuable insights for both investors and policymakers, we acknowledge a key limitation: the use of the USA and South Africa as proxies for developed and emerging economies, respectively. The results may not be fully generalisable, as outcomes could differ for other countries within the same categories. For future studies, we propose expanding the sample to multiple emerging and developed markets, adding asset classes such as commodities and sovereign bonds, and employing alternative or complementary methodologies related to the connectedness approach.
Data and codes used will be provided on request.
Author Contributions
Conceptualization, L.B.-B. and M.K.; Methodology, L.B.-B.; Software. M.K.; Formal analysis, L.B.-B. and M.K.; Investigation, M.K.; Data curation, M.K.; Writing—original draft preparation, L.B.-B.; Writing—review and editing L.B.-B. and M.K.; Visualization, M.K.; Project administration, L.B.-B.; All authors have read and agreed to the published version of the manuscript.
Funding
No funding received related to this paper.
Institutional Review Board Statement
Not applicable.
Informed Consent Statement
Not applicable.
Data Availability Statement
The raw data supporting the conclusions of this article will be made available by the authors on request.
Conflicts of Interest
There is no conflict of interest related to this paper from the authors.
Notes
| 1 | |
| 2 | See https://www.investopedia.com/sec-vs-ripple-6743752 (accessed on 24 April 2025) for details. |
References
- Antonakakis, N., & Kizys, R. (2015). Dynamic spillovers between commodity and currency markets. International Review of Financial Analysis, 41, 303–319. [Google Scholar] [CrossRef]
- Bellia, M., & Calès, L. (2025). Bank profitability and central bank digital currency. Journal of International Financial Markets, Institutions and Money, 99, 102105. [Google Scholar] [CrossRef]
- Bhatnagr, P., Rajesh, A., & Misra, R. (2025). The impact of Fintech innovations on digital currency adoption: A blockchain-based study in India. International Journal of Accounting & Information Management, 33(2), 313–333. [Google Scholar]
- Bhuiyan, R. A., Husain, A., & Zhang, C. (2021). A wavelet approach for causal relationship between bitcoin and conventional asset classes. Resources Policy, 71(1), 101971. [Google Scholar] [CrossRef]
- Bonga-Bonga, L. (2017). Assessing the readiness of the BRICS grouping for mutually beneficial financial integration. Review of Development Economics, 21(4), e204–e219. [Google Scholar] [CrossRef]
- Bonga-Bonga, L., & Hoveni, J. (2013). Volatility spillovers between the equity market and foreign exchange market in South Africa in the 1995–2010 period. South African Journal of Economics, 81(2), 260–274. [Google Scholar] [CrossRef]
- Bonga-Bonga, L., & Mpoha, S. (2024). Spillover effects from China and the United States to key regional emerging markets: A dynamic analysis. International Review of Financial Analysis, 91, 103015. [Google Scholar] [CrossRef]
- Bouri, E., Balcilar, M., Gupta, R., & Roubaud, D. (2017). Can volume predict bitcoin returns and volatility? A quantiles-based approach. Economic Modelling, 64, 74–81. [Google Scholar] [CrossRef]
- Bouri, E., Lucey, B., & Roubaud, D. (2020). Cryptocurrencies and the downside risk in equity investments. Finance Research Letters, 33, 101211. [Google Scholar] [CrossRef]
- Corbet, S., Meegan, A., Larkin, C., Lucey, B., & Yarovaya, L. (2018). Exploring the dynamic relationships between cryptocurrencies and other financial assets. Economics Letters, 165, 28–34. [Google Scholar] [CrossRef]
- Diebold, F. X., & Yilmaz, K. (2009). Measuring financial asset return and volatility spillovers, with application to global equity markets. The Economic Journal, 119(534), 158–171. [Google Scholar] [CrossRef]
- Diebold, F. X., & Yilmaz, K. (2012). Better to give than to receive: Predictive directional measurement of volatility spillovers. International Journal of Forecasting, 28(1), 57–66. [Google Scholar] [CrossRef]
- Diebold, F. X., & Yilmaz, K. (2014). On the network topology of variance decompositions: Measuring the connectedness of financial firms. Journal of Econometrics, 182, 119–134. [Google Scholar] [CrossRef]
- Elsayed, A. H., Gozgor, G., & Lau, C. K. M. (2022). Risk transmissions between bitcoin and conventional financial assets during the COVID-19 era: The role of global uncertainties. International Review of Financial Analysis, 81, 102069. [Google Scholar] [CrossRef]
- Garcia-Jorcano, L., & Benito, S. (2020). Studying the properties of the Bitcoin as a diversifying and hedging asset through a copula analysis: Constant and time-varying. Research in International Business and Finance, 54, 101300. [Google Scholar] [CrossRef]
- Ghorbel, A., Loukil, S., & Bahloul, W. (2024). Connectedness between cryptocurrencies, gold and stock markets in the presence of the COVID-19 pandemic. European Journal of Management and Business Economics, 33(4), 466–487. [Google Scholar] [CrossRef]
- Gubareva, M., Bossman, A., & Teplova, T. (2023). Stablecoins as the cornerstone in the linkage between the digital and conventional financial markets. The North American Journal of Economics and Finance, 68, 101979. [Google Scholar] [CrossRef]
- Hernandez, J. A., Kang, S. H., & Yoon, S. M. (2021). Spillovers and portfolio optimization of agricultural commodity and global equity markets. Applied Economics, 53(12), 1326–1341. [Google Scholar] [CrossRef]
- Horta, N., Dias, R., Revez, C., Alexandre, P., & Heliodoro, P. (2022). Cryptocurrencies and G7 capital markets integrate in periods of extreme volatility? Journal of Process Management and New Technologies, 10(3–4), 121–130. [Google Scholar] [CrossRef]
- Lahiani, A., Jeribi, A., & Jlassi, N. B. (2021). Nonlinear tail dependence in cryptocurrency-stock market returns: The role of Bitcoin futures. Research in International Business and Finance, 56, 101351. [Google Scholar] [CrossRef]
- Li, Z., Mo, B., & Nie, H. (2023). Time and frequency dynamic connectedness between cryptocurrencies and financial assets in China. International Review of Economics & Finance, 86, 46–57. [Google Scholar] [CrossRef]
- Mensah, J. O., & Alagidede, P. (2017). How are Africa’s emerging stock markets related to advanced markets? Evidence from copulas. Economic Modelling, 60, 1–10. [Google Scholar] [CrossRef]
- Naeem, M. A., & Karim, S. (2021). Tail Dependence between bitcoin and green financial assets. Economics Letters, 208, 110068. [Google Scholar] [CrossRef]
- Nekhili, R., Sultan, J., & Bouri, E. (2023). Liquidity spillovers between cryptocurrency and foreign exchange markets. The North American Journal of Economics and Finance, 68, 101969. [Google Scholar] [CrossRef]
- Park, S., Jang, K., & Yang, J. (2021). Information flow between bitcoin and other financial assets. Physica A, 566, 125604. [Google Scholar] [CrossRef]
- Ravn, M. O., & Uhlig, H. (2002). On adjusting the Hodrick–Prescott filter for the frequency of observations. Review of Economics and Statistics, 84, 371–376. [Google Scholar] [CrossRef]
- Urquhart, A., & Platanakis, E. (2020). Should investors include bitcoin in their portfolios? A portfolio theory approach. The British Accounting Review, 52(4), 100837. [Google Scholar] [CrossRef]
- Yoon, S., Mamun, A., Uddin, G. S., & Kang, S. H. (2019). Network connectedness and net spillover between financial and commodity markets. The North American Journal of Economics and Finance, 48, 801–818. [Google Scholar] [CrossRef]
- Zeng, T., Yang, M., & Shen, Y. (2020). Fancy Bitcoin and conventional financial assets: Measuring market integration based on connectedness networks. Economic Modelling, 90, 209–220. [Google Scholar] [CrossRef]


Disclaimer/Publisher’s Note: The statements, opinions and data contained in all publications are solely those of the individual author(s) and contributor(s) and not of MDPI and/or the editor(s). MDPI and/or the editor(s) disclaim responsibility for any injury to people or property resulting from any ideas, methods, instructions or products referred to in the content. |
© 2025 by the authors. Licensee MDPI, Basel, Switzerland. This article is an open access article distributed under the terms and conditions of the Creative Commons Attribution (CC BY) license (https://creativecommons.org/licenses/by/4.0/).