Abstract
This study analyzes the relationship between the degrees of resemblance and distances between dialects based on several dialectological atlases. This analysis investigates various correspondence data with respect to total valid data in setting reference places and comparison places. The degree of correspondence (DC) can be calculated by quantifying the degree of resemblance. I adopt a great-circular distance for the distance between the source and a comparison place. It is possible to graph the data with distances and DCs along the X and Y axes, respectively. The analysis yields five main results. (1) DC has an inverse relationship with distance in most places, here called the main sequence. However, there are exceptional places called peculiar groups. (2) One of the peculiar groups was caused by in-migration. (3) Another peculiar group is found on islands having very narrow land areas divided by the sea. (4) The main sequence can be classified into two types of linguistic classes. The grammatical data show a stepping slope instead of a gentle slope in the lexical data. (5) The main sequence shows a precise linear relationship over a narrow area.
1. Introduction
How do the resemblances of dialects relate to the distances between the places they are spoken? Do they have the same nature apart from the difference in location? Are there differences in this respect between lexicon and grammar?
This study analyzes the relationships between the resemblances of dialects and the distances between them using various dialectological atlases. Their relationships show similar characteristics in most places, excepting a few regions. The figures for the relationships appearing on the graphs differ by linguistic class and the width of the investigating area. In this paper, I show the common and peculiar characteristics of dialectal distributions.
2. Data Sources and Materials
This analysis investigates various data on correspondences and valid data in setting reference places and comparison places.
The Linguistic Atlas of Japan (LAJ: ) and the Grammar Atlas of Japanese Dialects (GAJ: ) are used for data over a wide area, and the Kamiina-no Hogen () is used for data over a narrow area.
The LAJ consists of six volumes including 300 maps that were published between 1966 and 1974; the data of the LAJ were collected between 1957 and 1965 at 2400 locations, and most items are lexical.
The GAJ consists of six volumes including 350 maps that were published between 1989 and 2006; the data of the GAJ were collected between 1979 and 1982 at 807 locations, and all items are grammatical.
The Kamiina-no Hogen (), including 284 maps, was published in 1980; the data were collected between 1968 and 1974 at 240 locations. One hundred and ten lexical, 12 grammatical, and five phonological items are selected for this study.
3. Methods
The degree of correspondence (DC) can be calculated to quantify the degree of resemblance between two sets of dialect data. DCs are the ratios of the number of correspondences in the data for each reference place matching those of the comparison place to the total number of correspondences compared.
Setting the reference and comparison data side by side, it is possible to calculate the DC with from the number of pieces of correspondence data and the number of pieces of valid data.
Valid data are data excluding data invalidated for comparison, such as NR (no response) and “others” in a map legend.
The DC is calculated with the following formula, and it is expressed as a percentage:
DC = number of correspondence data / number of valid data * 100.
DCs can be found after fixing a reference place. The comparison places are all the places in an atlas. The DC is calculated for each comparison place based on the fixed reference place.
When the data for both places are singular (one response), the results are the same regardless of which location is taken as the reference place, as shown in the upper example in Figure 1. However, the results are different in the case of multiple data (multiple responses), as in the lower example in Figure 1. In general, the figures differ since dialectal distribution data are never constructed entirely of singular data.
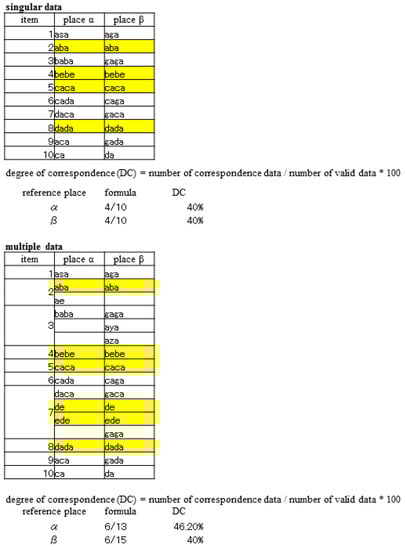
Figure 1.
Examples of singular and multiple data (correspondence data are marked with yellow).
I adopt the great-circular distance for the distance between the reference and comparison places. The distances between the comparison places and the fixed reference place were obtained with the web system of the Geospatial Information Authority of Japan (GSI, formerly the Geographical Survey Institute).
It is possible to make graphs of the data with distances and DCs along the X and Y axes, respectively.
I selected 18 places as reference places, reflecting the traditional division into 16 dialects and two historical capitals (Kyoto and Tokyo); all of them are common to the LAJ and GAJ, from which the wide-area data of this study were collected (Figure 2).
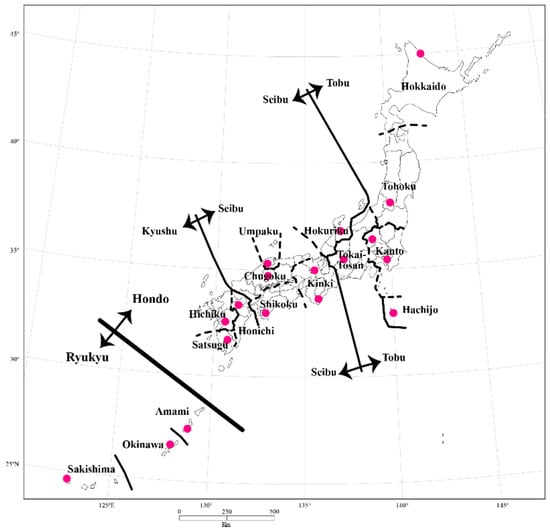
Figure 2.
Reference places of the Linguistic Atlas of Japan (LAJ) and Grammar Atlas of Japanese Dialects (GAJ) data.
On the other hand, eight places were selected for narrow-area data (Figure 3).
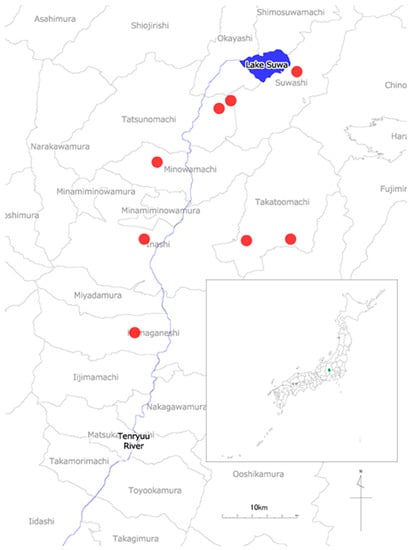
Figure 3.
Reference places of the data obtained from a narrow area (Kamiina) (green square area in the map of Japan).
4. The Main Sequence
Figure 4 and Figure 5 are based on a reference place in the Tohoku region. The DC shows an inverse relationship with distance in most places.
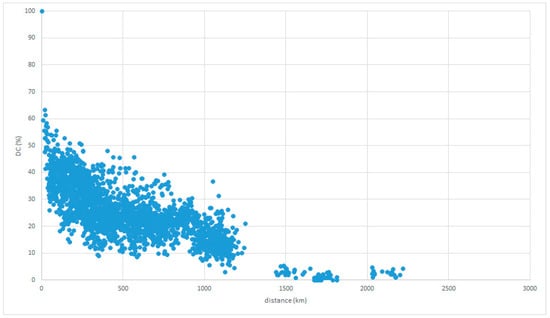
Figure 4.
LAJ data with reference place in Tohoku.
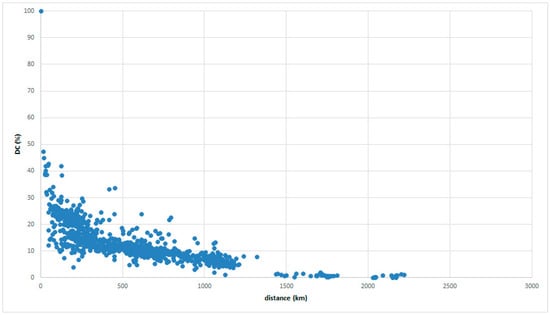
Figure 5.
GAJ data with reference place in Tohoku.
The inverse relationships are frequently confirmed, even if the reference places or atlases are changed, as in Figure 6 and Figure 7 with reference places in Tokaitosan.
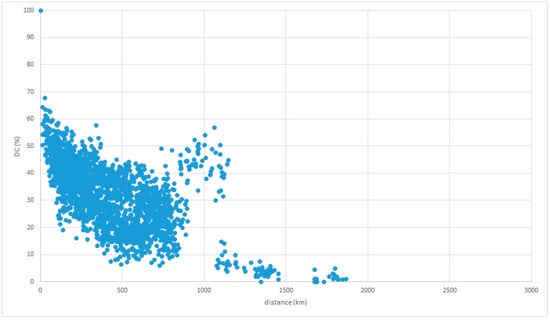
Figure 6.
LAJ data with reference place in Tokaitosan.
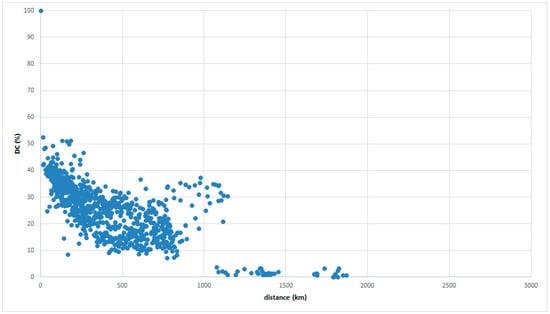
Figure 7.
GAJ data with reference place in Tokaitosan.
Figure 8 and Figure 9 show the same inverse relationships when the reference place is in Chugoku. Thus, this feature is referred to as the main sequence in this study.
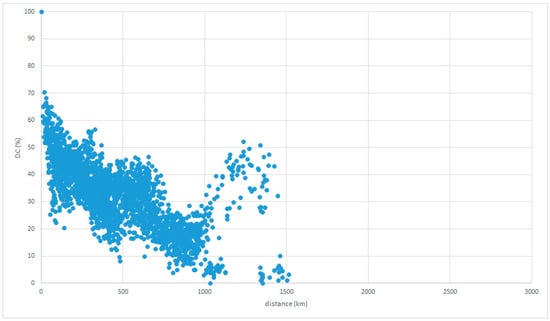
Figure 8.
LAJ data with reference place in Chugoku.
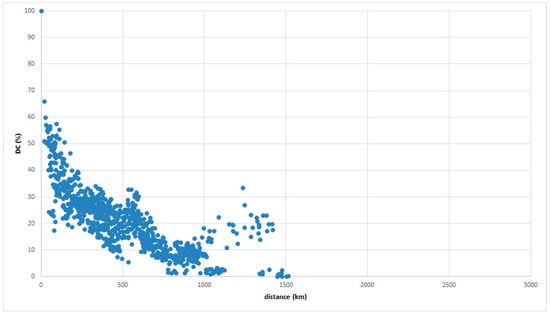
Figure 9.
GAJ data with reference place in Chugoku.
() referred to the feature obtained using data from the LAJ based not on degrees and graphs but on real numbers and maps. The relationships between DC and distance confirm those results. The general pattern in the main sequence, that is, the first result, is called the NS-FD law (near-similar, far-different).
5. Peculiar Groups
Two types of peculiar groups are found. Their characteristics are different. It would appear that one type is based on the history of the place and the other on geographical features.
5.1. In-Migration Place
The first type is a peak indicating a group mentioned in Section 4. Classifying the comparison places of the graphs above, it is found that the locations of the peaks are on Hokkaido, as in the graphs of Tokaitosan (Figure 10 and Figure 11) and the graphs of Chugoku (Figure 12 and Figure 13).
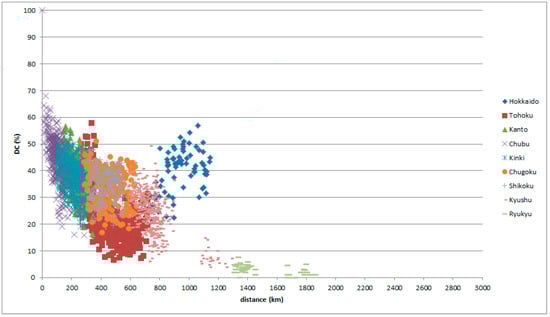
Figure 10.
LAJ data with reference place in Tokaitosan, classified by comparison place.
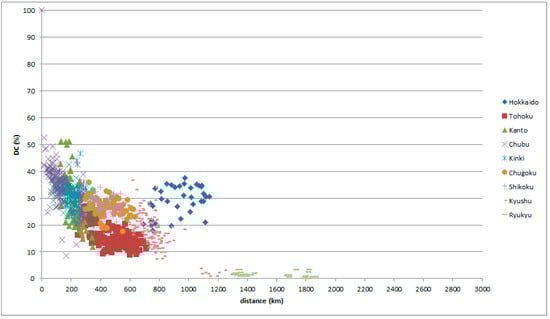
Figure 11.
GAJ data with reference place in Tokaitosan, classified by comparison place.
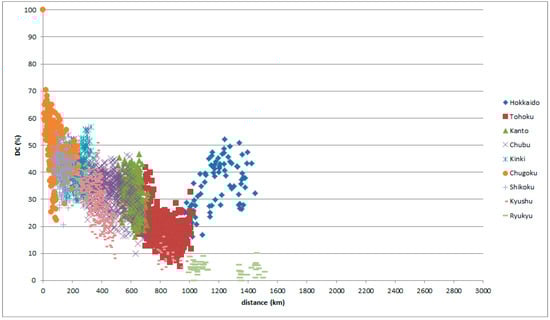
Figure 12.
LAJ data with reference place in Chugoku, classified by comparison place.
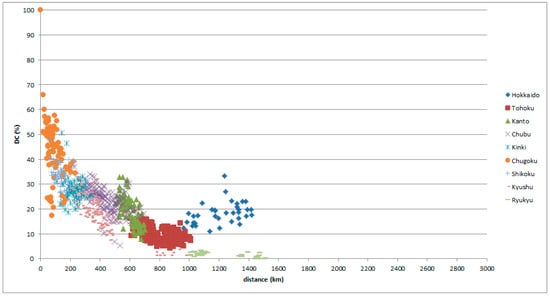
Figure 13.
GAJ data with reference place in Chugoku, classified by comparison place.
Hokkaido is an in-migration place; standardization progresses well in Hokkaido. Standard Japanese is based on Tokyo in the Kanto district. The data indicate that Hokkaido speech behaves as a Kanto dialect regardless of distance and position.
The graphs of Tohoku (Figure 4 and Figure 5) do not show notable peaks, since Tohoku lies between Kanto and Hokkaido (Figure 14 and Figure 15).
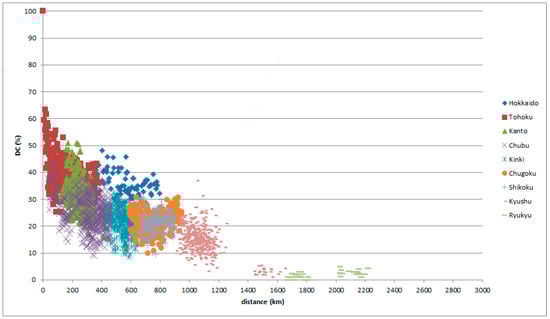
Figure 14.
LAJ data with reference place in Tohoku, classified by comparison place.
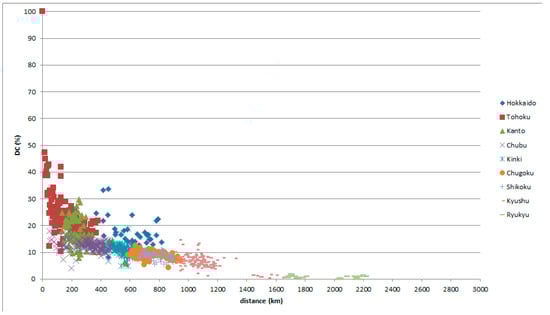
Figure 15.
GAJ data with reference place in Tohoku, classified by comparison place.
The peculiar feature of the peaks for Hokkaido in the graphs was caused by in-migration. Therefore, with the reference place set in Hokkaido, intriguing graphs appear as in Figure 16 and Figure 17.
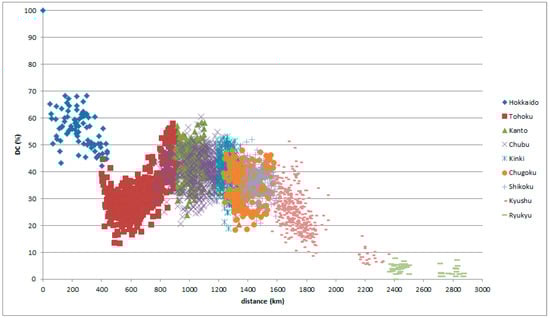
Figure 16.
LAJ data with reference place in Hokkaido, classified by comparison place.
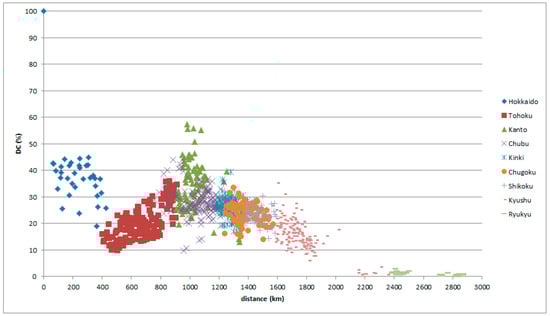
Figure 17.
GAJ data with reference place in Hokkaido, classified by comparison place.
5.2. Ryukyu Islands
Another peculiar group is found on the Ryukyu Islands, with narrow land areas divided by the sea. Figure 18 and Figure 19 set the reference place on Okinawa Island. The NS-FD law holds only within 500 km. It is difficult to find a relationship between DC and distance beyond 500 km (outside of the Ryukyu dialect area). The NS-FD law holds in a main divisional dialect group located on a broad land area, and it becomes ambiguous in solitary islands because of the narrowness of the land area.
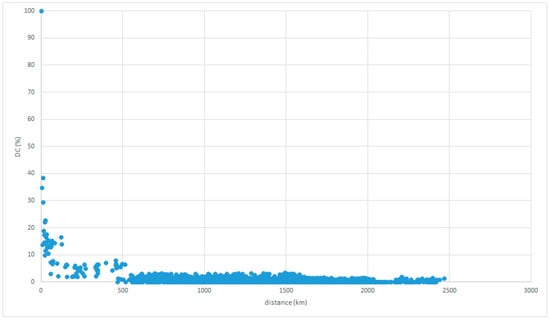
Figure 18.
LAJ data with reference place on Okinawa Island.
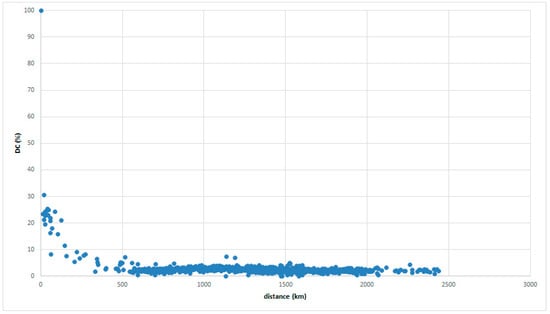
Figure 19.
GAJ data for a reference place on Okinawa Island.
6. Differences in the Shape of the Graph between Wide and Narrow Areas
The main sequence shows a precise linear relationship over a narrow area, as in Figure 20. The graph of the main sequence over a wide area shows a triangular form as in the figures above (e.g., Figure 6 and Figure 7 of the same dialectal division).
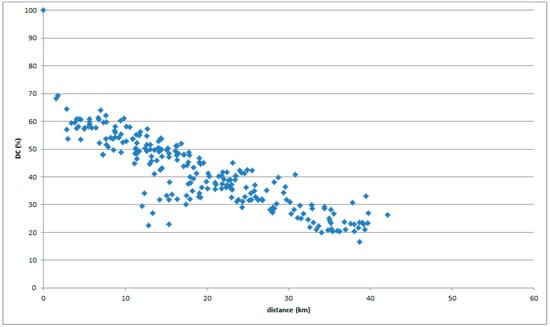
Figure 20.
Kamiina-no Hogen data with a reference place in Minowa.
Classifying the comparison places in the local district resolves the narrow data into multiple lines (Figure 21). We may suppose that the triangle of the main sequence over a wide area is composed of a large number of such lines.
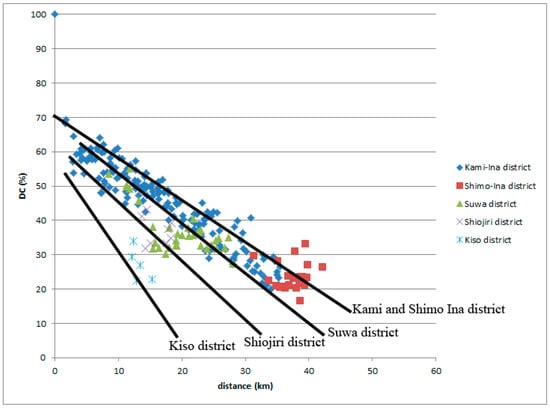
Figure 21.
Kamiina-no Hogen data with reference place in Minowa, classified by comparison place.
7. Difference in the Relationships of Grammatical and Lexical Data between Wide and Narrow Areas
Comparing the grammatical and lexical data for a wide area, the lexical data of the LAJ show a wider range and higher DC than the grammatical data of the GAJ for a wide area, as in Figure 22.
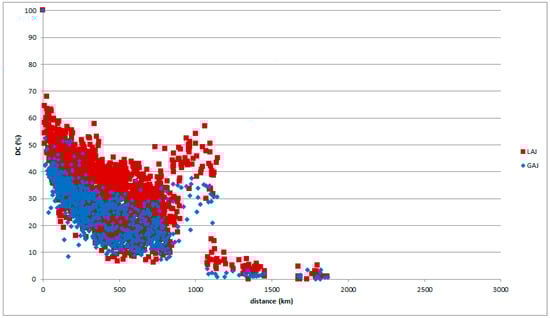
Figure 22.
LAJ and GAJ data with reference place in Tokaitosan.
On the other hand, the relationship is different for a narrow area. Grammatical data show a higher DC than lexical data for a narrow area, as in Figure 23.
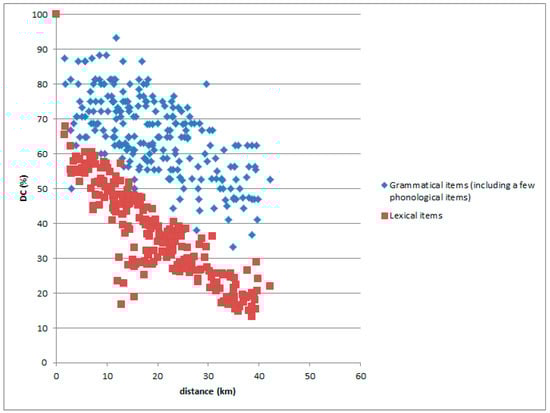
Figure 23.
Lexical and grammatical items of the Kamiina-no Hogen data with reference place in Minowa.
The grammatical data do not vary over a narrow communicative area, since grammar is a core feature of language. If grammar was so diverse, it would be difficult to communicate with each other in a small village. However, despite the similarity of grammar in a narrow area, grammar is not necessarily common between far areas, since people in those places do not communicate as frequently. The differences between the grammatical and lexical data show the importance of sharing a dialect as a means of communication.
8. Conclusions
DC and distance in dialectal data generally show relationships following the NS-FD law (near-similar, far-different), here called the main sequence.
In-migration places like Hokkaido and narrow land areas divided by the sea like Ryukyu show peculiar graphs different from the main sequence.
Graphs of DC versus distance in narrow areas show distinct lines. The lines differ in comparison districts. The triangular shapes in wide areas appear to also be composed of such lines.
DC is higher for grammar than lexicon over a narrow area, though this relationship is the opposite over a wide area. This appears to reflect the importance of commonalities in grammar for communication in a narrow area.
Since the methods used here are simple, they are applicable to other language dialects. I hope to pursue such trials in future research. On the other hand, some subjects, especially on the relationships of different methods and language data (, ; ; ; ), remain for future study.
Funding
This research was funded by JSPS KAKENHI Grant Numbers JP16K13232, JP16H03415, and JP15H03204.
Acknowledgments
This paper was originally presented at the 9th Congress of the International Society for Dialectology and Geolinguistics.
Conflicts of Interest
The author declares no conflict of interest.
References
- Goebl, Hans. 2005. La dialectométrie corrélative. Un nouvel outil pour l’étude del’aménagement dialectal de l’espace par l’homme. Revue de Linguistique Romane 69: 321–67. [Google Scholar]
- Goebl, Hans. 2006. Recent advances in Salzburg dialectmetry. Literary and Linguistic Computing 21: 411–35. [Google Scholar] [CrossRef]
- Heeringa, Wilbert, and John Nerbonne. 2001. Dialect areas and dialect continua. Language Variation and Change 13: 375–400. [Google Scholar] [CrossRef]
- Jeszenszky, Péter, Philipp Stoeckle, Elvira Glaser, and Robert Weibel. 2017. Exploring global and local patterns in the correlation of geographic distances and morphosyntactic variation in Swiss German. Journal of Linguistic Geography 5: 86–108. [Google Scholar] [CrossRef]
- Kumagai, Yasuo. 2016. Developing the Linguistic Atlas of Japan Database and advancing analysis of geographical distributions of dialects. In The Future of Dialects. Edited by Marie-Hélène Côté, Remco Knooihuizen and John Nerbonne. Berlin: Language Science Press, pp. 333–61. [Google Scholar]
- Mase, Yoshio. 1980. Kamiina-no Hogen. Ina: Kamiinashikankokai. [Google Scholar]
- Nerbonne, John, and Peter Kleiweg. 2007. Toward a dialectological yardstick. Journal of Quantitative Linguistics 14: 148–67. [Google Scholar] [CrossRef]
- NLRI (National Language Research Institute of Japan (NLRI, latterly NINJAL: National Institute of Japanese Language and Linguistics)). 1966–1974. Linguistic Atlas of Japan; Tokyo: National Printing Bureau of Finance Ministry.
- NLRI (National Language Research Institute of Japan (NLRI, latterly NINJAL: National Institute of Japanese Language and Linguistics)). 1989–2006. Grammar Atlas of Japanese Dialects; Tokyo: National Printing Bureau of Finance Ministry.
© 2019 by the author. Licensee MDPI, Basel, Switzerland. This article is an open access article distributed under the terms and conditions of the Creative Commons Attribution (CC BY) license (http://creativecommons.org/licenses/by/4.0/).