Article

Design, Analysis, and Testing of a Scaled Propeller for an Innovative Regional Turboprop Aircraft

by
Danilo Ciliberti
* and
Fabrizio Nicolosi
Department of Industrial Engineering, University of Naples “Federico II”, Via Claudio 21, 80125 Naples, Italy
*
Author to whom correspondence should be addressed.
Aerospace 2022, 9(5), 264; https://doi.org/10.3390/aerospace9050264
Submission received: 6 April 2022 / Revised: 7 May 2022 / Accepted: 10 May 2022 / Published: 13 May 2022
(This article belongs to the Special Issue Turboprop Aircraft Design and Optimization)

Abstract

:
This paper describes the design, numerical analyses, and wind tunnel tests of the scaled model of a propeller serving as a propulsive element for the experimental tests of an advanced regional turboprop aircraft with engines installed on the horizontal tailplane tips. The design has been performed by complying with the thrust similarity from the full-scale aircraft propulsive requirements. Numerical analyses with a high-fidelity aerodynamic solver confirmed that the initial design made with XROTOR would achieve the expected performance. Finally, a strengthened version of the propeller has been manufactured via 3D printing and tested in the wind tunnel. Test data include measurements of thrust as well as propeller normal force at different angles of attack. Good agreement between numerical and experimental results has been observed, enabling the propeller to be used confidently in the aircraft wind tunnel powered test campaign.

1. Introduction

This research work is framed within the European research project named IRON. The research program is addressed to the performance improvement of regional aircraft within the 90–150 passenger segment. Although the market forecasts made by the most important manufacturers at the beginning of 2020 have been radically changed by the unexpected COVID-19 outbreak [1], at the end of the pandemic, most of the major airlines will still need to replace several hundred heritage aircraft and respond to the market demand for new aircraft in the 20–150-seat segment [2,3,4,5,6]. This segment is characterized by the predominance of regional jets. Despite this success, turboprop engines are 10–30% more efficient in terms of fuel consumption [7]. Thus, the introduction of a large, innovative turboprop airplane should help in reducing aviation’s environmental impact.
The innovative regional platform investigated within the IRON project is a three-lifting-surface aircraft with engines mounted on the horizontal tailplane tips. This configuration has been largely investigated both numerically [8,9] and experimentally [10,11]. However, the propulsive effects of the rear-mounted engines on this unconventional configuration have not been fully discussed yet. In this paper, the design, analysis, and testing of the isolated propeller model—later used in the aircraft powered wind tunnel tests—are presented. A drawing of the aircraft scaled model with rear-mounted engines and propellers is shown in Figure 1.
The theory of the propeller has its roots in the design of marine propellers in the 19th century. As regards aeronautical propellers, a design for minimum energy loss was researched by Betz, Prandtl, Goldstein, Theodorsen, and others. The theory for minimum induced loss (MIL) has been resumed by Larrabee [12] and Adkins and Liebeck [13], and extended by Wald [14]. The application of vortex theory on the design of small propellers operating at low Reynolds number has been performed in the last 15 years, due to the recent interest in small UAV design.
Youngren and Chang [15] designed a 10 cm diameter propeller for a micro UAV with XROTOR [16]. They also designed the blade section profile with XFOIL [17] to operate at a Reynolds number below 50,000. Wind tunnel tests provided efficiency 10% lower than that predicted by XROTOR, but a significantly higher thrust.
Smedresman, Yeo, and Shyy [18] also designed a small propeller for their micro UAV. In their case, the measured thrust, torque, and efficiency were significantly lower than those predicted by vortex codes, but the uncertainty of manufacturing and measurements was not well quantified.
A comparison among numerical codes with wind tunnel data was made more recently [19,20]. The results showed that XROTOR provides an overestimation of propeller coefficients up to 15% with respect to experimental data, depending on the number of blades, advance ratio, and rotation rate. These latter works refer to propellers for full-scale airplanes, with diameters of approximately 1.5–3.0 m. Despite the differences with test data, XROTOR was ranked as the best among vortex and blade element method codes, whereas the use of a high-fidelity RANS solver provided the most accurate results.
The effects of geometric scaling and motor fixture were anticipated by Bass [21,22]. The effects of Reynolds number on the performance of commercial propellers available for aeromodelling have been investigated by Brandt and Selig [23], whereas Deters, Ananda, and Selig [24] extended the results of the previous work and also provided data on propellers realized by them in 3D printing, which included airfoils specifically designed for this low-Reynolds application.
The scope of this article is to present the design, the analysis, and the wind tunnel experiments of the isolated propeller to be installed on the model illustrated in Figure 1. Such a model has a 1:25 scale, which imposes a propeller diameter of around 15 cm. The limited size of the propeller, together with the relatively high thrust coefficient and advance ratio required by the condition to simulate, posed a challenge to its design.
The standard procedure entails the design of the full-scale propeller and its testing at constant axial flow speed and different rotational rates. Design procedures presented in the literature—such as the above-cited [12,13,14]—often only solve the problem of aerodynamic design targeting some required performance indicators such as thrust or power.
The problem faced in this paper is the design, analysis, and testing of a scaled propeller whose full-scale counterpart does not exist, yet its high-performance target has to be matched in a low-Reynolds-number wind tunnel to perform experimental investigations about propulsive effects on aircraft stability and control. The paper attempts to answer the following questions:
  • Are the approaches presented in the literature still valid for a small yet high-thrust-coefficient propeller?
  • How can we effectively modify the initial propeller geometry to account for possible structural issues, without impacting the performance?
  • Is the effect of non-axial flow negligible on such a type of propeller? What is the predicted impact on aircraft longitudinal stability?
The remainder of the paper is organized as follows. Section 2 describes the approach used to design the propeller, starting from the requirements of the full-scale propulsive unit and then presenting the design process, and finally discussing the propeller–motor coupling.
Section 3 provides the propeller design in terms of the performance requirements as well as the geometric and tunnel constraints. The design is performed with XROTOR and validated with STAR-CCM+®. The blade modification to strengthen the root-hub junction is discussed and the results are compared with the original design. Moreover, the motor performance is estimated and matched with that of the propeller. The data acquisition and control system is introduced. Finally, comparisons between numerical and experimental tests on the 3D-printed propeller are made for the axial flow condition. As an addendum, the effects of the angle of attack on thrust and normal force are experimentally measured and discussed.
Conclusions are drawn in Section 4. It is here noted that the selected approach performed well in the design and performance evaluation of this low-Reynolds-number propeller, as the matching between numerical results and wind tunnel data is very close.

2. Materials and Methods

In this section, details on the design procedure and experimental setup are given.

2.1. Propulsive System Scaling

The scale of the aircraft model and the wind tunnel operating speed determine the scale of the propulsive system. Thrust similarity is a principle stating that both the scaled model and full-scale propeller must have the same coefficients:
J = V n D
C T = T ρ n 2 D 4
C P = P ρ n 3 D 5
η = C T C P J
which represent the propeller advance ratio (1), the thrust coefficient (), the power coefficient (), and the propeller efficiency (), respectively. The terms C T and C P are also known as the Renard coefficients.
A complete thrust similarity—requiring a match on both C T and C P —is often impossible to achieve, since the low Reynolds number attainable in a small wind tunnel limits the maximum achievable values of the propeller coefficients, even with an identical scaled copy of the real propeller [25]. Moreover, in a wind tunnel test, the flow speed V is usually kept constant and it is limited by the maximum power available to the wind tunnel fan or by the maximum load tolerated by the measurement’s system. Consequently, the desired advance ratio J is obtained by designing the propeller at the right rotational speed n for a given wind tunnel speed V and propeller scale—represented by its diameter D.
For the above-stated reasons, it is expected that the axial and rotational flow speeds are differently scaled and hence both Renard coefficients cannot be matched with their full-scale values. As the objective of the wind tunnel powered test campaign on the entire aircraft is the evaluation of propulsive effects on aircraft stability and control characteristics, the authors decided to focus on achieving only the thrust coefficient C T at the provided advance ratio J. Details on the design process are given in the following section.

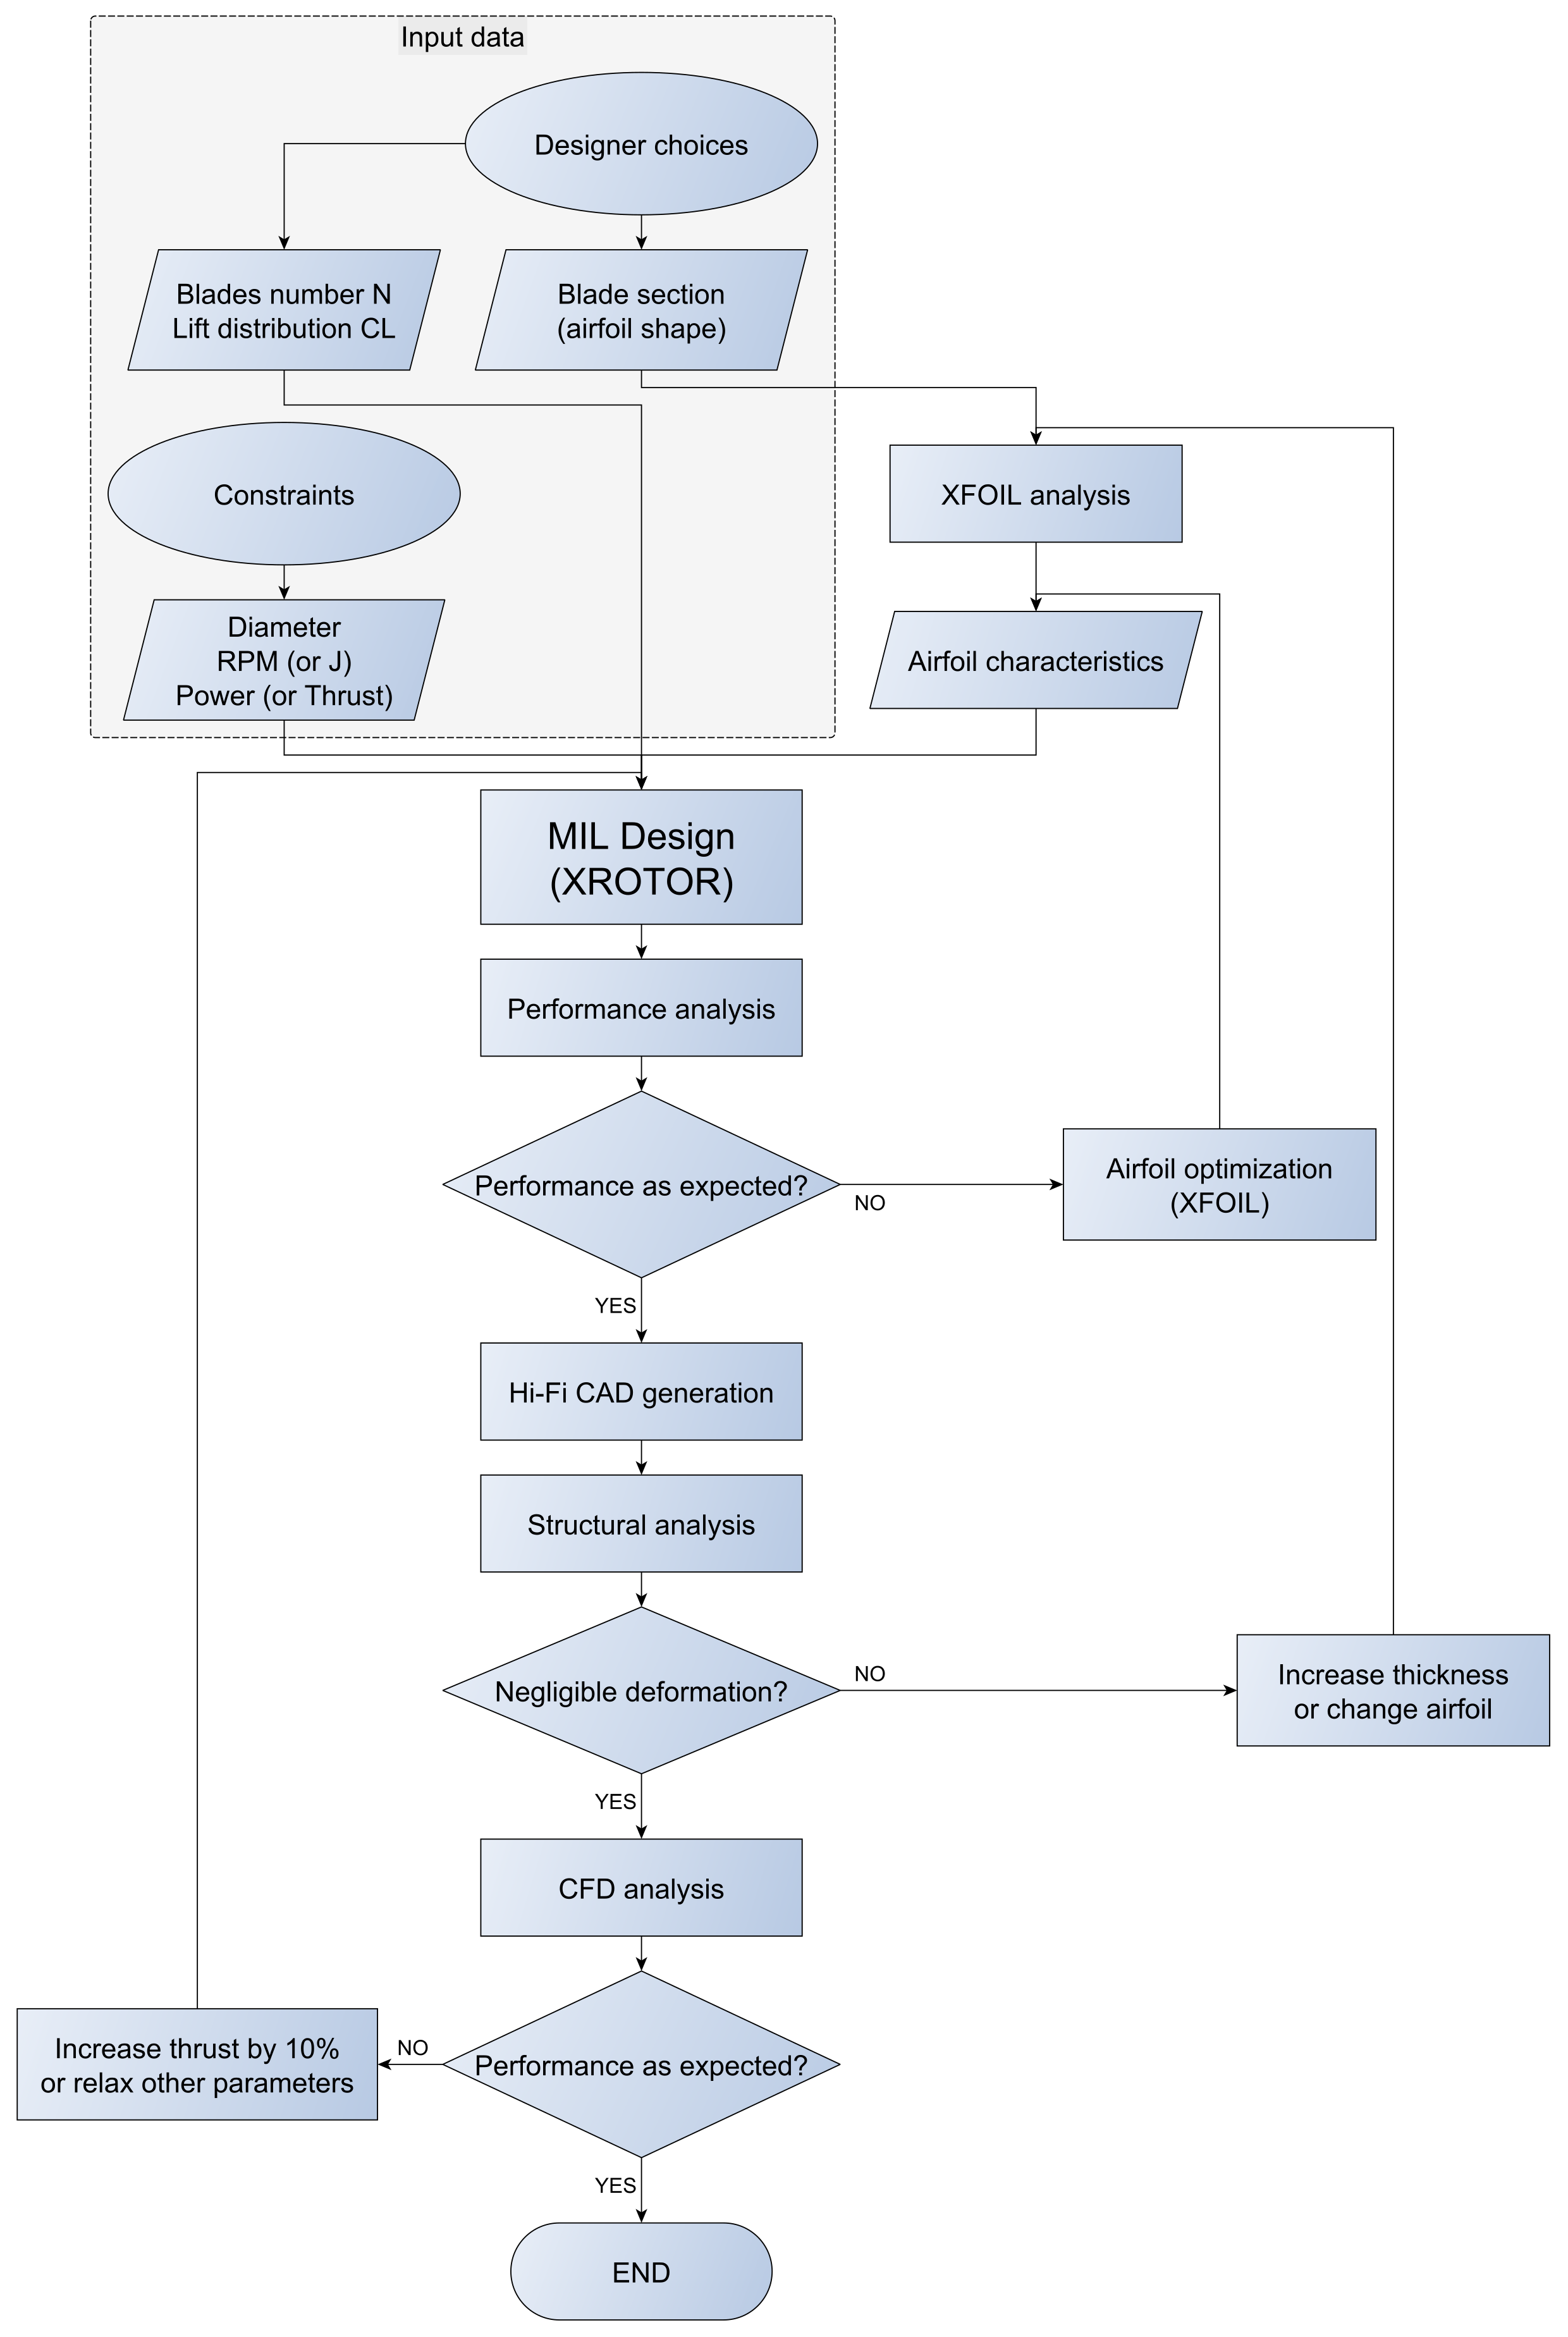
2.2. Propeller Design Algorithm

The aircraft model scale provides a constraint to the propeller size, whose diameter is of the order of 0.1 m. Therefore, the Reynolds number on the blade chord was expected to be between 50,000 and 100,000. The challenge was to design a small propeller with a relatively high thrust coefficient and efficiency, but with an expected maximum rotational speed of around 10,000 RPM.
The propeller’s initial design has been performed with XROTOR, which is believed to be one of the best propeller design software programs freely available [19,20]. Its accuracy increases if the aerodynamic properties of the blade sections are included in the process. The design workflow is shown in Figure 2 and described in the following. The proposed algorithm is not fully automated, but it requires different software, as well as data exchange and interpretation by the user.
From the given geometric constraints and performance requirements, the blade of the propeller is designed aiming for the minimum induced loss loading. The design is performed at a given point, which is set by assigning RPM or advance ratio, together with flow speed. The analysis is then performed to evaluate the propeller performance on a range of these parameters. If the results do not comply with the required performance, the designer may change some input parameters or attempt to optimize the airfoil and iterate the procedure as necessary. From the aerodynamic point of view, the propeller design may be stopped here.
Since the propeller has to be safely operated in the wind tunnel, a structural analysis is advised. If stress or displacements are negligible—say, well below material yielding or less than one millimeter tip displacement at maximum load—the user may proceed with high-fidelity aerodynamic analyses or directly go to manufacturing. If structural analysis indicates high stress regions or excessive displacements, the user should revise some geometric parameters, such as airfoil shape or trailing edge thickness, as well as strengthen the blade root sections. At this stage, the authors wrote a MATLAB® set of functions to initiate a high-fidelity CAD file from the geometric data output of XROTOR, with the possibility to locally edit section profiles.
This high-fidelity CAD file can also be used to perform CFD analyses or directly sent to manufacturing. If the high-fidelity aerodynamic results from CFD are satisfactory, the design loop ends; otherwise, it is suggested to increase the required thrust in XROTOR by 10% and iterate the design.

2.3. Propeller–Motor Matching

From the required propeller coefficients, together with the model’s scale and wind tunnel settings, the scaled engine torque, power, and RPM are derived. These are used to size a motor or, more realistically, to choose a motor off-the-shelf. An electric motor type has been chosen, because of the high scalability, availability, operation cleanness, and safety of such a machine. The motor’s characteristics, such as operating voltage and current per torque load, determine the power and energy source size, as well as the electronic speed controller characteristics.
Since the propeller is designed with fixed-pitch blades and to be directly coupled with the motor shaft, it is important to find an electric motor whose torque and rotational speed match the propeller characteristics. Ideally, the motor map—showing all the possible combinations of torque load versus rotational speed—should be provided by the manufacturer. Given the geometric scale of the test article, the motor size is expected to be within 50 mm max. diameter and 150 mm max. length, the typical size of the motor of small UAVs or radio-controlled aircraft models. Often, such motor models are not provided with detailed performance information. Usually, manufacturers state at most the motor max. power, the max. RPM, and the max. (peak) absorbed current.

3. Results

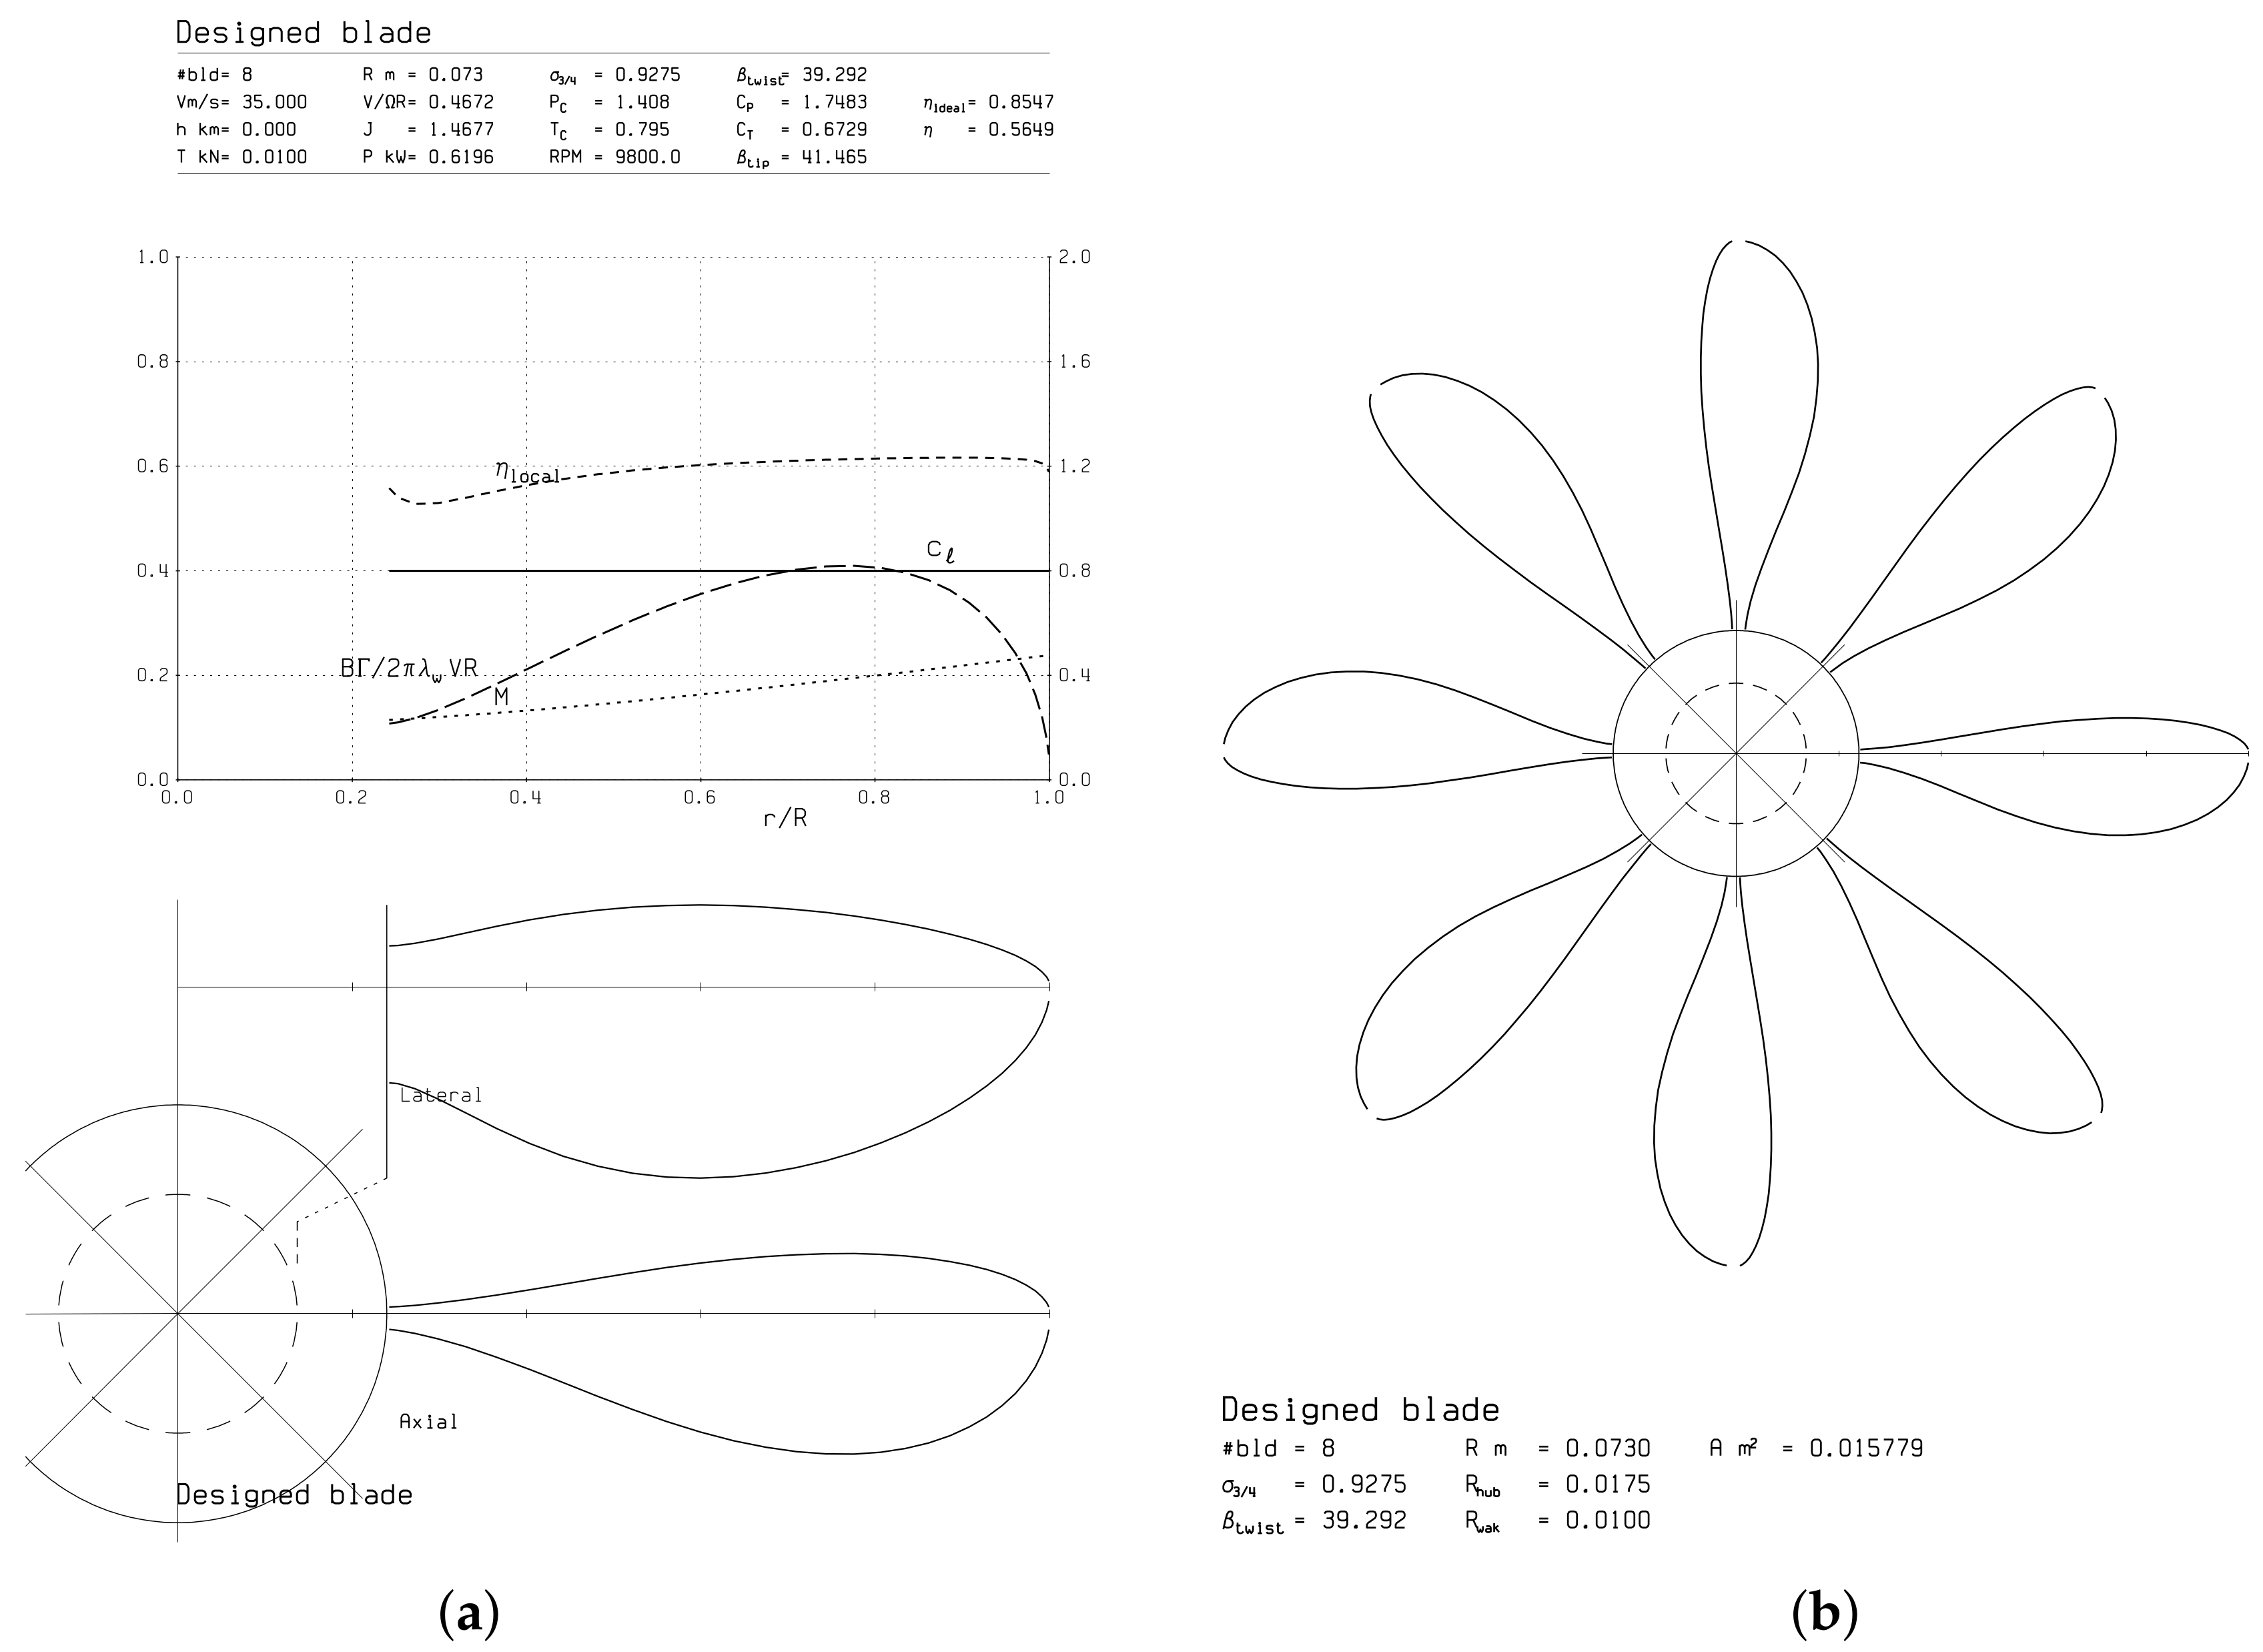
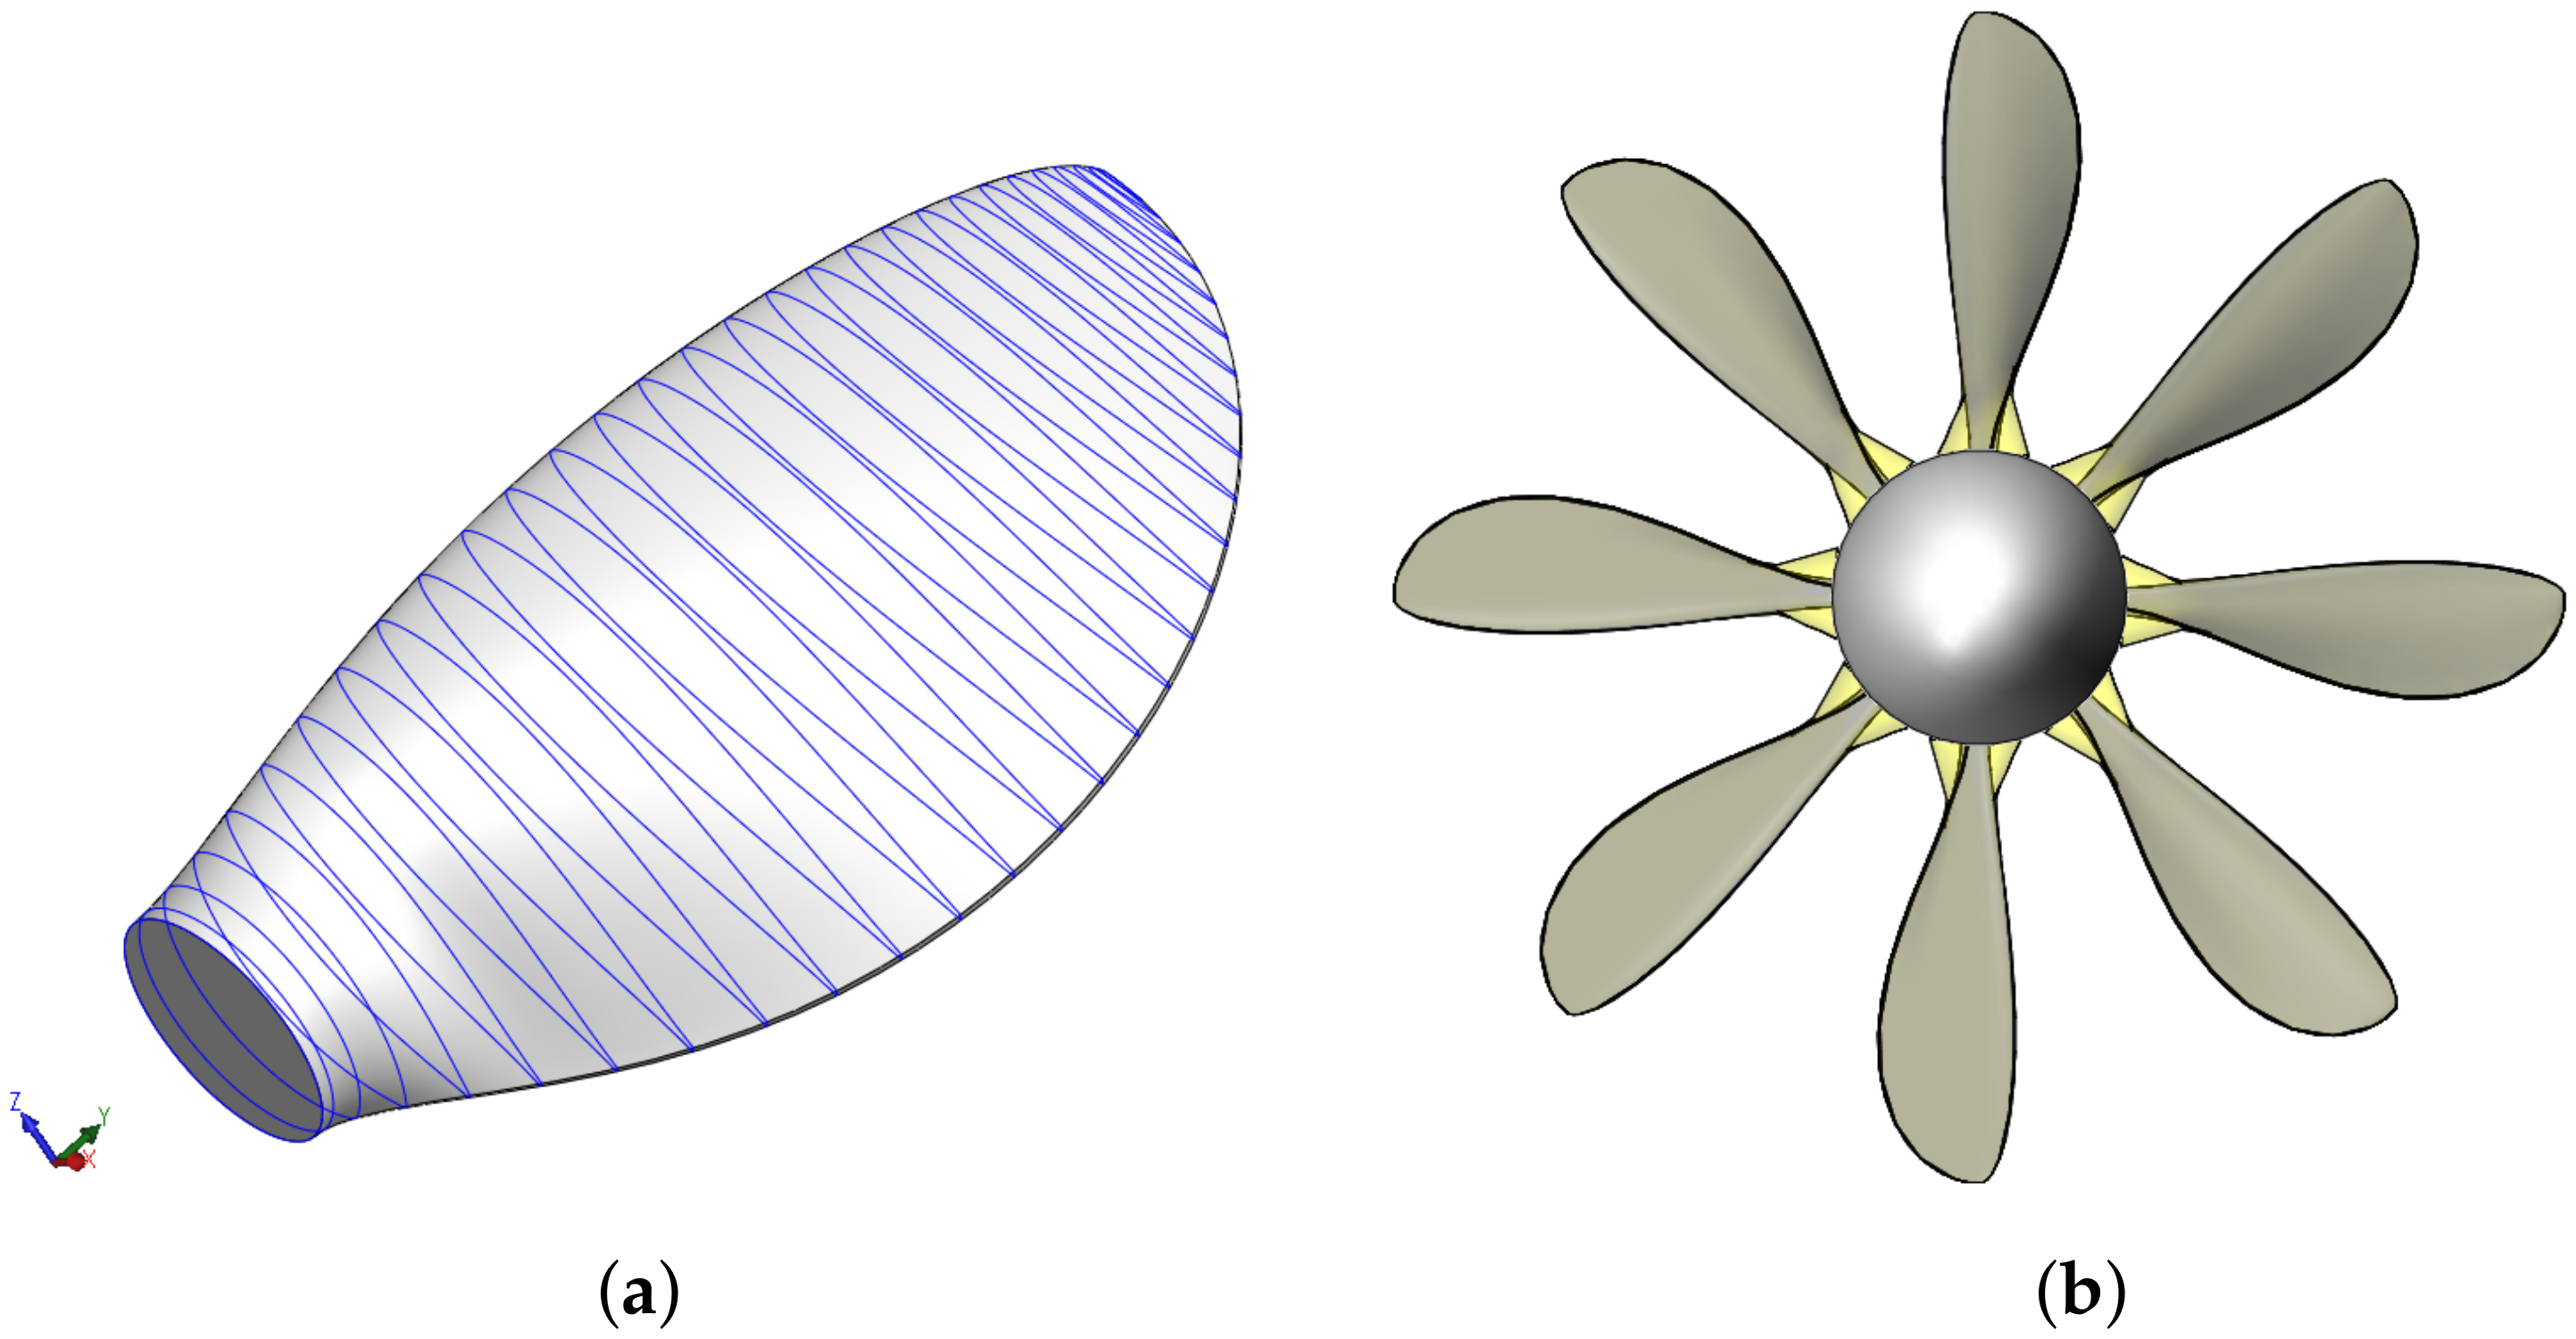
3.1. Propeller Design

The coefficients setting the propeller performance requirements are given in Table 1. These are representative of a climb condition at 1500 m.
Given the propeller diameter D = 146 mm and the test section flow speed V = 35 m / s , from the data in Table 1, the propeller’s RPM, thrust T, and shaft power P are calculated with Equations (1)–(), respectively. These have been reported in Table 2.
However, it is known that XROTOR tends to underestimate thrust by approximately 10% [19]; hence, the algorithm presented in Section 2.2 is initiated with the data reported in Table 3. An eight-bladed propeller giving a thrust of 10 N at 9800 RPM is then designed. The number of blades has been chosen after several iterations as the best compromise between average chord length and rotor solidity. A blade lift coefficient C = 0.8 is assigned along the blade span.
Prior to starting the propeller design, the profile optimization algorithm was run on the SDA 1075 airfoil [24] at a Reynolds number of 50,000. However, since the SDA 1075 airfoil is already designed for low-Reynolds-number propellers, the optimization routine test did not give significant improvements. Moreover, because the optimized shape had a thin trailing edge, it was discarded in the final design and a thickened version of the SDA airfoil has been selected to provide enough stiffness.
The blade section thickness value has been fixed to 35% local chord length from the root station to the 24% blade span, and then linearly decreased to the original 12% relative thickness at the blade tip. The aerodynamic properties of the blade section profiles have been evaluated with XFOIL and loaded into XROTOR. The output of the XROTOR design is illustrated in Figure 3. Geometric data are tabulated in Appendix A.

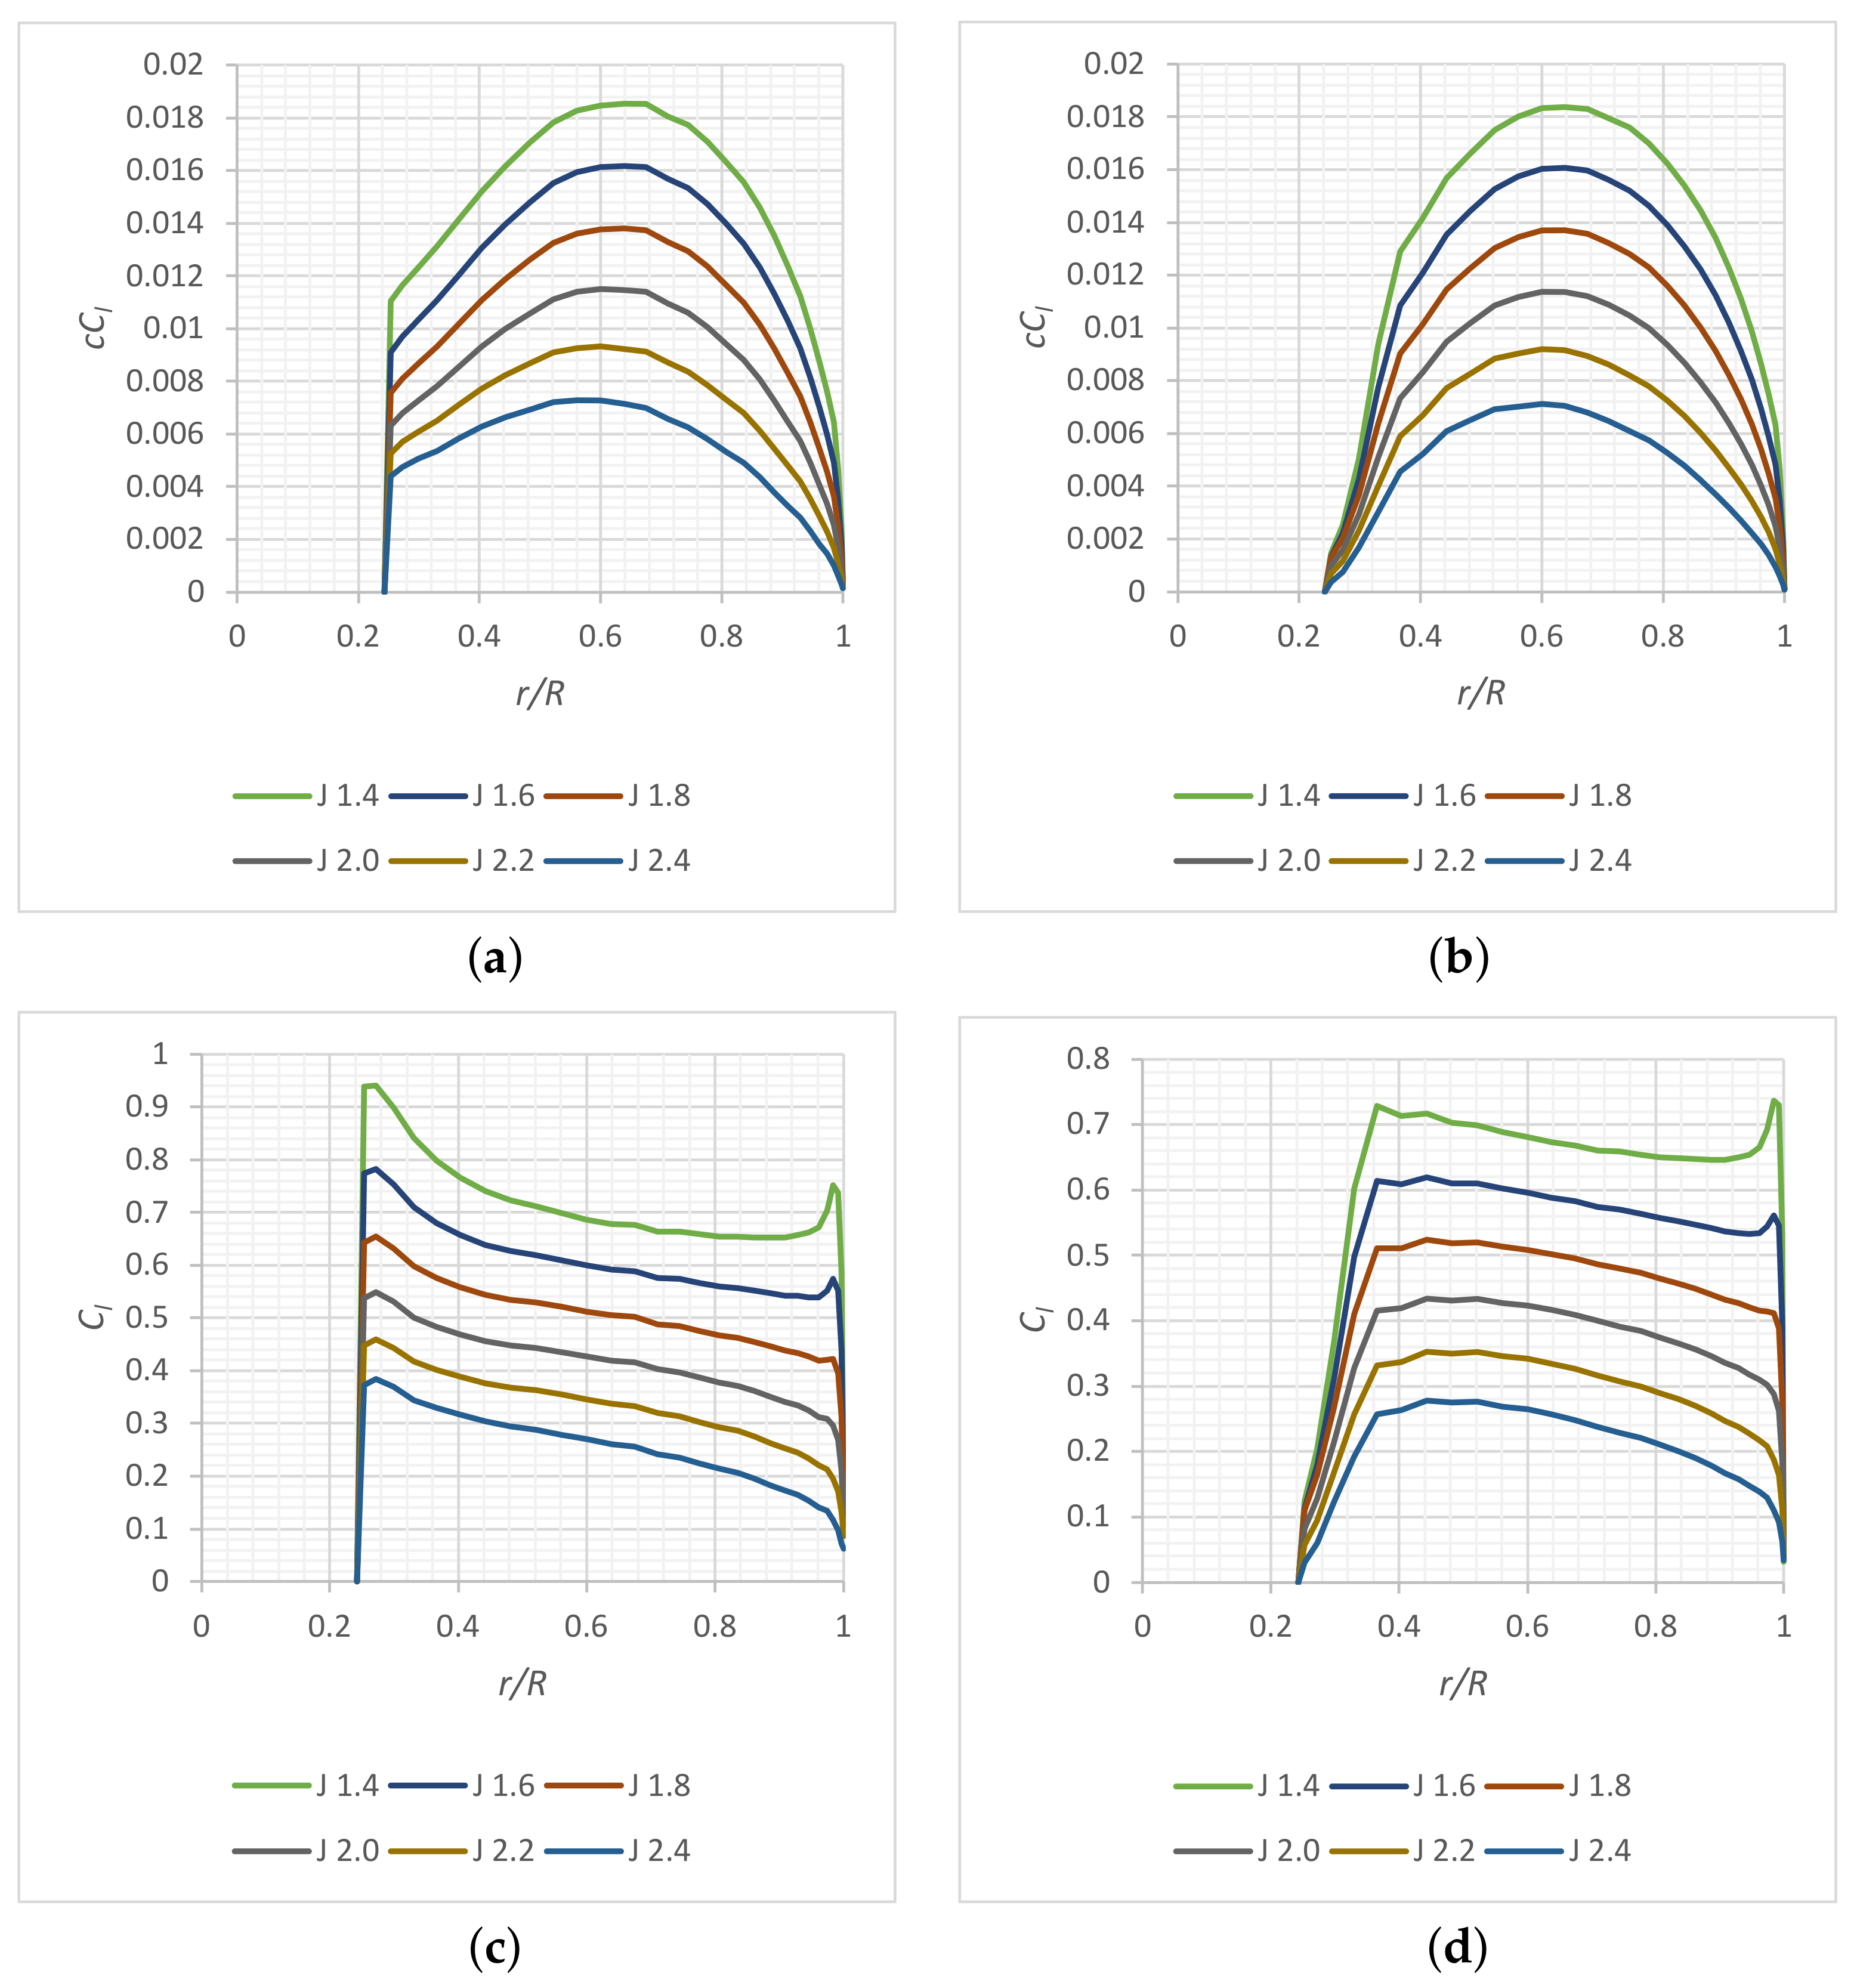
3.2. Propeller Refined Analysis

From Figure 3, the small thickness of the root section in planform view can be observed. To increase the blade strength at the root, a modification to the original design was made and a circular cross-section was assigned to the root section, as shown in Figure 4. To check the performance of the modified propeller, CFD analyses were performed on both the original and modified design, with the moving reference frame technique (MRF) in STAR-CCM+®, sweeping the advance ratio J from 1.4 to 2.4, and keeping the flow speed constant at 35 m/s. Although the blade Reynolds number based on its characteristic chord is of the order of 50,000, the flow is modelled as fully turbulent with the k - ω model because of the high RPM and the expected surface roughness due to 3D printing.
The MRF approach is suitable when only the isolated propeller is investigated and transient phenomena are not of interest. The propeller coefficients are predicted with the same accuracy as a time-dependent solution, but evaluated 10–15-times faster [20].
A spinner was added to the rotor hub in the CFD analysis. Its geometry is the same of that of the aluminum spinner installed in the wind tunnel for the experimental analysis.
The CFD setup domain, mesh, and post-processing scenes are shown in Figure 5. The comparisons among the reference values of Table 2, XROTOR design, and both original and modified geometries simulated with CFD are shown in Figure 6. It can be observed that XROTOR overestimates both thrust and power coefficients with respect to the high-fidelity solver, as expected [20]. The thrust coefficient predicted by CFD is close to the reference value at the lowest advance ratio. The reference power coefficient—and consequently the reference propeller efficiency—is different because the full-scale propeller works in a totally different condition. However, the obtained CFD values are satisfactory for wind tunnel testing. Moreover, the modified propeller geometry with the strengthened root did not provide significant losses with respect to the original design. Numerical load distributions are reported in Appendix B. Therefore, the modified design has been realized in outsourcing through additive manufacturing in PA11 nylon with selective laser sintering, while the original design was discarded.

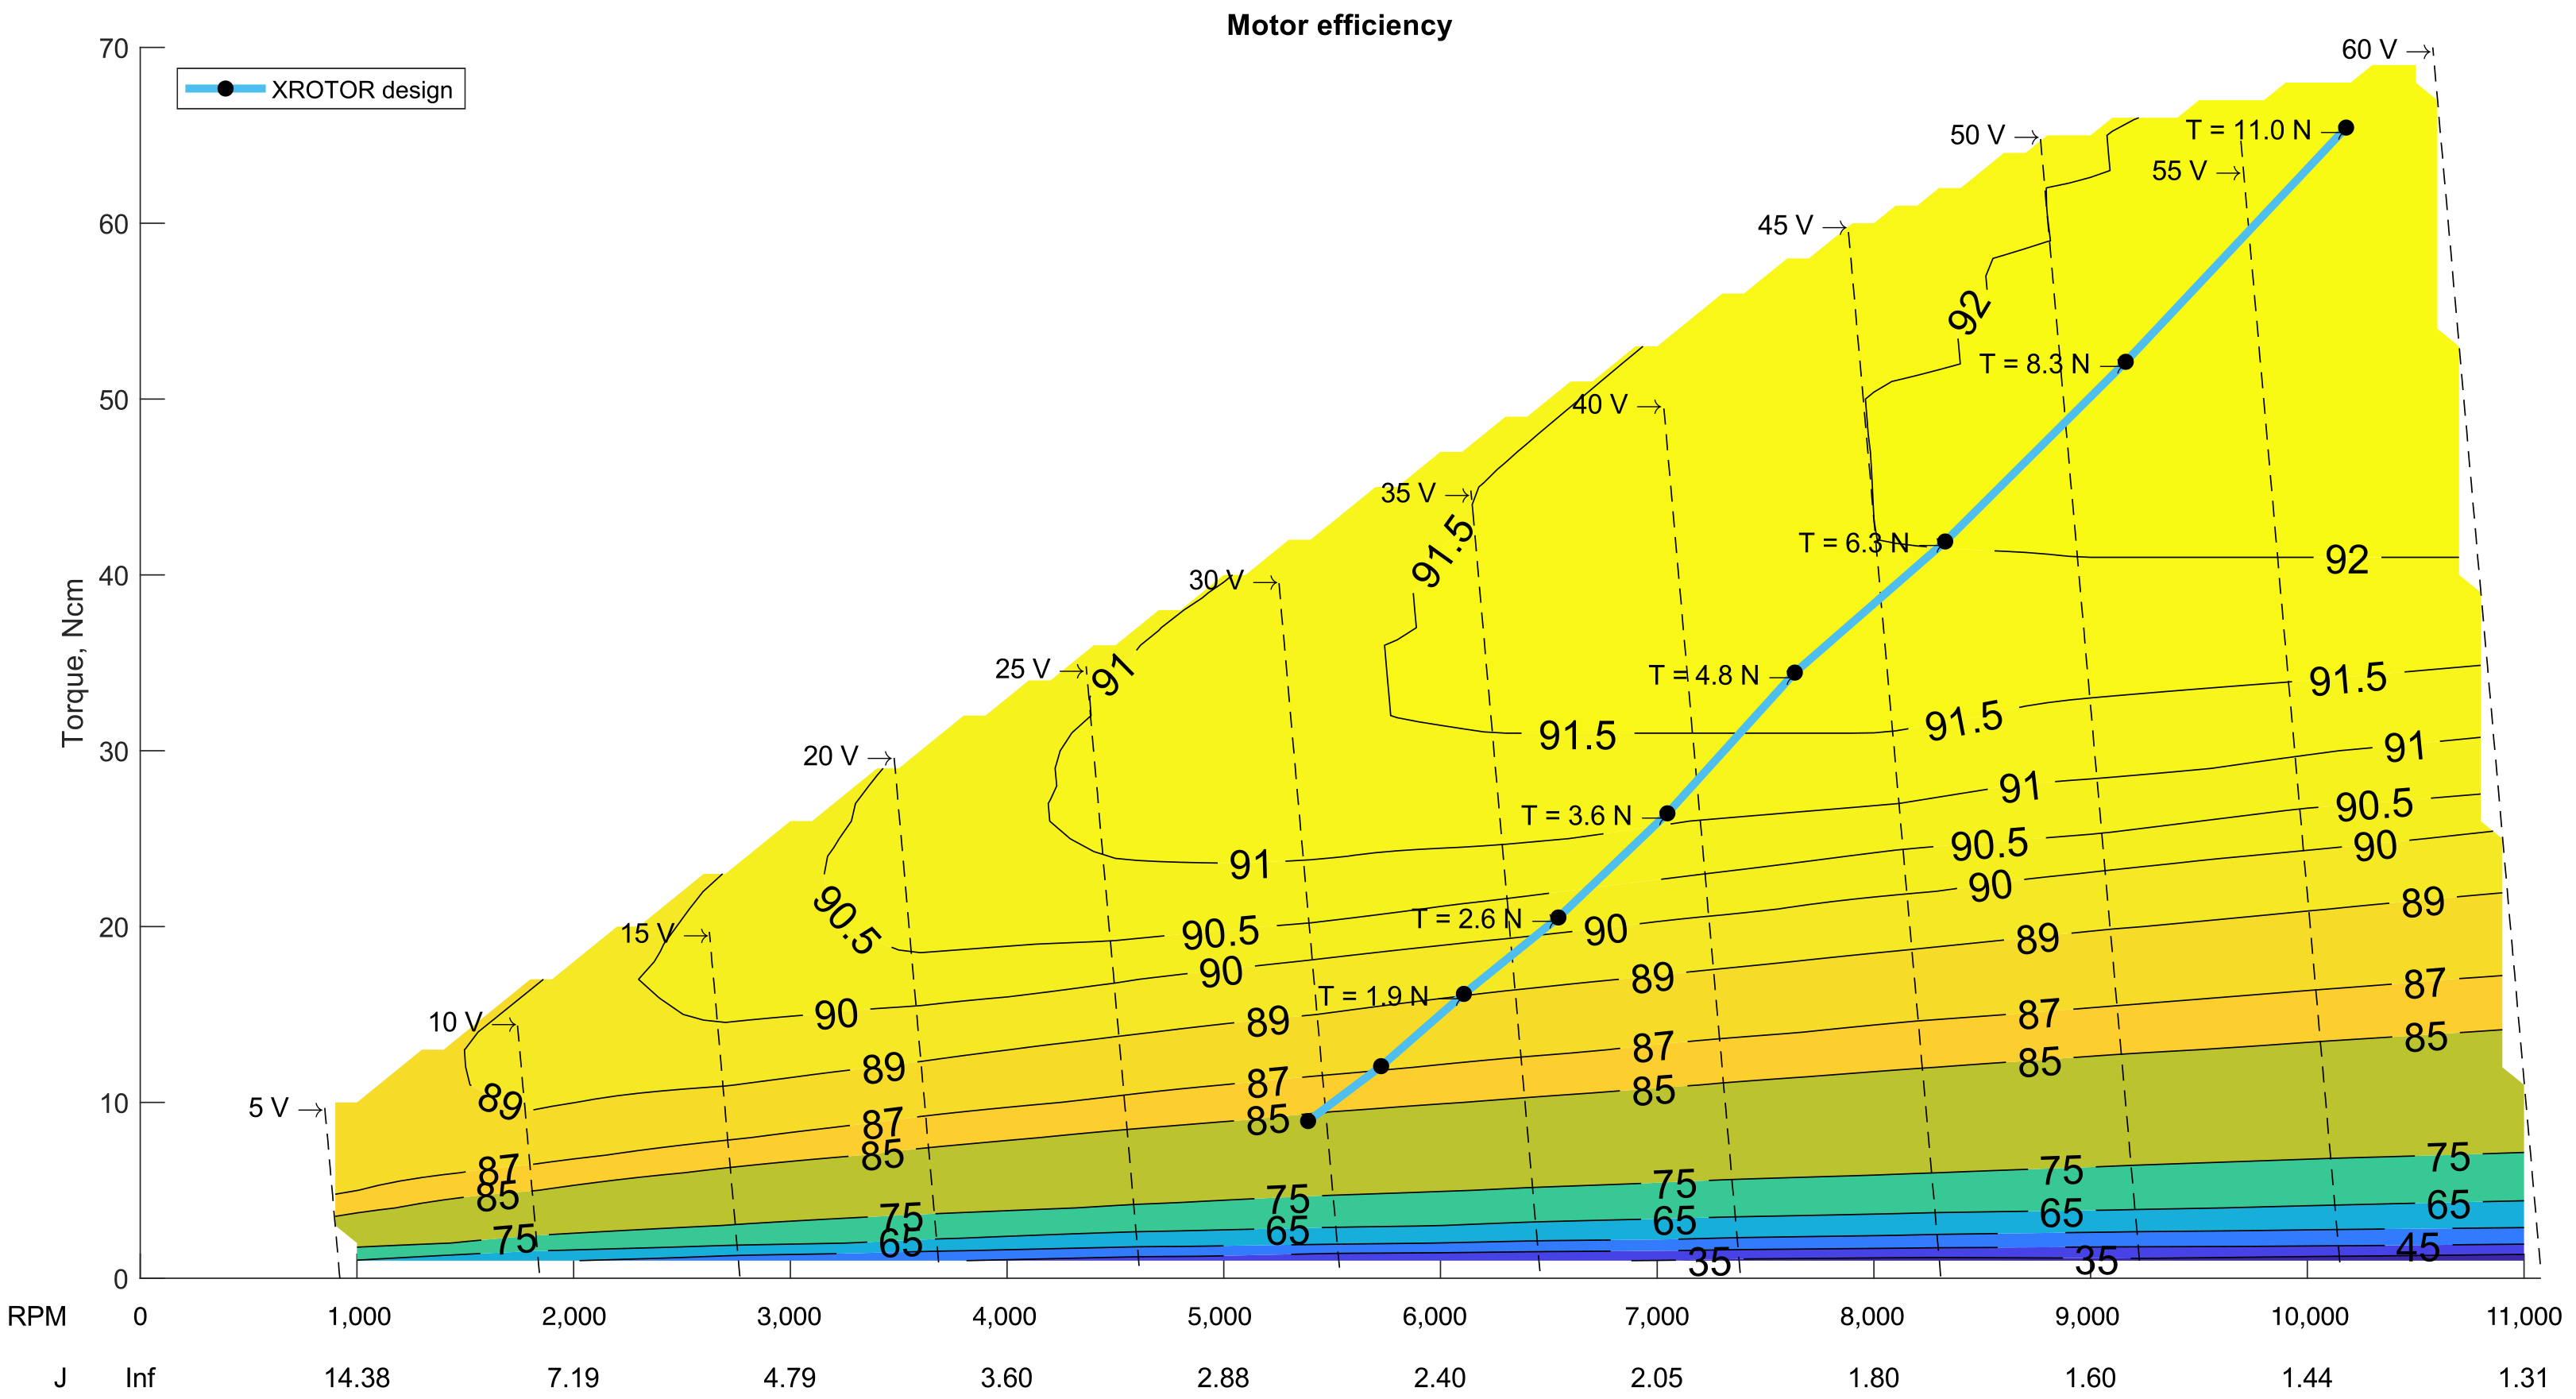
3.3. Motor Selection and Performance Estimation

From the requirements of Table 2, the main characteristics of the electric motor are derived. From the results of the preliminary analysis, the motor max RPM and power were estimated as 10,000 RPM and 800 W, respectively. This also gave indications on the motor constant K v —expressed in RPM/Volt—to achieve the necessary torque with a given voltage. The selected motor is the Lehner 2280/40 LK. The manufacturer provides performance tables at constant voltage on its own website [26]. Each table lists the absorbed current, input (electric) power, RPM, torque, output (shaft) power, and mechanical efficiency, which is the ratio between shaft and electric powers. It resulted that this motor has a constant K v 185 RPM/Volt, which is ideal for relatively high torques and low rotational speeds. A MATLAB® routine has been written to process several performance tables and generate motor maps. This software is freely available on GitHub [27]. The classic torque vs. RPM map with the motor’s efficiency contour is shown in Figure 7. This defines the motor limits. All the predicted propeller operating points can be tested in the wind tunnel.
Similarly, the alternative motor map of Figure 8 shows the electric current as a function of RPM (abscissa), applied voltage (dashed lines), and shaft power (iso-lines representing the motor load). This chart was useful to determine the size of the power supply.

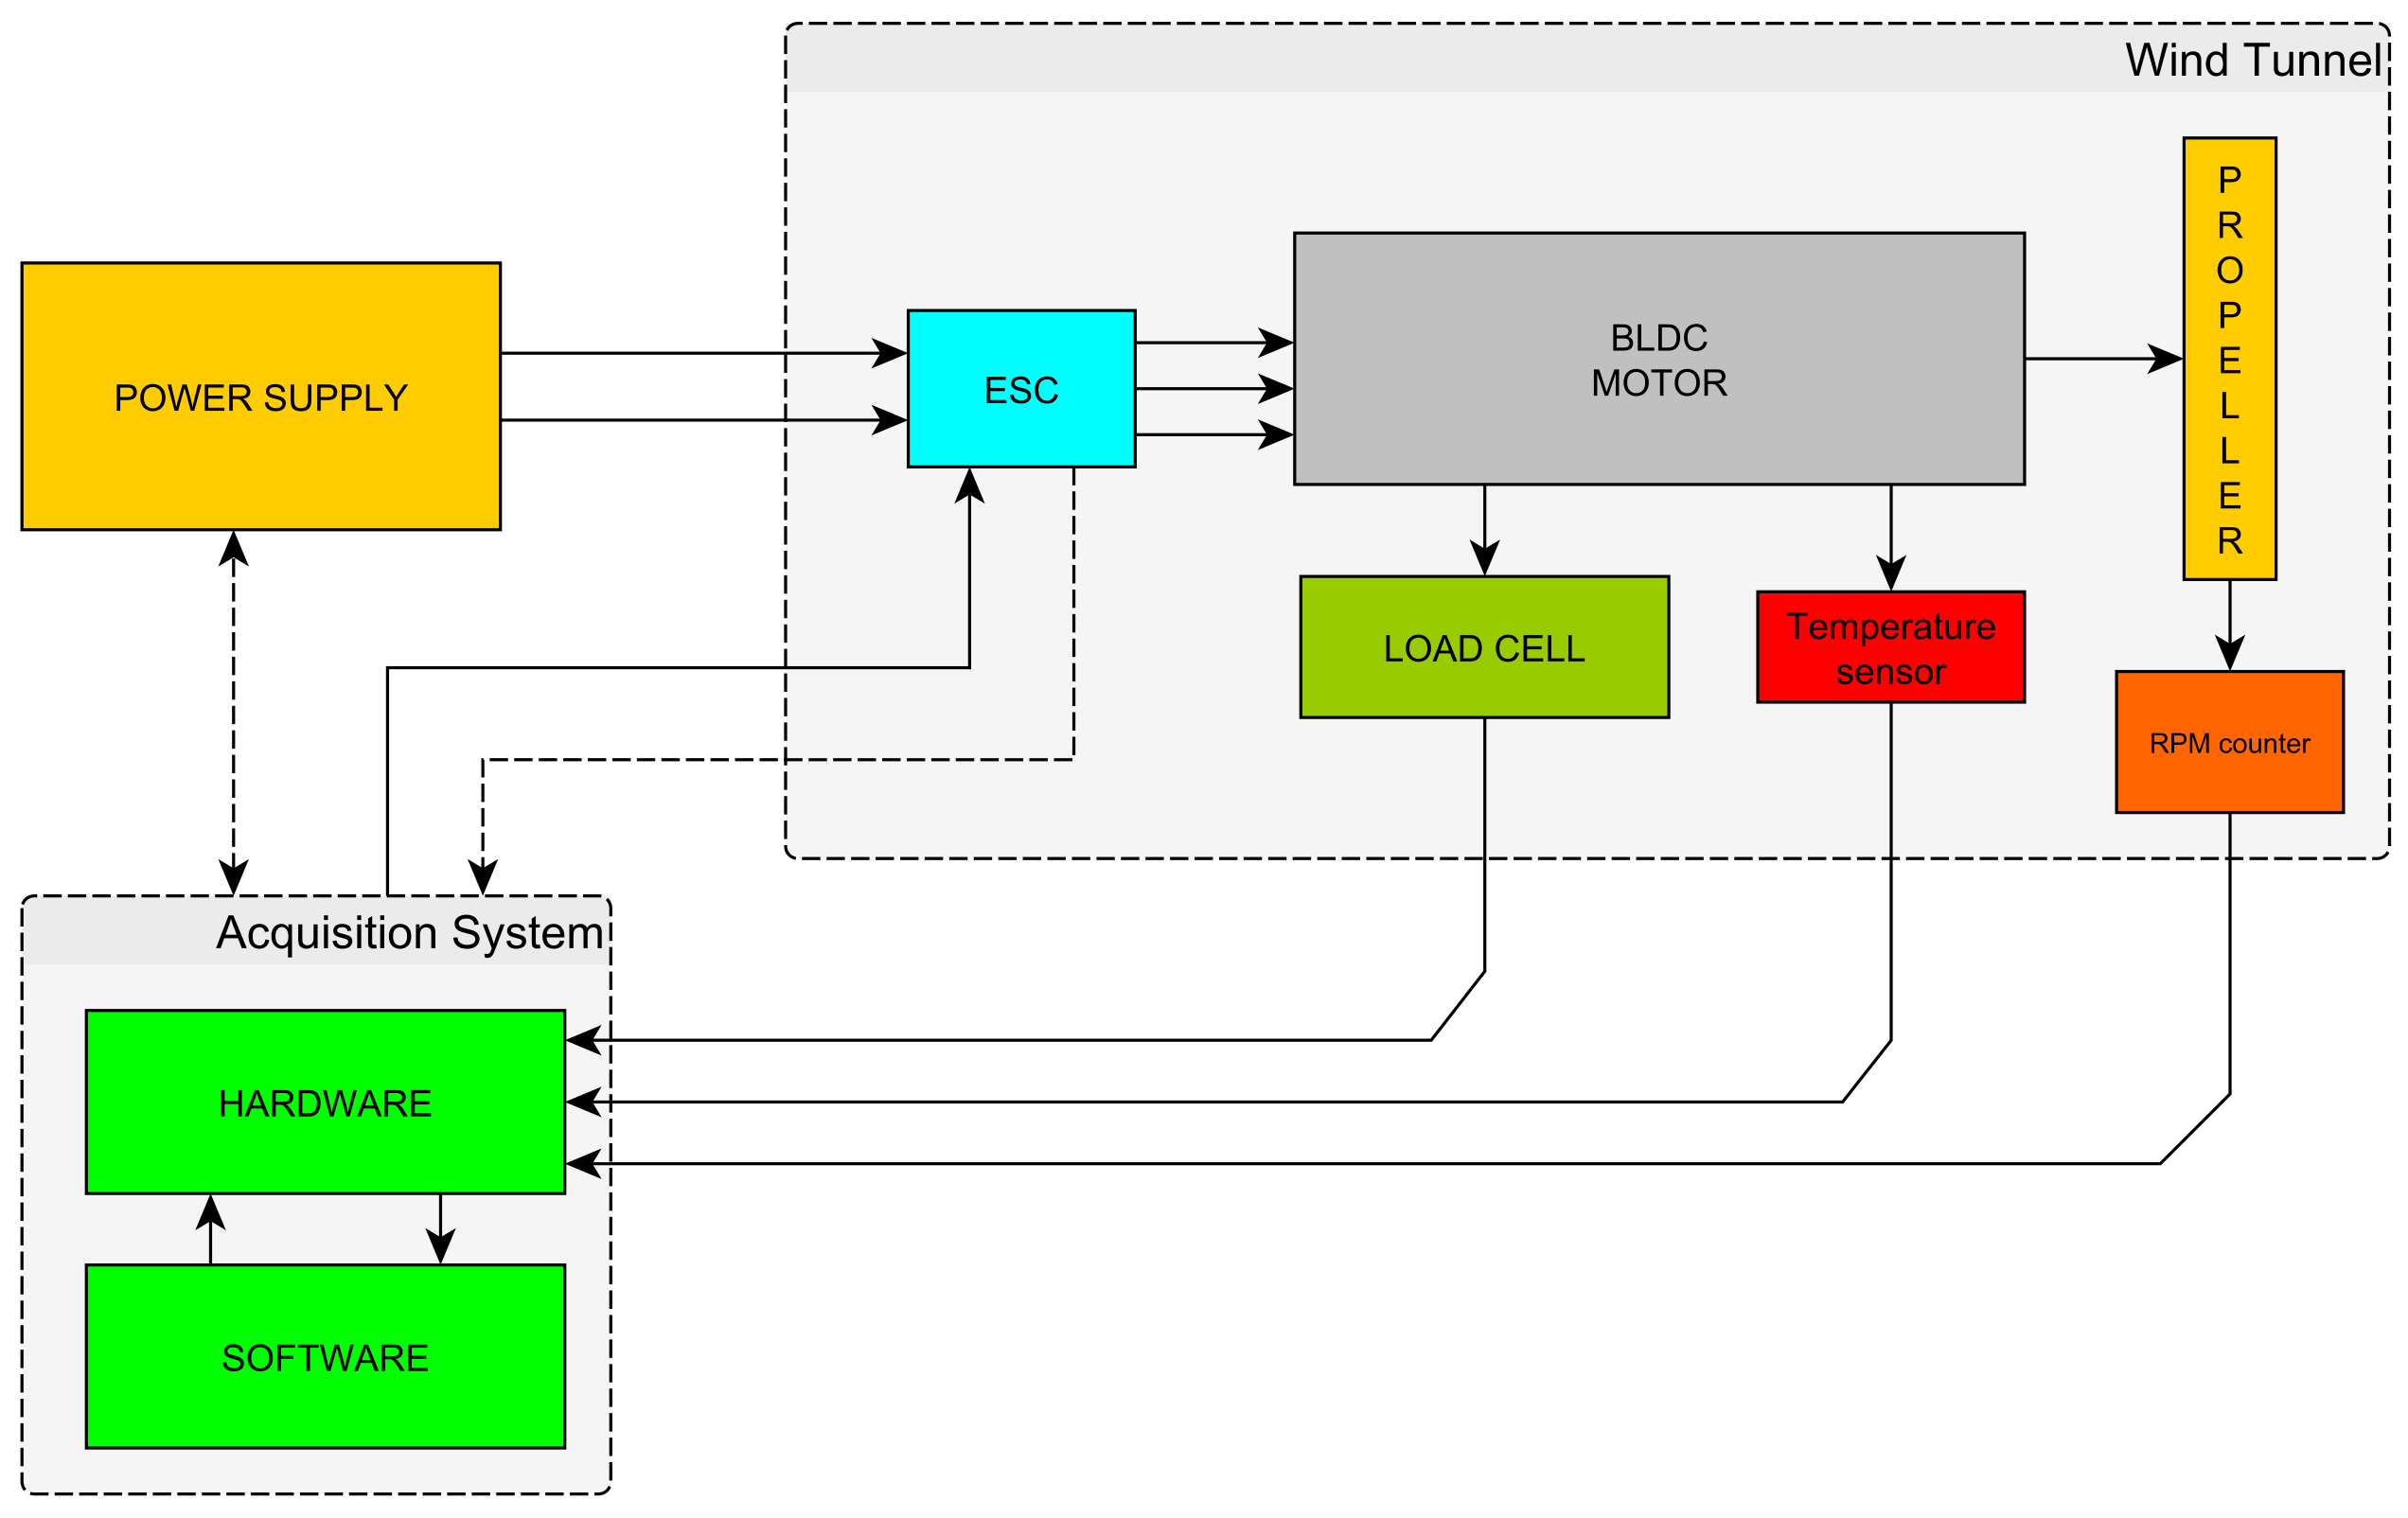
3.4. Motor Control and Data Acquisition System

A scheme for the acquisition of the motor data and RPM control is illustrated in Figure 9. The software for propulsive data acquisition and motor control has been written in LabVIEW®.
No torque meter has been installed on the motor. The shaft power and torque are calculated from the measured electrical power output of the power supply in direct current (DC) and the mechanical efficiency stated by the manufacturer. This last variable is gathered in a database built from the data provided on the manufacturer’s website [26,27]. The mechanical efficiency of the motor is represented by the iso-lines of Figure 7. Therefore, the shaft power is evaluated as:
P shaft = η motor ( RPM , I ) V p . s . I p . s .
where the electric power is the product of voltage V and direct current I from the power supply, measured with an LEM sensor. The copper losses in the cables and in the electronic speed controller (ESC) are neglected in this approximation. The ESC is an MGM Compro HBC series.

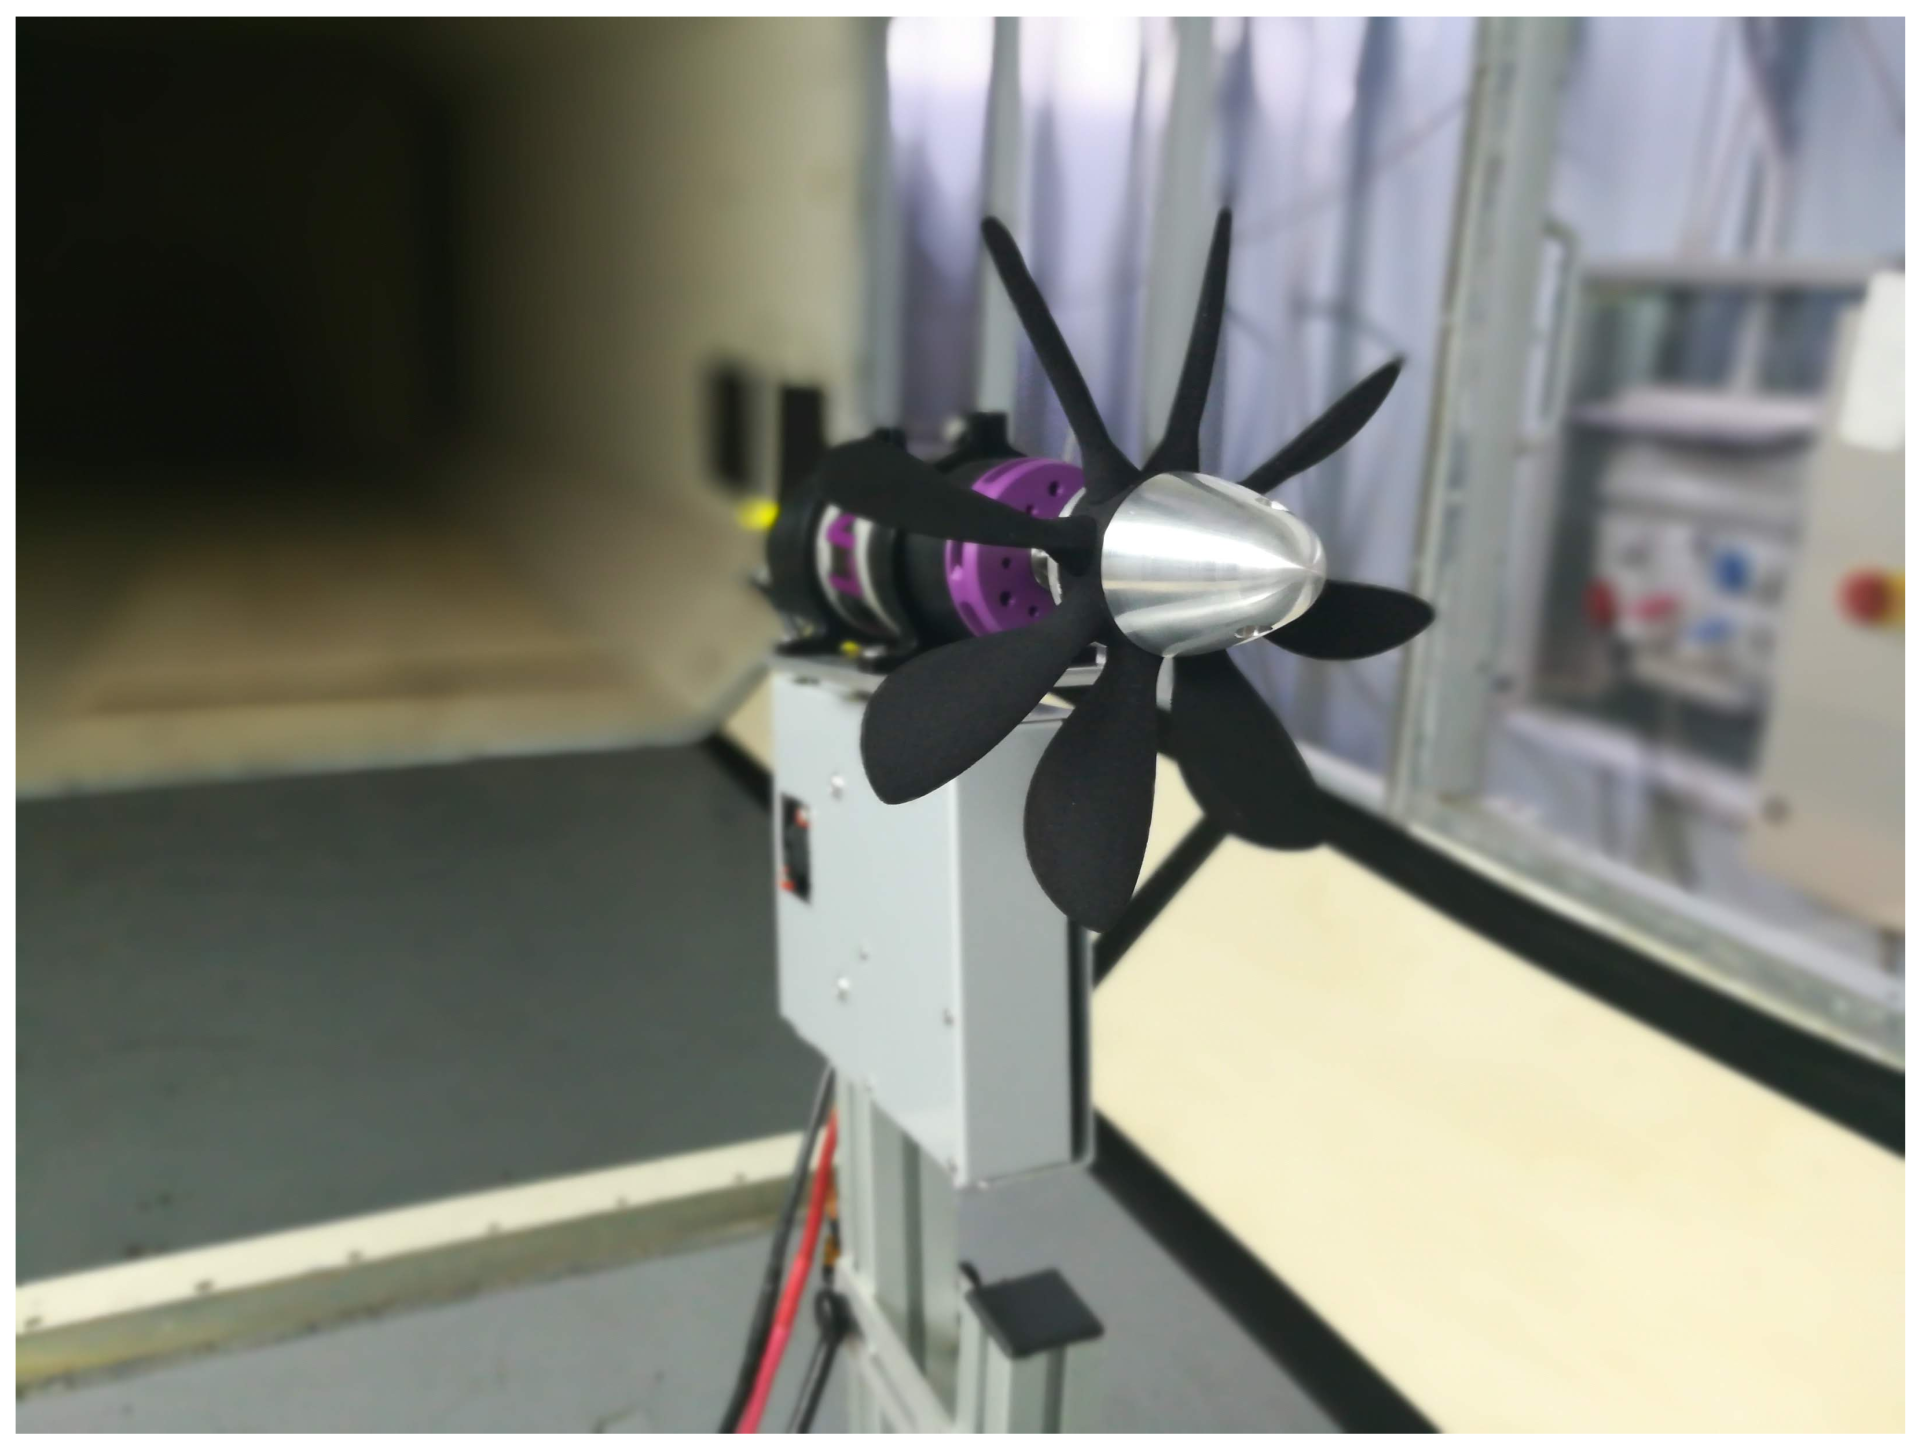
3.5. Wind Tunnel Testing

The propeller–motor assembly has been installed in the wind tunnel on an aluminum supporting frame, as shown in Figure 10. The motor is fixed on an aluminum plate by two ring clamps. This base is in turn mounted above a thin box containing the ESC, the load cell frame, and the electronics for signal conditioning. The load cell frame is made up of two S-type force cells with 10 kgf full-scale value, installed at right angles to measure propeller thrust and normal force. The motor’s base is constrained on the normal force load cell. The rest of the supporting frame is made up of FlexLink® rods to allow translation about three axes and rotation about the lateral axis to provide motor pitch. These degrees of freedom are useful when the scaled model aircraft is installed in the test section.
In the following, all the measured forces have been corrected for the motor fixture drag, evaluated in the wind tunnel by removing the propeller, but leaving the spinner, at several wind speeds and angles of attack. Therefore, the presented results are in terms of net forces. Moreover, since the ratio between the area of the propeller disk and the test section area is less than 0.01, no wind tunnel corrections have been applied. Repeated tests have shown a standard deviation of around 0.05 N for both thrust and normal force measurements.

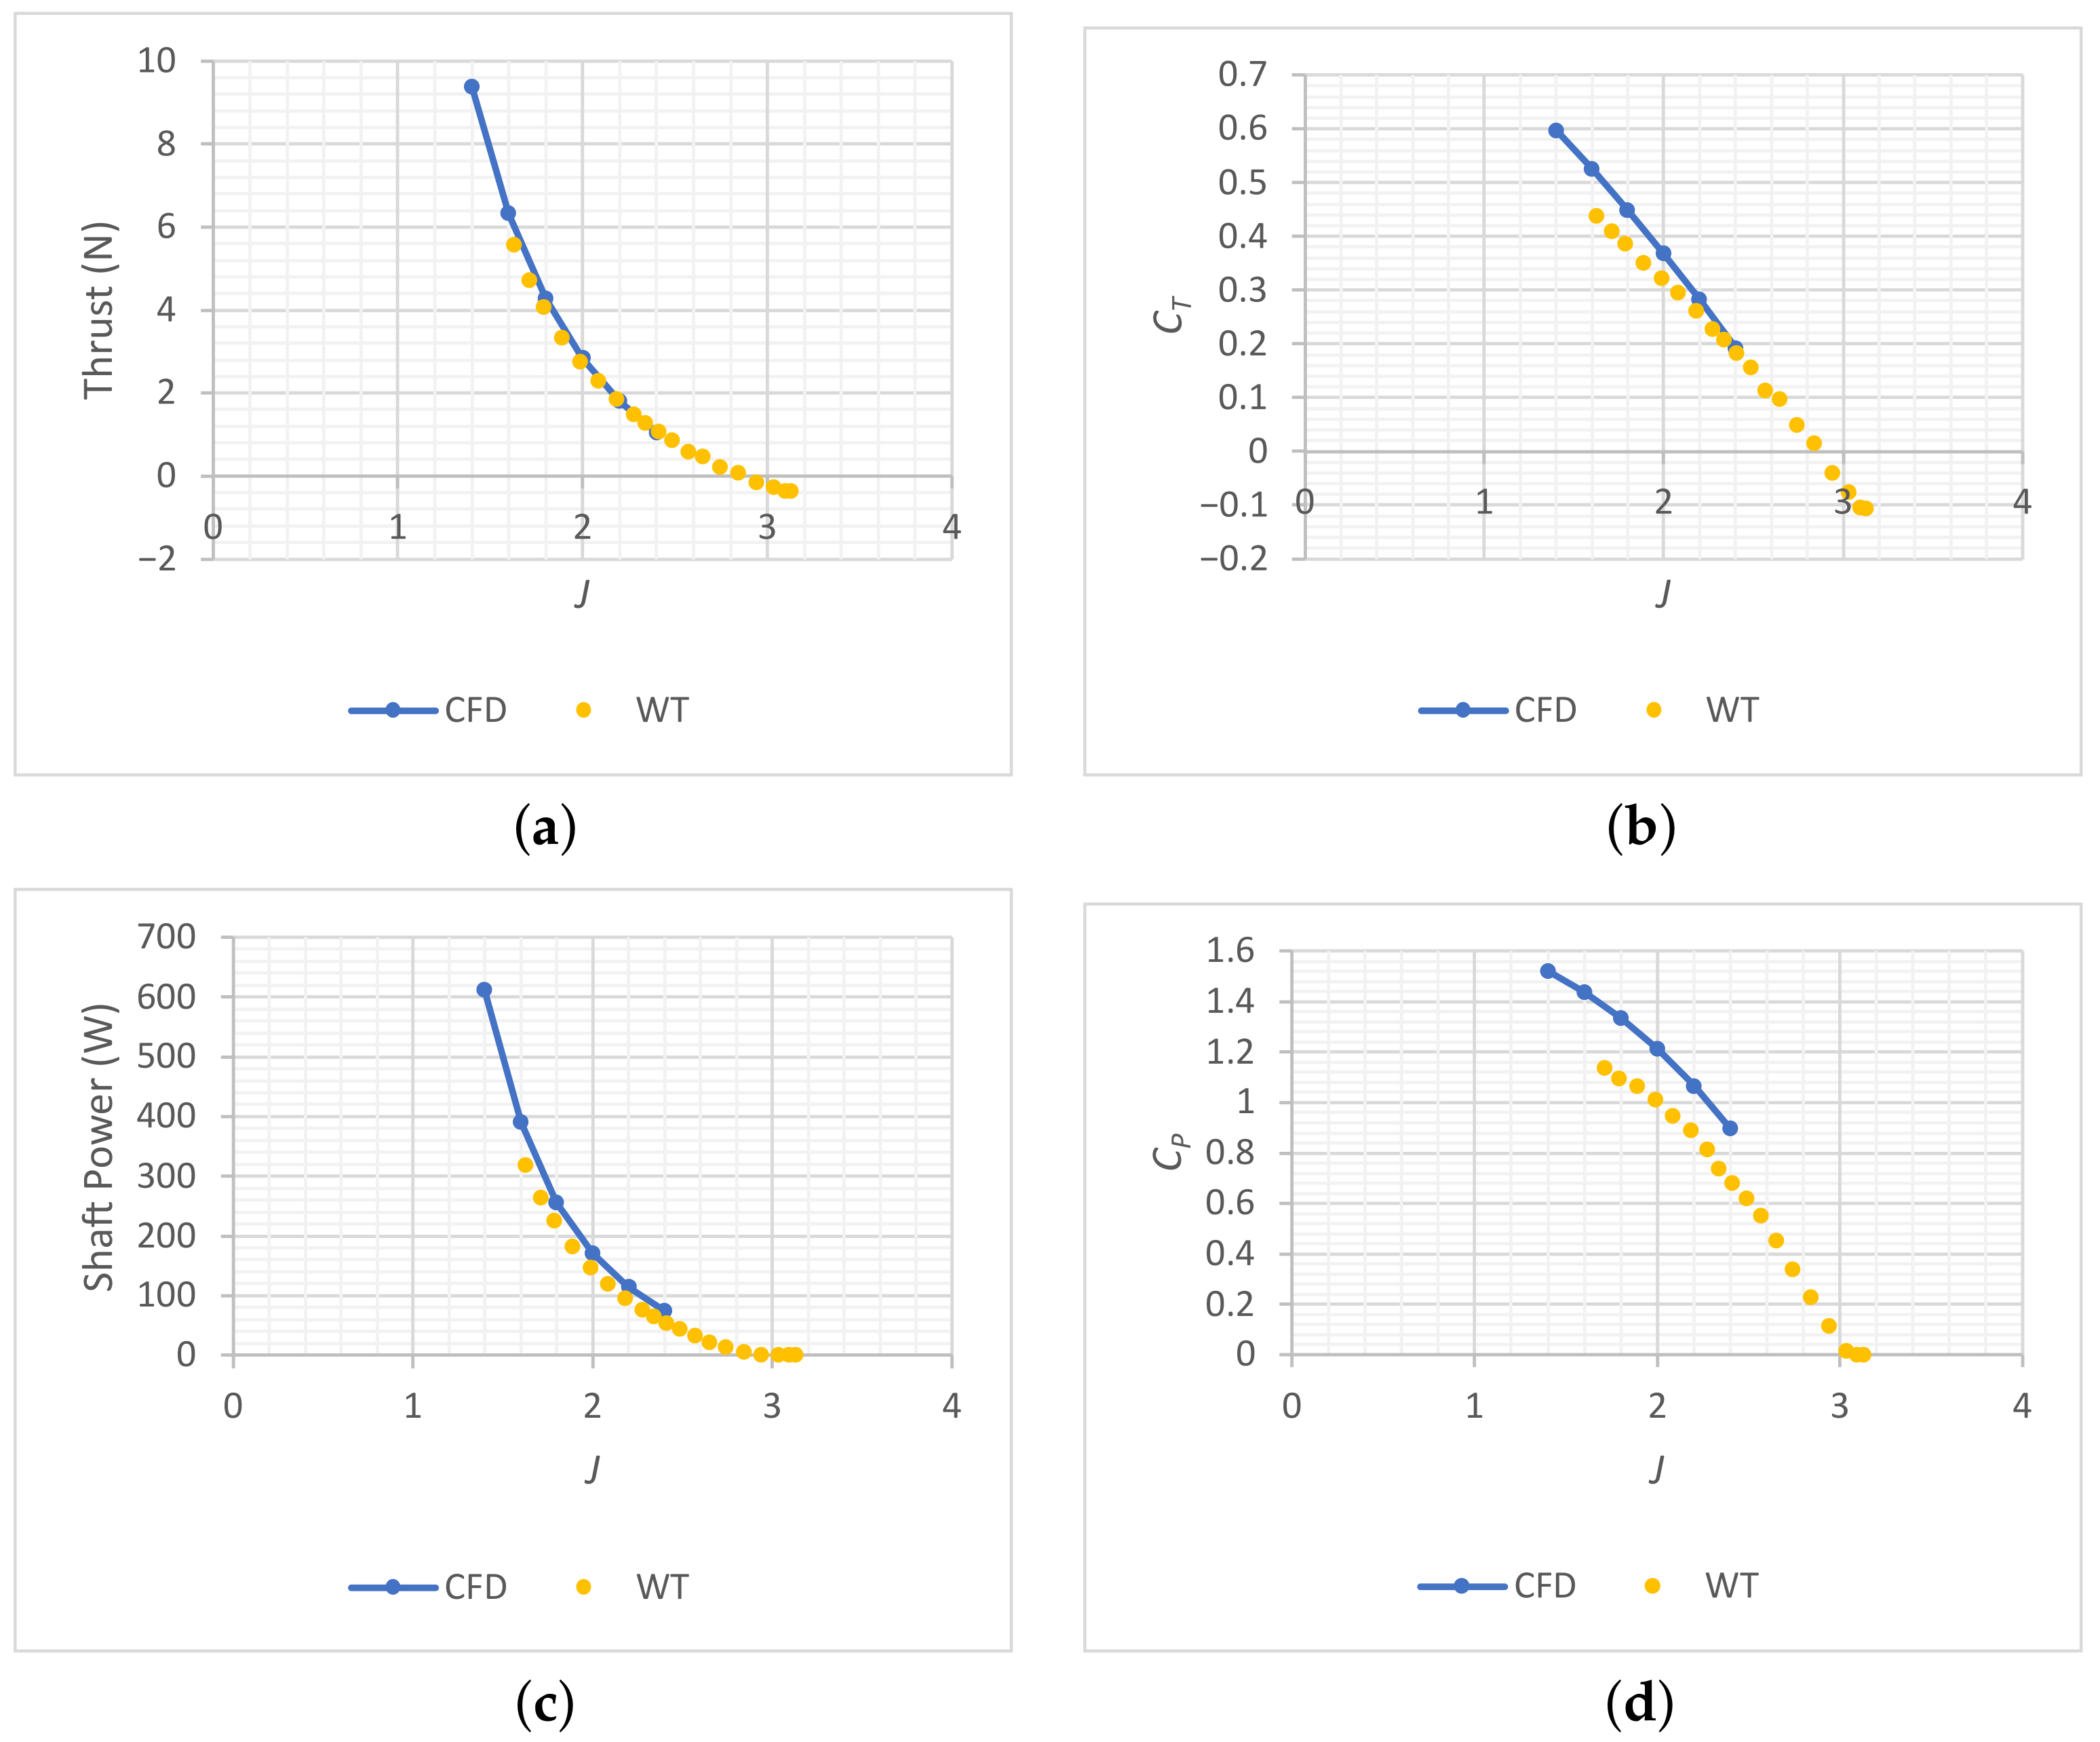
3.5.1. Propeller Measurements in Axial Flow

The main purpose of the wind tunnel tests is to validate the numerical calculations described in the previous sections. Figure 11 reports the comparison of wind tunnel data with CFD results at fixed flow speed. Therefore, the advance ratio is varied by changing the propeller’s RPM. As can be observed from the charts, the thrust is predicted with significant accuracy, while the shaft power and the torque are predicted with reasonable accuracy, with the numerical analysis providing values higher than the experiment. The respective coefficients show even larger differences, probably because of the small absolute values compared. For these reasons, the propeller efficiency is higher for the experimental test article than the numerical model.
It is again remarked that there is no torque meter installed on the test article. The shaft power and torque are calculated from the measured electrical power output of the power supply in DC and the mechanical efficiency stated by the manufacturer, as explained in Section 3.4. It is not clear if the CFD overestimates the torque and the shaft power or the calculated values from the measured electric current are underestimated. However, since the primary objective of the test campaign was matching the thrust, it can be concluded that this has been fully accomplished.

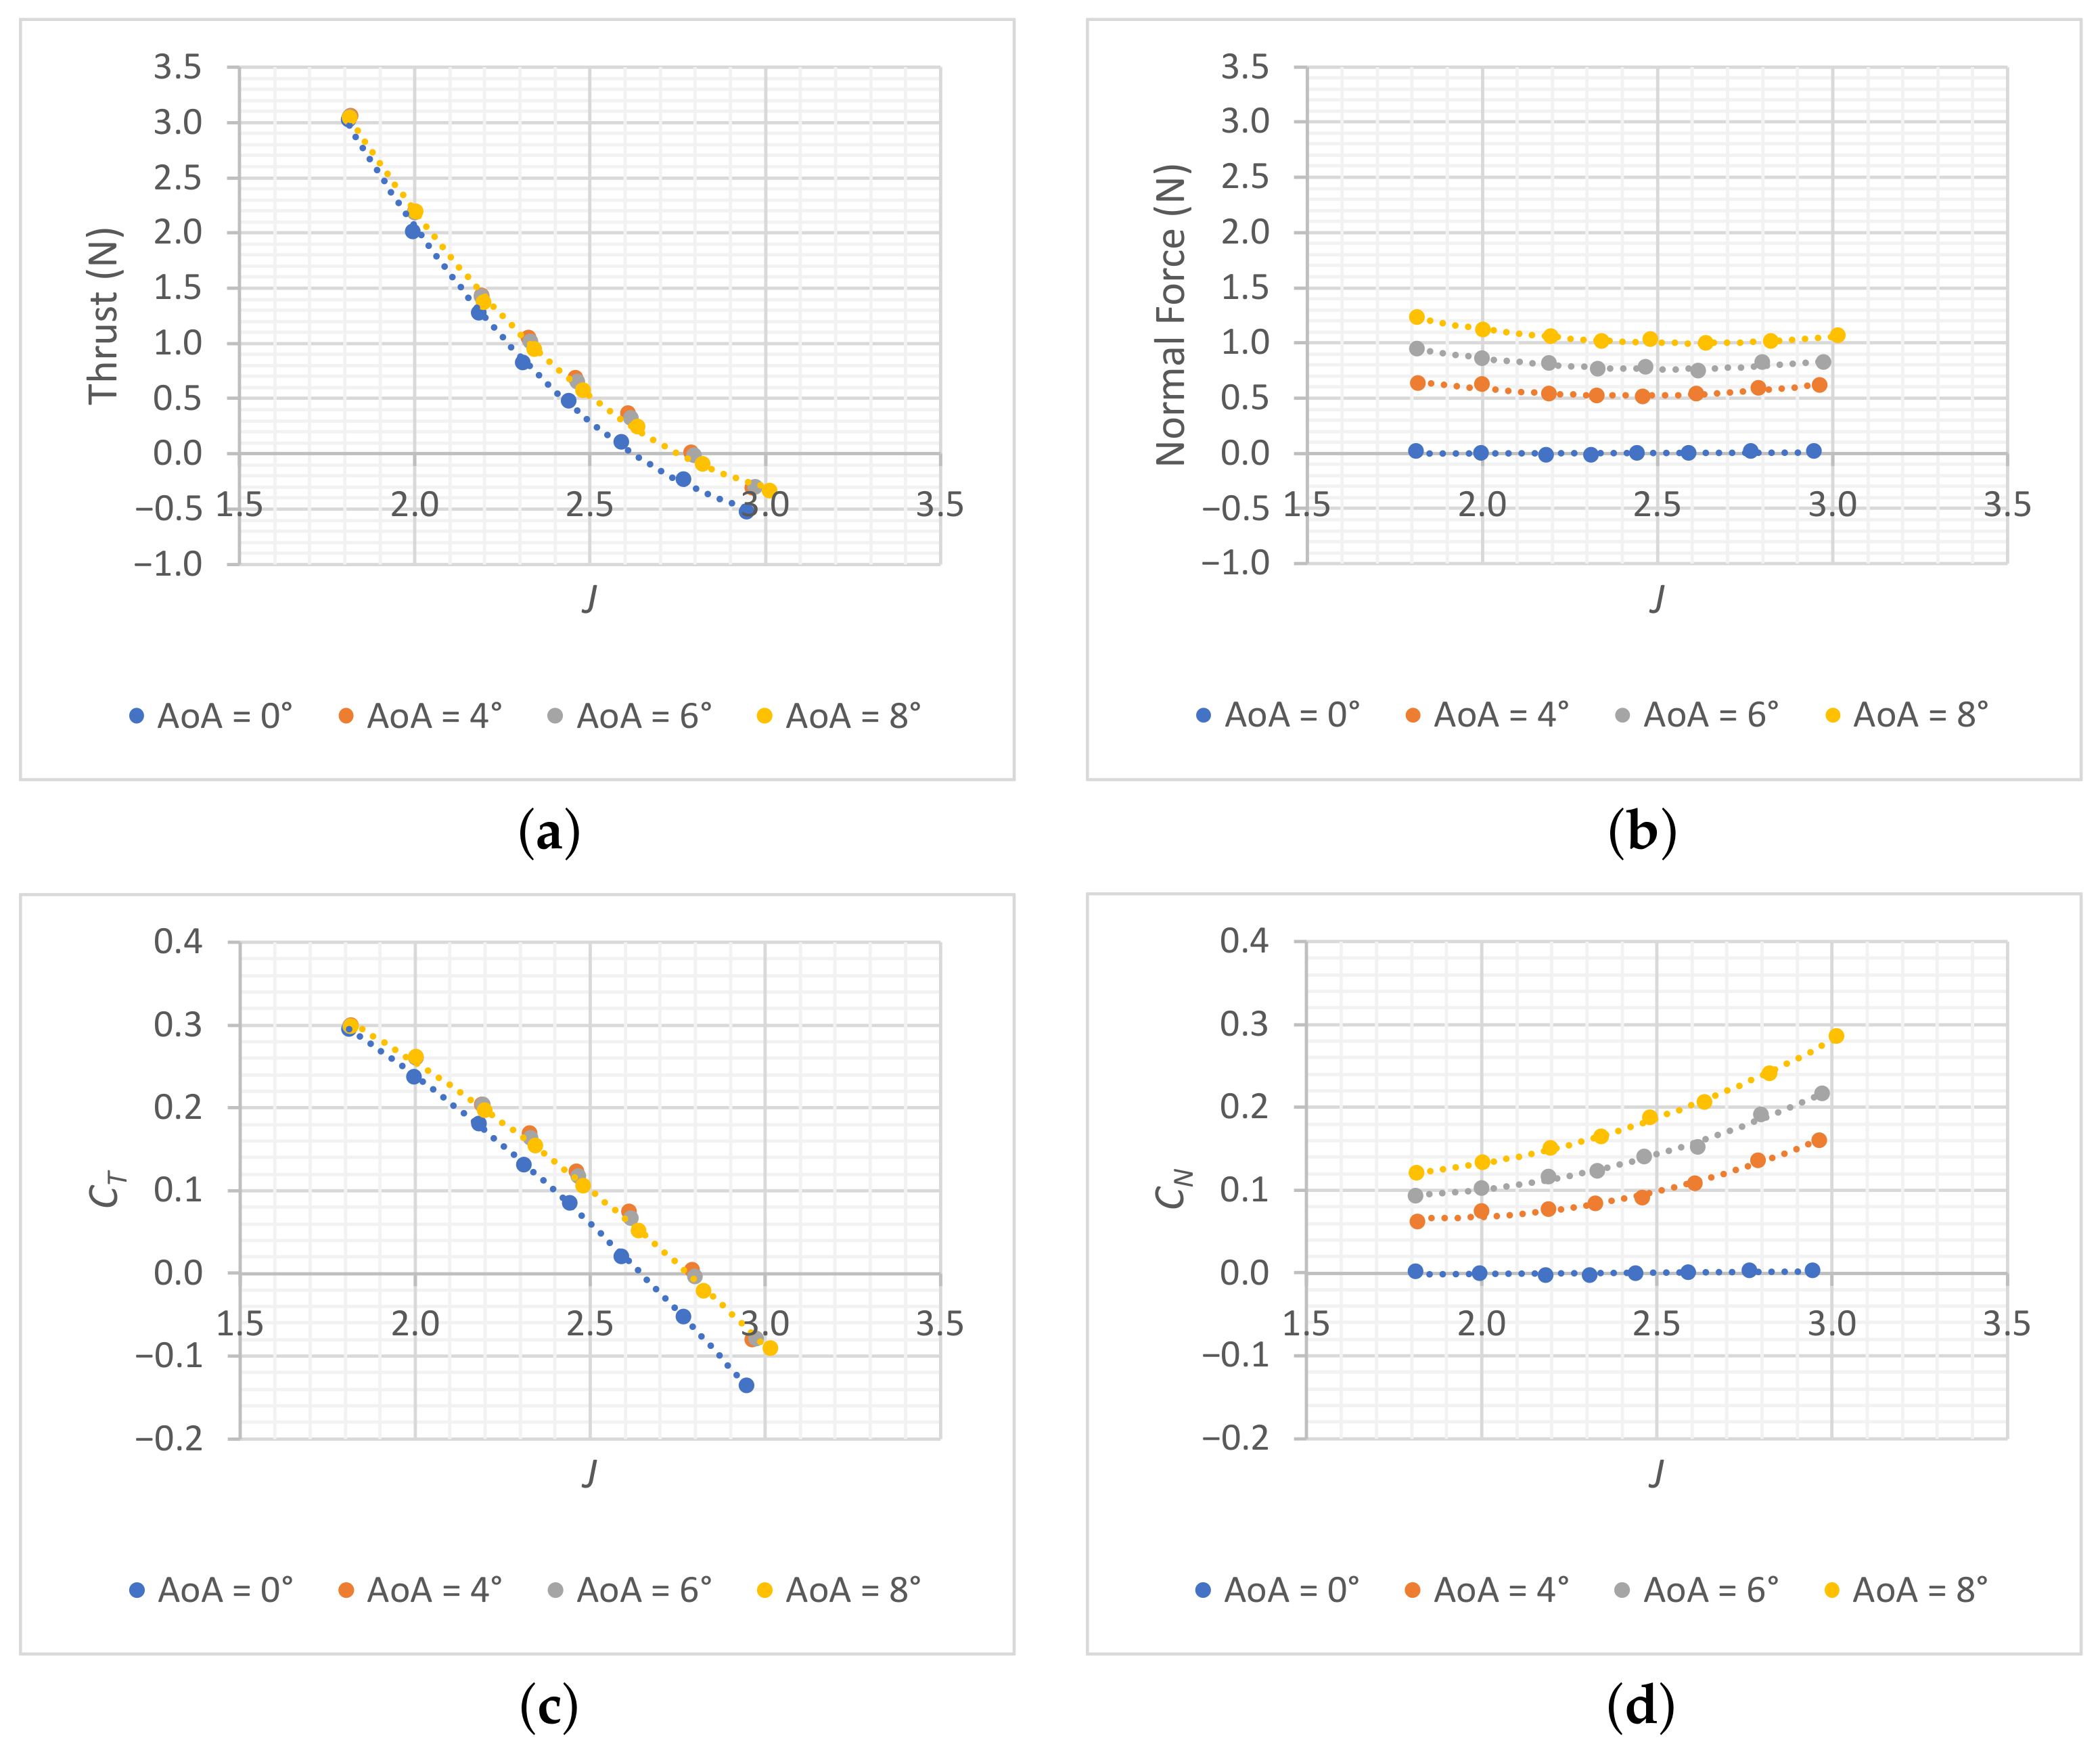
3.5.2. Effects of Angle of Attack

The remainder of the Results section is dedicated to the discussion of the effects of the angle of attack on thrust and normal force. The propeller normal force is generated by an asymmetric load distribution on the disk due to non-axial flow. Its magnitude may not be negligible, especially for small propellers rotating at high RPM. Its effects on aircraft longitudinal equilibrium and stability may be significant; therefore, its evaluation is as important as the thrust estimation.
The propeller normal force coefficient may be defined as a Renard coefficient:
C N = N ρ n 2 D 4
where N is the propeller net normal force. With this definition, both thrust and normal force coefficients have the same normalization quantities and they can be directly compared.
Results of the wind tunnel tests at V = 35 m/s and at different angles of attack are reported in Figure 12. The effects of non-axial flow on thrust are negligible, with a minor increment when increasing both the advance ratio J and angle of attack. Conversely, the effects of the latter on normal force are significant, achieving approximately one third of thrust magnitude at a moderate angle of attack, keeping an almost constant value throughout the entire investigated advance ratio range. As expected, normal force is generated also with the propeller in windmilling condition, affecting aircraft longitudinal stability even with idling engine.
As regards the normal force coefficient defined in (6), it increases with the advance ratio and inflow incidence. This means that the effects of normal force on aircraft longitudinal stability depend on both the thrust coefficient and the angle of attack, with the latter having, of course, the strongest influence.

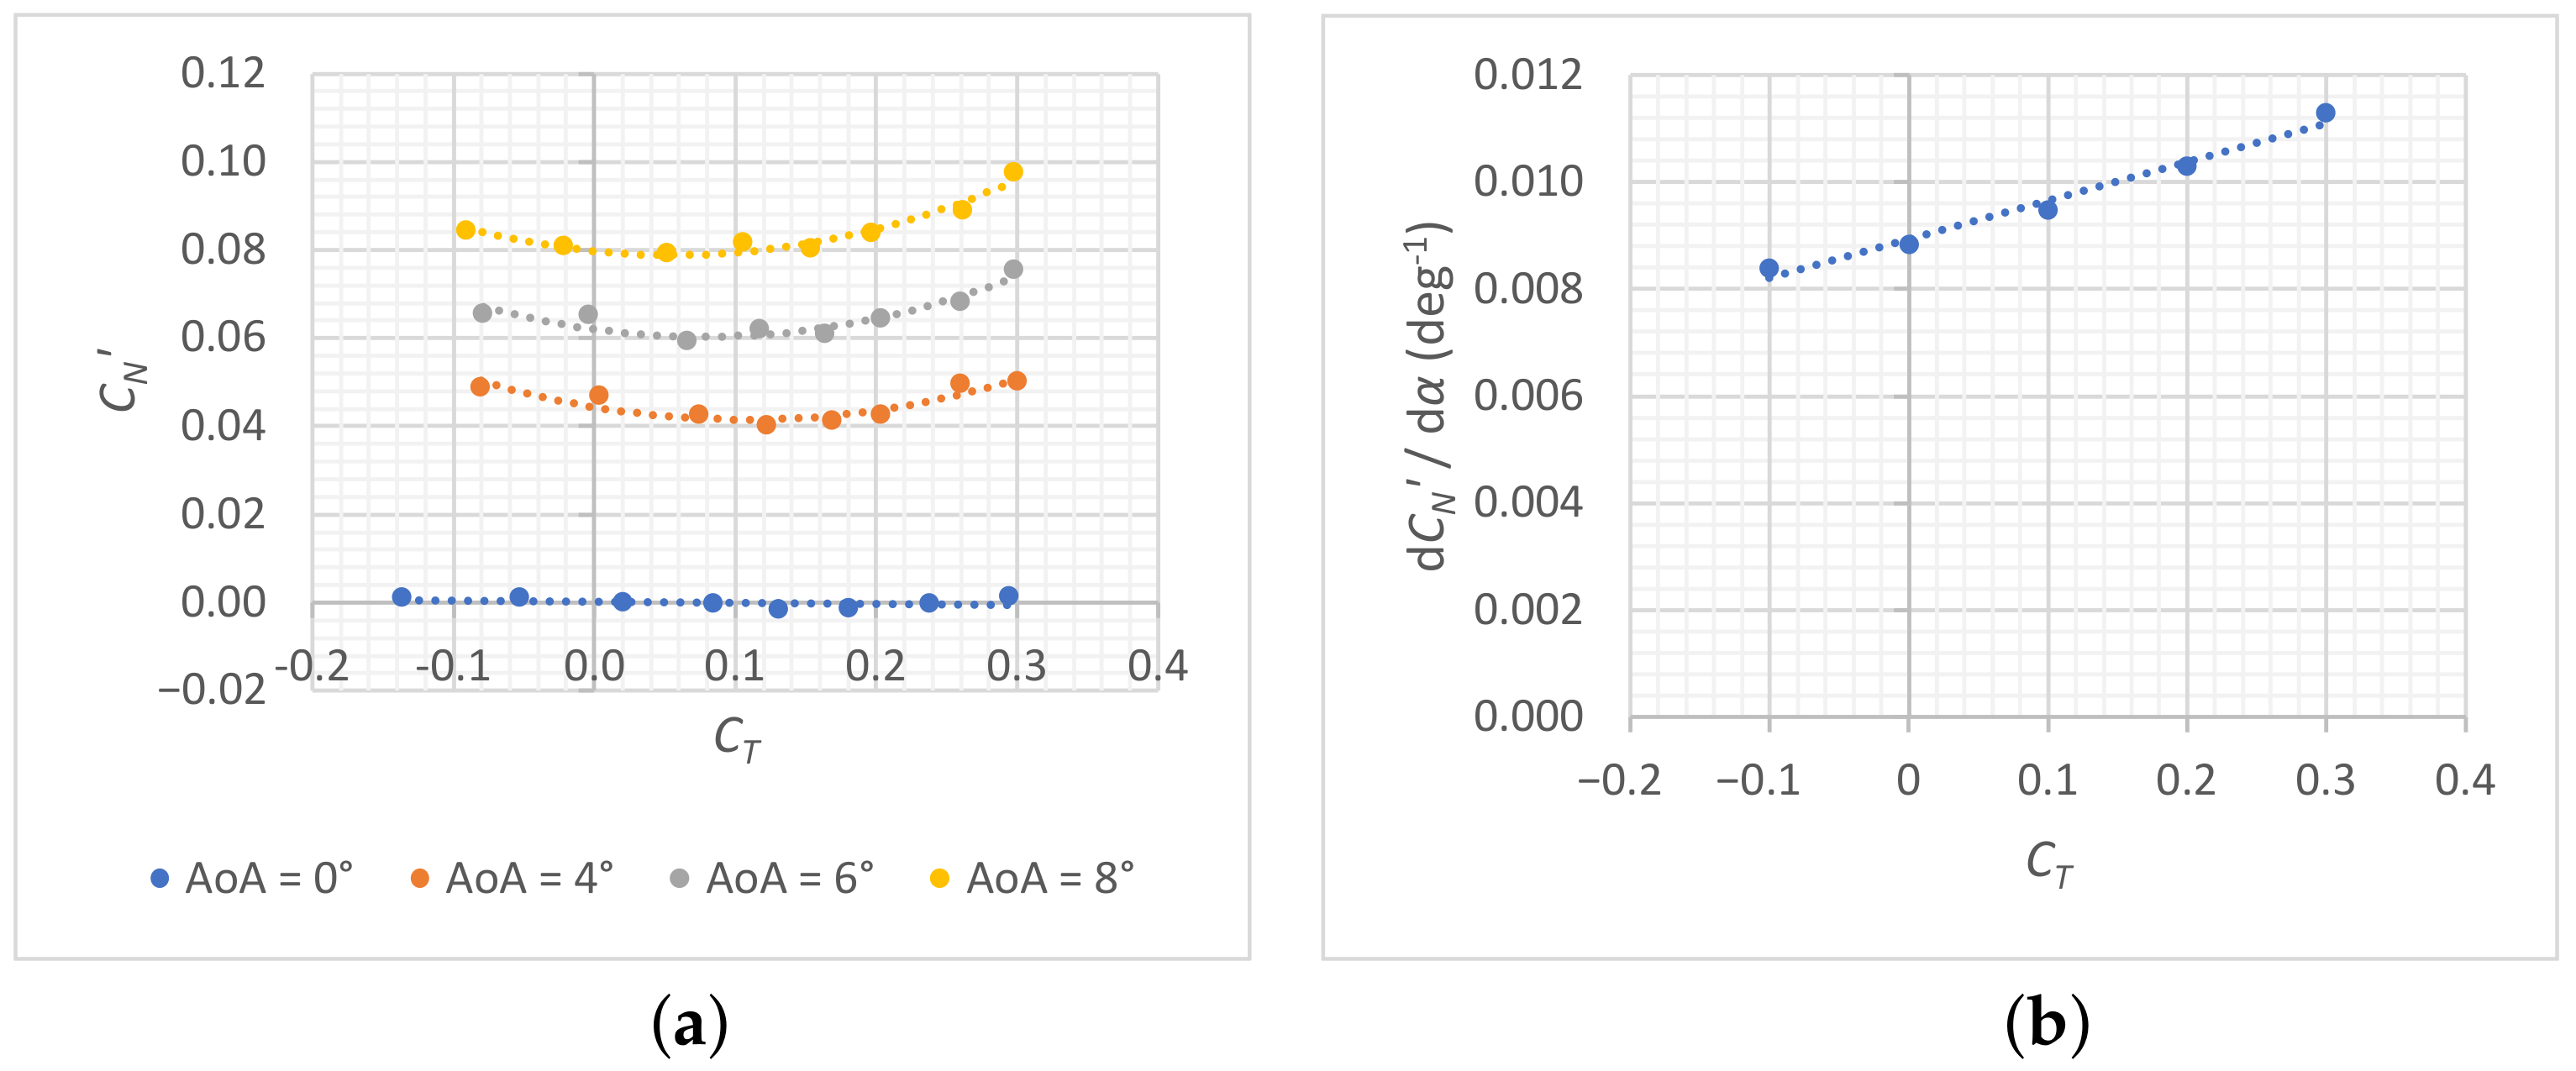
3.5.3. Estimation of Aircraft Neutral Point Shift

To predict the shift in the aircraft neutral point position x N due to propeller normal force, an alternative definition of the normal force coefficient must be given [28]:
C N = N 0.5 ρ V 2 S p
where S p = π D 2 4 is the disk area. The additional pitching moment due to the propeller normal force acting at a distance l p from the aircraft’s center of gravity can be expressed as:
C M = C N S p S l p c ¯ 1 + d ε d α
where S and c ¯ are the wing planform area and mean aerodynamic chord, respectively, l p > 0 if the propeller is ahead of the center of gravity, and d ε / d α is the upwash gradient (or downwash, if ε < 0 ). To calculate the aircraft’s neutral point shift, Equation (8) must be derived by the lift coefficient C L :
Δ x N c ¯ = d C M d C L = d C M d α 1 C L α = d C N d α S p S l p c ¯ 1 C L α 1 + d ε d α
so that a propeller placed at the tailplane—behind the center of gravity—generating an upward normal force would provide a negative pitching moment gradient, i.e., a backward shift of the neutral point. Equation (9) must be applied for each propeller and the only aerodynamic interference effect included is the upwash of the lifting surfaces.
Thus, the effect of normal force on aircraft longitudinal stability can be estimated with the evaluation of the normal force coefficient derivative with the angle of attack d C N / d α . The normal force coefficient C N can be calculated from the net normal force measurements at different angles of attack with Equation (7). Its gradient with the angle of attack can be finally estimated from the best fit lines of C N with C T and α . See Figure 13.
Observe that the trend of C N is not monotonic, but it first decreases with the advance ratio J, and then increases when the propeller achieves windmilling and braking conditions at the highest values of J. Moreover, the value of the gradient d C N / d α is not constant, but it depends on C T , and it is positive even for a windmilling or braking propeller. These results are in accordance with [28,29,30], despite the magnitude of d C N / d α being higher than the typical values reported in the literature, probably because of the propeller’s high solidity ratio.
Although this paper is dedicated to the investigation of the isolated propeller, an estimation of the expected value of the neutral point shift for the IRON aircraft scaled model can be given. From the aircraft data of [11], the following quantities have been estimated:
S p S 0.1 , l p c ¯ 4.0 , C L α 0.08 deg 1 , d ε d α 0.18
From Equation (9), assuming a d C N / d α 0.01 , the variation in aircraft longitudinal stability is approximately 4% for each propeller; hence, the neutral point moves rearward of approximately 8% of the mean aerodynamic chord. The exact value will depend on the thrust coefficient and aerodynamic interference due to the installation of the motors on the tailplane tips.

4. Conclusions

This paper has discussed the design, analysis, and testing of a small-scale propeller to be installed on the wind tunnel model of the IRON innovative, three-lifting-surface, regional turboprop aircraft. The challenge was to develop a small propeller in thrust similarity with the expected full-scale performance data, achieving a relatively high thrust coefficient within 10,000 RPM and 150 mm diameter. The design of the propeller was performed with the standard minimum energy loss approach included in XROTOR. The output geometry was modified to be strengthened at the hub junction, which was considered critical also because of the plastic material and manufacturing technique chosen. High-fidelity aerodynamic analyses were performed with STAR-CCM+® to validate the preliminary results of XROTOR and to assess the effects of the blade root modifications. The agreement between CFD and XROTOR results is in the expected 10% range of difference, with acceptable performance of the propeller in terms of thrust, power, and efficiency.
Once manufactured, the propeller has been installed on a support frame instrumented with load cells and other utility sensors to acquire rotational rate, thrust, and normal force in the wind tunnel test section. The measurements have been purged of the support frame aerodynamic forces, yielding the net propeller forces, which have been compared with CFD results. There is very good agreement on thrust, while torque and power are less accurate because their experimental values have not been directly measured, but estimated from the motor map derived from the manufacturer’s data and the measured electric power absorbed by the propulsive system.
Propeller normal force was not predicted numerically, but only investigated experimentally. Test data have shown an expected behavior, with the propeller providing a significant normal force at a moderate angle of attack, even in windmilling condition. Moreover, with the data of previous wind tunnel tests performed by the authors on the unpowered aircraft, an estimation of the neutral point shift due to the propeller location has been made. Since the change in aircraft longitudinal stability should be around 8% due to only the normal force direct effect, although beneficial for this innovative aircraft configuration, it is here remarked how the propeller’s in-plane forces must be accurately predicted to avoid unexpected or unsafe behavior of the aircraft.

Author Contributions

Conceptualization, D.C.; methodology, D.C.; software, D.C.; validation, D.C.; formal analysis, D.C.; investigation, D.C.; resources, F.N.; data curation, D.C.; writing—original draft preparation, D.C.; writing—review and editing, D.C.; visualization, D.C. and F.N.; supervision, F.N.; project administration, F.N.; funding acquisition, F.N. All authors have read and agreed to the published version of the manuscript.

Funding

The IRON project has received funding from the Clean Sky 2 Joint Undertaking under the European Union Horizon 2020 research and innovation program under Grant Agreement No. 807089 Aerospace 09 00264 i001 .

Institutional Review Board Statement

Not applicable.

Informed Consent Statement

Not applicable.

Data Availability Statement

Not applicable.

Acknowledgments

The authors are grateful to the partners of the IRON consortium for their contributions and feedback.

Conflicts of Interest

The authors declare no conflict of interest. The funders had no role in the design of the study; in the collection, analyses, or interpretation of data; in the writing of the manuscript, or in the decision to publish the results.

Abbreviations

The following abbreviations and symbols are used in this manuscript:
CADComputer-aided design
CFDComputational fluid dynamics
DCDirect current
ESCElectronic speed controller
IRONInnovative turboprop aircraft configuration
MILMinimum induced loss
MRFMoving reference frame
RANSReynolds-Averaged Navier–Stokes
RPMRevolutions per minute
UAVUnmanned aerial vehicle
α Angle of attack
β Propeller pitch
ε Angle of upwash
η Propeller efficiency
ρ Free-stream flow density
σ 3 / 4 Propeller solidity ratio
Ω Propeller angular speed
B Γ / 2 π λ w V R Non-dimensional blade circulation
c ¯ Wing mean aerodynamic chord
C Blade section lift coefficient
C L Aircraft lift coefficient
C L α Lift coefficient gradient with angle of attack
C M Aircraft pitching moment coefficient
C N Propeller normal force coefficient
C N Propeller alternative normal force coefficient
C P Propeller power coefficient
C T Propeller thrust coefficient
DPropeller diameter
hAltitude
IElectric current
JPropeller advance ratio
K v Electric motor constant in RPM/Volt
l p Propeller horizontal moment arm
MMach number
NPropeller normal force
nPropeller rotational rate in s−1 (revolutions per second)
PPropeller (shaft) power
P c Propeller alternative power coefficient
RPropeller radius
rPropeller blade station
SReference wing planform area
S p Propeller disk area
TPropeller thrust
T c Propeller alternative thrust coefficient
V Free-stream flow speed
x N Aircraft neutral point position

Appendix A. XROTOR Propeller Geometry

The geometric data of the propeller designed by XROTOR are reported in Table A1.
Table A1. XROTOR geometric data.
Non-Dimensional Station r / R Non-Dimensional Chord c / R Geometric Pitch Angle β (deg)
0.2420.15980.76
0.2530.16180.20
0.2720.17079.06
0.2990.18877.40
0.3300.21475.31
0.3660.24372.95
0.4030.27270.43
0.4420.30067.85
0.4820.32465.29
0.5220.34362.80
0.5610.35860.44
0.6000.36958.25
0.6380.37456.22
0.6740.37554.35
0.7100.37352.65
0.7440.36651.10
0.7760.35649.69
0.8060.34248.42
0.8350.32547.27
0.8620.30646.25
0.8860.28445.34
0.9080.26044.53
0.9280.23443.83
0.9460.20743.22
0.9610.17842.71
0.9740.14842.29
0.9840.11741.96
0.9920.08741.71
0.9970.05741.55
0.9990.03541.47

Appendix B. Propeller Blade Loads

In this section, the propeller blade loads evaluated with STAR-CCM+® for the original and the modified designs are shown in Figure A1. The effects of the circular section on the load distributions are apparent.
Figure A1. Numerical blade distributions: (a) aerodynamic loading on the original blade; (b) aerodynamic loading on the modified blade; (c) profile lift coefficient on the original blade; (d) profile lift coefficient on the modified blade.
Aerospace 09 00264 g0a1

References

  1. ICAO. Effects of Novel Coronavirus (COVID-19) on Civil Aviation: Economic Impact Analysis. Available online: https://www.icao.int/sustainability/Pages/Economic-Impacts-of-COVID-19.aspx (accessed on 23 March 2022).
  2. BOEING. Commercial Market Outlook 2021–2040. Available online: https://www.boeing.com/commercial/market/commercial-market-outlook/ (accessed on 23 March 2022).
  3. AIRBUS. Airbus Global Market Forecast 2021–2040. Available online: https://www.airbus.com/en/products-services/commercial-aircraft/market/global-market-forecast (accessed on 23 March 2022).
  4. FAA. FAA Aerospace Forecast 2021–2041. Available online: https://www.faa.gov/data_research/aviation/aerospace_forecasts/ (accessed on 23 March 2022).
  5. ATR. Turboprop Market Forecast 2018–2037. Available online: https://perma.cc/X4VZ-JKW8 (accessed on 30 April 2021).
  6. Embraer, S.A. Embraer Market Outlook 2021. Available online: https://www.embraermarketoutlook2021.com/ (accessed on 23 March 2022).
  7. Babikian, R.; Lukachko, S.P.; Waitz, I.A. The Historical Fuel Efficiency Characteristics of Regional Aircraft From Technological, Operational, and Cost Perspectives. J. Air Transp. Manag. 2002, 8, 389–400. [Google Scholar] [CrossRef] [Green Version]
  8. Corcione, S.; Nicolosi, F.; Della Vecchia, P.; Ciliberti, D.; Cusati, V. High Lift Aerodynamic characteristics of a Three Lifting Surfaces Turboprop Aircraft. In Proceedings of the AIAA Aviation 2019 Forum, Dallas, TX, USA, 17–21 June 2019. [Google Scholar] [CrossRef]
  9. Nicolosi, F.; Corcione, S.; Trifari, P.; De Marco, A. Design and Optimization of a Large Turboprop Aircraft. Aerospace 2021, 5, 132. [Google Scholar] [CrossRef]
  10. Cusati, V.; Nicolosi, F.; Corcione, S.; Ciliberti, D.; Della Vecchia, P. Longitudinal Stability Issues Including Propulsive Effects on an Innovative Commercial Propeller-Driven Aircraft. In Proceedings of the AIAA Aviation 2019 Forum, Dallas, TX, USA, 17–21 June 2019. [Google Scholar] [CrossRef]
  11. Cusati, V.; Corcione, S.; Ciliberti, D.; Nicolosi, F. Design Evolution and Wind Tunnel Tests of a Three-Lifting Surface Regional Transport Aircraft. Aerospace 2022, 9, 133. [Google Scholar] [CrossRef]
  12. Larrabee, E.E. Practical Design of Minimum Induced Loss Propellers. SAE Trans. 1979, 88, 2053–2062. [Google Scholar] [CrossRef]
  13. Adkins, C.N.; Liebeck, R.H. Design of Optimum Propellers. J. Propuls. Power 1994, 10, 5. [Google Scholar] [CrossRef]
  14. Wald, Q.R. The Aerodynamics of Propellers. Prog. Aerosp. Sci. 2006, 42, 2. [Google Scholar] [CrossRef]
  15. Youngren, H.; Chang, M. Test, Analysis and Design of Propeller Propulsion Systems for MAVs. In Proceedings of the 49th AIAA Aerospace Sciences Meeting including the New Horizons Forum and Aerospace Exposition, Orlando, FL, USA, 4–7 January 2011. [Google Scholar] [CrossRef]
  16. Drela, M. XROTOR. Available online: https://web.mit.edu/drela/Public/web/xrotor/ (accessed on 23 March 2022).
  17. Drela, M. XFOIL. Available online: https://web.mit.edu/drela/Public/web/xfoil/ (accessed on 23 March 2022).
  18. Smedresman, A.; Yeo, D.; Shyy, W. Design, Fabrication, Analysis, and Testing of a Micro Air Vehicle Propeller. In Proceedings of the 29th AIAA Applied Aerodynamics Conference, Honululu, HI, USA, 27–30 June 2011. [Google Scholar] [CrossRef] [Green Version]
  19. Klein, P. Parametric Modeling and Optimization of Advanced Propellers for Next-Generation Aircraft. Master’s Thesis, Delft University of Technology, Delft, The Netherlands, 31 August 2017. [Google Scholar]
  20. Bergmann, O.; Goetten, F.; Braun, C.; Janser, F. Comparison and Evaluation of Blade Element Methods Against RANS Simulations and Test Data. In Proceedings of the Deutscher Luft- und Raumfahrtkongress—DLRK 2020, Virtual. 1–3 September 2020. [Google Scholar]
  21. Bass, R.M. Techniques of Model Propeller Testing. In Proceedings of the Business Aircraft Meeting and Exposition, Wichita, KS, USA, 12–15 April 1983. [Google Scholar] [CrossRef]
  22. Bass, R.M. Small Scale Wind Tunnel Testing of Model Propellers. In Proceedings of the 24th AIAA Aerospace Science Meeting, Reno, NV, USA, 6–9 January 1986. [Google Scholar] [CrossRef] [Green Version]
  23. Brandt, J.B.; Selig, M.S. Propeller Performance Data at Low Reynolds Numbers. In Proceedings of the 49th AIAA Aerospace Sciences Meeting, Orlando, FL, USA, 4–7 January 2011. [Google Scholar] [CrossRef] [Green Version]
  24. Deters, R.W.; Ananda, G.K.; Selig, M.S. Reynolds Number Effects on the Performance of Small-Scale Propellers. In Proceedings of the 32nd AIAA Applied Aerodynamics Conference, Atlanta, GA, USA, 16–20 June 2014. [Google Scholar] [CrossRef] [Green Version]
  25. Barlow, J.B.; Rae, W.H.; Pope, A. Low-Speed Wind Tunnel Testing, 3rd ed.; Wiley: New York, NY, USA, 1999; pp. 537–540. [Google Scholar]
  26. Lehner Motoren Technik. Motor Calculator and Performance Diagram. Available online: https://www.lehner-motoren.com/rechn_en.php (accessed on 23 March 2022).
  27. Ciliberti, D. Lehner Motor Map. Available online: https://github.com/dciliberti/lehner-motoren-map (accessed on 5 April 2022).
  28. Perkins, C.D.; Hage, R.E. Airplane Performance Stability and Control, 1st ed.; John Wiley & Sons: New York, NY, USA, 1949; pp. 231–242. [Google Scholar]
  29. De Young, J. Propeller at high incidence. J. Aircr. 1965, 2, 3. [Google Scholar] [CrossRef]
  30. Ribner, H.S. Propellers in yaw. NACA Wartime Rep. 1943, ARR 3L09. [Google Scholar]
Figure 1. An illustration of the scaled aircraft model [11] with rear-mounted engines.
Aerospace 09 00264 g001
Figure 2. Propeller design workflow.
Aerospace 09 00264 g002
Figure 3. XROTOR design output: (a) blade data; (b) propeller planform.
Aerospace 09 00264 g003
Figure 4. Comparison between original and modified propellers: (a) modified blade geometry, which is blended to a circular cross-section at root; (b) highlighted areas indicate difference in design visible from planform view.
Aerospace 09 00264 g004
Figure 5. CFD analysis: (a) computational domain; (b) mesh; (c) vorticity scene.
Aerospace 09 00264 g005
Figure 6. Propeller analysis, comparison between XROTOR and CFD results: (a) thrust coefficient; (b) power coefficient; (c) propeller efficiency; (d) legend.
Aerospace 09 00264 g006
Figure 7. Lehner 2280/40 motor map: torque vs. RPM, contour of motor efficiency.
Aerospace 09 00264 g007
Figure 8. Lehner 2280/40 motor map: current vs. RPM, contour of motor power.
Aerospace 09 00264 g008
Figure 9. Motor control and data acquisition scheme.
Aerospace 09 00264 g009
Figure 10. The propeller installed in the wind tunnel.
Aerospace 09 00264 g010
Figure 11. Wind tunnel (WT) data, comparison with CFD results at V = 35 m/s: (a) thrust; (b) thrust coefficient; (c) power; (d) power coefficient; (e) torque; (f) propeller efficiency.
Aerospace 09 00264 g011aAerospace 09 00264 g011b
Figure 12. Experimental measurements of the effects of non-axial flow: (a) on propeller thrust; (b) on propeller normal force; (c) on propeller thrust coefficient; (d) on propeller normal force coefficient.
Aerospace 09 00264 g012
Figure 13. Evaluation of propeller in-plane forces with thrust and angle of attack: (a) alternative definition of the normal force coefficient with Equation (7); (b) combined effect of angle of attack and thrust coefficient.
Aerospace 09 00264 g013
Table 1. Desired propeller coefficients.
J C T C P η
1.460.5901.1260.77
1.950.4761.1520.81
Table 2. Scaled propeller performance requirements ( D = 146 mm , V = 35 m / s ).
JRPMT (N)P (W)
1.4698018.8403
1.9573514.0174
Table 3. Assigned XROTOR input data.
N Blades V (m/s)D (m)RPMT (N)
8350.146980010
Publisher’s Note: MDPI stays neutral with regard to jurisdictional claims in published maps and institutional affiliations.

