Abstract
Airborne self-collisions occur primarily in military aircraft because of external stores and are frequently experienced by personnel operating these aircraft. In most cases, objects causing self-collisions are irregularly shaped and unstable. Consequently, the trajectories of these objects are uncertain. A framework for the probabilistic risk analysis of aircraft self-collisions is proposed in this study. Based on the probabilistic trajectory prediction model, methods for estimating the probability of collision (POC) and the corresponding risks were developed. Subsequently, a self-collision event involving an ejected gun shell was analyzed as a case study. A model considering random shell rotation, which continuously changes the drag characteristics and trajectories, was developed. Other uncertain factors associated with the aircraft and shell cases were considered. The most influential factors were selected based on the sensitivity analysis and were then used to calibrate the likelihood of the event using historical data. A Monte Carlo simulation, in conjunction with the probabilistic ballistic model, was performed to evaluate the POC. The POC was used to reflect the risk of engine failure up to the operational limit. The calculated risk indices were objective functions used for the design or operation optimization. Various risk measures were evaluated to reduce the incidence of failure and extend the aircraft’s flight envelope.
1. Introduction
Owing to various external stores, modern jet fighter aircrafts are exposed to the risk of self-collision. A self-collision is defined as the collision of an aircraft with an object separated from the same aircraft. The likelihood of a self-collision is low because the separation of external stores is tested during the aircraft developmental phase. However, a prolonged operation period increases the probability of self-collisions. In addition, the modification of an aircraft may change its aerodynamic properties and the corresponding self-collision likelihood. Mistakes during installation are typically responsible for self-collisions. Additionally, fatigue crack initiation and growth increase the risk of uncontrolled separation and self-collisions. In most cases, objects that cause self-collisions are irregularly shaped and unstable. Consequently, the trajectories of these objects are uncertain.
A collision occurs when an aircraft is in contact with another object [1]. Reproducing self-collision incidents through physical experiments is almost impossible because of the uncertainty in the trajectory of the colliding object [2]. Studies on the probability of collision (POC) primarily focus on the collision of an aircraft/spacecraft with another aircraft/spacecraft (also known as conflict probability including near-miss) or with other flying objects (bird, debris, etc.). The calculated POC is used to provide the information for avoidance maneuvers when another object is predicted to approach the aircraft/spacecraft [3,4]. Several models for collision modeling and estimation have been proposed in the literature.
Both physics-based and data-driven models have been used to predict aircraft trajectories. Studies using physics-based models include those that estimate future aircraft motions using physical equations of motion [5,6] and those that estimate vertical paths based on the aircraft weight [7]. The Bayesian network model, learned using radar data, is representative of a recent data-driven model [4]. Unlike aircrafts, major space debris is cataloged, and multiple space agencies monitor the trajectories of debris. However, the Earth’s oblateness, air drag, and solar–lunar perturbations tend to alter the orbital parameters over time [8]. Therefore, collisions may occur in non-intersecting orbits. Because the relative velocity of a spacecraft at the closest approach is extremely high compared with the relative acceleration, the relative velocity can be considered constant during the encounter period [9]. The Poisson distribution [10], distance of the closest approach [9,11], and Weibull distribution are used to consider variations in the position vectors [8].
Based on the trajectory predictions and their covariances for two objects, the POC can be calculated. Methods including the Monte Carlo simulation (MCS) [12], probability flow [13], and importance sampling [14] have been proposed to estimate the POC. The current POC analysis primarily focuses on learning the probabilistic trajectory models for aircrafts in an unstructured airspace [4], as well as investigating the potential risk associated with the operation of large constellations within the space debris environment [3].
The remainder of this paper is organized as follows: Section 2 describes the damage and a problem statement based on the most recent self-collision reported. Section 3 outlines the risk projection method for aircraft self-collisions. The models used to probabilistically represent the trajectories of the ejected shell cases are presented in Section 4. In this study, a simple physics-based model was constructed, and a sensitivity analysis was conducted to identify the influential explanatory factors. The POC and corresponding risks calculated for the possible configurations are presented herein. Subsequently, recommendations for mitigating the POC are discussed in the final section.
2. Background
2.1. Self-Collision of Aircrafts with External Stores
Some recent cases of aircraft self-collisions are shown in Figure 1, including the damages caused by gun shell case collisions (Figure 1a,b), as well as collisions of clips used for a general-purpose bomb (Figure 1c) and a fin separated from a missile (Figure 1d) with horizontal stabilizers. A brief description of each case is provided in this section.
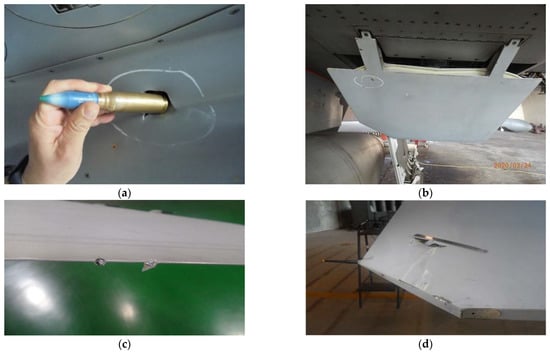
Figure 1.
Damage discovered on (a) lower nacelle fairing cover below left air intake, (b) speed brake by ejected gun shell, (c) horizontal stabilizer damaged by metallic clips, and (d) fin separated from missile.
Modern fighter aircrafts are equipped with guns, which comprise a head and a case in a shell. After firing, the shell cases are removed from the guns and stored inside the aircraft or are ejected outside. The disposal of these cases outside the aircraft is reasonable from an engineering design perspective considering the restricted space in the nose section of the aircraft, where the guns are located. However, the ejected shells may collide with the external stores and damage the aircraft due to the significant variance in the ballistic trajectories. Photographs and videos of ejected shell cases show fast rotation and considerable variation in the vertical displacement [15]. Figure 1a,b shows the damage caused by the ejected shell cases of an F-5 fighter aircraft. Figure 1a shows the puncture on the lower nacelle fairing cover, and Figure 1b shows a scratch on the left speed brake. The initial conditions that determine the trajectories vary as a shell case passes through a long, curved passage before ejection. Shell case rotation occurs as the shell case is an unstable, aerodynamically blunt body.
A lanyard was used as the mechanical trigger for external ordnances. When a bomb is separated, a lanyard pulls the metallic clips from the bomb, and windmills begin to rotate to activate the fuses. The removed clips fly backwards owing to the aerodynamic forces after bomb separation. Figure 1c shows the damage caused by the clips of an Mk 82 general-purpose bomb on the horizontal stabilizer of an F/A-50 fighter aircraft. The collision occurred partly because the horizontal stabilizers of the F/A-50 were slightly anhedral. Figure 1d shows the damage that occurred on the horizontal stabilizer of an F-16 fighter aircraft; in fact, the F-16 aircraft exhibits slightly anhedral horizon tails. Therefore, an aircraft is susceptible to self-collisions. Damage to the leading or trailing edges may result in skin separation because the skins of the F-16 and F/A-50 are fabricated using composites and bonded to metallic structural details. In all cases, a probabilistic analysis is required to consider the uncertainties in the colliding object trajectories.
2.2. Target System and Problem Statement
F-5 is a lightweight fighter aircraft equipped with two M39A3 20 mm guns with missions including air-to-air and air-to-ground combat. Recently, fuselage damage was reported after an air-to-ground gun firing exercise when the F-5 ejected shell cases outside the fuselage. It was assumed that the ejected shell cases first struck the aircraft’s centerline storage and then hit the aircraft fuselage. Similar incidents have been reported since the introduction of the F-5 aircraft in the Republic of Korea Air Force (ROKAF). The manufacturer (Northrop) experienced the same problem during tests performed on the F-5 and concluded that the cause was M39A2 guns firing at low rates. Furthermore, Northrop reported that the ejected case clearance of the centerline stores in the F-5F (two-seater) aircraft was more sensitive to the ejection velocity as compared with the F-5E (single-seater) aircraft. This finding is attributed to the following reasons:
- Forward position of the case ejection port;
- Less favorable air flow pattern around the nose of an F-5F;
- Lower position of the SUU-20 bomb dispenser on an F-5F.
Hence, Northrop recommended replacing the M39A2 gun with the M39A3 gun, which has a higher firing rate and firing restriction exceeding 25° [2]. However, the ROKAF still experienced the abovementioned incident after the replacement of guns and restriction of high-angle firing from the F-5F operational and training profiles.
Damage was discovered during a post-flight inspection of the lower nacelle fairing cover below the left air intake and speed brake (Figure 2). In particular, puncture damage on the lower nacelle fairing cover and a scratch on the speed brake were observed (Figure 1a,b, respectively). The most recent incident occurred during an air-to-ground firing drill. The pilot reported that the aircraft velocity was 450 knots, and the dive angle was 25–28°. The chemical composition of the damage to the nacelle fairing cover was analyzed using energy dispersive spectroscopy. Copper and zinc were the primary foreign elements, with a ratio of 7:3, respectively (Figure 3). Additionally, the case was fabricated using brass.
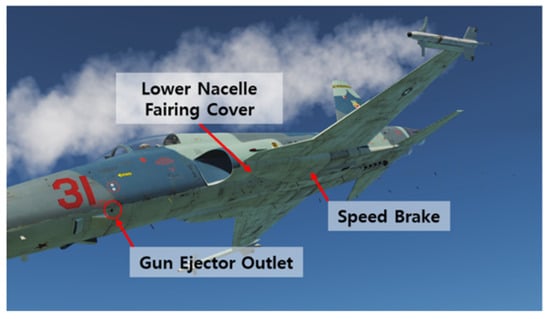
Figure 2.
Photograph showing locations of damage to the gun ejector outlet, lower nacelle fairing cover, and speed brake.
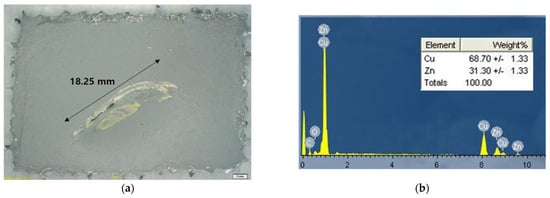
Figure 3.
(a) Damage on lower nacelle fairing cover and (b) chemical composition of damaged surface.
Seven similar cases have been reported in the literature. Table 1 lists the aircraft types and missions for each incident. Five incidents occurred with the F-5F aircraft during an air-to-ground gun firing mission, where an SUU-20 was installed at the centerline pylon. The SUU-20 is a bomb dispenser with a 2.75 inch rocket launcher, which enables the carriage and release of four folding fin aerial rockets and six practice stores. The other two cases occurred with an F-5E aircraft, and both missions were air-to-air gun firings without an SUU-20. Investigators could not identify the causes of incidents in the five cases; however, failed gun components were deemed responsible in the other two cases. In cases 4 and 6, the gun components (guide pin and ejector chute) did not function as intended, which resulted in a lower shell case ejection velocity. The cases were ejected from the F-5 aircraft through the gun ejector outlet underneath the nose section of the fuselage (Figure 2). Figure 4 shows a dummy shell ejected from a single-seater fighter aircraft on the ground. The initial angle of attack (AOA) was approximately 90°. Under normal circumstances, the ejection velocity is 30 ft/s; however, reducing the ejection velocity may cause insufficient clearance between the shell case trajectories and the SUU-20.

Table 1.
Historical data of shell case collisions with aircrafts.
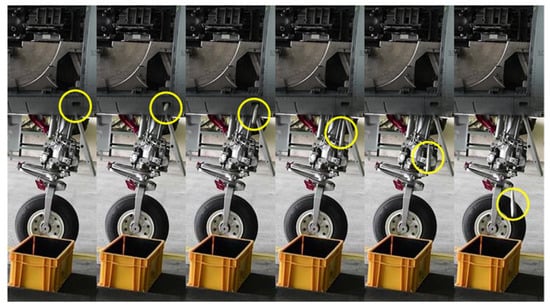
Figure 4.
Dummy shell ejected from a single-seater fighter aircraft on ground.
Based on the morphology of the damage and incident records, it was discovered that the most influential factor was the aircraft type. The significant difference between the F-5E and F-5F was the distance between the aircraft belly and the SUU-20. Owing to the drooped nose of the F-5F aircraft, an adapter was installed between the SUU-20 and pylon to ensure clearance between the nose and the rocket line of sight (LOS). Owing to the uncertainty of the causes, rocket exercises are no longer conducted using the SUU-20 because the rocket pods under the main wing are more convenient and safe. However, an adapter is used in conjunction with the inertia. The most likely collision sequence is the ejection of a shell from the aircraft, which then establishes contact with the nose of the SUU-20, lower nacelle fairing cover, and speed brake. Owing to uncertainties in the shell case trajectory, a probabilistic analysis was conducted to identify the POC between the shell case and the SUU-20.
3. Risk Projection Framework
3.1. Overview of Proposed Method
The risk projection of aircraft self-collision comprises three primary steps: modeling, failure rate estimation, and risk projection. In the first step, a trajectory analysis model is developed. The trajectory of a separated object can be calculated using either a physics-based model or a data-driven model. In most cases, data, such as videos captured using a high-speed camera, are not available. A simple equation of motion that considers the gravity and aerodynamic forces can be used to accurately predict the trajectory. Therefore, it is important to calculate the aerodynamic properties. For calibration, the most influential explanatory factors were identified via sensitivity analysis. Selected factors were used to calibrate the model using historical data.
In the second step, the failure rate is estimated. The uncertainty in the trajectory was quantified based on the calibrated trajectory model. A simple MCS provides several trajectories. The number of trajectories that encounter aircraft structures or external stores that are not separated are regarded as collision events. The POC and corresponding failure rates were estimated using the MCS results.
In the final step, the risk is projected, and the damage caused by collision events is evaluated based on the risk criteria for either the engine or aircraft structure. For engines, criteria based on a non-recoverable in-flight shutdown (NRIFSD) rate and engine-related loss of aircraft (ERLOA) are used for risk management [16,17]. For aircraft structures, a single-flight probability of failure (SFPOF) was used as a risk index. A flowchart for the probabilistic risk analysis of aircraft self-collisions is shown in Figure 5. The projected risk can be used as an objective function for design or operation optimization.
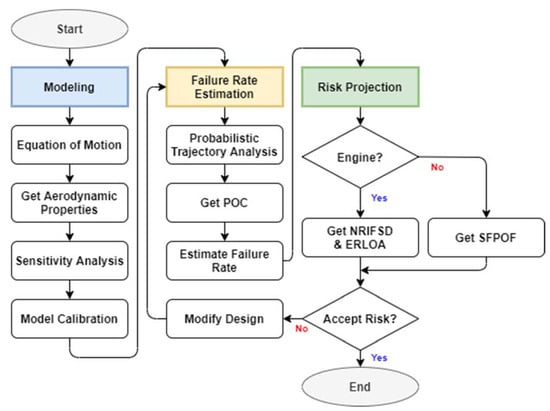
Figure 5.
Flowchart for probabilistic risk analysis of aircraft self-collisions.
3.2. POC Estimation, Sensitivity Analysis, and Calibration
The POC can be estimated using an approach used in space debris collisions. First, a number of trajectories were obtained by performing an MCS. The number of trajectories intercepted by other objects was regarded as the number of collision events. The POC is defined as follows:
where ntc is the number of trajectories intercepted by other objects, and nts is the number of trajectory samples used in the MCS.
A sensitivity analysis was conducted to determine the effects of the influencing factors on the variation of the output, for example, the distance from the bottom of the aircraft to the shell case. Sensitivity indices were obtained using variance-based methods based on the Sobol’s variance decomposition approach [18]. The sensitivity indices included a first-order index and total index. The first-order index represents the main effect contribution of each input factor to the output variance. The total effect index accounts for the total contribution to the output variation due to each factor, that is, the first-order effect plus all higher-order effects due to interactions.
After performing the sensitivity analysis, the model was calibrated by fine-tuning the most influential explanatory factor to match the POC of the model to the field experience. Through calibration, the prediction accuracy of the model was improved. The effect of the calibration can be explained using Bayes’ theorem [19].
where Pr(A) and Pr(B) are the probabilities of observing A and B without regard to each other, respectively; Pr(A|B) is the conditional probability of A given B; Pr(B|A) is the conditional probability of B given A. The prior is the POC without calibration (Pr(A)) for the specific aircraft type (A), and the posterior is the POC after calibration (Pr(A|B)) given historical data (B). The likelihood of collision (Pr(B|A)) reduces the variation in the prior; therefore, the uncertainty decreases.
3.3. Risk Projection
As self-collision events were random; furthermore, the failure rate did not change with time, and an exponential distribution could accurately represent the failure rate per event. The density and distribution functions of the exponential distribution are expressed as follows.
where x is the number of firing rounds, and λ > 0 is the parameter of the exponential distribution. Using Equations (3) and (4), the failure rate can be calculated as follows:
where R(x) represents the reliability at x.
The failure rate of units susceptible to exponential failure is the ratio between the number of incidents and the cumulative exposure to date. Because the POC can be regarded as the rate of collision per round, the distribution parameter can be directly estimated from the POC.
Using the estimated distribution parameter, the expected number of events up to the operational limit per aircraft can be obtained as follows:
where Δx is the number of additional firing rounds in the future. Equation (7) is the conditional probability, provided that no events occur until the current rounds of firing. Equation (7) is equivalent to the failure rate multiplied by the future exposure time for the units susceptible to exponential failure. The number of collision events for the entire fleet is the sum of the number of collision events for an individual aircraft.
where nac is the number of aircrafts in the fleet.
3.4. Risk Indices and Criteria
Different risk indices must be used when considering the damage caused to both the engine and aircraft structures. For engines, the U.S. Air Force uses NRIFSD and ERLOA [16]. NRIFSD refers to the number of engine flameout events that occur during a flight, preventing the engine from restarting.
where SFNRIFSD is the severity factor of an NRIFSD event. The severity factor is used because not all engine damages result in non-recoverable shutdown events. An engine with only a slight damage may be restarted successfully and provide sufficient thrust for flight. It is stipulated that NRIFSD events per 100,000 engine flight hours should not exceed 0.05 [20].
Depending on the number of engines equipped on an aircraft, engine flameout results in a partial or complete loss of thrust. Hence, an aircraft is at a risk of crashing.
where SFERLOA is the severity factor of ERLOA. Owing to the gliding ability of the aircraft, a return to the base is possible even when a complete thrust loss occurs. For an aircraft with multiple engines, the remaining operating engines provide sufficient thrust for a level flight. The severity factor of ERLOA is the ratio of the number of aircrafts that fail to return to the base after NRIFSD events. It has been reported that a single engine aircraft has a severity factor of 0.79 (79%), whereas a twin engine aircraft has a severity factor of 0.036 (3.6%) [21]. ERLOA mishaps exceeding 0.5 during the remaining life of an engine necessitate corrective actions [20].
When calculating engine-related risks, complete engine failure data may not be available. A reasonable and conservative assumption is that engine failures and fractures in aircraft structures are imminent. Hence, the severity factor can be expressed as follows:
Equation (11) presumes that the next collision will result in an engine failure or structural fracture. A similar approach was used in the Weibayes analysis [22].
For aircraft structures, the SFPOF is widely used as a risk index [17]. SFPOF refers to the probability that the damage size reaches a critical level during a single flight. For example, if a crack reaches a critical length, then a structure containing a crack will fail. Similarly, the damage exceeding a certain size will cause structural fractures and other catastrophes. A simple stress–strength model can be used to obtain the SFPOF. Durability is ensured because the time for a single flight is extremely short for crack initiation and growth from damage. In this case, the limit state is defined as follows:
where σt is the tensile or yield strength of the structure, and σd is the stress of the damaged structure. After damage occurs, the average stress level increases. Hence, the stress distribution of the damaged structure shifts to the right, and fractures are more likely to occur. The calculation of SFPOF after damage requires information from both a single flight POC (SFPOC) and the POF.
where nSF is the number of firing rounds per flight. The POF is the area under the limit state, which is expressed in Equation (12).
4. Probabilistic Risk Analysis
The shell case trajectory can be modeled using a ballistic model as an unguided bomb delivery. The ballistic trajectory of an unguided bomb varies because of factors such as the separation effect error [23,24], which is the initial condition error that is most relevant to the trajectory of the shell cases. Separation effects occur when a store is released from an aircraft, and its motion is temporarily affected by the interaction of the non-uniform flow of air between the aircraft and the store [24]. The separation effect error, which contributes the most to the overall error [25], includes the flow field effect, rack timing, ejection velocity, and weapon displacement [24,26]. Ejected shell cases initially exhibit unsteady motion because the shell case passes through a narrow tube bent heavily downward, and the velocity and moments change during the ejection process. In addition, angular perturbation by an aerodynamic force results in significant variations in the freestream drag characteristics [26].
Considering the uncertainties in the shell case trajectories, a probabilistic trajectory analysis and corresponding POC analysis were conducted. However, currently available ballistic models only consider stabilized projectiles, that is, fin- or spin-stabilized projectiles. We developed a random shell case rotation model for the probabilistic trajectory analysis of a non-stabilized projectile. The trajectory and shell angular positions were calculated sequentially. In the current study, an MCS, in conjunction with a probabilistic ballistic model, was performed to evaluate the POC. The advantage of the MCS is its greater flexibility in modeling the stochastic behavior of aircraft encounters; however, many samples are required to provide a reasonable POC estimate [1,14]. A shell case collision event was presumed to be equivalent to a collision between a moving object and a static volume owing to the short flight time between ejection and collision [1]. Shell case trajectories that were in contact with the static volume were regarded as a collision event. The POC is defined as the number of collision events divided by the total number of trajectories generated in the simulation.
4.1. Equation of Motion
An equation of motion for the shell case was developed based on the Cartesian coordinate system. The origin was attached to the ejector, and the x-axis was set parallel to the air stream flowing directly beneath the lower skin of the aircraft fuselage. Subsequently, the y-axis was aligned vertically from the bottom to the top of the aircraft. It was assumed that the 20 mm round shell cases used were point masses, and that they were subjected only to the gravitational force and drag force by the air stream [27]. The drag of the case is proportional to the drag coefficient, square of the flight velocity, and density of the atmosphere that changes with altitude.
where ρ is the density of the atmosphere; v is the velocity of the aircraft; CD is the drag coefficient of the shell case, and A is the cross-sectional area of the shell case. The drag coefficient is a function of the AOA of the shell case, air velocity, and atmospheric characteristics. The air stream was modeled as an infinite laminar flow propagating in the x-direction; as such, no force existed in the lateral direction. The equations of motion in the x- and y-directions are as follows:
where m is the mass; g is the gravitational acceleration, and θ is the dive angle of the aircraft. To solve the equations using the ode45 algorithm in MATLAB, the equation of motion was further rewritten as two sets of a first-order system of ordinary differential equations [27]. Each set of equations represents the motion in the x- and y-directions.
In this study, Fd was assumed to be a function of only the aircraft’s posture in the air stream. Other factors, such as atmospheric conditions and air velocity, were determined based on the flight conditions. Because the AOA is crucial for determining the drag force, we developed a simple in-plane rotation model. In addition, an aerodynamic analysis was conducted to obtain the drag coefficient for various AOAs. The contribution of drag on the y-axis was not considered because the velocity on that axis was much smaller than that on the x-axis.
4.2. Case Rotation Model
The in-plane rotation of the shell case was modeled using a discrete-time shell case rotation model. The time was discretized into equally spaced intervals. The total calculation was 0.3 s, and each time interval lasted for 0.01 s. At the current time step, it was assumed that the difference in the shell case AOA was uniformly distributed in the previous time step (Figure 6).
where γk is the AOA at the kth time step; a and b are the minimum and maximum values, respectively.
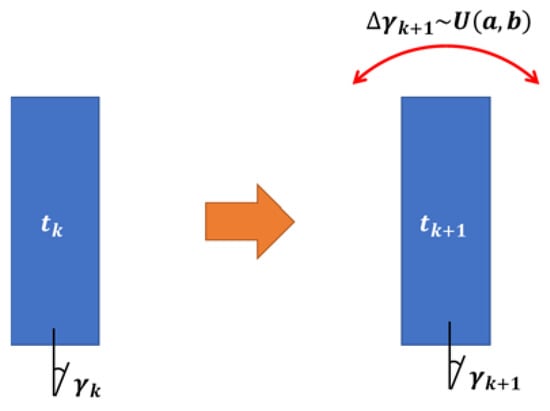
Figure 6.
Simple shell case rotation model.
4.3. Shell Case Drag Coefficient Calculation
In the in-plane rotation, the three extreme positions included the forward (the cavity hole was positioned on the left, that is, the heading position), upright, and backward positions. To analyze the behavior of the shell case after its ejection from the aircraft, the drag force for a certain freestream condition must be calculated. The commercial software FLUENTTM was used to calculate the drag coefficient. Freestream conditions were obtained from atmospheric conditions at standard operating altitudes (4500 ft) and aircraft velocities (400–500 knots). The freestream velocity was analyzed for three cases involving 400, 450, and 500 knots, and 13 AOAs of the shell case were analyzed by dividing the angle from 0° (forward position, where the case hole is positioned on the left, that is, the heading position) to 180° (backward position) at 15° intervals. Because the range of the freestream velocity was not large, the final drag coefficient was calculated using the average value of the drag coefficients obtained under the three velocity conditions. Figure 7a shows the shell case model. The inner and outer bases of the model were simplified to enable seamless calculations. The mesh near the case was an unstructured grid, and a structured grid was used for the remote area (Figure 7b). A total of 450,000 grids were used in this study. Pressure-based flow equations were used for the steady-state flow field analysis, and the Spalart–Allmaras 1 equation model was used as the viscous model.
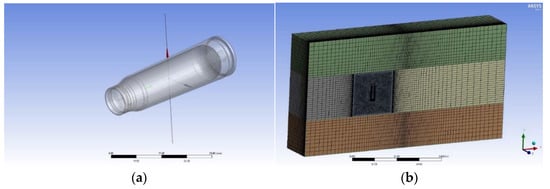
Figure 7.
(a) Shell case model and (b) mesh for calculating drag coefficient.
The results of the aerodynamic analysis conducted to obtain the drag coefficient for various AOAs are presented in this section. Figure 8 shows the freestream gauge pressure contour when the shell case is in the upright position as a solution example for the flow field around the shell case. Figure 9 shows the variation in the drag coefficient based on the AOA of the shell. In general, a symmetric shape was observed when the AOA was 90° (upright position), and the value of the drag coefficient decreased as the AOA approached 0 or 180°. A comparison of the drag coefficients at AOAs of 60 and 120° shows that they were slightly lower when the shell hole was in the rear (120°), indicating that the freestream flow exerted a relatively strong pressure on the upper part of the cavity hole at an AOA of 60°. However, when comparing the drag coefficients at AOAs of 0 and 180°, it was discovered that they were higher when the shell case was in the backward position (180°). This is likely because the effect of the base drag caused by the cavity hole of the shell is relatively large.
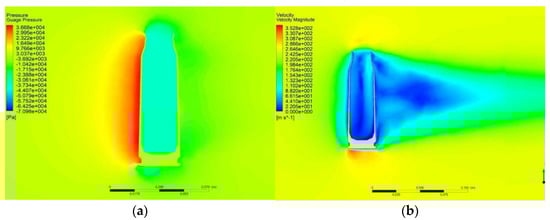
Figure 8.
Shell case vertical to free stream: (a) gauge pressure contour and (b) velocity magnitude.
Figure 9.
Drag coefficients at each shell casing’s AOA.
4.4. Sensitivity Analysis and Model Calibration
In this study, four factors were investigated: the aircraft velocity, aircraft dive angle, shell case initial velocity, and maximum shell case rotation angle per step. The range of each factor is listed in Table 2. The ranges were determined based on inputs from pilots and maintenance personnel. Figure 10 shows the results of the sensitivity analysis. Four factors were considered in the analysis: the aircraft velocity, aircraft dive angle, shell case initial velocity, and shell case rotation standard deviation. The variation in the output values was primarily attributed to the aircraft velocity (v) and shell case initial velocity (w). Although the initial velocity of the shell case did not vary significantly, it contributed the most to the variation among all the factors. As the aircraft velocity increased and the initial velocity of the shell case decreased, the distance from the shell case to the belly of the aircraft decreased, that is, the POC increased (Figure 11).
Table 2.
Ranges of factors used in sensitivity analysis.
Figure 10.
Sensitivity analysis results.
Figure 11.
Effects of aircraft velocity and initial velocity of shell cases on distance of shell cases at nose of an SUU-20.
The remaining factors—the aircraft dive angle (θ) and the maximum shell case rotation angle per step (Δγk)—were either small or negligible and hence could not be regarded as the main sensitivity indices. However, the maximum angle indicated an evident interaction with the other factors. Figure 12a shows the shell case angular perturbations over the distance from the gun ejector outlet. The median of the perturbation at each distance was similar to the initial shell angle (90°). The shell angles at each distance were normally distributed. The interquartile range (IQR) changed rapidly during the initial stage. Subsequently, the shell was damped to a steady-state condition. Smooth transitions that occurred at a distance from the ejector outlet were due to an increase in the velocity of the shell cases. The shell angles were changed at equally spaced intervals. The IQR is a function of the maximum shell case rotation angle in each interval. At a small maximum angle, the IQR was narrow, with a median near the initial shell angle. Consequently, the horizontal velocity increased, resulting in a higher POC. Because the IQR increased rapidly, the effect of the maximum angle was limited (Figure 12b).
Figure 12.
(a) Angular perturbations of ejected shell cases and (b) interquartile range (IQR).
Over the past decade (from 2011 to 2020), the F-5F type aircraft fired almost one million 20 mm shells. Two problematic cases were reported during the same period. One of the cases involved an issue with the ejector chute, and in the other case, all components operated as intended. Hence, the rate of collision was one out of one million when all the components functioned as intended. This rate was the target of the calibration. The model was calibrated by fine tuning the initial velocity of the shell. A trial-and-error method was used, which resulted in a minimum velocity of 22.5 ft/s. Decreasing the ejection velocity resulted in insufficient clearance between the shell case trajectories and the SUU-20. A calibrated model was used to obtain the POCs of the possible configurations. Finally, the configuration with the lowest POC was recommended to mitigate the risk of damage caused by shell case collisions.
4.5. Trajectories of Shell Cases and POC
The trajectories of the shell cases ejected from a fighter aircraft are shown in Figure 13a. In addition, the SUU-20 of a single-seater and a two-seater fighter aircraft are illustrated. Although not all MCS trajectories are represented in the figure, the uppermost and lowermost trajectories are included. The results show that the uppermost trajectory passed slightly below the SUU-20 of the single-seater fighter aircraft. Both the horizontal and vertical distances increased for the two-seater fighter aircraft. The nose of the SUU-20 of the two-seater fighter aircraft was below the uppermost trajectory of the shell case, that is, the POC was non-zero. Although the horizontal displacement was greater than the vertical distance, the increased uncertainty in the trajectories increased the likelihood of a collision. All trajectories exhibited a shape similar to that of the median trajectory. Compared with the IQR, the extreme distance of the trajectories from the median increased rapidly. Figure 13b shows an image of the probability mass of the vertical distance from the belly of the aircraft at the nose of the SUU-20. The sample distances were normally distributed but showed slight skewness to the right. The distribution of the vertical distances at the nose of the SUU-20 shifted left with the increase in the variance and skewness for the two-seater fighter aircraft (Figure 13b).
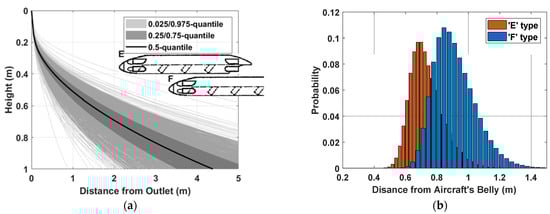
Figure 13.
(a) Trajectories of shell cases ejected from single-seater and two-seater fighter aircraft; (b) probability mass at nose of the SUU-20.
The aircraft velocity and initial velocity of the shell case were the two most influential factors in determining the trajectories. Figure 14a shows the effect of the aircraft velocity on the POC of a two-seater fighter aircraft. In this case, only the aircraft velocity was fixed. The results show that the POC exceeded 10−6 when the aircraft traveled faster than 420 knots. The rapid movement of the shell case in the longitudinal direction reduced the time required for sufficient separation of the shell case from the belly of the aircraft. Figure 14b shows the effect of the initial velocity of the shell case on the collision probability of a two-seater fighter aircraft. In this case, the initial velocity of the shell was a fixed factor. The results indicate that the calculated POC for all cases is below 10−6. If both the aircraft velocity and initial velocity of the shell case are fixed, then the POC will be greater than 10−6 only when the aircraft velocity is 500 knots. The interaction between the two significant factors is important when calculating the POC, as shown in Figure 10.
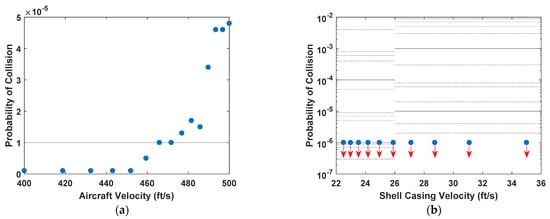
Figure 14.
Effects of (a) aircraft velocity and (b) initial velocity of shell case on POC for two-seater fighter.
4.6. Risk Projection until Aircraft Operation Limit
As described in Section 3.1, the projected risks can be used as objective functions for the design or operation optimization. Currently, risks are projected to verify that the risks for the specified operating conditions satisfy the criteria. Although no engine failure occurred, the damages that occurred adjacent to the air intake and shell ingestion through the air intake could not be prevented. Considering the size of the shell case, an ingestion would result in engine flameout. The severity factor for an NRIFSD event was presumed to be 1/6 because five incidents without engine failure were reported in two-seater fighter aircrafts. Figure 15 shows the projected risk of engine failure for a two-seater fighter aircraft owing to the self-collision of the aircraft. In Figure 15a, a feasible region is constrained by the line where the NRIFSD per 100,000 engine flight hours is equal to 0.05. The number of firing rounds was limited to approximately 1500 rounds/year. The ERLOA over the remaining life of the engine was much smaller than the risk criteria of 0.5 (Figure 15b). The margin of the ERLOA was greater than that of the NRIFSD because the target system contained two engines. Hence, a severity factor of 0.036 was used. The risk corresponding to the structural damage was not considered because no critical damage was observed.
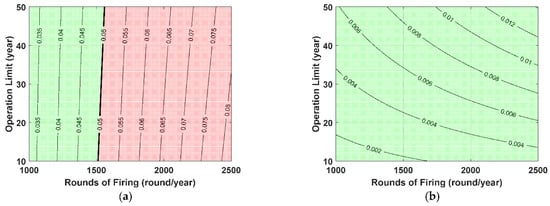
Figure 15.
Contour plots of projected risks of engine failure caused by aircraft self-collision. (a) NRIFSD per 100,000 engine flight hours and (b) ERLOA over remaining life of engine.
5. Discussion
5.1. Conservatism of Severity Factors
In the proposed framework, the severity factor correlates the collision events and engine failures. The severity factor is typically used to calculate NRIFSD rates and the number of ERLOA events. The main issue in using the severity factor is its conservatism when no failure occurs, as represented in Equation (10).
Engine damage caused by self-collisions is a form of foreign object damage (FOD). An ingested foreign object damages the compressor, including its rotating and stationary components. Although FOD is a primary cause of flameout, depending on the material and size of the object, flameout may not occur immediately [27]. When no immediate flameout occurs, damage can be observed during inspection and repair. Equation (10) represents an extreme case of prompt flameout that is associated with conservative risks. Conservatism of the severity factor reflects a high risk of engine failure. Risk is the product of the probability and severity. Engine failure is rare but is associated with high risks because of its severity.
Unlike an engine, the assumption of failure in a subsequent collision is extremely conservative for aircraft structures. SFPOF considers the probability that the damage size reaches a critical level during a single flight. The SFPOC is two orders of magnitude higher than the POC because the firing rounds exceed 100 per flight under normal circumstances. Therefore, using the severity factor to calculate the engine risk yields an extremely conservative fracture risk. It is highly likely that the resultant risk calculated using Equation (13) without the POF is greater than the risk criteria. The POF is used to consider the stress concentration based on the shape and size of the damage. Hence, it is less conservative than severity factors.
5.2. Mitigation of POC
The probabilistic analysis of the gun shell case trajectories revealed that the POC was significant during air-to-ground gun firings because of the variance in the initial velocity of the shell case. The remaining options for mitigating the POC are as follows:
- Decreasing the operational velocity of the aircraft during air-to-ground gun firings;
- Increasing the initial velocity of the shell case;
- Storing the shell cases inside the aircraft;
- Removing the adapter to increase the separation between the shell case trajectories and the SUU-20.
In this study, a probabilistic analysis was conducted, and operational requirements were specified to identify the most appropriate option. The results show that the first two options were the most effective in reducing the POC; however, neither option was applicable because of the significant design changes and operational requirements. For example, a reduction in the operational velocity would result in a higher risk of the aircraft being shot down by the anti-aircraft artillery of the enemy. If the number of shell loads can be reduced, then removed cases can be stored inside the aircraft, as demonstrated by the Swiss Air Force. However, the most feasible option is to remove the adapter used for the F-5F aircraft. In terms of the POC, an increase in clearance would result in a lower risk of collision, and removing the adapter is the simplest method to increase the clearance. Figure 16 demonstrates the effect of removing the adapter. The uppermost trajectory was significantly lower than that of the trajectories shown in Figure 13a. Consequently, a POC of less than 10−6 was obtained. In fact, the adapter only affected the LOS of the rocket. As explained in Section 2, an adapter is used to secure the LOS when firing rockets. Because the SUU-20 no longer conducts the rocket firing drill, the LOS need not be maintained. Based on the results of both the probabilistic analysis and current operational profiles, removing the adapter is recommended to increase the clearance between the trajectories and the external store.
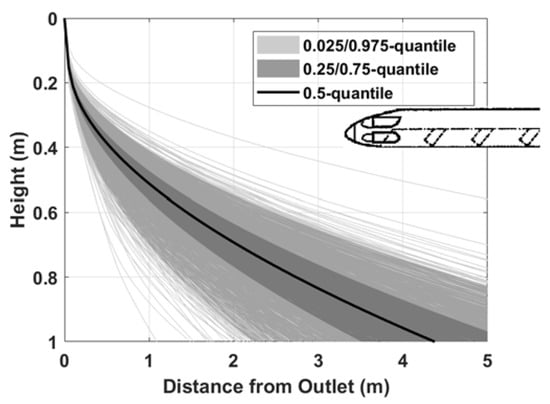
Figure 16.
Trajectories of shell cases ejected from two-seater fighter aircraft without adapter.
6. Conclusions
A framework for the probabilistic risk analysis of aircraft self-collisions is proposed herein. Based on the probabilistic trajectory prediction model, methods for estimating the POC and corresponding risks were developed. Subsequently, aircraft self-collisions with ejected gun shell cases were analyzed. Because physical experiments could not be performed, a model-based probabilistic failure analysis was conducted. An innovative probabilistic trajectory model for a non-stabilized projectile was developed. The advantage of the model-based probabilistic failure analysis is that the model renders it easier to identify the most influential factor based on sensitivity analysis. In addition, the model can be used to quantify the uncertainties pertaining to the shell case trajectories. The initial velocity of the shell case was identified as the most influential factor. MCS, in conjunction with the probabilistic ballistic model, was utilized to evaluate the POC. Based on the results of the POC analysis, risks were projected to verify that the risks for the specified operating conditions satisfied the criteria. Decreasing the vertical displacement of external stores is recommended as a mitigation measure. Self-collision events are frequently experienced by personnel operating military aircrafts. The proposed framework is systematic and provides quantitative indices that can be used as objective functions for design or operation optimization. We hope that this analysis will help reduce the incidence of failure and extend the flight envelope of the aircraft.
Author Contributions
Writing—original draft, D.L.; formal analysis, H.C.; investigation, M.-S.K.; writing—review & editing, K.K. All authors have read and agreed to the published version of the manuscript.
Funding
This research received no external funding.
Institutional Review Board Statement
Not applicable.
Informed Consent Statement
Not applicable.
Data Availability Statement
Not applicable.
Conflicts of Interest
The authors declare no conflict of interest.
References
- Mitici, M.; Blom, H.A.P. Mathematical Models for Air Traffic Conflict and Collision Probability Estimation. IEEE Trans. Intell. Transp. Syst. 2019, 20, 1052–1068. [Google Scholar] [CrossRef]
- Wittler, J. TCG-8601-001; Defense Security Cooperation Agency: Washington, DC, USA, 1986; pp. 1–2.
- le May, S.; Gehly, S.; Carter, B.A.; Flegel, S. Space Debris Collision Probability Analysis for Proposed Global Broadband Constellations. Acta Astronaut. 2018, 151, 445–455. [Google Scholar] [CrossRef]
- Barratt, S.T.; Kochenderfer, M.J.; Boyd, S.P. Learning Probabilistic Trajectory Models of Aircraft in Terminal Airspace from Position Data. IEEE Trans. Intell. Transp. Syst. 2019, 20, 3536–3545. [Google Scholar] [CrossRef]
- Chatterji, G.B.; Sridharf, B.; Bilimoria, K.D. En-Route Flight Trajectory Prediction for Conflict Avoidance and Traffic Management. In Proceedings of the AIAA Guidance, Navigation, and Control Conference, San Diego, CA, USA, 29–31 July 1996. [Google Scholar]
- Chatterji, G. Short-Term Trajectory Prediction Methods. In Proceedings of the AIAA Guidance, Navigation, and Control Conference and Exhibit 9, Portland, OR, USA, 9–11 August 1999. [Google Scholar]
- Warren, A.W.; Ebrahimi, Y.S. Vertical Path Trajectory Prediction for Next Generation ATM. In Proceedings of the 17th DASC, AIAA/IEEE/SAE, Digital Avionics Systems Conference, Proceedings, Bellevue, WA, USA, 31 October–7 November 1998. [Google Scholar]
- Smirnov, N.N. Space Debris Hazard Evaluation and Mitigation; Taylor & Francis, Inc.: New York, NY, USA, 2002. [Google Scholar]
- Patera, R.P. General Method for Calculating Satellite Collision Probability. J. Guid. Control Dyn. 2001, 24, 716–722. [Google Scholar] [CrossRef]
- Seong, J.-D.; Min, C.-O.; Lee, D.-W.; Cho, K.-R.; Kim, H.-D. Analysis of the Collision Probability and Mission Environment for Space Debris. J. Korean Soc. Aeronaut. Sp. Sci. 2010, 38, 1144–1151. [Google Scholar] [CrossRef][Green Version]
- Akella, M.R.; T, K. Alfriend Probability of Collision Between Space Objects. J. Guid. Control Dyn. 2000, 23, 769–772. [Google Scholar] [CrossRef]
- Yang, L.; Yang, J.H.; Kuchar, J.; Feron, E. A Real-Time Monte Carlo Implementation for Computing Probability of Conflict. In Proceedings of the AIAA Guidance, Navigation, and Control Conference and Exhibit, Providence, RI, USA, 16–19 August 2004; pp. 617–636. [Google Scholar]
- van Daalen, C.E.; Jones, T. Fast Conflict Detection Using Probability Flow. Automatica 2009, 45, 1903–1909. [Google Scholar] [CrossRef]
- Chryssanthacopoulos, J.; Kochenderfer, M.; Williams, R. Improved Monte Carlo Sampling for Conflict Probability Estimation. In Proceedings of the 51st AIAA/ASME/ASCE/AHS/ASC Structures, Structural Dynamics, and Materials Conference, Orlando, FL, USA, 12–15 April 2010; pp. 1–17. [Google Scholar]
- Lake, J. MiG-27 Bows Out of IAF Service. AINonline, 2 January 2020. [Google Scholar]
- Lutz, L.; Feller, C.; Renegar, A.; Soucek, C. Aircraft Gas Turbine Engine Flight Safety Risk Management Process. In BP-99-06 Rev. E.; U.S. Air Force Life Cycle Management Center: Wright-Patterson AFB, OH, USA, 2016. [Google Scholar]
- U.S. Department of Defense. Aircraft Structures; JSSG-2006; U.S. Department of Defense: Washington, DC, USA, 1998.
- Saltelli, A.; Ratto, M.; Andres, T.; Campolongo, F.; Cariboni, J.; Gatelli, D.; Saisana, M.; Tarantola, S. Global Sensitivity Analysis: The Primer; John Wiley & Sons: Hoboken, NJ, USA, 2008. [Google Scholar]
- Kennedy, M.C.; O’Hagan, A. Bayesian Calibration of Computer Models. J. R. Stat. Soc. Ser. B Stat. Methodol. 2001, 63, 425–464. [Google Scholar] [CrossRef]
- U.S. Department of the Air Force. Propulsion Life Cycle Management for Aerial Vehicles; Air Force Manual 20-116; U.S. Department of the Air Force: Washington DC, USA, 2018.
- Cho, H.; Kwon, H.J.; Lee, D.; Kim, M.S.; Kim, S. Case Study of Risk Assessment for an Aircraft Gas Turbine Engine: Fatigue Cracking of the 1st Stage Turbine Blades of a CT7 Engine Owing to Platform Arch Binding. Trans. Korean Soc. Mech. Eng. A 2020, 44, 887–895. [Google Scholar] [CrossRef]
- Abernethy, R.B. The New Weibull Handbook, 5th ed.; Pratt & Whitney: North Palm Beach, FL, USA, 2004. [Google Scholar]
- Driels, M. Weaponeering: An Introduction, 3rd ed.; American Institute of Aeronautics and Astronautics, Inc.: Washington, DC, USA, 2020. [Google Scholar]
- Arnold, R.J.; Knight, J.B. Weapon Delivery Analysis and Ballistic Flight Testing; AGARD: Seine, France, 1992. [Google Scholar]
- Jo, H.; Lee, S.; Song, C. A Study on the Accuracy Analysis for Air-to-Ground Weapon Delivery. J. Korean Soc. Aeronaut. Sp. Sci. 2007, 35, 741–746. [Google Scholar]
- Massengill, H., Jr. A Technique for Predicting Aircraft Flow-Field Effects upon an Unguided Bomb Ballistic Trajectory and Comparison with Flight Test Results. In Proceedings of the 31st Aerospace Sciences Meeting, Reno, NV, USA, 11–14 January 1993. [Google Scholar]
- McCoy, R.L. Modern Exterior Ballistics; Schiffer Publishing, Ltd.: Atglen, PA, USA, 2012. [Google Scholar]
Publisher’s Note: MDPI stays neutral with regard to jurisdictional claims in published maps and institutional affiliations. |
© 2022 by the authors. Licensee MDPI, Basel, Switzerland. This article is an open access article distributed under the terms and conditions of the Creative Commons Attribution (CC BY) license (https://creativecommons.org/licenses/by/4.0/).