Abstract
In the context of reducing the environmental footprint of tomorrow’s aviation, Distributed Electric Propulsion (DEP) has become an increasingly interesting concept. With the strong coupling between disciplines that this technology brings forth, multiple benefits are expected for the overall aircraft design. These interests have been observed not only in the aerodynamic properties of the aircraft but also in the structural design. However, current statistical models used in conceptual design have shown limitations regarding the benefits and challenges coming from these new design trends. As for other methods, they are either not adapted for use in a conceptual design phase or do not cover CS-23 category aircraft. This paper details a semi-analytical methodology compliant with the performance-based certification criteria presented by the European Union Aviation Safety Agency (EASA) to predict the structural mass breakdown of a wing. This makes the method applicable to any aircraft regulated by EASA CS-23. Results have been validated with the conventional twin-engine aircraft Beechcraft 76, the innovative NASA X-57 Maxwell concept using DEP, and the commuter aircraft Beechcraft 1900.
1. Introduction
The goals of reducing the environmental footprint and decreasing the noise levels determine the trends of future aviation. In this sense, distributed electric propulsion (DEP) aircraft represent a potential key approach for meeting the overall objectives without compromising costs and safety requirements. The concept of blowing air at high speed over the wing generates a relative speed of the air with respect to the aircraft. As a result, increasing the number of propellers demands less thrust to reach the minimum speed during take-off, and it increases the lift coefficient and requires a smaller wing surface [1]. From a structural point of view, the incorporation of DEP along the span leads to the alleviation of the bending moment and the reduction of the wing structural mass [2]. Therefore, DEP affects the mass breakdown of the wing, and its assessment is one of the main challenges to be faced in the weight analysis.
The design of a new aircraft, either innovative or conventional, generally starts by a conceptual design (see Figure 1) in which the preliminary assessment of a variety of possible configurations is studied. This phase, if conducted properly, allows us to rule out unfeasible layouts and identify key features [3]. This stage is but one of the iterations of the aircraft design process and is likely to be conducted several times for each tested configuration. Additionally, many new aircraft concepts are taking shape, which creates the need for a way to quickly and reliably assess their likeliness to fly in conceptual and preliminary design steps. FAST-OAD-GA is an overall aircraft design (OAD) code that aims to fulfill the need for general aviation (GA) aircraft. As part of the undertaking of adapting FAST-OAD-GA for novel configuration, the necessity for an improved wing mass estimation method was identified.
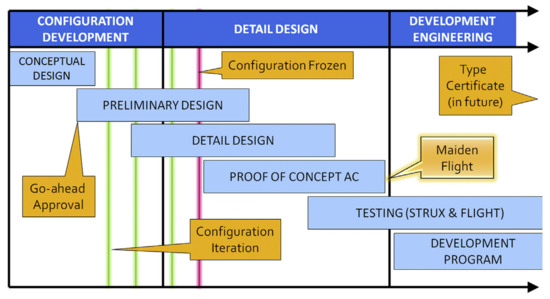
Figure 1.
Aircraft design process for a typical GA aircraft. Reprinted from Ref [3].
A literature review has thus been conducted to assess the relevancy of existing wing mass estimation methods for conceptual and preliminary aircraft sizing. Three types of methods have been identified based on their fidelity level: empirical, physics-based, and finite-element methods.
Empirical models such as the one presented by Raymer [4] and Nicolai [5] are particularly well suited for the conceptual design stage and are commonly used. Their computation time is virtually instantaneous, and the level of detail required to apply the formulae matches what is usually found at this stage of aircraft design. Such methods are, however, strongly dependent on the database used to establish them, and with the lack of information on innovative designs, they would fail to capture the aforementioned effects [6]. More refined methods such as the one presented in NASA’s FLOPS [7] are capable of encapsulating the design features of unconventional aircraft configurations. This is the case for high-aspect-ratio wings, strut-braced wings, or aeroelastic tailoring. Nevertheless, the aerodynamic loads and the engine relief effect are only used in part of the computation of the wing weight, and they must be specified by the user.
On the opposite end of the complexity spectrum, one finds finite element methods. Some of them, such as the one presented in [8], have been shown to be able to estimate the wing mass with satisfactory results. However, such methods present computational times that are not acceptable for conceptual design phase. Furthermore, the required inputs and precision level of those models are usually not known at this stage of the design. The final limiting step is the complexity of such codes or software that makes their integration efficient in an overall aircraft design software complex.
Finally, existing analytical and physics-based methods have been reviewed. These combine the ease of integration with flexibility and relatively low computational time. Nonetheless, they are often proprietary software or embedded in an already existing OAD tool. Other approaches such as the one developed in [9] or [10] present the appropriate level of fidelity and are described with enough precision that they can be implemented to estimate a basic mass breakdown of the wing. However, these methodologies do not consider the loads cases and structural requirements prescribed by EASA CS-23, and they are more oriented towards commercial transport aircraft. Nonetheless, these have served as the basis to build the methodology presented in this paper.
This work focuses on developing and validating a semi-analytical approach to predict the structural mass breakdown of a wing for a usage in a preliminary aircraft design tool. The choice of a semi-analytical model was made to combine the robustness of the method, the ease of the integration, and the low computational time. This model shall be applicable to aeroplanes in EASA CS-23 category and be adapted to both conventional and distributed propulsion airplanes. The methodology developed by [10] was adapted to consider both the relevant CS-23 loads certification requirements and the effects of DEP. After a validation of the developed method on three aircraft covered by the CS-23 requirements, parametric studies were conducted to investigate different design choices. This methodology was then implemented in FAST-OAD-GA, which brought its own set of challenges, chief among which was the concern for the computational time and opportunities such as benefiting from the software framework.
2. Materials and Methods
2.1. FAST-OAD-GA (Future Aircraft Sizing Tool—Overall Aircraft Design—General Aviation)
FAST-OAD-GA is an open-source plugin of FAST-OAD, an open-source aircraft sizing and optimization tool developed by ISAE-SUPAERO and ONERA based on the OpenMDAO framework [11]. The links to the code are available in the Supplementary Material section. A FAST-OAD run consists in the assembly of several OpenMDAO components with inputs and outputs that represents the application of an aircraft sizing methodology. Moreover, FAST-OAD allows us to define specific problems by using a configuration file. This file provides an easy way to switch between models or to remove/add some modules. Coupled with OpenMDAO’s multidisciplinary design analysis capabilities, it allows for a preliminary estimation of the viability of possible aircraft configurations. Currently, FAST-OAD-GA is bundled with statistical models for mass estimation targeted at conventional airplane architectures. However, in the extension of this software to cover innovative aircraft designs, this was targeted as a limiting factor, which prompted the creation of the presented methodology.
A representation of the typical FAST-OAD-GA sizing process is presented in Figure 2 in the format of an N2 diagram. Each of the colored lines on the bottom-left side of the diagonal represents a loop in the process, while the one on the upper-right are forward computation. Henceforth, the outermost loop, i.e., the loop on the wing area, will be referred to as an iteration. Figure 2 shows that each of the modules (gray blocks in the main diagonal) can be used several times in each iteration. More specifically, the weight module that computes the overall empty weight (OEW) is inside 3 loops in each iteration, meaning it is run at least three times. The OEW is currently computed by summation of the weights of every component of the aircraft broken down into categories adapted from [12]. The wing corresponds to one of the main components that contributes to the OEW. The work presented in this paper consists in replacing the current way of computing the wing weight by the semi-analytical methodology mentioned in the introduction to improve the precision of the sizing process while compromising the computational time. Figure 2 also illustrates that this model will be used in a complex environment with a methodology at various levels of fidelity, making it unnecessary to have a model with a level of detail in the inputs greater than what the rest of the process can provide, which was one of the reasons why a finite element method was not retained.
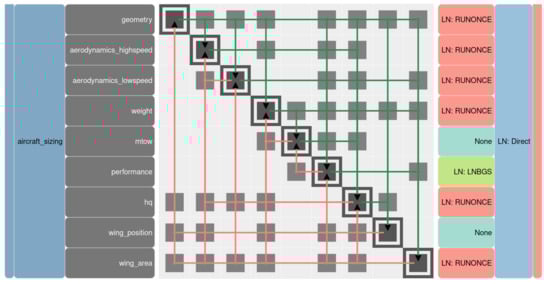
Figure 2.
Representation of the typical FAST-OAD-GA process as an N2 diagram.
Furthermore, Figure 2 shows that many modules are run before the computation of the mass breakdown. This means that since the outputs of some components can be the inputs for others, it is easy to reuse the results of previous models without requiring their computational time. An example of a module in this situation is the computation of the aerodynamic performance of the aircraft, which contains the computation of the lift distribution along the span.
In order to be able to use a real lift distribution as part of the computation of the aerodynamics loads, FAST-OAD-GA relies on OpenVSP through an interface that allows an automated processing of the computation and results. It is an open-source software released under NASA Open Source Agreement as a parametric geometry tool. One of OpenVSP’s tools is VSPAERO which allows aerodynamic analysis based on either a vortex lattice or a panel method. OpenVSP is well suited in early aircraft design stage because of its low computational time and ability to run various types of analyses. Another advantage of using this software is that it allows the simulation of the wing-propeller interaction due to the induced velocity through the use of an actuator disk model [13], which is a key feature to capture the effect of DEP in the aerodynamic loads.
2.2. Wing Mass Model
For the purpose of initial design, the wing is assumed to be trapezoidal, with N engines distributed along the wingspan and divided into a primary and secondary structure. The leading and trailing edge devices such as ailerons, flaps, and slats form the secondary structure of the wing. The primary structure is modeled as a wing-box, represented in Figure 3 with a miscellaneous weight to account for the joints, cut-outs, and connections. The wing-box structure is then broken into different components. Each of these components is assumed to withstand only one type of stress:
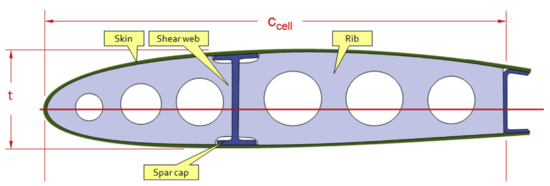
Figure 3.
Wing-box model. Reprinted from Ref [3].
- The spar web withstands the shear force;
- The spar caps supports the bending mometn;
- The skin reacts to the torsion moment;
- The ribs bear the buckling loads.
This set of assumptions allows a simplified analytical estimation of their individual mass based on É. Roux’s model [10], which is only valid for isotropic materials. The use of composites is accounted for in the miscellaneous weight through the FCOMP factor [7], ranging from 0 for no composites to 1 for its maximum utilization.
The choice was made to ultimately not consider buckling for the sizing of the ribs. Indeed, this method was elaborated to be used as part of a conceptual design tool and does not substitute a full load analysis, which means we had to rule out some failure scenarios such as buckling.
In addition to the previous model, Sui An [14] shows in her studies the impact of flutter on the wing mass when using distributed propulsion. She proves that the flutter constraint increases the optimum mass by 6–14%. Therefore, the current method will approximate such effects in the applicable cases through a mean coefficient of .
2.3. Methodology Description
The following methodology is applicable to airplanes regulated by EASA CS-23 certification specification. Requirements from CS-23 at amendment 4 [15] are considered throughout this paper as an acceptable means of compliance to amendment 5, the latest applicable issue written in a performance-based language. The goal is to compute for each part of the wing the quantity of material necessary to support the stresses induced by the load cases prescribed in the certification requirements. Figure 4 describes the iterative process developed for the evaluation of the mass breakdown of the wing, which begins with an initial estimation of the total wing weight for the computation of the structural loads and then follows the steps presented hereafter.
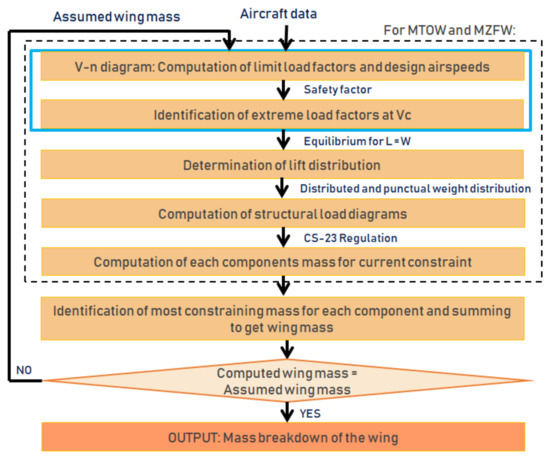
Figure 4.
Flow diagram of the method.
- Load factors: CS 23.321 and CS 23.333 [15] state that the aircraft must comply with the load requirements for any combination of load factor and airspeed within the limits of the flight envelope. This envelope results from the application of the maneuver and gust criteria defined for every weight and flight altitude computed according to CS 23.335, CS 23.337, and CS 23.341. To simplify the process, two constraining weight cases for the wing structure at the typical cruise altitude were selected: the aircraft at MTOW and with minimum fuel in the wings [15]. The choice of considering only the cruise altitude and cruise equivalent airspeed was made since these conditions lead to the highest gust load factor. In addition to that, according to CS 23.305, the wing should also demonstrate compliance to the strength requirements at ultimate loads. These are calculated by applying a safety factor to the maximum/minimum load factors obtained for the aforementioned conditions.
- Lift distribution: The computation of the lift distribution was separated into two parts: the clean lift, which is the lift without accounting for engine wake and the slipstream lift, meaning the additional lift generated by the engine wake. The clean lift distribution is obtained from OpenVSP and was assumed to be of constant shape along the wingspan. It is then scaled to match the lift coefficient required to sustain the extreme load factors. In the computation of the clean lift, the tail down force necessary to maintain the aircraft level was also considered, leading to a increase assumed to balance the weight in cruise (L = W) [12]. The slipstream lift distribution is computed using OpenVSP through a simple actuator-disk engine model to capture the effects of DEP on the aerodynamic loads. For the computation of the slipstream effect it was considered that two types of propellers could be installed on the wing: the High-Lift Propeller (HLP) [16] to provide extra lift at low speed and the Wingtip Propeller (WTP) to provide thrust during cruise and reduce induced drag. In cruise, the HLPs are folded, but at the climb cruise transition, they are still activated and working close to their maximum operating speed. At this time of flight, the potential risk of whirl flutter require setting the torque at the minimum level with a consequent reduction of power [17]. These few seconds of blown wing under cruise conditions are taken into account in the wing sizing process under a steady approximation to ensure conservative results. This lift distribution is then multiplied by the chord at the corresponding station along the span to obtain the aerodynamic loads at each point of the wing. The results of the computation of the lift load for the X-57 are shown in Figure 5.
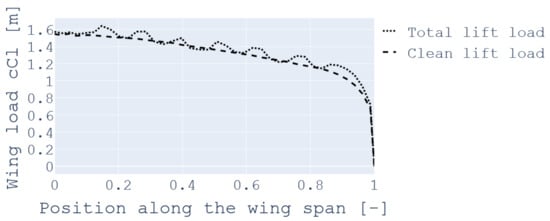 Figure 5. Lift load distribution along the dimensionless wing span.
 - Structural load diagrams: five types of loads acting on the wing are considered: the aerodynamic lift load previously obtained, the distribution of the wing and fuel weights (proportional to the local chord), the punctual weight of the engines and the weight of the landing gear. However, when the fuel is placed in the same position as an engine or landing gear housing, its weight is decreased at this section to account for the reduced space available. The shear force diagram is then obtained by the numerical integration of the distributed loads. Similarly, the bending moment diagram can be constructed with the numerical integral of the shear diagram. Pursuing the flexibility of this methodology for hybrid or DEP configurations, the fuel weight is only considered in the applicable cases.
- Mass breakdown of the wing: the mass of each structural component of the wing is proportional to the quantity of material necessary to support the loads, defined as the density of the material multiplied by the volume of the part. The following computations will be done for the two previously mentioned aircraft masses: MTOW and minimum fuel in the wing. Consequently, two values of the mass will be obtained for each element, with the maximum being retained. Hereunder, a non-dimensional reference coordinate system will be used, where the Y axis () is defined positive to the right side of the aircraft, with b the span.
- Web mass in shear : the spar web is a vertical panel designed to react, under assumptions of the presented methodology, to all the shear force of the wing . CS 23.305 stress criteria is applied, which states that the stress on the web must be lower than the maximum shear stress of the material . So, the mass of the web for the whole wing is calculated integrating its section area along its elastic axis which sweep angle is :
- Spar caps mass in bending : the lower and upper spar caps of the main spar react to the bending moment . Similarly to the web sizing, the CS 23.305 stress criteria imposes that the stress on the spar caps cannot surpass the maximum normal stress of the material, , neither in traction () nor in compression (). In general, the resultant shear force of the wing is in the upwards direction. Hence, the upper spar cap will work under compression, while the lower spar cap will be subjected to traction. The consequence is that the upper spar cap will face higher risk of failure under buckling than the lower spar cap [10]. With those considerations, the mass of both spar caps can be calculated with Equation (2), where is the distance between the center of gravity of the spar caps retrieved from [10] and , are the cross-section areas of the upper and lower spar caps, respectively.
- Skin mass in torsion : The skin is a thin panel of a thickness assumed constant that provides the necessary strength to bear the torsion moment. This assumption makes sense from a manufacturing point of view, where varying the thickness for wings of this size represents additional manufacturing complexity that is not desirable for general aviation manufacturers. Besides having a varying skin thickness did not significantly improve the results in [10], hence our choice to keep the wing skin thickness constant. The regulation imposes two sizing criteria: CS 23.455 that limits the deformation of the wing in rolling conditions and one that corresponds to the maximum admissible stress at ultimate loads stated in the CS 23.305. Hence, the skin mass will be determined by the most demanding requirement. In previous versions of the model [18], both criteria were computed for various aircraft. The results revealed that the deformation dimensioning also meets the stress requirements. Consequently, only the CS 23.455 rule was implemented in the current edition of the code. Then, as presented in Equation (4), the skin mass is obtained by integrating the product of the skin thickness, e and the perimeter of the wing-box, l. The objective of this criterion is to guarantee the efficiency of the ailerons control by limiting the roll speed at the design airspeeds . When ailerons are deflected, this norm restricts the wing deformation that changes the angle of attack . This can be approximated by the variation of the twist angle due to the torsion moment produced by the ailerons. The skin weight will then be computed based on the necessary thickness to react that torsion moment. For further detail on the calculation of e, the user is encouraged to see [10] (pp. 84–104).
The mass of the ribs and miscellaneous items are obtained empirically according to the expressions proposed by É. Roux [10] and NASA FLOPS [7], respectively. As for the secondary structure, Torenbeek [2] states that it contributes to around a of the total mass of the wing. Therefore, its weight will be empirically obtained with this proportion. Finally, the total mass of the wing will be the sum of all its components: - Iteration: the method finishes by comparing the computed mass of the wing with the one initially estimated. If these values are different, the tool iterates on the solution with the computed value until the error is lower than . This ensures the obtained wing weight is close enough to the structural weight used to compute relief effects.
2.4. Methodology Validation
Validation of the proposed methodology and related models is performed through an assessment for three aircraft use-cases: the Beechcraft 76 as a conventional twin-engine airplane, the innovative NASA Maxwell X-57 as a DEP concept, and the Beechcraft 1900 as a commuter aircraft. In this way, the robustness and flexibility of the method can be proved through a realistic range of weights and sizes of aircraft. Input data used for those use-cases are detailed in Appendix A. The structural safety factor for the Maxwell X-57 was set to 1.8 according to the airworthiness approach set for the Mod III version of the aircraft [19].
2.5. Parametric Analysis
Two parametric studies were conducted to show the importance of considering the impact of DEP and engine placement on the wing sizing. For the analysis described in Section 2.5.1 and Section 2.5.2, the aircraft we will use as a reference is the Maxwell X-57. For the study in Section 2.5.3, we will use the Beechcraft 76. As previously introduced, the weight of the engines and the wing-propeller interaction modify the structural loads with subsequent effects on wing mass. For a better comprehension, each of these effects is presented and analysed independently.
2.5.1. Effect of the Engines Weight Distribution
The investigation presented in this section aims to analyse exclusively the engines mass effect on the wing sizing. The complete study of the effects of a change in the propulsion system is an Overall Aircraft Design problematic that is not addressed in this paper. The results of this study, however, can be seen as the first iteration of the global OAD process. For such purpose, the quantity of high-lift propellers per semi-wing has been varied from 1 to 6, and the following assumptions have been retained:
- The high-lift engines are evenly spaced along the wingspan and it is assumed that the distance between the last HLP and the WTP was greater than the distance between two HLP. The position used for this study is detailed in Table 1.
 Table 1. HLP position considered in the parametric study on the effect of HLP weight (in % of the semi-span) per half-wing.
 - The maximum power and mass of the engines are proportionally scaled with the number of HLP. The propeller disc size is also adjusted to have a constant power coefficient. The baseline is defined by the 12 high-lift motors mounted in the X-57 Maxwell, with a propeller diameter of 0.58 m, a shaft power of 10.5 kW and a mass of 6.8 kg per engine.
- The slipstream effect of HLP is not considered for this study. This analysis is focused on the engines weight and not on the aerodynamics though the two parameters will be coupled in an overall aircraft analysis.
- The WTP remains the same in every simulation. This enables to maintain the main source of thrust of the aircraft to counteract the drag.
2.5.2. Effect of Slipstream Consideration
The second parametric study shows the sensitivity of the model to the slipstream effect in cruise conditions. This analysis is made to evaluate the impact of the choice made in this paper to consider that HLP were still active in the cruise conditions. The original configuration of the X-57 Maxwell with 14 engines is used. In order to achieve this objective, the mass of the wing has been obtained with and without adding the slipstream lift.
2.5.3. Effect of Engine Placement
The third parametric study aims at analysing the influence of the position of the engine on the overall wing mass for a conventional design. The baseline configuration for this study is the Beechcraft 76. The position of the engine varies between the root and the tip of the wing. For a correct interpretation of the conclusions of this study, it is necessary to mention that, for the computation where the engine is located closer to the fuselage centerline than the reference position, results are physically irrelevant. The baseline engine location is indeed already a lower limit based on the propeller clearance, which can be specified as a design constraint. The results will nevertheless be included as an indicative basis.
3. Results
3.1. Methodology Validation
For the purpose of validation of the methodology, the outputs of the use-cases have been evaluated against data available for Beechcraft 76, Beechcraft 1900 and NASA X-57 Maxwell with DEP. For the latter, the weight of the wing was directly available in the literature [20]. For the Beechcraft 76 and the Beechcraft 1900, as no real values are publicly available, the comparison is made with a traditional statistical method [4,5,12]. Said statistical methods are applicable to normal category aircraft and commuter aircraft and were established based on database containing aircraft which technological level is close to that of the Beechcraft 76 and 1900. They are written in the Appendix B.
A summary of the results of the validation study is presented in Table 2.
Table 2.
Outputs of the presented methodology applied on the Beechcraft 76, the X-57 Maxwell, and the Beechcraft 1900.
For the Beechcraft 76 use-case, the deviation of the wing mass obtained with the presented semi-analytical model compared to the reference value is less than . The actual value of the wing mass is unknown; however, this result shows that the newly established methodology gives the same results as a classical empirical formula. This prompted the authors to compare the result with an empirical methodology [5]. In this case, the difference computed was of around , which confirms that no significant precision is lost when using the semi-analytical approach.
The same conclusion can be drawn from the validation of the method against the commuter Beechcraft 1900. The empirical formula used to compare the results obtained for this aircraft is selected from [12], which suggests the use of commercial transport aircraft models as the most appropriate choice to describe turbo-propeller aircraft with a maximum take-off mass over 5670 kg, as is the case for this aircraft.
For the NASA X-57 Maxwell use-case, the empirical formula from the literature gives results with an error of around . This can partly be explained by the fact that the correlation was established on aircraft whose wing loading was fairly low because of the flaps technology used. Given that DEP allows one to reach a lift coefficient of over 4.0 in certain configurations [21], this leads to small wings but with heavy structure. By contrast, the semi-analytical methodology provides results that are much closer to the real wing mass. The reason behind this is that it actually takes into account the structure required to withstand the loads compliant with CS-23 requirements.
In addition to the total wing mass, the presented methodology also provides a further breakdown of the wing structural components shown in Table 3.
Table 3.
Detailed mass breakdown (absolute and share of total wing weight) of the Beechcraft 76, the X-57 Maxwell, and the Beechcraft 1900.
From this table, a noticeable remark can be formulated about the change in the proportional importance of the spar caps on the total wing weight. Indeed, for the X-57 Maxwell they take a much larger share. This can be explained by the increase in the wing aspect ratio (AR), which is equal to 15 for X-57 Maxwell, compared to 8 for the Beechcraft 76 and 10.8 for the Beechcraft 1900. The AR is one of the main factors in the computation of the bending moment [3], and since the bending moment is the defining factor for the spar caps computation, this explains such an increase.
3.2. Parametric Studies
3.2.1. Effect of the Engines Weight Distribution
The goal of this study is to see if the presented methodology was capable of replicating the relief in the bending moment that comes from the distribution of engines along the wing. The results are presented in Table 4 and plotted in Figure 6, where the dashed lined is the reference weight for the X-57 Maxwell.
Table 4.
Mass breakdown [kg] of the X-57 Maxwell wing for different number of engines on the wing.
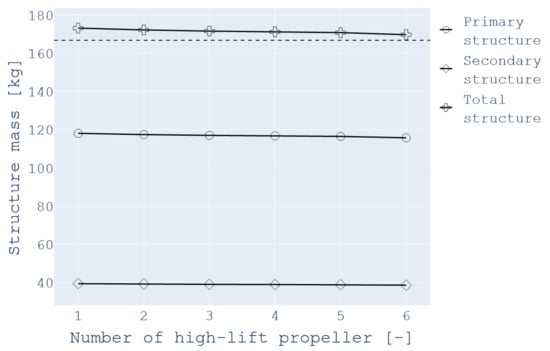
Figure 6.
Effect of the number of engines on the overall wing mass.
The results show an alleviation effect on the total wing mass of around 3.5 kg for an increasing number of engines. It can be observed that the webs, spar caps, and secondary structure masses are the only values that change. As explained before, the ribs and miscellaneous weights are computed through empirical methods. These techniques do not take into account the loads or the number of engines, which justifies that no change is observed. As for the skin, its mass only depends on the characteristic speed of the aircraft. Therefore, considering this study’s assumptions of constant MTOW and no slipstream effects, the skin weight does not vary with the number of engines.
Based on these observations and the hypothesis made regarding the secondary structure mass, which will account for 25% of the total wing mass, the weight variation is due to a change in the primary structure. This is consistent, since the primary mass is mainly obtained as the weight of the material required to withstand the loads. Since the weight of the engines relieves the aerodynamic forces to react to the structure of the wing, a difference in the engine weight and position will impact the structural weight.
For a deeper analysis into the reason for this lightening of the primary structure mass, Figure 7 plots the contribution of each structural component to the primary structure mass. This bar chart was plotted based on the results obtained for the two limit cases with only one HLP and with six HLP.
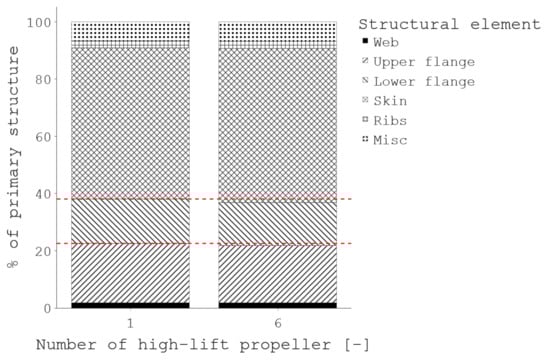
Figure 7.
Effect of the number of engines on the primary structure mass.
As seen in Table 4 and Figure 7, the change in the primary structure mass comes from spar caps and web. In particular, the shear force seen by the web and the bending moment borne by the spar caps are lower. Thus, the structures will be lighter. Similar effects were observed in the literature [22], albeit on bigger aircraft, which reinforces the idea that this model can capture the structural benefits that distributed propulsion can bring forth.
3.2.2. Effect of Slipstream Consideration
This study investigates the impacts of the slipstream effects on the wing sizing. The results are presented in Table 5.
Table 5.
Mass breakdown (kg) of the X-57 Maxwell wing with and without slipstream effects considered.
The results reveal a sensitivity of almost 5 kg (≃3%), resulting in a heavier wing when the induced velocity of the HLP is considered. The air blown by the engines on the wing increases the aerodynamic loads that the wing structure reacts to. Consequently, reinforced and heavier web and spar caps are required.
On the other hand, the current analysis highlights an important point. Depending on the power considered for the HLPs, the slipstream can heavily constrain the wing sizing. In the current approach, a minimum thrust is set, since the study is performed immediately at the end of the climbing phase at speed. However, in more detailed design stages, the take-off phase will have to be analyzed with full engine power. In this case, the slipstream effect will significantly exceed the actual , challenging the choice of using as the sizing point. The point of design was chosen based on the maximum load factor obtained within the maneuver and gust envelopes. However, for commuter-category aircraft, the certification specification requires us to also consider the point of maximum gust from the gust envelope [15].
The V-n diagram we obtained in our study on the Beechcraft 1900 is shown in Figure 8, in which point A corresponds to the point we considered and point B corresponds to the maneuvering point. At this point, even if the load factor is no greater than at cruise, the speed is lower and thus the slipstream effects are greater. As a result, this might lead to a less homogeneous aerodynamic loads and a need for stronger primary structure.
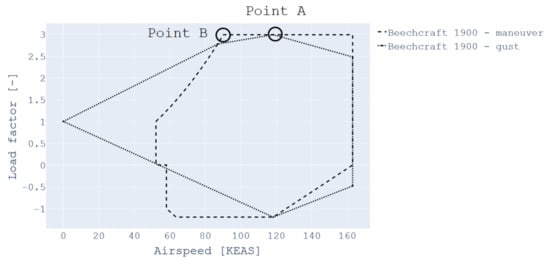
Figure 8.
V-n diagram obtained by FAST-OAD-GA for the Beechcraft 1900, a commuter type aircraft.
3.3. Effect of Engine Placement
This study focuses on the effect of changing the location of a sole engine along the wing span for a twin-engine aircraft. The reference case is the Beechcraft 76. The results are presented in Figure 9.
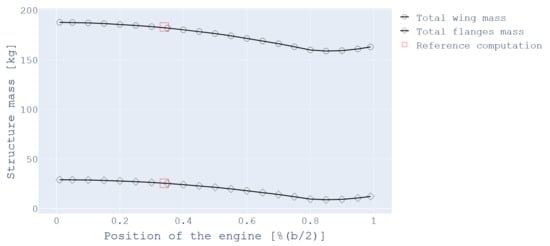
Figure 9.
Effect of the location of the engine on the wing and caps mass.
The results show that the further the engine is from the fuselage, the lighter the spar caps are and thus the lighter the wing mass. This echoes results presented in Section 3.2.1 for the study of distributing the propulsion over the whole wing. The amplitude of the changes, however, is much more significant, around 16% of the baseline weight. These results lead to the same conclusion developed in [22]: moving the thrust generation on the outer part can have a positive impact on the wings’ structural weight. Nevertheless, the last points of the figure may be too optimistic, as the model currently does not take into account any structural reinforcement that would be needed to withstand such a mass at the wingtip. It also omits the case of hard landing, which might constrain the stiffness of the wing.
Placing the engine outboard can have significant positive or negative impacts on the overall aircraft design. On one hand, studies on the aerodynamic effect of placing an engine at the tip have shown that clear reduction of the induced drag have been obtained [21,23]. On the other hand, the closer the engines are to the wingtips, the higher the roll inertia of the aircraft will be. This will result in either a decreased roll rate or in larger aileron, which means more complexity and weight. It can also affect the sizing of the vertical tail plane in case of an engine failure during low speed conditions. A rough estimation of the vertical area needed based on the one- engine-inoperative certification requirements was made using FAST-OAD-GA. The results show that from the baseline configuration to the case where the engine is at the tip, the required area is more than doubled. This illustrates that while wing weight savings may be obtained, the overall empty weight might increase, highlighting the importance of coupling this method with an overall aircraft design process.
3.4. Computational Time
One of the main objectives of the newly developed methodology was that, once implemented in an overall aircraft sizing tool, its computational time was to remain acceptable for conceptual and preliminary design. Numerous experiments were conducted on each use-cases configuration, and the time to converge was registered. The average results presented in Table 6 were obtained.
Table 6.
Comparison of the computational time between the newly developed methodology and statistical formula.
As expected, the newly developed methodology takes more times than the statistical formula suggests. However, the time is fairly low compared to some other modules of FAST-OAD-GA (mainly propeller performances and aerodynamic computations). With the default sizing process, the computation of the OEW (where the developed method is used) is entered three times in each iteration. Knowing that it takes 10 to 15 iterations to converge, the new model only adds around 7 s to the overall process. Compared to the 5–10 min needed for the whole FAST-OAD-GA process to converge, the time added by the new methodology is deemed acceptable. It is also worth noting that there is a strong dependency of the computational time on the initial estimated wing mass. During all those studies, the initial point was taken as the result provided by a statistical formula [4]. This partly explains why the process was much faster on a traditional aircraft for which both results are fairly close. By using the real wing mass of the X-57 Maxwell as the initial value, the time necessary to converge on the wing mass was decreased to about 120 ms. There is, however, a difficulty in repeatedly predicting an initial wing mass that is close to the results. This implies that for unusual wing configurations, the process might take longer to converge than for a conventional design.
4. Discussion
The newly developed methodology has proved to be accurate for a conventional twin-engine aircraft, an innovative DEP concept and a commuter aircraft, and it has provided valuable estimations at preliminary aircraft design stage. However, results must be considered carefully. Indeed, even if FAST-OAD-GA allows those values to be changed, a certain number of the assumptions retained in this paper for the structure of the wing (e.g., height of the spar caps, wingbox depth) are based on commonly used values, which may be a source for errors and would require attention from aircraft designers. Some of the computations could also be further improved, namely the ribs’ mass, which is currently obtained with an assumed constant spacing. This could be improved by considering, for instance, that the ribs are sized to prevent the wing from buckling [10,24].
For the skin weight, early results in conventional design seemed to show that the deformation criterion was more constraining than the stress one. However, the use of leading edge propellers placed further from the leading edge may reverse this common tendency. This position has been identified as a major design parameter when considering the sizing of a wing with distributed propulsion [16]. It also plays a major role in the computation of the torsion moment and has an impact on the aerostructural properties of the wing by moving the section’s center of gravity forward [25].
On the topic of aero-structural interaction, it was considered that for every aircraft using distributed propulsion, an additional 10% should be added to the wing mass to prevent flutter. This percentage was the mean value of several experiments on different DEP configurations [14]. Further improvements could be added to the presented methodology by running tailored aero-structural analysis to better estimate this coefficient. This, however, would come with an increased computational time and would be an optional module in FAST-OAD-GA.
5. Conclusions
In this paper, and in the context of the continuous improvement of FAST-OAD-GA, a methodology has been developed to estimate the structural mass breakdown of a wing that while taking into account the effect of distributed propulsion. This was done by adapting a semi-analytical methodology to take into account a realistic load distribution. This new method was specifically designed for aircraft covered by the EASA CS-23 certification specification and was adapted for use in the conceptual and preliminary design stages. Good agreement with actual available aircraft data or previous methodology was shown, and documented effects could be replicated, which justifies its use inside the mass estimation step of the overall aircraft design process. The novelty of this method comes not only from the adaptation of the models to conform to CS-23 and to enable the consideration of DEP, but also from the work that has been done regarding its ease of integration inside an overall aircraft sizing tool. Thus, the present work enables a preliminary consideration of the structural synergies brought forth by DEP. In addition to that and thanks to FAST-OAD-GA’s API, this model can be used in any Python-based OAD tools.
Supplementary Materials
FAST-OAD is available online at https://github.com/fast-aircraft-design/FAST-OAD, accessed on 26 November 2021; FAST-OAD-GA is available online at https://github.com/supaero-aircraft-design/FAST-GA, accessed on 26 November 2021.
Author Contributions
Conceptualization E.B., J.J. and R.A.C.; methodology, R.A.C. and F.L.; software, R.A.C. and F.L.; validation, R.A.C. and F.L.; investigation, R.A.C. and F.L.; data curation, F.L.; writing—original draft preparation, R.A.C., F.L., E.B. and J.J.; writing—review and editing, F.L., R.A.C. and J.J.; visualization, F.L.; supervision, J.J. and E.B. All authors have read and agreed to the published version of the manuscript.
Funding
The presented work is supported by Daher through the research chair ISAAR “Innovative Solutions for Aviation Architecture & Regulation”.
Institutional Review Board Statement
Not applicable.
Informed Consent Statement
Not applicable.
Data Availability Statement
The data presented in this study are available in the FAST-OAD-GA repository in Supplementary Materials and in the article.
Acknowledgments
The authors acknowledge the support of Daher through the research chair ISAAR “Innovative Solutions for Aviation Architecture & Regulation”.
Conflicts of Interest
The authors declare no conflict of interest.
Abbreviations
The following abbreviations are used in this manuscript:
| AR | Aspect Ratio |
| DEP | Distributed Electric Propulsion |
| EASA | European Union Aviation Safety Agency |
| FAST | Future Aircraft Sizing Tool |
| GA | General Aviation |
| HLP | High-Lift Propeller |
| MTOW | Maximum Take-Off Weight |
| OAD | Overall Aircraft Design |
| OEW | Operating Empty Weight |
| OEI | One Engine Inoperative |
| WTP | WingTip Propeller |
Appendix A. Statistical Formula Used for Methodology Validation
This formula taken from [4] estimates the wing mass based on the wing area in ft, the fuel weight inside the wing in lb, the aspect ratio A, the sweep angle at 25% MAC in rad, the dynamic pressure at cruise q in lb/ft, the taper ratio , the thickness-to-chord ratio t/c, the ultimate load factor N, and the flight design gross weight W in lb.
The formula from [5] computes the wing mass based on the ultimate load factor N, the flight design gross weight W in lb, the aspect ratio A, the sweep angle at 25% MAC in rad, the wing area in ft, the taper ratio , the thickness-to-chord ratio t/c, and the maximum level airspeed at sea level V in KEAS.
The formula from [12] used for the Beechcraft 1900 uses the maximum zero fuel weight W in lb, the span b in ft, the sweep angle at 50% MAC in rad, the ultimate load factor N, the wing area in ft, and the maximum thickness at wing root t in ft.
Appendix B. Reference Technical Data for the X-57 Maxwell and the Beechcraft 76
Table A1.
Aircraft weights.
Table A1.
Aircraft weights.
| Parameter | Unit | X-57 Maxwell | Beechcraft 76 | Beechcraft 1900 |
|---|---|---|---|---|
| MTOW | kg | 1360 | 1769 | 7688 |
| MZFW | kg | 1360 | 1381.7 | 6804 |
| Wing mass | kg | 166.7 | - | - |
| Design fuel | kg | 0 | 387.3 | 884 |
Table A2.
Aircraft geometry.
Table A2.
Aircraft geometry.
| Parameter | Unit | X-57 Maxwell | Beechcraft 76 | Beechcraft 1900 |
|---|---|---|---|---|
| Fuselage width | m | 1.22 | 1.20 | 1.38 |
| Wing span | m | 9.66 | 11.58 | 17.67 |
| Aspect ratio | - | 15 | 7.98 | 10.84 |
| Wing surface | m | 6.2 | 16.8 | 28.8 |
| Root chord | m | 0.74 | 1.48 | 2.22 |
| Root thickness | m | 0.088 | 0.21 | 0.4 |
| Tip chord | m | 0.52 | 1.42 | 0.93 |
| Leading edge sweep | deg | 1.9 | 0.0 | 0.0 |
| Aileron chord | %c | 25 | 26 | 0.28 |
| Aileron span | %b/2 | 22 | 32 | 0.38 |
| Aileron max deflection | deg | 22 | 20 | 20 |
| Airfoil thickness ratio | - | 0.12 | 0.15 | 0.18 |
| Ribs step | m | 0.6 | 0.6 | 0.6 |
Table A3.
Aircraft aerodynamics.
Table A3.
Aircraft aerodynamics.
| Parameter | Unit | X-57 Maxwell | Beechcraft 76 | Beechcraft 1900 |
|---|---|---|---|---|
| Cruise altitude | ft | 8000 | 8000 | 20,000 |
| Cl | rad | 6.1 | 5.55 | 7.0 |
| Cl | - | 4.2 | 1.97 | 2.10 |
Table A4.
Aircraft design airspeeds (EAS).
Table A4.
Aircraft design airspeeds (EAS).
| Parameter | Unit | X-57 Maxwell | Beechcraft 76 | Beechcraft 1900 |
|---|---|---|---|---|
| V | m·s | 78.19 | 78.63 | 118.27 |
| V | m·s | 97.7 | 110.0 | 163.02 |
| V | m·s | 58.17 | 64.75 | 90.38 |
Table A5.
Propulsion.
Table A5.
Propulsion.
| Parameter | Unit | X-57 Maxwell | Beechcraft 76 | Beechcraft 1900 |
|---|---|---|---|---|
| Cruise engines | nº | 2 | 2 | 2 |
| HLP engines | nº | 12 | 0 | 0 |
| Cruise engine power | kW | 60.0 | 130.0 | 953 |
| HLP power | kW | 10.5 | - | - |
| Cruise engines weight | kg | 53.1 | 175.0 | 325.4 |
| HLP weight | kg | 6.8 | - | - |
| Cruise propeller dia | m | 1.5 | 1.93 | 2.78 |
| HLP dia | m | 0.58 | - | - |
Table A6.
Mission.
Table A6.
Mission.
| Parameter | Unit | X-57 Maxwell | Beechcraft 76 | Beechcraft 1900 |
|---|---|---|---|---|
| q | lb/ft | 61.48 | 72.44 | - |
| V | KEAS | 150 | 153 | - |
| N | - | 6.12 | 5.7 | 4.5 |
References
- Moore, K.R.; Ning, A. Distributed electric propulsion effects on existing aircraft through multidisciplinary optimization. In Proceedings of the 2018 AIAA/ASCE/AHS/ASC Structures, Structural Dynamics, and Materials Conference, Kissimmee, FL, USA, 8–12 January 2018; p. 1652. [Google Scholar]
- Ko, A.; Schetz, J.A.; Mason, W.H. Assessment of the potential advantages of distributed-propulsion for aircraft. In Proceedings of the XVI International Symposium on Air Breathing Engines (ISABE), Cleveland, OH, USA, 31 August–5 September 2003. [Google Scholar]
- Gudmundsson, S. General Aviation Aircraft Design: Applied Methods and Procedures; Butterworth-Heinemann: Oxford, UK; Waltham, MA, USA, 2013. [Google Scholar]
- Raymer, D.P. Aircraft Design: A Conceptual Approach; AIAA Education Series; American Institute of Aeronautics and Astronautics: Reston, VA, USA, 2012. [Google Scholar]
- Nicolai, L.M.; Carichner, G.E. Fundamentals of Aircraft and Airship Design, Volume 1—Aircraft Design; American Institute of Aeronautics and Astronautics: Reston, VA, USA, 2010. [Google Scholar]
- Dorbath, F. A Flexible Wing Modeling and Physical Mass Estimation System for Early Aircraft Design Stages. Ph.D. Thesis, Technische Universität Hamburg, Hamburg, Germany, 2014. [Google Scholar]
- Wells, D.P.; Horvath, B.L.; McCullers, L.A. The Flight Optimization System Weights Estimation Method. 2017. Available online: https://ntrs.nasa.gov/api/citations/20170005851/downloads/20170005851.pdf (accessed on 17 November 2021).
- Bindolino, G.; Ghiringhelli, G.; Ricci, S.; Terraneo, M. Multilevel structural optimization for preliminary wing-box weight estimation. J. Aircr. 2010, 47, 475–489. [Google Scholar] [CrossRef]
- Torenbeek, E. Development and Application of a Comprehensive, Design-Sensitive Weight Prediction Method for Wing Structures of Transport Category Aircraft; Delft University of Technology, Faculty of Aerospace Engineering, Report LR-693; Delft University of Technology: Delft, The Netherlands, 1992. [Google Scholar]
- Roux, E. Modèle de Masse Voilure: Avions de Transport Civil. Ph.D. Thesis, SupAéro-ONERA, Toulouse, France, 2006. [Google Scholar]
- David, C.; Delbecq, S.; Defoort, S.; Schmollgruber, P.; Benard, E.; Pommier-Budinger, V. From FAST to FAST-OAD: An open source framework for rapid Overall Aircraft Design. In IOP Conference Series: Materials Science and Engineering; IOP Publishing: Bristol, UK, 2021; Volume 1024, p. 012062. [Google Scholar]
- Roskam, J. Airplane Design: Part 5—Component Weight Estimation; DARcorporation: Lawrence, KS, USA, 1985. [Google Scholar]
- Litherland, B.; Rieth, K. VSP Aircraft Analysis User Manual; NASA: Washington, DC, USA, 2014. [Google Scholar]
- An, S. Aeroelastic Design of a Lightweight Distributed Electric Propulsion Aircraft with Flutter and Strength Requirements. Ph.D. Thesis, Georgia Institute of Technology, Atlanta, GA, USA, 2015. [Google Scholar]
- EASA. Certification Specifications and Acceptable Means of Compliance for Normal, Utility, Aerobatic, and Commuter Category Aeroplanes CS-23 Amendment 4. July 2015. Available online: https://www.easa.europa.eu/sites/default/files/dfu/CS-23%20Amendment%204.pdf (accessed on 17 November 2021).
- Patterson, M.D. Conceptual Design of High-Lift Propeller Systems for Small Electric Aircraft. Ph.D. Thesis, Georgia Institute of Technology, Atlanta, GA, USA, 2016. [Google Scholar]
- Borer, N.K.; Patterson, M.D. X-57 High-Lift Propeller Control Schedule Development. In Proceedings of the AIAA AVIATION 2020 FORUM, Virtual Event, 15–19 June 2020; p. 3091. [Google Scholar]
- Ruscio, J.P.; Jezegou, J.; Benard, E.; Gomez Pacheco, A.; Laonet, P.; Alonso Castilla, R. Hybrid electric distributed propulsion overall aircraft design process and models for general aviation (FAST GA). In IOP Conference Series: Materials Science and Engineering; IOP Publishing: Bristol, UK, 2021; Volume 1024, p. 012072. [Google Scholar]
- Li, W. Overview of the X-57 Structural Requirements, Modifications, and Airworthiness. 2019. Available online: https://ntrs.nasa.gov/api/citations/20190026541/downloads/20190026541.pdf (accessed on 17 November 2021).
- Moore, M.D. Distributed Electric Propulsion (DEP) Aircraft; NASA Langley Research Center: Hampton, VA, USA, 2012. [Google Scholar]
- Deere, K.A.; Viken, J.K.; Viken, S.; Carter, M.B.; Wiese, M.; Farr, N. Computational analysis of a wing designed for the X-57 distributed electric propulsion aircraft. In Proceedings of the 35th AIAA Applied Aerodynamics Conference, Denver, CO, USA, 5–9 June 2017; p. 3923. [Google Scholar]
- Habermann, A.L. Effects of Distributed Propulsion on Wing Mass in Aircraft Conceptual Design. In Proceedings of the AIAA AVIATION 2020 FORUM, Virtual Event, 15–19 June 2020; p. 2625. [Google Scholar]
- Sinnige, T.; van Arnhem, N.; Stokkermans, T.C.; Eitelberg, G.; Veldhuis, L.L. Wingtip-mounted propellers: Aerodynamic analysis of interaction effects and comparison with conventional layout. J. Aircr. 2019, 56, 295–312. [Google Scholar] [CrossRef] [Green Version]
- Niu, C.; Niu, M.C. Airframe Structural Design: Practical Design Information and Data on Aircraft Structures; Conmilit Press: Hong-Kong, China, 1988. [Google Scholar]
- Megson, T.H.G. Aircraft Structures for Engineering Students; Butterworth-Heinemann: Oxford, UK; Waltham, MA, USA, 2016. [Google Scholar]
Publisher’s Note: MDPI stays neutral with regard to jurisdictional claims in published maps and institutional affiliations. |
© 2021 by the authors. Licensee MDPI, Basel, Switzerland. This article is an open access article distributed under the terms and conditions of the Creative Commons Attribution (CC BY) license (https://creativecommons.org/licenses/by/4.0/).