Abstract
With the cost-saving benefits of reusable launch vehicles (RLVs), South Korea is pursuing the application of reusability technologies to KSLV-III. While SpaceX currently reuses only the first stage of Falcon 9, the Starship program aims for full-stage recovery, motivating further examination of second-stage reuse. This study extends the scope of the analysis to medium-class launch vehicles and evaluates the feasibility of second-stage reuse for two vehicle scales. The performance losses associated with three recovery methods—vertical landing, parachute, and fly-back—are quantitatively assessed using conceptual-level recovery system design and simplified mass modeling. For KSLV-III, a conceptual expendable medium-class launch vehicle capable of delivering a 10-ton payload to a 200 km low Earth orbit (LEO) was designed using an algebraic modeling approach. Based on this reference design, the recovery methods were evaluated for both medium-class and super-heavy-class vehicles. Results of the present order-of-magnitude conceptual trade study show that, for medium-class vehicles, the parachute provides the highest performance, followed by fly-back, while vertical landing yields the lowest. For super-heavy vehicles, the parachute remains the most effective, but vertical landing becomes the second-best option, with fly-back exhibiting the lowest performance. As the vehicle scale increases, parachute effectiveness declines, fly-back performance improves, and vertical landing shows the greatest performance gains. However, parachute becomes impractical for super-heavy vehicles due to structural limitations, making vertical landing the most viable option. In contrast, medium-class vehicles do not necessarily require vertical landing, and the optimal recovery strategy should be chosen based on vehicle structural characteristics and mission objectives. This study provides insights that support the selection of efficient recovery strategies during the early design phase of RLVs.
1. Introduction
The space industry has entered the New Space era, transitioning from government-led to private-sector-driven initiatives, resulting in lower entry barriers and continued industry growth [1]. Morgan Stanley forecasts that the global space industry, valued at $350 billion in 2018, will generate over $1.1 trillion by 2040, with satellite broadband services for low Earth orbit (LEO) clusters accounting for 50% of this growth [2]. Consequently, innovations are actively pursued to reduce the cost per launch, including the development of larger launch vehicles and the application of reusability technologies. Reusability and scale of the vehicle are considered the most effective methods to reduce launch costs, and many companies and research institutes are working on these technologies, especially following SpaceX’s success with Falcon 9 recovery and reusability [3,4].
South Korea entered the launch vehicle industry with the KSLV-II program and is now advancing its capabilities. The KSLV-III development project, planned for 2022 to 2032, aims to meet domestic and international space demands while aligning with global trends in the space industry. One aspect under consideration in this effort is first-stage reuse [1,5]. However, the reuse of the first stage has already become a common technology, and in order to secure a competitive advantage in the launch vehicle market, new technical innovations are necessary. Therefore, there is potential to consider the reuse of the second stage to fully realize vehicle reusability and further reduce launch costs. SpaceX is also conducting research on the reuse of the second stage through its Starship program, which is expected to significantly reduce low Earth orbit satellite launch costs.
The most critical element in the development of reusable launch vehicle technology is the recovery method, as it directly affects the cost structure of the reusable system. While numerous studies have examined concepts for launch vehicle reuse and recovery, most have remained limited to survey-oriented and qualitative discussions. Quantitative comparisons of efficiency or performance among different reuse strategies are relatively scarce, and such analyses have typically been conducted for a single launch vehicle or a specific vehicle class. In particular, despite the significant technical and economic implications of upper-stage recovery, quantitative evaluations of second-stage reuse strategies are almost nonexistent. Furthermore, recent trends indicate a shift toward larger and super-heavy launch vehicles. Accordingly, comparative analyses of recovery strategies across different vehicle scales are essential for understanding the scalability and applicability of reuse concepts. This study addresses these research gaps by conducting a quantitative comparative analysis of second-stage recovery methods across different launch vehicle scales [6,7,8,9,10].
Examples of recovery methods for reusable launch vehicles are provided in Figure 1. The most widely adopted approach today is the vertical landing method demonstrated by SpaceX. This method decelerates the vehicle through engine re-ignition and thrust reversal, enabling a vertical touchdown. Similar technologies are being pursued by Blue Origin, ESA, and China’s iSpace and Link Space. Despite its technical complexity and high development cost, vertical landing offers advantages such as simplified recovery operations and applicability to celestial bodies without an atmosphere, such as the Moon or Mars. However, SpaceX’s launch vehicles employing vertical landing are super-heavy systems, and recovering a heavy upper stage is significantly more costly than the first-stage recovery [7]. Therefore, whether such an approach is suitable for upper stages of launch vehicles with different sizes or specifications requires further examination [9].

Figure 1.
Investigation into development trends in Reusable Launch Vehicles [11,12,13,14,15,16,17,18,19].
Parachute recovery is a traditional method where parachutes are deployed during re-entry to slow down and land on the ground or water. This method has been used in manned missions, such as Apollo, Orion, and Soyuz. It is technically less complex and has lower recovery system development costs. Recently, it has been applied to NASA’s Orion re-entry capsules, Blue Origin’s New Shepard, and Rocket Lab’s Electron, which uses a helicopter for recovery after parachute water landing.
Fly-back recovery involves using aerodynamic lift to slow down the vehicle and land on a runway, similar to an aircraft. This method does not require additional fuel during landing, and it facilitates easier ground recovery. It is particularly advantageous for crewed missions due to its design flexibility. NASA’s Space Shuttle, Boeing’s X-37B, and Virgin Galactic’s SpacesShipTwo have employed this method, while other systems like Sierra Space’s Dream Chaser and ESA’s IXV are under development.
Launch vehicles are classified according to their payload capacity as small-lift (payload < 2 t), medium-lift (2 t < payload < 20 t), heavy-lift (20 t < payload < 50 t), and super-heavy-lift vehicles (50 t < payload) [20]. In this study, the medium-class launch vehicle is modeled based on KSLV-III, while the super-heavy launch vehicle is modeled after SpaceX’s Starship. Using these reference configurations, the effective payload capability is evaluated for three recovery methods—vertical landing, parachute, and fly-back. By comparing their respective advantages and disadvantages, this study aims to propose suitable second-stage recovery strategies according to vehicle scale.
2. Conceptual Design of a Launch Vehicle
2.1. Mission Design and Overview
The overall methodology of this study is illustrated in the flowchart in Figure 2a [21]. The process begins with mission selection and the estimation of the target launch vehicle’s specifications. Since the detailed specifications of KSLV-III have not been publicly disclosed, a conceptual design of a launch vehicle incorporating additional TPS is required for comparison with Starship. Previous studies on launch vehicle design have been conducted in [22,23,24,25,26,27], and building upon this foundation, the present study applies the algebraic modeling approach of [27] to perform a rapid performance evaluation. A conceptual design of the expendable launch vehicle was first developed accordingly. Because second-stage reuse is typically applied to low Earth orbit missions, a 200 km LEO mission was selected as the reference mission for recovery analysis. For KSLV-III, a 10-ton payload LEO mission was adopted following [5]. Vehicle sizing was then performed, resulting in the baseline fully expendable configuration capable of orbital insertion. Subsequently, the recovery system mass for each recovery method was calculated, and the resulting performance loss was reflected in the effective payload for comparison.
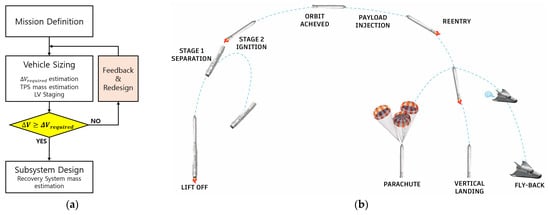
Figure 2.
(a) Flowchart of launch vehicle conceptual design. (b) Launch vehicle sequence.
The operational sequence of the launch vehicle is shown in Figure 2b. Following first-stage ignition and separation, the second stage ignites, inserts the payload into orbit, and then proceeds to atmospheric re-entry before being recovered according to the selected recovery method. In conventional expendable launch vehicles, the fairing is typically jettisoned during the ascent phase to reduce structural mass. However, in this study, to maintain consistency in the re-entry configuration across different vehicle scales and to enable a fair comparison of recovery methods, the operational concept of Starship is referenced, and the KSLV-III is likewise assumed to retain its fairing during re-entry. Retaining the fairing is expected to reduce aerodynamic drag and mitigate thermal loads during atmospheric re-entry. Furthermore, the structural effects associated with fairing retention are reflected through modifications to the structural coefficient and are incorporated into the velocity increment calculations [28].
2.2. Selection of Design Parameters and Estimation of ΔV Required
The specifications of the KSLV-III are based on the version from the 2022 concept review, where some specifications were not provided. These parameters are estimated using algebraic modeling, and the calculated specification is shown in Table 1 [5].

Table 1.
Specifications of KSLV-III.
To verify the validity of the velocity increment estimated through algebraic modeling, the required velocity increment (ΔV) was calculated, and it was examined whether the launch vehicle could achieve this ΔV. Since this study is conducted at the conceptual design stage, detailed trajectory optimization or numerical integration of the equations of motion was not performed. Instead, simplified assumptions based on literature surveys were adopted to rapidly estimate the required ΔV. The required velocity increment is composed of the orbital velocity, gravitational loss, drag loss, and steering loss. Since the launch is conducted from South Korea with an inclination toward a polar orbit, the velocity gain from Earth’s rotation is not considered [21].
The orbital speed is derived assuming a circular orbit [21]. The drag loss was estimated based on the drag loss of KSLV-II(Nuri) using area scaling relations [25,29]. Steering loss is derived from the data of the KSLV-I(Naro), which employs a two-stage configuration [21]. The gravitational loss is expressed through the conservation of momentum, as shown in the following equation. Since trajectory factors are not considered, a correction factor of 0.8 is applied based on the reference in [30]. The calculated required velocity increment is shown in Figure 3.
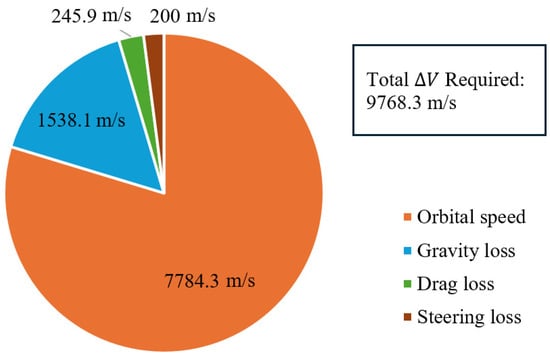
Figure 3.
ΔV Required.
The estimated velocity increment for the KSLV-III based on the disclosed specifications is 9651.7 m/s, which is 117.3 m/s short of the required velocity increment of 9768.3 m/s. This discrepancy is likely due to inaccuracies in estimating the steering loss of the KSLV-III, and the discrepancy is within an acceptable margin for a conceptual design study. Based on this, the conceptual design is proceeded using the calculated required velocity increment and the KSLV-III specifications.
2.3. TPS Weight Estimation
The launch vehicle in this study is designed for the reuse of the second stage, so a Thermal Protection System (TPS) is essential to withstand the heat generated by atmospheric friction during re-entry. Therefore, the weight of the TPS will be added to the structural mass of the second stage. The high heat flux occurring during re-entry varies depending on the vehicle’s shape and position, so an appropriate TPS must be selected for the specific thermal environment. General information on TPS for re-entry is shown in Table 2, and the density and maximum operating temperatures are compared in Figure 4.
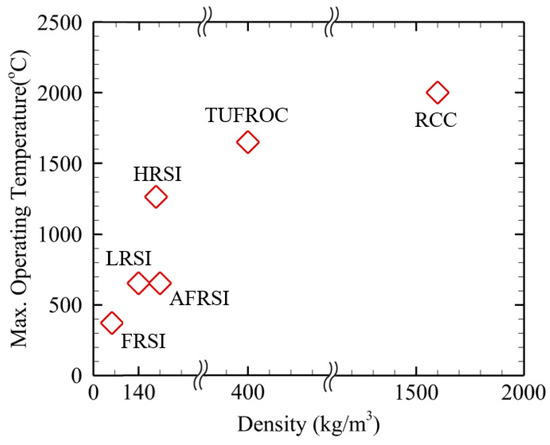
Figure 4.
TPS comparison for density vs. temperature.
Typically, the areas with the highest thermal flux, such as the nosecone and leading edges of the wings, use RCC (Reinforced Carbon-Carbon) and TUFROC (Toughened Uni-piece Fibrous Reinforced Oxidation-resistant Composite), which can tolerate the highest temperatures, while areas with lower thermal flux use tile and blanket TPS materials [31]. The maximum re-entry temperature of the vehicle is assumed to be 1750 K, based on the reference in [32]. In this study, TUFROC is selected for the nosecone and leading edges, considering the material’s weight, heat resistance, and reusability [32]. For other parts, HRSI (High-temperature Reusable Surface Insulation), which has a relatively lighter weight and sufficient thermal resistance, is used.
Table 2.
TPS property [32,33].
Table 2.
TPS property [32,33].
| TPS Material | Type | Operating Temperature Range (°C) | Density (kg/m3) |
|---|---|---|---|
| LRSI * | Tile | 400–650 | 140 |
| HRSI | Tile | 650~1260 | 144 |
| FRSI ** | Blanket | ~370 | 87 |
| AFRSI *** | Blanket | 400~650 | 145 |
| RCC | - | 157~1649 | 1600 |
| TUFROC | ~1650 | 400 |
* LRSI: Low-temperature Reusable Surface Insulation. ** FRSI: Flexible Reusable Surface Insulation. *** AFRSI: Advanced Flexible Reusable Surface Insulation.
To estimate the mass of the thermal protection system (TPS), the external surface area of the vehicle must first be determined. During atmospheric re-entry, assuming that the vehicle enters either vertically or at a certain angle, not all portions of the vehicle surface are directly exposed to the atmosphere. Therefore, TPS application is generally concentrated on the windward area, where thermal loads are highest during re-entry. Examining actual flight vehicle examples, the Space Shuttle employed lightweight TPS on the upper surface, where thermal loads were relatively low, while high-temperature-resistant TPS was concentrated on the lower windward surface [34]. In the case of Starship, the lower half of the vehicle is constructed of stainless steel rather than conventional TPS, and this structure is known to withstand temperatures of up to approximately 1400 °C [35]. In addition, ref. [36] presents a design concept in which lightweight TPS materials are applied to the leeward side, where the heat flux is relatively low [34]. Based on these precedents, this study is limited to first-order mass estimation at the conceptual design stage. Therefore, the TPS analysis focuses on materials with a significant contribution to overall mass and clear structural implications. Accordingly, TPS tile mass estimation was applied only to the lower surface corresponding to the windward side. The vehicle’s surface area is calculated using a proportional formula based on the specifications of the KSLV-III second stage, as indicated in [5].
The thickness of the TUFROC insulation material and HRSI insulation is set to 0.0635 m, as referenced in [31,37,38]. The mass of the thermal protection system was estimated by assuming that TUFROC and HRSI cover 10% and 90% of the total surface area, respectively. As a result, the masses of TUFROC and HRSI were calculated to be 330.2 kg and 1069.4 kg, respectively, yielding a total TPS mass of 1399.6 kg. Similar windward TPS coverage ratios have been reported for reusable spacecraft such as the Space Shuttle and Starship during hypersonic re-entry [34,35,36].
2.4. Design Parameters
The optimization of the KSLV-III involves adding the TPS weight to the second-stage structure mass. Since the vehicle is based on the KSLV-III, the number of engines and engine clustering remains unchanged, and the design variables, such as stage mass ratio and structural coefficient, are selected based on the methodology from [27].
The stage mass ratio represents the mass distribution between the first and second stages, significantly impacting the overall velocity increment. In this study, the optimal stage mass ratio, which maximizes the total velocity increment, is theoretically derived based on the methodology from [25]. As shown in Figure 5, the total mass of the vehicle is kept constant, and the stage mass ratio is varied in increments of 0.5 from the initial specifications. The stage mass ratio that yields the maximum velocity increment is determined to be 6.5:1.

Figure 5.
Velocity increment comparison according to stage-to-stage mass ratio.
A lower structural coefficient improves the vehicle’s performance, but there are limitations due to internal components and durability issues arising from pressure and thermal stresses during flight. The structural mass, excluding the TPS weight, is reduced by 5% in increments up to 20%.
As shown in Figure 6, when the structural coefficient is reduced by 20%, the velocity increment increases to 9822.3 m/s, satisfying the required ΔV of 9768.3 m/s with a reasonable performance margin. At this point, the first-stage structural coefficient is reduced to 0.0552, while the second-stage structural coefficient, including the additional TPS mass required for re-entry, becomes 0.1068. Although this value is slightly higher than the reported structural coefficient of the Falcon 9 first stage [19,23], it remains within a realistic range for medium-class launch vehicles that lack the extensive weight-optimization heritage of large commercial systems. This reduction in structural coefficient not only improves overall vehicle performance but also demonstrates how modest structural optimization can compensate for the added mass of reusability subsystems. These results confirm that the Enhanced KSLV-III configuration is capable of meeting the required mission ΔV with sufficient design margin. The final specifications of the optimized baseline launch vehicle are summarized in Table 3.
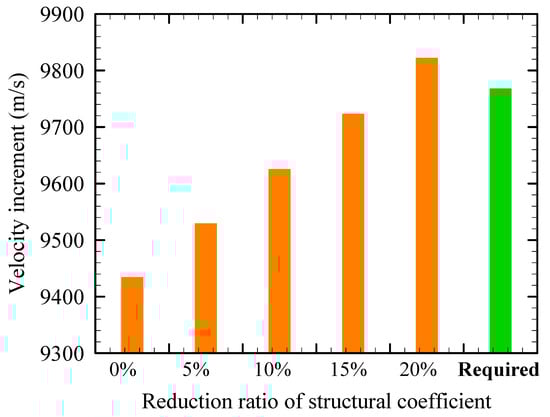
Figure 6.
∆V due to reduction in structural coefficient.
Table 3.
Specifications of the Enhanced KSLV-III.
3. Recovery System Design
For the three recovery methods, the recovery system for each will be designed, and the corresponding mass will be estimated and applied as a loss from the baseline payload. The tasks for each method will be analyzed, and the necessary assumptions will be defined through task analysis. For example, the re-entry sequence will be established, and a reference launch vehicle will be selected. Subsequently, the recovery system design required for mass estimation will be carried out, and the mass will be estimated accordingly. It is assumed that all three methods initiate re-entry at an orbital altitude of 200 km.
To enter the Earth’s atmosphere, it is necessary to decelerate the orbital velocity, a process referred to as Deorbit Burn. If the deceleration is too excessive, the re-entry time will shorten, causing a sharp increase in frictional heating. Therefore, the deceleration rate is set to 1.3% [39]. The fuel required for re-entry is calculated using the Tsiolkovsky rocket equation.
3.1. Vertical Landing
Vertical landing is a technology that enables ground landing through second-stage re-entry combined with controlled engine thrust. Currently, there are no operational reusability cases for the second stage. The main items required for estimating the recovery system mass for vertical landing are the fuel required for reignition and aerodynamic control flaps. The increase in structural mass, such as tanks, due to the increase in fuel, is not considered.
The vertical landing recovery sequence is based on the flight test case of Starship, shown in Figure 7a. After performing the Deorbit Burn and entering the atmosphere, the vehicle glides through aerodynamic control to reduce speed, transitioning from hypersonic to supersonic flight, and finally to subsonic flight. Subsequently, the vehicle flies at a 90° angle of attack before performing a Flip maneuver near the ground, drastically changing its orientation. Afterward, the engine is reignited to perform the Landing Burn, reducing the speed to zero. The fuel required for the Landing Burn is calculated by substituting the vehicle’s speed just before reignition into the rocket equation. The deceleration speed can be referenced from Starship’s flight case; however, since this is not a successful case, the descent speed of other re-entry vehicles was also investigated. Before reaching the ground, both the Vertical landing and Fly-back approaches involve gliding, so the speed data for approaching the runway is provided in Table 4. A conservative deceleration of approximately 150 m/s was assumed, considering the speed loss due to the Flip maneuver.
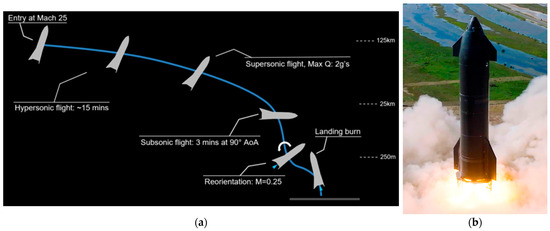
Figure 7.
(a) Starship Launch Profile [40,41]. (b) Starship flaps location [19].
Table 4.
Re-entry vehicle approach speed investigation [42,43,44,45,46].
In Figure 7b, Starship’s aerodynamic control flaps consist of the Forward flaps located near the nose cone and the Aft flaps located near the engine. The weight of the flaps varies depending on the aerodynamic coefficient of their shape, so the area of the flaps is estimated under the assumption that the vehicle’s shape is identical. Using an image of Starship, the area of the Block 2 flaps was estimated using Open VSP of NASA. The length of the Forward flap is assumed to be 7.4 m, the width 3.5 m, resulting in an area of 36.3 m2, and the length of the Aft flap is assumed to be 13 m, with a width of 4.5 m, giving an area of 88.4 m2. When scaling down the wings to match Starship, the length is reduced by a factor of 2/5, resulting in an estimated area of 5.8 m2 for the Forward flap and 14.2 m2 for the Aft flap. Furthermore, the weight of the vertical tail of the aircraft, as described in Section 3.3 of this paper, was used to estimate the weight of the flaps [47]. The data necessary for the calculations, including the load factor, were taken from [48]. The additional weight of the TPS attached to the flaps is included to determine the total weight of the reusable recovery system.
The propulsion system assumptions for vertical landing are simplified at the conceptual design level. The KRE-020 engine applied to the second stage of KSLV-III is designed as a high-altitude engine with a large nozzle expansion ratio; if nozzle pressure mismatch under near-ground conditions is explicitly considered, the effective thrust would be reduced to zero. Therefore, practical second-stage vertical landing would require a propulsion architecture similar to that of Starship, in which engines optimized for high-altitude operation and near-ground operation are separated. In this study, when vertical landing is considered, it is assumed that the second stage is equipped with engines suitable for both operating regimes, and that the engine optimized for near-ground operation is used during the landing phase. This assumption enables a consistent conceptual-level comparison among different recovery methods.
3.2. Parachute Recovery
The parachute recovery method involves deploying a parachute during re-entry to slow the vehicle down before landing on the ground or water. The re-entry sequence proceeds as follows: Deorbit burn for re-entry, followed by free fall, parachute deployment, and finally landing. In this study, the recovery system mass includes the parachute canopy and suspension lines. The parachutes for vehicle recovery are deployed in the following order: pilot parachute, drogue parachute, and main parachute. NASA’s Apollo and Orion missions used three pilot parachutes, two drogue parachutes, and three main parachutes. The number of parachutes was adopted from NASA’s Orion capsule, which has a similar recovery mass [49]. Figure 8 shows the shape and number of parachutes. Since parachutes are deployed in high-speed environments during re-entry, all parachutes are selected to be in a Disk-gap-band shape, which provides stability during high-altitude and high-speed descents. The canopy material is MIL-C-7350 nylon, which offers excellent lightness, durability, and strength, with a weight of 0.0763 kg/m2 per unit area. The size of the pilot parachute is determined not by mass, but is borrowed from the Orion system [49]. The drogue and main parachutes are sized according to the landing load of the Orion spacecraft, using a proportionality formula. The landing load also includes the weight of the parachute itself.
This suggests that parachute recovery may have limitations for super-heavy launch vehicles. If the same parachute size as the Orion parachutes is used, 21 parachutes would be required. However, this would make the system overly complex, and the risk of parachute line interference would significantly reduce its operability. In practice, the maximum number of deployable parachutes is generally limited to approximately 9–10, as the use of more than 12 military-class parachutes is known to cause significant mutual interference and unstable operation. Accordingly, a configuration employing 10 parachutes is assumed in this study as a more realistic upper bound [50].

Figure 8.
(a) Parachute deployment [51]. (b) Disk-gap-band design [52].
3.3. Fly-Back Recovery
Fly-back recovery involves designing vehicles with an exterior similar to an aircraft, using aerodynamic lift to reduce speed and land on a runway. This method requires advanced vehicle control technology but offers the advantage of minimal fuel consumption. It is also suitable for crewed missions due to its internal space configuration. The re-entry sequence is as follows: During re-entry, the Deorbit burn is performed to reduce orbital velocity, followed by gliding without power, and finally landing on the runway. The recovery system design is based on aircraft conceptual design principles, following the Refined Sizing Method presented in [47]. It is assumed that no fuel is used during the glide phase, and the fuel fraction is set to 1. The recovery system mass estimate includes the main wing, tail wing, and landing gear. The external shape of the vehicle is designed to resemble that of an aircraft, so it differs from the second stage of the Enhanced KSLV-III. The vehicle size is chosen to accommodate a cargo space of at least 60 m2, based on satellite density [53]. The reference aircraft for design is Boeing’s X-37B, which uses a delta-wing shape for easy direction control during re-entry.
The wing loading is estimated by comparing the values from the X-37B [54], stall speed estimates, and lift-to-drag ratio values, selecting the lowest value derived from the lift-to-drag ratio. The results of these methods are shown in Table 5.
Table 5.
Wing loading by estimation method.
The wing loading derived using the lift-to-drag ratio method satisfies the required glide angle of 7.5° near the surface. Using Equations (3)–(8), CD,0 is estimated, and Sref is calculated. The wing loading value will vary depending on the aircraft’s shape and weight [55]. The other shape design and landing gear are estimated using statistical formulas from jet fighter designs. The final design shape is shown in Figure 9b, with weight estimation based on the experience of jet fighter aircraft designs. Although the windged configuration is thought to have some effect on the aerodynamic characteristics at launch, it was assumed to be insignificant and not considered in this preliminary design stage.
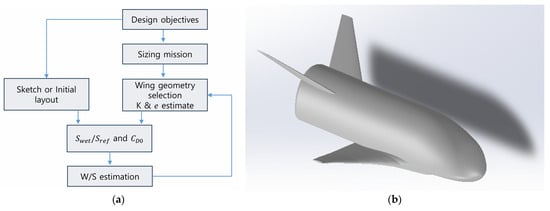
Figure 9.
(a) Aircraft design process [47]. (b) Configuration of fly-back 2nd stage.
Re-entry vehicles and fighter jets share similar characteristics but are distinct types of aircraft. Re-entry vehicles must endure more extreme environmental conditions than fighter jets, and their wing structures, in particular, tend to be denser compared to those of conventional aircraft [56]. Due to these differences, the trend in the weight of re-entry vehicles can be estimated using fighter jet experience-based formulas, but the accuracy of the resulting values may be of a different order of magnitude, making them potentially unreliable.
To address this, the approximate empty weight buildup method [47], which is commonly used in aircraft conceptual design, was applied in this study to estimate the wing weight based on the specifications of the Space Shuttle Orbiter (including empty weight and engines) and the X-37B. The corresponding results are presented in Figure 10. When the W/S-based method employed in this study (fighter aircraft experience-based formula) was applied to the Orbiter configuration, the wing weights estimated using the approximate empty weight buildup method were 6637 kg for the Space Shuttle Orbiter and 343.9 kg for the X-37B. These values are approximately 1.65 times and 1.79 times larger, respectively, than those predicted by the same experience-based formula. Based on these comparisons, a correction factor of 1.6 was introduced and applied to the fighter aircraft experience-based formula to obtain more reasonable wing weight estimates at the conceptual design stage. This approach helps compensate for the limitations of experience-based formulas when applied to re-entry vehicles by incorporating comparisons with actual load-related data. The uncertainty associated with the proposed method is estimated to be on the order of 20%, and detailed wing structural analysis will be required in future design phases to further refine the weight estimation. Reasonable variations (±20%) in the adopted correction factor do not change the relative ranking of recovery strategies.
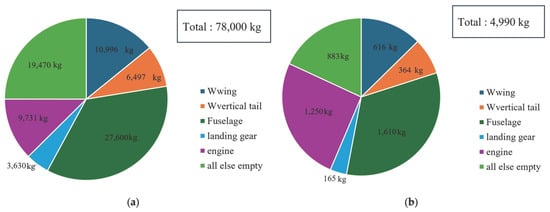
Figure 10.
(a) Estimation of the mass of the Space shuttle orbiter. (b) Estimation of the mass of the X-37B.
4. Results and Discussions
The detailed specifications of the recovery systems for the three recovery methods are shown in Table 6, Table 7 and Table 8 across two vehicle scales. The mass of the recovery systems and the available payload are included, reflecting the changes in the TPS area. The mass of each recovery system can be included in the fuel and structural mass.
Table 6.
Vertical landing specification and result.
Table 7.
Parachute specifications and result.
Table 8.
Fly-back specifications and results.
It is assumed that the TPS is attached to one side of the second stage, and thus, the attachment area varies depending on the surface area of the second stage. For the parachute, the external shape of the Enhanced KSLV-III second stage is similar. In contrast, the fly-back and vertical landing methods have a larger TPS attachment area due to the larger wing. Vertical landing presents the fuel amounts required for the two burns and the specifications of the flaps in Table 6.
The parachute method provides the weight of the three parachutes, the mass corresponding to canopy area, the mass associated with suspension lines, and the fuel required for the re-entry burn in Table 7. Fly-back landing presents the specifications of the main wing and tail wing, as well as the weight of the landing gear, as shown in Table 8.
4.1. Starship Class
The specifications of Starship were based on the Block 2 version, and missing specifications were estimated [19]. The number of parachutes was realistically adjusted. The Enhanced KSLV-III and Starship classes are completely different vehicles with different missions and stage mass ratios, so the comparison of recovery system weight was made based on the structure mass of the second stage during re-entry.
The estimated Starship class specifications and recovery system weight are shown in Table 9. Figure 11 compares the available effective payload calculated by subtracting the recovery system mass from the payload loss when Starship’s baseline payload is 250 t. While parachutes had the highest available effective payload, similar to the Enhanced KSLV-III, vertical landing and Fly-back showed higher available effective payloads compared to the Enhanced KSLV-III case. The reason why vertical landing is more advantageous than fly-back is that, despite using fuel, vertical landing results in a smaller difference in wing size as the scale increases, whereas Fly-back typically has larger wings.
Table 9.
Final specifications of starship class.
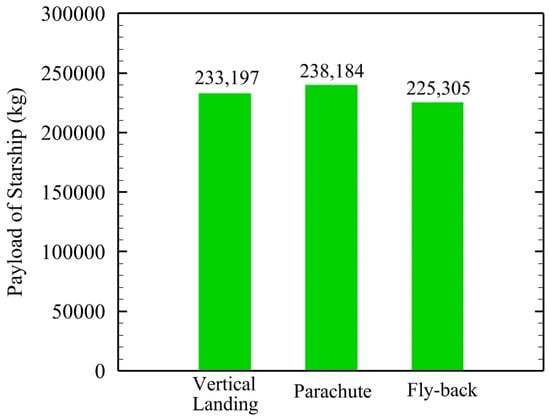
Figure 11.
Effective payload comparison for starship class.
For Starship Class vehicles, parachutes become unrealistically large and aerodynamically unstable, making manufacturing and storage difficult. According to the NASA LDSD project, two test flights of a large supersonic parachute with a diameter of 30 m failed [57]. Excessive shock loads were applied during parachute deployment, causing ruptures at the edges, and damage accumulated due to asymmetric deployment. The test vehicle used in these experiments was a 30-ton vehicle, the heaviest attempt to land using parachutes. This suggests that parachute recovery may have limitations for super-heavy launch vehicles.
As discussed in Section 3.2, this study assumes a configuration employing a total of 10 parachutes as a realistic upper bound. Under this assumption, the required diameter of a single main parachute for second-stage recovery of a super-heavy launch vehicle is estimated to exceed 50 m, as summarized in Table 7. The corresponding canopy area is approximately 23,140 m2, which is equivalent to about four standard soccer fields. Such a large canopy leads to a substantial increase in stowage volume and degrades deployment stability, thereby imposing severe constraints on parachute system design and operation. For reference, the canopy area of the main parachute used on the Orion spacecraft is approximately 1000 m2. Furthermore, the deployment load required for a super-heavy launch vehicle is estimated to exceed 85 tons, whereas the maximum deployment load that can be realistically sustained by a single parachute system is generally limited to 20–30 tons. Operating far beyond this range makes it extremely difficult to ensure structural reliability. While the main parachute used on the Orion spacecraft has a canopy mass of approximately 450 kg, the estimated canopy mass of a single main parachute for a super-heavy launch vehicle reaches approximately 1272 kg, clearly demonstrating the unavoidable scaling-induced increase in system size, structural complexity, and operational difficulty. In addition, as the vehicle scale increases, the number of suspension lines grows rapidly. For the super-heavy configuration considered in this study, approximately 94 suspension lines are required for the drogue parachute and 188 suspension lines for the main parachute, which is significantly higher than the approximately 80 suspension lines used in the Orion system. This increase substantially raises the likelihood of twisting, entanglement, and asymmetric deployment, thereby increasing the probability of deployment failure and further reducing the practical operability of parachute-based recovery systems [49].
In the case of fly-back recovery, when the recovery system is mounted on the second stage, the total mass of the recovery target is 99.5 t, which approaches the 100 t maximum landing load of the Space Shuttle. For a safe landing, a runway length of approximately 3600 m is required. NASA built a 4600 m long dedicated runway at the Kennedy Space Center for the Space Shuttle [58]. Such long runways are found only at a few airports worldwide, and other commercial aircraft must be excluded from access when landing the Space Shuttle. Therefore, the Starship class, being significantly larger than the Space Shuttle, would have very few available runways. Moreover, as the mass increases, the cost of transporting the vehicle to the reusability site after recovery and additional costs for runway infrastructure are expected to reduce launch cost efficiency. According to reference [10], the maintenance cost for reusability represents 10.8% of the launch cost, making it a significant factor. If the Starship class is recovered using fly-back, the maintenance cost would further increase.
4.2. Enhanced KSLV-III
The weight of the recovery system is lightest for the parachutes, followed by fly-back, with vertical landing being the heaviest. The parachute system, consisting only of the canopy and suspension lines, weighs a total of 315.8 kg, making it the lightest recovery system and providing the most available payload. In contrast, vertical landing weighs 2463.8 kg, and fly-back weighs 2197.2 kg. While these two systems have similar weights, vertical landing is slightly heavier.
Table 10 combines the TPS weight with the structural mass and adds the fuel and structural masses of each recovery system, as shown in the final specifications. The final effective payload, considering the TPS weight and recovery system mass, is compared graphically in Figure 12. As shown in Figure 12, the effective payloads are 9684.2 kg for the parachute method, 7802.8 kg for the fly-back method, and 7536.2 kg for the vertical landing method. The parachute landing recovery system, composed only of the parachute canopy and lines, has the smallest recovery system mass of 315.8 kg, making it the most efficient in terms of effective payload.
Table 10.
Final Specification of Enhanced KSLV-III with reusable 2nd stage.

Figure 12.
Comparison of effective payloads of Enhanced KSLV-III with reusable 2nd stage.

Figure 13.
Recovery system weight comparison.
Vertical landing is currently the most actively researched method, but it has yielded the lowest insertion performance. The changes in fuel tank size and structure accompanying the increased fuel were not considered, so the actual performance could potentially be even lower. The reason why vertical landing resulted in the lowest insertion performance can be summarized as follows. First, the transport payload of the Enhanced KSLV-III is smaller compared to vehicles that currently use vertical landing. A larger payload indicates a larger launch vehicle, and when recovered by parachutes or Fly-back, which are mostly structural in mass, a sharp increase in structural costs is expected. Additionally, if the baseline payload had been larger, the ratio of available payload could have been different. Second, the second-stage engine of the Enhanced KSLV-III is not suitable for vertical landing recovery. The vacuum thrust of the KRE-020 (second stage engine of KSLV-III) is 20 ton-force, much smaller than the 690-tonf-class thrust of SpaceX’s Starship during landing. Even considering that Starship’s dry mass is heavier than that of the Enhanced KSLV-III, lower thrust means that the engine must burn for a longer time, resulting in lower efficiency. For the upper-stage engine, the low nozzle exit pressure causes significant pressure losses when used near the ground, which leads to higher fuel consumption. In this study, the thrust of the KRE-020 engine is assumed to be fully offset by nozzle exit pressure losses, resulting in an effective thrust of zero. Therefore, for practical vertical landing, an engine with a nozzle expansion ratio suitable for near-ground operation is essential. For example, Starship uses three ground Raptor engines and three vacuum engines, for a total of six engines, to perform vertical landing.
For the Enhanced KSLV-III, the fly-back method exhibits slightly higher performance than the vertical landing method. However, this performance difference is based on conceptual-level mass modeling, and the absolute difference in payload capacity may be limited within the range of modeling uncertainty. Nevertheless, for the vertical landing method, a trend is observed in which the wing mass increases relative to the total structural mass as the vehicle scale decreases. This behavior arises because, while the fly-back and vertical landing methods have comparable levels of wing mass, the fly-back method does not require landing propellant. In this study, the same wing mass estimation methodology is applied to both recovery methods, which implies that, unlike the Starship-class vehicle, the wing areas required for vertical landing and fly-back are similar for the Enhanced KSLV-III.
4.3. Discussions on the Scale Effects
Figure 13 compares the mass increase ratio of the recovery system based on the mass of the second-stage structure, with the second-stage structure mass set as the baseline. When there is no recovery system mass, the increase is 0%. The weight increase due to the recovery system for each method can be observed, and at 100% increase, the mass of the second-stage structure and the recovery system are equal. This allows for a quantitative evaluation of how much additional mass the recovery system contributes relative to the second-stage structure mass.
The recovery system and available payload values for both launch vehicles are summarized in Table 11. The rate of increment compares the mass increase ratio of the recovery system based on the mass of the recovered second-stage structure. When no recovery system mass is present, the rate is 0%, and when the recovery system requires the full mass of the second-stage structure, the rate is 100%. This allows for an understanding of how much additional mass the recovery system adds relative to the second-stage structure mass.
Table 11.
Enhanced KSLV-III and Starship Class result comparison.
Figure 13 presents the rate of increment in graphical form. In other words, it shows the mass increase ratio of the recovery system with the second-stage structure mass as the baseline. From this graph, it can be seen that, for the Enhanced KSLV-III, the recovery system using parachutes is the lightest, while the vertical landing recovery system is the heaviest. For the Starship Class, although the parachute system is also the lightest, the Fly-back recovery system is the heaviest.
When comparing the recovery methods, the parachute system for Enhanced KSLV-III is lighter than the Starship Class recovery system, and the ratio of recovery system mass to the total system mass is much higher for Starship Class. This is because, as the parachute size increases, both the canopy and suspension lines also increase. In contrast, Fly-back and vertical landing methods tend to be lighter for the Starship class.
Notably, vertical landing shows the greatest difference in recovery system mass as the scale increases. The Starship Class becomes even lighter than the KSLV-III, making it more advantageous as the scale grows. While Fly-back also becomes more favorable with a larger vehicle size, the difference is not as significant as for vertical landing. Both vertical landing and fly-back recovery methods employ aerodynamic surfaces for gliding, but only the vertical landing method requires propellant during the terminal landing phase. For medium-class launch vehicles, the wing areas required for vertical landing and fly-back are of comparable magnitude, resulting in vertical landing being the heavier recovery option due to the additional landing propellant. However, as vehicle size increases, the relative contribution of wing mass to the overall structural mass diminishes, and the difference in wing mass between the two recovery methods grows in favor of vertical landing for super-heavy launch vehicles. Consequently, the reduction in wing mass offsets the additional propellant required for vertical landing, ultimately making vertical landing the lighter recovery option at larger scales. These trends suggest that, depending on the size of the launch vehicle, engineers may realistically choose different recovery methods.
4.4. Payload Fractions
In this study, the payload capacity of each recovery method was analyzed to compare their relative efficiencies. In the conceptual design of a launch vehicle, one of the key indicators representing payload capacity is the payload fraction, which can be effectively used to estimate the approximate range of transportation capability depending on the design parameters. The payload fraction is defined as the ratio of the payload mass to the total launch vehicle mass, as expressed in Equation (9).
By combining the structural coefficient (Equation (10)) with Tsiolkovsky’s rocket equation (Equation (11)), Equation (12) can be derived.
From Equation (12), it can be seen that the payload fraction is a function of exhaust velocity, velocity increment, and structural coefficient. The exhaust velocity () determines the specific impulse (), which represents the performance of the engine. In the case of a multi-stage rocket, the upper mass () of the first stage is the sum of the second stage mass and the actual payload, and the overall payload fraction of the launch vehicle can be obtained by multiplying the payload fractions of each stage.
Figure 14 illustrates a three-dimensional surface of the payload fraction as a function of the structural coefficient, velocity increment, and exhaust velocity, based on Equation (12). Referring to the cases of Starship and KSLV-III, the structural coefficient is represented in the range of 0.05–0.12, and the velocity increment is shown between 3000–9000 m/s. Figure 14b presents the relationship between the structural coefficient and payload fraction, while Figure 14c shows that between the velocity increment and payload fraction. These results correspond to the cases using the second-stage engines—KRE-020 for KSLV-III and Raptor v3 Vacuum for Starship—with each surface representing a constant exhaust velocity (). The Raptor v3 Vacuum exhibits an exhaust velocity approximately 250 m/s higher than that of the KRE-020, resulting in a higher payload fraction under the same structural coefficient and velocity increment conditions.
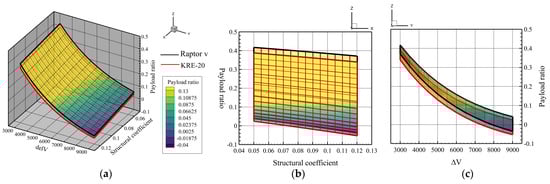
Figure 14.
(a) The payload fraction represented as a 3-dimensional surface, (b) structural coefficient- relation, and (c) ΔV- relation.
In Figure 14b, the payload fraction decreases inversely as the structural coefficient increases. The structural coefficient represents the fraction of the total vehicle mass excluding propellant and is closely related to the practical manufacturing technology of the rocket. It is defined as the reciprocal of the mass ratio, and a smaller value indicates better rocket performance. The structural coefficient is influenced not only by structural design but also by systems and propulsion engineering aspects. Through design optimization, Starship successfully reduced its structural coefficient to about 0.05, and as shown in Figure 14b, decreasing the structural coefficient from 0.1 to 0.05 results in approximately a 5% increase in payload fraction.
In the conceptual design of a launch vehicle, after determining the required velocity increment, stage design is performed by appropriately distributing the ∆V among the stages. Figure 14c shows that as the required ∆V increases, the payload fraction decreases. This indicates that, for the same structural coefficient and exhaust velocity, achieving a larger ∆V requires a smaller payload mass () relative to the total vehicle mass. Therefore, minimizing velocity losses is crucial to reduce the required ∆V. Since velocity losses vary significantly depending on the vehicle system design, it is important to ensure that they are not excessively large.
The mass of the recovery system is not included in the propellant mass term of the rocket equation’s mass ratio, thus affecting the structural coefficient. By recalculating the modified structural coefficient reflecting the recovery system and substituting it into Equation (12), the corresponding change in payload fraction can be quantitatively evaluated. The results are presented in Table 12 and Figure 15, showing an inverse relationship between the structural coefficient and the payload fraction, which is consistent with the analysis presented in Section 4.3.
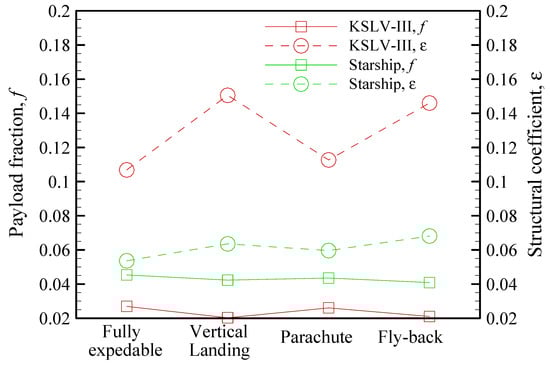
Figure 15.
Comparison between the modified structural coefficient and the payload fraction.
Table 12.
Payload fraction derived from structural coefficients.
Table 12.
Payload fraction derived from structural coefficients.
| Enhanced KSLV-III | Starship Class | |||
|---|---|---|---|---|
| Fully expandable | 0.1068 | 0.0269 | 0.0536 | 0.0454 |
| Vertical Landing | 0.1505 | 0.0203 | 0.0636 | 0.0423 |
| Parachute | 0.1127 | 0.0261 | 0.0596 | 0.0435 |
| Fly-back | 0.1460 | 0.0210 | 0.0681 | 0.0409 |
5. Conclusions
This study demonstrates that second-stage recovery strategies must be selected according to vehicle scale rather than prevailing technological trends. The results of this paper suggest that recovery strategies should be tailored according to the vehicle size when reusing the second stage. For medium-sized launch vehicles like the Enhanced KSLV-III, recovery strategies should consider methods other than vertical landing, such as parachutes or fly-back recovery. For super-heavy launch vehicles, however, parachute and fly-back recovery methods are limited due to structural constraints. As shown in Figure 16, this trend indicates that as the vehicle size increases, the cost per kilogram of payload decreases [10].
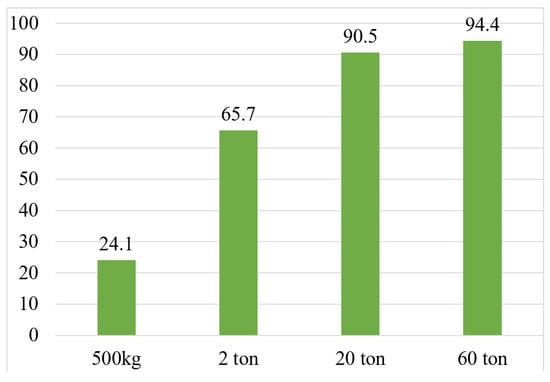
Figure 16.
Effectiveness of reusable launch vehicles (%) (200 launches per year) [10].
Recently, the preference for vertical landing as a reusable recovery method has become dominant because the scale of the vehicle has proven to be an effective way to reduce launch costs per unit of payload. Therefore, vertical landing is not necessarily the optimal recovery method when building a super-heavy launch vehicle is not feasible.
Thus, recovery methods are closely linked to the direction of reusable launch vehicle development. The appropriate recovery method should be selected based on the vehicle’s size, mission type, and frequency of operation. When the number of reuses is low, the parachute recovery method, with its simple structure and low initial cost, is appropriate. However, since parachutes must be replaced each time they are used, and there could be repair costs due to damage to the vehicle’s exterior from landing on water or harsh ground impacts, fly-back recovery becomes more efficient for frequent reuses. In terms of mission type and operation frequency, parachute recovery is ideal for low-cost, single-use launch vehicles for Earth-bound missions, while fly-back recovery is suitable for missions with frequent reuses due to its lower maintenance costs and ease of operation. For deep space exploration, or in the case of super-heavy launch vehicles where parachutes are difficult to use, vertical landing should be considered.
For small launch vehicles, the simpler parachute method is most feasible, while medium and large vehicles may consider parachute or fly-back recovery. For super-heavy launch vehicles, vertical landing remains the preferred option.
In conclusion, to maximize the efficiency of reusable launch vehicles, it is crucial to consider the overall system characteristics and select the optimal recovery strategy, rather than uniformly applying the vertical landing method. The results presented in this study were derived to evaluate the feasibility of second-stage recovery methods during the early design phase of launch vehicles. Future work should improve the accuracy of the analysis by incorporating higher-fidelity atmospheric models, trajectory optimization based on numerical integration of reentry equations of motion, and more detailed mass modeling.
Author Contributions
Conceptualization, J.-Y.C.; methodology, M.-S.J. and G.-J.L.; validation, G.-J.L.; formal analysis, M.-S.J.; investigation, G.-J.L.; data curation, G.-J.L.; writing—original draft preparation, G.-J.L.; writing—review and editing, J.-Y.C.; visualization, G.-J.L.; supervision, J.-Y.C.; project administration, J.-Y.C.; funding acquisition, J.-Y.C. All authors have read and agreed to the published version of the manuscript.
Funding
This research was supported by Korea AeroSpace Administration (KASA) under Grant (RS-2022-NR067081) and by Korea Research Institute for defense Technology planning and advancement (KRIT) under grant (KRIT-CT-22-030). The publication of this paper was supported by the DRONE ERC of BK21 FOUR of NRF funded by the Ministry of Education (MOE), the Republic of Korea government (MOE).
Data Availability Statement
The original contributions presented in the study are included in the article, further inquiries can be directed to the corresponding author.
Conflicts of Interest
The authors declare no conflicts of interest.
Nomenclature
| Structural coefficient ith stage | |
| Velocity increment of ith stage | |
| Required velocity increment | |
| Total velocity increment | |
| Orbital speed | |
| Gravity loss | |
| Drag loss | |
| Steering loss | |
| Total mass of ith stage | |
| Propellant mass of ith stage | |
| Structural mass of ith stage | |
| Effective payload mass | |
| Recovery system mass of 2nd stage | |
| Altitude | |
| Earth radius | |
| Gravitational parameter | |
| Nozzle exit area | |
| Nosecone length | |
| Gliding angle | |
| Oswald efficiency factor | |
| Aspect ratio | |
| Zero lift drag coefficient | |
| Friction factor (assumed as 1.2 in this study) | |
| Maximum lift to drag ratio | |
| Nosecone radius | |
| Reference area | |
| Wing loading |
References
- Yun, D.H.; Jo, H.T.; Yoon, Y.B. Development Trends of Reusable Launch Vehicles. J. Korean Soc. Propuls. Eng. 2023, 27, 45–59. [Google Scholar] [CrossRef]
- Space: Investing in the Final Frontier. Available online: https://www.morganstanley.com/ideas/investing-in-space (accessed on 7 April 2025).
- Reddy, V.S. The spacex effect. New Space 2018, 6, 125–134. [Google Scholar] [CrossRef]
- Jeong, S.-M.; Kim, K.S.; Oh, S.; Choi, J.-Y. New technologies of space launch vehicles including electric-pump cycle engine. J. Korean Soc. Aeronaut. Space Sci. 2016, 44, 139–155. [Google Scholar] [CrossRef]
- Lim, B.J. A Review of the Preliminary Feasibility Analysis Report on the KSLV-III Program. J. Korean Soc. Propuls. Eng. 2024, 28, 91–103. [Google Scholar] [CrossRef]
- Baiocco, P. Overview of reusable space systems with a look to technology aspects. Acta Astronaut. 2021, 189, 10–25. [Google Scholar] [CrossRef]
- Ragab, M.; Cheatwood, F.M. Launch vehicle recovery and reuse. In Proceedings of the AIAA SPACE 2015 Conference and Exposition, Pasadena, CA, USA, 31 August–2 September 2015; pp. 2015–4490. [Google Scholar]
- Ragab, M.; Cheatwood, F.M.; Hughes, S.; DiNonno, J.; Bodkin, R.; Lowry, A.; Kelly, J.; Reed, J.G. Performance efficient launch vehicle recovery and reuse. In Proceedings of the AIAA SPACE 2016 Conference and Exposition, Long Beach, CA, USA, 13–16 September 2016; pp. 2016–5312. [Google Scholar]
- Choo, K.S.; Mun, H.Y.; Nam, S.H.; Cha, J.H.; Ko, S.H. A Survey on Recovery Technology for Reusable Space Launch Vehicle. J. Korean Soc. Propuls. Eng. 2018, 22, 138–151. [Google Scholar] [CrossRef]
- Kang, S.-Y.; Jo, M.-S.; Choi, J.-Y.; Yang, S.S. Cost Effectiveness of Reusable Launch Vehicles Depending on the Payload Capacity. Aerospace 2025, 12, 364. [Google Scholar] [CrossRef]
- NASA—National Aeronautics and Space Administration. Available online: https://www.nasa.gov/ (accessed on 12 May 2025).
- European Space Agency. Available online: https://www.esa.int/ (accessed on 8 May 2025).
- Russian Federal Space Agency. Available online: https://www.roscosmos.ru/ (accessed on 12 May 2025).
- X-37B Orbital Test Vehicle. Available online: https://www.boeing.com/defense/autonomous-systems/x37b (accessed on 12 May 2025).
- Virgin Galactic—Spaceline for Earth. Available online: https://www.virgingalactic.com/ (accessed on 12 May 2025).
- Dream Chaser Spaceplane. Available online: https://www.sierraspace.com/dream-chaser-spaceplane/ (accessed on 12 May 2025).
- Blue Origin—For the Benefit of Earth. Available online: https://www.blueorigin.com/ (accessed on 12 May 2025).
- Rocket Lab—Space Systems and Launch Services. Available online: https://www.rocketlabusa.com/ (accessed on 12 May 2025).
- SpaceX—Making Life Multiplanetary. Available online: https://www.spacex.com/ (accessed on 12 May 2025).
- McConnaughey, P.K.; Femminineo, M.G.; Koelfgen, S.J.; Lepsch, R.A.; Ryan, R.M.; Taylor, S.A. NASA’s Launch Propulsion Systems Technology Roadmap. In Proceedings of the Space Propulsion 2012, Bordeaux, France, 7–10 May 2012; p. 2. [Google Scholar]
- Oh, B.-S.; Lee, J.H.; Roh, W.-R.; Joh, M.O.; Park, J.-J.; Cho, G.-R. The Conceptual Design of Launch Vehicle. J. Korean Soc. Aeronaut. Space Sci. 2002, 30, 130–141. [Google Scholar] [CrossRef]
- Yang, W.-S.; Kim, S.-Y.; Choi, J.-Y. Conceptual Design of a Launch Vehicle for Lunar Exploration by Combining Naro-1 and KSLV-II. J. Korean Soc. Aeronaut. Space Sci. 2014, 42, 654–660. [Google Scholar] [CrossRef]
- Kim, H.-S.; Yang, S.-M.; Choi, J.-Y. Analysis of orbit injection performance of KSLV-II by weight reduction. J. Korean Soc. Propuls. Eng. 2018, 22, 141–151. [Google Scholar]
- Hong, M.; Yang, S.-M.; Kim, H.-S.; Yoon, Y.; Choi, J.-Y. Comparison of the mission performance of Korean GEO launch vehicles for several propulsion options. J. Korean Soc. Propuls. Eng. 2017, 21, 60–71. [Google Scholar] [CrossRef]
- Jo, M.-S.; Kim, J.-E.; Choi, J.-Y. Staging and Injection Performance Analysis of Small Launch Vehicle Based on KSLV-II. J. Korean Soc. Aeronaut. Space Sci. 2021, 49, 155–166. [Google Scholar] [CrossRef]
- Yang, W.-S.; Choi, J.-Y. Performance analysis of KSLV-II launch vehicle with liquid rocket boosters. J. Korean Soc. Aeronaut. Space Sci. 2014, 42, 544–551. [Google Scholar] [CrossRef]
- Jo, M.-S.; Cho, D.H.; Choi, J.-Y. Performance Analysis of Small Launch Vehicles Using Algebraic Model: Case Studies Based on KSLV-II 2nd and 3rd Stage. Int. J. Aeronaut. Space Sci 2025, 26, 2885–2897. [Google Scholar] [CrossRef]
- Spaceflight, F. SpaceX Starship. Available online: https://futurespaceflight.com/commercial-rockets/spacex-starship.html?view=category&id=34 (accessed on 18 April 2025).
- Roh, W.-R.; Cho, S.B.; Sun, B.C.; Choi, K.S.; Jung, D.W.; Park, C.S.; Oh, J.S.; Park, T.H. Mission and System Design Status of Korea Space Launch Vehicle-II succeeding Naro Launch Vehicle. In Proceedings of the Korean Society for Aeronautical & Space Sciences, Jeongseon-gun, Republic of Korea, 18–20 April 2012; pp. 233–239. [Google Scholar]
- Turner, M.J.L. Rocket and Spacecraft Propulsion: Principles, Practice and New Developments; Springer: Berlin/Heidelberg, Germany, 2009; pp. 140–148. [Google Scholar]
- Shin, J.-S.; Kim, D.-Y.; Choi, G.-H. Reusable Thermal Protection System in U.S.A and Europe for Re-entry. Curr. Ind. Technol. Trends Aerosp. 2020, 18, 148–160. [Google Scholar]
- Shin, J.S.; Kim, H.J.; Kim, S.W.; Lee, K.J.; Park, J.S.; Oh, B.S. Introduction of a TUFROC Thermal Protection System for Reentry Mission. J. Korean Soc. Aeronaut. Space Sci. 2023, 51, 37–47. [Google Scholar] [CrossRef]
- Uyanna, O.; Najafi, H. Thermal protection systems for space vehicles: A review on technology development, current challenges and future prospects. Acta Astronaut. 2020, 176, 341–356. [Google Scholar] [CrossRef]
- Leleu, F.; Watillon, P.; Moulin, J.; Lacombe, A.; Soyris, P. The thermo-mechanical architecture and TPS configuration of the pre-X vehicle. Acta Astronaut. 2005, 56, 453–464. [Google Scholar] [CrossRef]
- Dimitrov, T.; Naeije, M. Spacecraft Trajectory Optimization by Improved Sequential Convex Programming for a Starship-Like Vehicle, Executing Atmospheric Hypersonic Entry Glide to Precision-Land on Mars; Department of Aerospace Engineering, Delft University of Technology: Delft, The Netherlands, 2025. [Google Scholar]
- Dotts, R.L.; Curry, D.M.; Tillian, D. Orbiter thermal protection system. In Proceedings of the NASA Johnson Space Center Space Shuttle Technical Conference, Houston, TX, USA, 28–30 June 1983. [Google Scholar]
- Stewart, D.; Leiser, D. Lightweight TUFROC TPS for hypersonic vehicles. In Proceedings of the 14th AIAA/AHI Space Planes and Hypersonic Systems and Technologies Conference, Canberra, Australia, 6–9 November 2006; p. 7945. [Google Scholar]
- Hardy, R.D.; Bronowski, D.R.; Lee, M.Y.; Hofer, J.H. Mechanical Properties of Thermal Protection System Materials; Sandia National Laboratories (SNL): Albuquerque, NM, USA; Livermore, CA, USA, 2005.
- Bacon, J.B. Minimum dV for Targeted Spacecraft Disposal. In Proceedings of the 7th European Conference on Space Debris, Darmstadt, Germany, 18–21 April 2017; pp. 18–21. [Google Scholar]
- Wilken, J.; Sippel, M.; Berger, M. Critical Analysis of SpaceX’s Next Generation Space Transportation System: Starship and Super Heavy. In Proceedings of the HiSST, Bruges, Belgium, 11–15 September 2022; pp. 1–13. [Google Scholar]
- Elonx.net: Starship Compendium. Available online: https://www.elonx.net/super-heavy-starship-compendium (accessed on 10 December 2025).
- Starship | Flight Test 11. Available online: https://youtu.be/MdJGy56TYuw (accessed on 3 December 2025).
- Galvez, R.; Gaylor, S.; Young, C.; Patrick, N.; Johnson, D.; Ruiz, J. The Space Shuttle and Its Operations; NASA: Washington, DC, USA, 2013; p. 56.
- Clark, S. U.S. Military’s X-37B Space Plane Lands in California. Available online: https://www.spaceflightnow.com/atlas/av034/141017landing/ (accessed on 3 December 2025).
- Gebhardt, C. Dream Chaser Through Critical Landing Test, Prepares for Orbital Flights. Available online: https://www.nasaspaceflight.com/2017/11/dream-chaser-test-prepares-orbital-flights/ (accessed on 3 December 2025).
- Buran-Energia. Buran Characteristics. Available online: https://www.buran-energia.com/bourane-buran/bourane-carac.php (accessed on 3 December 2025).
- Raymer, D.P. Aircraft Design: A Conceptual Approach, 6th ed.; AIAA: Reston, VA, USA, 2012. [Google Scholar]
- Cantou, T.; Merlinge, N.; Wuilbercq, R. 3DoF simulation model and specific aerodynamic control capabilities for a SpaceX’s starship-like atmospheric reentry vehicle. In Proceedings of the EUCASS 2019, Madrid, Spain, 1–4 July 2019; p. 13. [Google Scholar]
- NASA. Orion Multi-Purpose Crew Vehicle Parachute System. Available online: https://www.nasa.gov/wp-content/uploads/2017/12/orion_parachutes.pdf (accessed on 23 June 2025).
- Valpolini, P. Safran Close to Delivering New High Performance Parachutes to French Forces. Available online: https://www.edrmagazine.eu/safran-close-to-delivering-new-high-performance-parachutes-to-french-forces (accessed on 17 July 2025).
- Apollo vs Orion. Available online: https://chutes.nl/BlogPosts/apollo-orion.html (accessed on 18 April 2025).
- Terahara, T.; Takizawa, K.; Avsar, R.; Tezduyar, T.E. T-splines computational membrane–cable structural mechanics with continuity and smoothness: II. Spacecraft parachutes. Comput. Mech. 2023, 71, 677–686. [Google Scholar] [CrossRef]
- Korea Aerospace Research Institute. Available online: https://www.kari.re.kr/kor (accessed on 14 May 2025).
- Rodriguez, H.; Popp, C.; Rehagen, R.J. X-37 Storable Propulsion System Design and Operations. In Proceedings of the 41st AIAA/ASME/SAE/ASEE Joint Propulsion Conference and Exhibit, Tucson, AZ, USA, 10–13 July 2005; p. 3958. [Google Scholar]
- Administration, F.A. Pilot’s Handbook of Aeronautical Knowledge; Skyhorse Publishing Inc.: New York, NY, USA, 2009. [Google Scholar]
- Tamma, K.K. On the Space Shuttle Wing Thermal-Structural Analysis; Old Dominion University: Norfolk, VA, USA, 1983. [Google Scholar]
- O’Farrell, C.; Brandeau, E.J.; Tanner, C.; Gallon, J.C.; Muppidi, S.; Clark, I.G. Reconstructed parachute system performance during the second LDSD supersonic flight dynamics test. In Proceedings of the AIAA Atmospheric Flight Mechanics Conference, Washington, DC, USA, 13–17 June 2016; p. 3242. [Google Scholar]
- NASA’s Kennedy Space Center. Landing the Orbiter at KSC. Available online: https://www3.nasa.gov/centers/kennedy/pdf/167415main_LandingatKSC06.pdf (accessed on 18 July 2025).
Disclaimer/Publisher’s Note: The statements, opinions and data contained in all publications are solely those of the individual author(s) and contributor(s) and not of MDPI and/or the editor(s). MDPI and/or the editor(s) disclaim responsibility for any injury to people or property resulting from any ideas, methods, instructions or products referred to in the content. |
© 2026 by the authors. Licensee MDPI, Basel, Switzerland. This article is an open access article distributed under the terms and conditions of the Creative Commons Attribution (CC BY) license.