Abstract
The airflow velocity at the solid–air interface is directly proportional to the generated drag and heat. Therefore, reducing drag and heat at such interfaces under extreme operating conditions (e.g., supersonic flight) is particularly important. In contrast to the passive drag-reduction technique, which cannot significantly reduce drag and heat, in this study, an active interface drag- and heat-reduction technique based on a windward concave cavity (reverse jet) is presented. The effect of the number of jet holes, their relative position, size, and other parameters on the drag and heat at 6.5 Mach is investigated using the FLOEFD simulation software. The results show that a five-hole cross-distributed jet achieves the best thermal protection: the total surface static pressure, drag, and surface temperature are reduced by 51.7%, 33.9%, and 31.2%, respectively, compared with the case without a reverse jet. This study provides guidance for the structural design of thermal protection and drag-reduction systems.
1. Introduction
At very high relative velocities of solids and gases, large drag forces are generated owing to the friction at the solid–gas interface, resulting in a temperature rise in the solid and nearby gas owing to heat conduction, which in turn leads to a rapid increase in the pressure at the surface of the solid owing to the excitation effect [1,2]. For example, when an aircraft flies at a high speed, its nose and fuselage are subjected to severe aerodynamic heat and huge drag, which is referred to as a thermal barrier [3]. Owing to the strong compression of the air in front of the aircraft, a strong bow-shaped airwave is generated in the aircraft’s nose, which further compresses the air and converts most of the airflow kinetic energy into thermal energy, resulting in a sharp rise in air temperature. This, in turn, generates a large temperature difference between the high-temperature air and the aircraft’s surface, resulting in the rapid transfer of thermal energy to the aircraft’s surface and contributing to a temperature rise at the aircraft’s surface. At the same time, owing to the bow-shaped airwave, the drag and surface temperature of the aircraft increase, resulting in a decrease in the aircraft’s performance, deformation in the aircraft’s structure, and direct damage [4]. Therefore, to safely conduct flight activities, it is highly important to design a thermal protection system (TPS) for some special parts of the aircraft. In addition, the design of TPS is crucial for the aircraft’s thermal protection when flying at high speed in a complex flight environment [5,6,7,8].
Significant research has been conducted worldwide on TPSs. TPSs can be categorized into three types: passive, semi-passive, and active [9]. Passive and semi-passive cooling and drag reduction technology relies mainly on the material properties and shape design of the vehicle to reduce heat absorption and drag. However, the cooling and drag reduction effect of this method is often limited by a variety of factors, such as flight speed, altitude, atmospheric conditions, etc., and it is difficult to provide sufficient protection under extreme flight conditions. Passive thermal protection systems primarily rely on the inherent heat resistance and insulation properties of materials to withstand high-temperature environments. Typically, PTPS requires thick insulation materials, such as ceramic matrix composites or ablative materials, which significantly increase the weight and volume of the vehicle, thereby affecting its aerodynamic performance and payload capacity. Huang et al. [8] highlighted that strain isolation pads in thermal protection systems require sufficient thickness to ensure insulation effectiveness under high temperatures, but this inevitably adds to the system’s weight, from an improved “composite protective gas curtain”. The interaction of multiple jets is designed to merge into a low-momentum zone that is wider in the transverse (circumferential) direction and more stable axially. This provides more effective shielding of the nose cone surface compared to the recirculation zone formed by a single jet.
More effectively dissipate and push back the shockwave: Multiple jet sources can collectively transform a single bow shock into a more complex, weaker wave system with a larger stand-off distance. This directly leads to a reduction in form drag and surface pressure. Improve coolant coverage uniformity: Coolant injected from multiple locations, through entrainment and mixing between jets, aims to form a more uniform low-temperature protective layer over the nose cone surface, thereby more effectively reducing peak heat flux and average temperature.
The design of PTPS requires a comprehensive consideration of material selection, structural design, and thermal environment characteristics, making the design process complex and costly. Maruyama et al. [9] pointed out that the design and manufacturing processes of traditional insulation materials are intricate, often failing to meet the diverse requirements of hypersonic vehicles. These limitations highlight the need for innovative approaches to enhance the efficiency and adaptability of thermal protection systems in extreme conditions. However, active TPSs can overcome this problem. An active TPS can be designed in several forms, such as film cooling [10,11], transpiration cooling [12,13], regenerative cooling [14,15,16,17], impingement cooling [18,19], and reverse jetting [20,21]. However, the first two designs cannot prevent damage to the leading edge of the aircraft’s nose because of prolonged and intense friction with the high-temperature airflow [22,23], whereas the reverse-jet design can overcome this problem, which determines the momentum flux of an individual jet, directly affecting its penetration capability into the free stream and the initial disturbance intensity. A diameter that is too small results in insufficient penetration, while one that is too large may induce flow instability and self-interference.
In the 1960s, a new method known as reverse jetting was proposed to reduce drag and provide thermal protection for airframes by ejecting cooling gas from the aircraft’s nose and fuselage. This concept is illustrated in Figure 1. The injected cooling gas pushes the strong bow-shaped positive excitation airwave, which is formed by the high-temperature incoming airflow, away from the surface of the airframe to reduce the aerodynamic heat and drag on the aircraft’s nose. The cooling gas is reversed under the action of the free incoming airflow and is reattached to the aircraft’s nose surface, forming a reflux region and shear layer owing to the shear effect. Owing to the jet blockage, the free incoming airflow toward the periphery creates an air-compression surge near the reattachment point of recirculation region. A reduction in aerodynamic heat and drag can be achieved due to the following reasons: (1) the reverse jet pushes the strong bow-shaped positive air-compression surge away from the aircraft’s fuselage surface, thus increasing the distance between the vehicle and the air-compression surge point; consequently, the aerodynamic heat is significantly reduced; (2) the reverse-jet flow region covers a large portion of the aircraft’s nose and fuselage, resulting in the separation of the surge region from the aircraft’s surface, thus reducing the aerodynamic heat and drag [24,25]. Li Shibin et al. [26] investigated the impact of injector configurations on the performance of counterflow jets in drag reduction and thermal protection. The results demonstrate that the geometric design and arrangement of the injector significantly influence efficiency. Optimized designs enhance performance, particularly in supersonic flows, effectively mitigating aerodynamic heating and drag forces. Shen Binxian et al. [27] explored the efficacy of counterflow jets in supersonic flows through numerical simulations and experimental studies. Key parameters include the jet pressure ratio and injection angle. Increasing the pressure ratio improves drag reduction but may induce flow instability. Optimized jet parameters achieve superior performance in supersonic conditions. Lu Haibo et al. [28] evaluated a combined system of forward-facing cavities and counterflow jets for thermal protection. The cavity modifies the flow field structure, reducing aerodynamic heating, while the jet further decreases heat flux density and drag coefficients. This synergistic configuration shows significant potential for supersonic and hypersonic applications. Ni Zijian et al. [29] proposed a hybrid model integrating counterflow jets and slot blowing for hypersonic vehicles. This model effectively reduces aerodynamic heating and drag forces, particularly under hypersonic conditions. The synergy between the two methods optimizes the flow field structure, offering a novel approach for thermal protection systems in hypersonic flight.
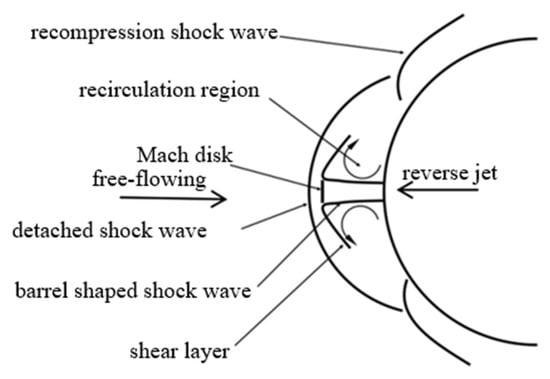
Figure 1.
Reverse-Jet Principal Schematic.
In this study, a TPS that combines a windward concave cavity with a multi-hole jet based on a single-hole reverse-jet TPS is innovatively proposed for air and space vehicles. The combination of a windward concave cavity and a porous jet is considered to be an effective and promising solution. The windward concave cavity structure is able to form a stable “cooling ring” at the front end of the vehicle, a phenomenon that has been confirmed by experimental observations. The cooling ring effectively reduces the temperature of the nose cone surface of the vehicle and reduces the location of the total heat flow by moving it back behind the lip apex. The porous jet can disturb and change the flow field structure at the front end of the vehicle by injecting the cooling mass, thus significantly reducing the aerodynamic drag. The porous jet not only reduces the temperature at the surface of the vehicle but also reduces the heat flow transfer through the coverage and flow of the cooling mass. This helps to protect the vehicle’s body structure and electronic equipment from high temperature damage. A 3-D airflow simulation model for the nose cone is established, and numerical simulations based on a new drag- and heat-reduction method based on the high-Mach flow conservation equation are performed. This method combines a windward concave cavity and a reverse jet. An object employing one-, four-, five-, and nine-hole reverse jets is simulated at a supersonic speed of Mach 6.5. The simulations were performed by solving the Navier–Stokes equations [30,31] using a computational fluid dynamics (CFD) software, which produced important results regarding the inlet velocity, drag, and total static pressure, total surface pressure, and surface temperature of the nose cone of the object. These results provide a theoretical basis for the structural design of a reverse-jet device and a new perspective for the design of TPSs in hypersonic air and space vehicles, laying a solid foundation for the application study of active thermal-protection technology, and is of great significance for the expansion of the use of the reverse jet in the hypersonic sound vehicle.
2. Methods
2.1. Numerical Approach and Model Setup
This study employed the commercial computational fluid dynamics (CFD) software FLOEFD2312 (a CAE package integrated within CAD environments) to solve the three-dimensional Navier–Stokes equations [32,33] for simulating supersonic flow over a nose cone model with reverse jetting. The numerical model was based on the conservation equations of mass, momentum, and energy for high-Mach flow.
A three-dimensional supersonic flow simulation model was established, as shown in Figure 2(a1,a3). The geometry of the nose cone is a bio-inspired design based on the deformation mechanism of the honeybee abdomen, as previously developed by our team [34]. The computational domain and boundary conditions are illustrated in Figure 2(a2). The bottom surface was set as an airflow inlet boundary condition with a supersonic freestream of Mach 6.5 in the Y-direction. The freestream conditions were defined based on a flight altitude of 25 km, with a total pressure of 4 MPa, a total temperature of 1527 °C, and a static temperature of 295.15 K. The outer surfaces of the domain were set as pressure openings.
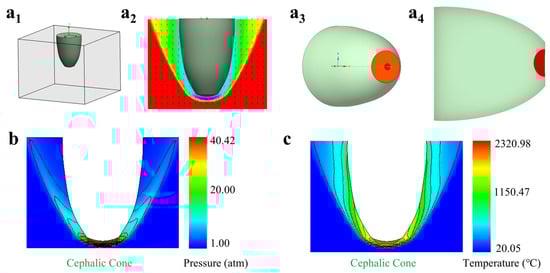
Figure 2.
Schematic of the head cone structure of the aircraft and its simulation boundary conditions. (a1) Schematic of the 3D simulation model. (a2) Simulation boundary conditions. (a3) Schematic of the 3D model. (a4) Schematic of the windward concave cavity section. (b) Simulation results of static pressure in the flow field without reverse jet. (c) Simulation results of temperature in the flow field without reverse jet.
2.2. Grid Independence Study and Validation
A grid independence study was conducted prior to the main simulations to ensure the accuracy of the results and to select a computationally efficient mesh. Simulations for a baseline case (a 40 mm diameter single-jet hole) were performed at different jet velocities using meshes with three levels of refinement: Level 1: 183,408, Level 2: 471,875, Level 3: 1,602,310.
Following the establishment of the computational model and boundary conditions, a grid independence study was conducted to ensure that the numerical results were independent of mesh resolution. Three systematically refined mesh levels were generated for the 40 mm single-jet configuration, with cell counts of 183,408 (Level 1, coarse), 471,875 (Level 2, medium), and 1,602,310 (Level 3, fine). The quantitative assessment focused on key engineering outputs: the total surface static pressure, the total surface temperature, and the total drag force. As shown in Figure 3a,b, the differences in total pressure and temperature between the medium and fine grids were negligible (less than 2%), indicating that the medium grid density was sufficient to capture the core physics. Qualitatively, the flow field structures were also compared across mesh levels. Figure 2 illustrates the pressure contours and streamlines for the medium grid (Level 2). A comparison with the equivalent solution on the coarse grid (Level 1) revealed slight smearing of the strong bow shock and a less defined recirculation zone. However, the solution on the medium grid (Level 2) showed excellent agreement in all major flow features—including shock shape, shear layer development, and recirculation region—with the solution on the fine grid (Level 3). This qualitative comparison further reinforces that the medium grid adequately resolves the critical flow phenomena. Based on this comprehensive grid study, which incorporated qualitative flow field assessment, all subsequent simulations for single and multi-jet configurations were performed using a mesh density equivalent to Level 2. This approach ensured a consistent and high level of accuracy across all cases while maintaining computational efficiency.
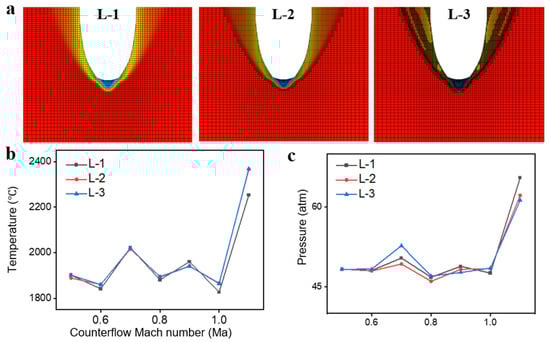
Figure 3.
Grid Independence Study. (a) Simulation results at different mesh refinement levels. (b) Total surface temperature results from simulation analysis of a single injection hole with different meshing divisions. (c) Total surface pressure results from simulation analysis of single injection hole with different mesh divisions.
The results for total surface temperature and pressure for the different mesh levels are presented in Figure 3a and Figure 3b, respectively. The changes in results between Level 2 and Level 3 meshes were negligible. Therefore, considering both computational accuracy and cost, the Level 2 mesh refinement was selected for all subsequent simulations.
2.3. Simulation Strategy
The simulation strategy was designed to evaluate the efficacy of various reverse-jet configurations: A baseline simulation was first performed without any reverse jet to establish a reference for drag, surface static pressure, and surface temperature. Subsequently, a series of simulations was conducted with different reverse-jet schemes. These included configurations with a single orifice (with diameters of 20, 40, and 60 mm), cross-distributed orifices (4, 5, and 9 holes), rectangularly distributed orifices, and other layouts. The jet temperature was uniformly set to 26.85 °C for all cases unless otherwise stated. For each configuration, the jet Mach number was varied (typically from 0 to 3 Ma) to analyze its effect on thermal protection and drag reduction performance.
The performance of each scheme was assessed by comparing the total flight drag, total surface static pressure, and total surface temperature against the baseline no-jet case.
3. Results and Discussion
The aerodynamic heat and drag are predominantly distributed on the nose cone of the vehicle. Therefore, the following results, discussion, and analysis focus on this component.
3.1. Simulation Results Without a Reverse Jet
Initially, a nose cone model was simulated without a reverse jet to establish a reference for subsequent simulation scenarios. The results in Table 1 and Figure 2b,c show that without a reverse jet, the nose is subjected to a total drag of 286 KN, a total surface hydrostatic pressure of 76.64 atm, and a total surface temperature of 2192.87 °C. These extreme flying conditions can greatly reduce the service life of an aircraft. The grid refinement scheme was also used for the simulation of the jet velocity and the jet temperature.

Table 1.
Simulation results without reverse jetting.
As shown in Figure 3a, we divided three kinds of mesh. The number of Level 1 meshes is 183,408, the number of Level 2 meshes is 471,875, and the number of Level 3 meshes is 1,602,310. As can be seen from Figure 3b,c, the simulation results show a small change with different levels of mesh refinement, proving that the mesh division meets the quality requirements. Considering the comprehensive factors, the subsequent simulation mesh refinement degree is set to Level 2.
3.2. Simulation Results Without a Reverse Jet
Initially, a nose cone model was simulated without a reverse jet to establish a reference for subsequent simulation scenarios. The results in Table 1 and Figure 2b,c show that without a reverse jet, the nose is subjected to a total drag of 286 KN, a total surface hydrostatic pressure of 76.64 atm, and a total surface temperature of 2192.87 °C. These extreme flying conditions can greatly reduce the service life of an aircraft.
3.3. Simulation Results for a Single-Hole Reverse Jet
To study the effect of the reverse-jet hole diameter on thermal protection, we designed three different reverse-jet hole diameters (20, 40, and 60 mm), as shown in Figure 4(a1), 4(a2), and 4(a3), respectively. The Mach number of the jet gas was varied to study the effect of different jet speeds on thermal protection, and the results were analyzed. For a jet hole diameter of 20 mm, Figure 4c,d show that the total surface static pressure and surface temperature exhibit their lowest values (52.44 atm and 2119.6 °C, respectively) for a jet speed of Mach 0.5. Comparing these results with those obtained without a reverse jet, we observe that by applying a reverse jet, the total surface static pressure is significantly reduced, whereas the total surface temperature does not change significantly. Figure 4b shows that the total drag increases slightly to 289 KN, indicating that such a TPS cannot achieve good thermal protection. The pressure and temperature distributions around the nose cone for different jet hole diameters and Mach numbers are illustrated in Figure 5 and Figure 6, respectively.
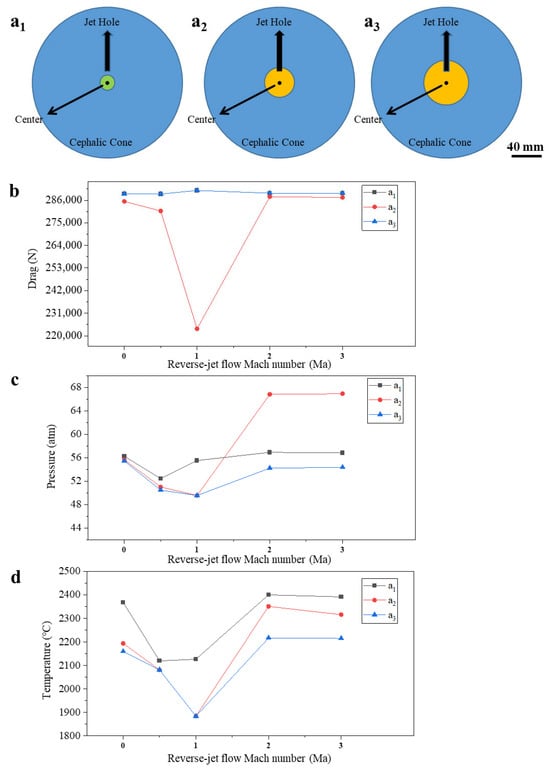
Figure 4.
Schematic structure of a single injection hole and its simulation results. (a1) Schematic structure of a 20 mm diameter single injection hole. (a2) Schematic structure of a 40 mm diameter single injection hole. (a3) Schematic structure of 60 mm diameter single injection hole; (b) 0–3 Ma reverse-jet flow Mach number, total flight resistance simulation results; (c) 0–3 Ma reverse-jet Mach number, total surface static pressure simulation results; (d) 0–3 Ma reverse-jet Mach number, total temperature simulation results.
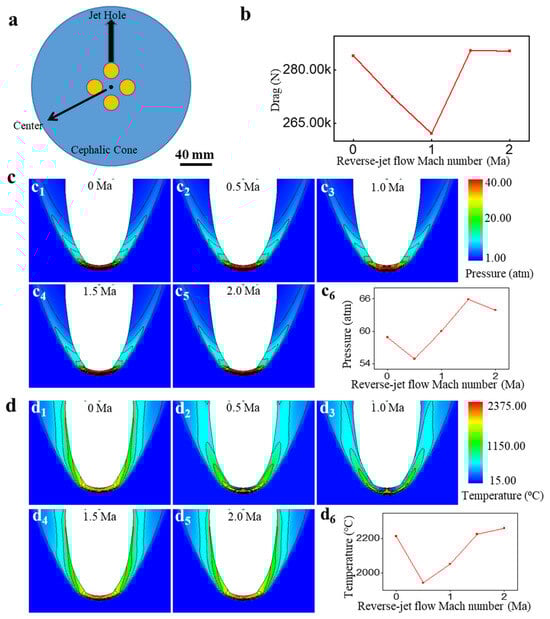
Figure 5.
Schematic structure of cross-distributed four-injection holes and its simulation results. (a) Schematic structure of cross-distributed four-jet orifices with 20 mm orifice diameter and 20 mm center distance; (b) 0–2 Ma reverse-jet Mach number, total flight resistance simulation results; (c1) 0 Ma reverse-jet Mach number, total surface static pressure simulation results; (c2) 0.5 Ma reverse-jet Mach number, total surface static pressure simulation results; (c3) 1.0 Ma reverse-jet Mach number, total surface static pressure simulation results; (c4) 1.5 Ma reverse-jet Mach number, total surface static pressure simulation results; (c5) 2.0 Ma reverse-jet Mach number, total surface static pressure simulation results; (d1) 0 Ma reverse-jet Mach number, total surface temperature simulation results; (d2) 0.5 Ma reverse-jet Mach number, total surface temperature simulation results; (d3) 1.0 Ma reverse-jet Mach number, total surface temperature simulation results; (d4) 1.5 Ma reverse-jet Mach number, total surface temperature simulation results; (d5) 2.0 Ma reverse-jet Mach number, total surface temperature simulation results.
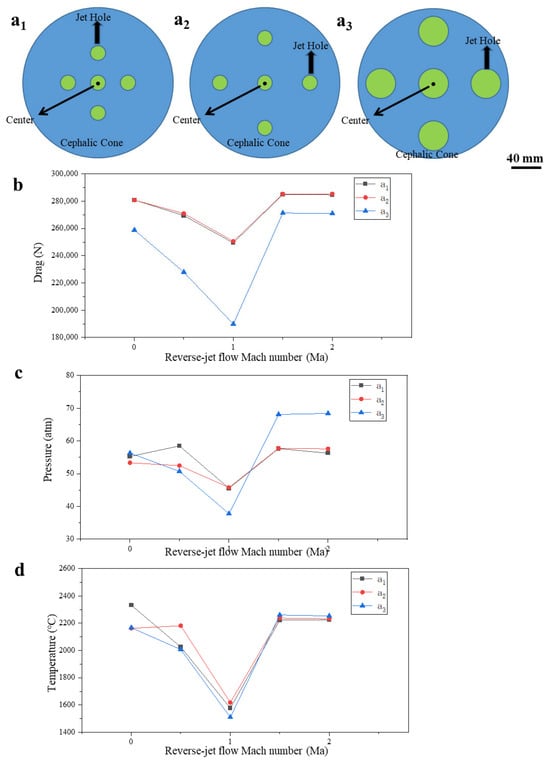
Figure 6.
Schematic diagram of the five-jet hole structure and its simulation results. (a1) Schematic structure of five injection holes with diameter 20 mm and center distance 40 mm. (a2) Schematic structure of five injection holes with diameter 20 mm and center distance 60 mm. (a3) Schematic structure of five injection holes with diameter 40 mm and center distance 60 mm. (b) Simulation results of 0–2 Ma reverse-jet Mach number and total flight resistance; (c) 0–2 Ma reverse-jet Mach number, total surface static pressure simulation results; (d) 0–2 Ma reverse-jet Mach number, total surface temperature simulation results.
By increasing the reverse-jet hole diameter to 40 mm, Figure 4c,d show that both the total surface static pressure and surface temperature are significantly reduced to 49.5 atm and 1883 °C, respectively. Comparing these results with those obtained without a reverse jet, we observe that the above two parameters are reduced by 35.4% and 14.1%, respectively. Figure 4b shows that the total drag is reduced to 223 KN, which is 22% lower than that in the case without a reverse jet. In addition, the reverse-jet hole diameter has a certain effect on thermal protection. Thus, we further increased the hole diameter and compared the simulation results to determine the hole diameter that provides the best thermal protection.
By further increasing the reverse-jet hole diameter to 60 mm, Figure 4c,d show that the total surface static pressure and temperature are maintained at 49.5 atm and 1883 °C, respectively; Figure 4b shows that the total drag does not change significantly. In other words, the 60 mm hole diameter does not affect thermal protection compared with the 40 mm diameter. This phenomenon suggests that the drag- and heat-reduction performance does not scale infinitely with the increase in a single-jet orifice diameter. We postulate that for the 60 mm diameter case, the excessively large jet plume induces significant self-interference and instability at the jet boundary. This disrupts the formation of a coherent and stable protective gas layer that can effectively deflect the incoming flow, thereby limiting further improvement in thermal protection performance. The existence of an optimal diameter for a single orifice configuration indicates a balance between jet penetration power and flow stability. This means that the reverse-jet hole diameter has a certain impact on thermal protection; however, an increasingly large hole diameter does not improve thermal protection. We assume that this is because when the hole diameter becomes too large, the jet gas produces mutual interference. Thus, we simulated a multi-hole reverse-jet scheme based on the single-hole scheme.
3.4. Simulation Results for a Multi-Hole Reverse Jet
3.4.1. Simulation Results for a Four-Hole Reverse Jet
To maintain the flight stability of an aircraft during hypersonic flight, a symmetric layout was adopted for all multi-hole jet schemes. Figure 5(c6,d6) show that when the reverse jet is modified from a single-hole to a multi-hole layout, the total surface static pressure and temperature are slightly increased to 54.9 atm and 1943.7 °C, respectively, compared with the single-hole optimal scheme and do not decrease further as expected. However, since the location of the jet holes in this scheme is not consistent with that in the single-hole scheme, it was decided to combine the two schemes and perform additional simulations.
3.4.2. Simulation Results for a Five-Hole Reverse Jet
We combined the first two jet schemes to form a five-hole jet scheme according to the location of the holes and their diameters, as shown in the three layouts of Figure 6. In Figure 6(a1) the hole diameters are 20 mm, and the distance between the center of the central hole and the centers of the other holes is 40 mm; in Figure 6(a2), the hole diameters remain unchanged at 20 mm, but the distance between the center of the central hole and the centers of the other holes is changed to 60 mm; in Figure 6(a3), only the hole diameters are increased to 40 mm. The effect of the jet gas on thermal protection was simulated for different jet speeds and Mach numbers, and the results were analyzed.
The single-hole and the four-hole reverse-jet schemes were combined and simulated; the results are presented in Figure 6. The pressure and temperature distributions around the nose cone for different jet hole diameters and Mach numbers are illustrated in Figure 7 and Figure 8, respectively. The flow field structures depicted in Figure 8 and Figure 9 reveal the superior mechanism of the multi-hole reverse jet. The key advantage lies in the synergistic interaction between the adjacent jets in the cross-distributed configuration. Unlike a single-jet which creates a single large recirculation zone, this setup generates multiple interacting jet plumes and recirculation zones. This interaction enhances the lateral spreading and mixing of the coolant gas, forming a more uniform and extensive protective ‘cooling blanket’ that shields a larger surface area of the nose cone. Collectively, these jets perturb a broader region of the incoming supersonic flow, more effectively breaking down the coherence of the primary bow shock and creating a complex, dissipated wave structure with a larger stand-off distance. This combined effect of improved surface coverage and enhanced shock disruption is the primary reason for the superior reduction in surface pressure (a major drag source) and temperature. Figure 6c (a1 at Ma = 1) shows that the total surface static pressure is reduced to 45 atm (a 41.3% decrease), and Figure 6d (a1 at Ma = 1) shows that the total surface temperature is reduced to 1577 °C (a 28.1% decrease). The total drag is 249 KN (a 13% decrease), as shown in Figure 5b (a1 at Ma = 1). A comparison of the cases without a reverse jet and single-hole reverse jet shows a significant improvement in thermal protection. The five-jet cross layout (40 mm diameter, 60 mm spacing) exemplifies the above physical principles: its diameter provides sufficient penetration. Its spacing allows the jets to reach total penetration before initiating constructive lateral interaction, enabling the formation of a broad and coherent gas curtain via lateral spreading without premature coalescence or excessive separation. Its symmetric arrangement ensures uniform protection in all directions.
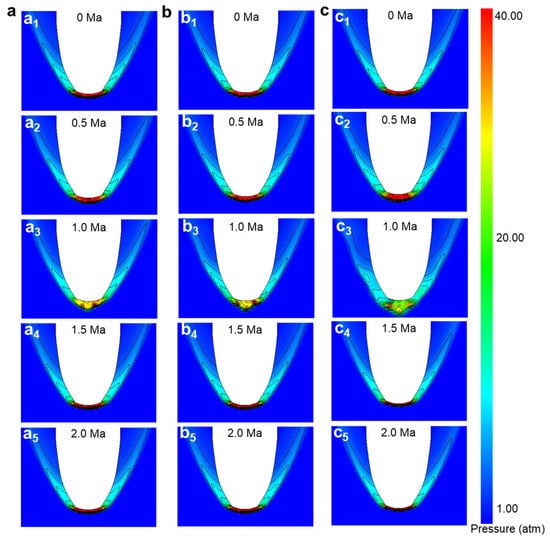
Figure 7.
Total surface hydrostatic pressure simulation results of five-jet orifices. (a1) The simulation results of total surface static pressure at 0 Ma reverse-jet Mach number for five-jet orifices with diameter 20 mm and center distance 40 mm; (a2) The simulation results of total surface static pressure at 0.5 Ma reverse-jet Mach number for five-jet orifices with diameter 20 mm and center distance 40 mm; (a3) The simulation results of total surface static pressure at 1.0 Ma reverse-jet Mach number for five-jet orifices with diameter 20 mm and center distance 40 mm; (a4) The simulation results of total surface static pressure at 1.5 Ma reverse-jet Mach number for five-jet orifices with diameter 20 mm and center distance 40 mm; (a5) The simulation results of total surface static pressure at 2.0 Ma reverse-jet Mach number for five-jet orifices with diameter 20 mm and center distance 40 mm; (b1) Simulation results of total surface static pressure of 0 Ma reverse-jet Mach number for five-jet holes with diameter 20 mm and center distance 60 mm; (b2) Simulation results of total surface static pressure of 0.5 Ma reverse-jet Mach number for five-jet holes with diameter 20 mm and center distance 60 mm; (b3) Simulation results of total surface static pressure of 1.0 Ma reverse-jet Mach number for five-jet holes with diameter 20 mm and center distance 60 mm; (b4) Simulation results of total surface static pressure of 1.5 Ma reverse-jet Mach number for five-jet holes with diameter 20 mm and center distance 60 mm; (b5) Simulation results of total surface static pressure of 2.0 Ma reverse-jet Mach number for five-jet holes with diameter 20 mm and center distance 60 mm; (c1) Simulation results of total surface static pressure of 0 Ma reverse-jet Mach number for five-jet holes with diameter 40 mm and center distance 60 mm; (c2) Simulation results of total surface static pressure of 0.5 Ma reverse-jet Mach number for five-jet holes with diameter 40 mm and center distance 60 mm; (c3) Simulation results of total surface static pressure of 1.0 Ma reverse-jet Mach number for five-jet holes with diameter 40 mm and center distance 60 mm; (c4) Simulation results of total surface static pressure of 1.5 Ma reverse-jet Mach number for five-jet holes with diameter 40 mm and center distance 60 mm; (c5) Simulation results of total surface static pressure of 2.0 Ma reverse-jet Mach number for five-jet holes with diameter 40 mm and center distance 60 mm.
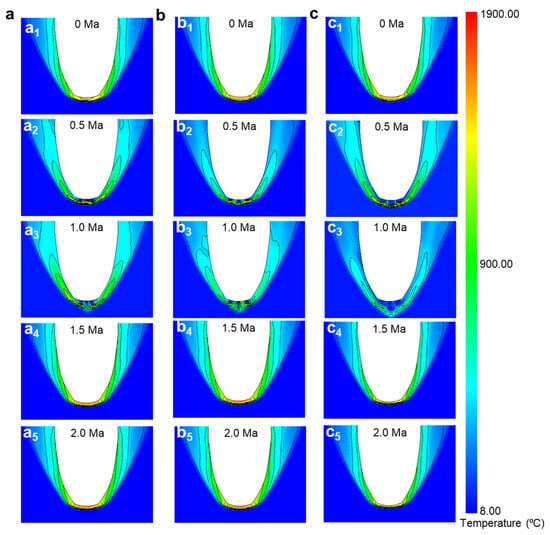
Figure 8.
Total surface temperature simulation results for five-jet orifices. (a1) Simulation results of total surface temperature of 0 Ma reverse-jet Mach number for five-jet orifices with diameter 20 mm and center distance 40 mm. (a2) Simulation results of total surface temperature of 0.5 Ma reverse-jet Mach number for five-jet orifices with diameter 20 mm and center distance 40 mm. (a3) Simulation results of total surface temperature of 1.0 Ma reverse-jet Mach number for five-jet orifices with diameter 20 mm and center distance 40 mm. (a4) Simulation results of total surface temperature of 1.5 Ma reverse-jet Mach number for five-jet orifices with diameter 20 mm and center distance 40 mm. (a5) Simulation results of total surface temperature of 2 Ma reverse-jet Mach number for five-jet orifices with diameter 20 mm and center distance 40 mm. (b1) Simulation results of total surface temperature at 0 Ma reverse-jet Mach number for five-jet orifices with diameter 20 mm and center distance 60 mm. (b2) Simulation results of total surface temperature at 0.5 Ma reverse-jet Mach number for five-jet orifices with diameter 20 mm and center distance 60 mm. (b3) Simulation results of total surface temperature at 1.0 Ma reverse-jet Mach number for five-jet orifices with diameter 20 mm and center distance 60 mm. (b4) Simulation results of total surface temperature at 1.5 Ma reverse-jet Mach number for five-jet orifices with diameter 20 mm and center distance 60 mm. (b5) Simulation results of total surface temperature at 2 Ma reverse-jet Mach number for five-jet orifices with diameter 20 mm and center distance 60 mm. (c1) Simulation results of total surface temperature of 0 Ma reverse-jet Mach number for five-jet holes with diameter 40 mm and center distance 60 mm. (c2) Simulation results of total surface temperature of 0.5 Ma reverse-jet Mach number for five-jet holes with diameter 40 mm and center distance 60 mm. (c3) Simulation results of total surface temperature of 1.0 Ma reverse-jet Mach number for five-jet holes with diameter 40 mm and center distance 60 mm. (c4) Simulation results of total surface temperature of 1.5 Ma reverse-jet Mach number for five-jet holes with diameter 40 mm and center distance 60 mm. (c5) Simulation results of total surface temperature of 2 Ma reverse-jet Mach number for five-jet holes with diameter 40 mm and center distance 60 mm.
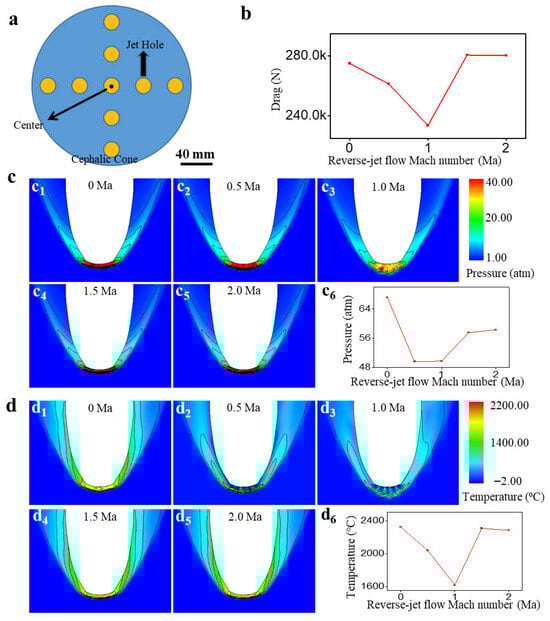
Figure 9.
Schematic structure of cross-distributed nine-jet holes and its simulation results. (a) Schematic structure of cross-distributed nine-jet holes with 20 mm hole diameter and 40 mm center distance. (b) 0–2 Ma reverse-jet Mach number, total flight resistance simulation results. (c1) 0 Ma reverse-jet Mach number, total surface static pressure simulation results. (c2) 0.5 Ma reverse-jet Mach number, total surface static pressure simulation results. (c3) 1.0 Ma reverse-jet Mach number, total surface static pressure simulation results. (c4) 1.5 Ma reverse-jet Mach number, total surface static pressure simulation results. (c5) 2 Ma reverse-jet Mach number, total surface static pressure simulation results. (d1) 0 Ma reverse-jet Mach number, total surface temperature simulation results. (d2) 0.5 Ma reverse-jet Mach number, total surface temperature simulation results. (d3) 1.0 Ma reverse-jet Mach number, total surface temperature simulation results. (d4) 1.5 Ma reverse-jet Mach number, total surface temperature simulation results. (d5) 2 Ma reverse-jet Mach number, total surface temperature simulation results.
By increasing the center-of-circle distance between the center of the central hole and the centers of the other holes to 60 mm, the total surface hydrostatic pressure and surface temperature became 45 atm and 1617 °C, respectively, as shown in Figure 6c,d (a2 at Ma = 1), respectively; the total drag is 250 KN, as shown in Figure 6b (a2 at Ma = 1). Except for the total surface hydrostatic pressure, which remains unchanged, both the total surface temperature and drag are slightly increased compared with the previous scheme; thus, thermal protection is slightly reduced. The performance comparison between the 40 mm and 60 mm center-distance configurations (both with 20 mm holes) highlights the critical role of jet spacing. The increased spacing likely reduces the beneficial interaction between the jet plumes, allowing the high-energy freestream to penetrate deeper into the gaps between them. This reduces the effectiveness of the combined protective layer, leading to increased heat flux and drag on the exposed surface areas. Conversely, the optimal performance of the 40 mm diameter, 60 mm spacing scheme (Figure 7(a2)) demonstrates that increasing the jet diameter (and thus mass flow and penetration) while maintaining a sufficient spacing for constructive—rather than destructive—interference is key to maximizing drag- and heat-reduction. This implies that by simply increasing the spacing between jet holes, thermal protection cannot be improved. This means that the reduced hole spacing and increased interaction between two holes push the air-compression surge away from the surface and significantly reduce the heat flow. In the simulation of the single-hole reverse jet, we concluded that the jet hole diameter affects thermal protection. Thus, we increased the jet hole diameter to investigate the subsequent changes in thermal protection.
By increasing the jet hole diameter to 40 mm, the total surface static pressure, surface temperature, and drag were reduced to 37 atm, 1509 °C, and 189 KN, respectively, indicating a decrease of 51.7%, 31.2%, and 33.9%, respectively, compared with the case without a reverse jet, thus achieving the best thermal-protection performance among all schemes. Subsequently, we further increased the number of jet holes to investigate the effect of different numbers of jet holes on thermal protection.
3.4.3. Simulation Results for a Nine-Hole Reverse Jet
By increasing the number of reverse-jet holes from 5 to 9, the simulation results showed that the total static pressure, surface temperature, and drag became 49 atm, 1616 °C, and 233 KN, respectively, as shown in Figure 9(b,c6,d6), indicating an increase compared with the aforementioned best solution. This means that by simply increasing the number of jet holes, thermal protection is not improved. This performance degradation underscores that more jets are not invariably better. The closer proximity of the jets in the nine-hole array likely leads to excessive interaction and mutual interference before the jets fully penetrate the freestream. This can cause the individual jet plumes to coalesce and behave like a single, less-penetrative blunt body, which diminishes the shock stand-off distance. Additionally, for a given total mass flow rate, the dynamic pressure per jet is reduced, weakening their individual effectiveness in opposing the freestream. The subsequent results with rectangular distributions further confirm that the flow field structure is highly sensitive to the geometric layout of the jets. In Figure S4, we present some simulation results for cross-distributed 5-hole and 9-hole jets and different distances between the hole centers. These results show that the thermal protection is not as good as that of the jet scheme, as shown in Figure 6(a3). We assume that this is caused by the interference among jet holes. Thus, we changed the layout of the jet holes and performed additional simulations.
We changed the previous cross-distribution of holes to a rectangular distribution and designed three jet layouts, as shown in Figure 10. In Figure 10(a1), the jet hole diameter is 20 mm, and the length of the rectangular side where the central hole is located is 60 mm; in Figure 10(a2), the jet hole diameter remains unchanged and the length of the rectangular side is increased to 100 mm; in Figure 10(a3), the jet hole diameter is increased to 40 mm. The simulation results of the total surface pressure and the total surface temperature are shown in Figure 11 and Figure 12 respectively. Figure 10b–d show that after changing the layout of the jet holes, the total surface temperature and drag slightly decrease compared with those in the case of the non-reversing jet. However, the total surface static pressure increases substantially, indicating that such a scheme cannot be applied in practice. Figures S3, S5, and S6 show the simulation results based on other jet hole distributions. These results show that the one-word distribution, circular distance superposition of a double-layer distribution, and star distribution reduce thermal protection compared with the cross-distribution of holes shown in Figure 8. The pressure and temperature distributions around the nose cone for different jet hole diameters and Mach numbers are illustrated in Figure 9 and Figure 10, respectively.
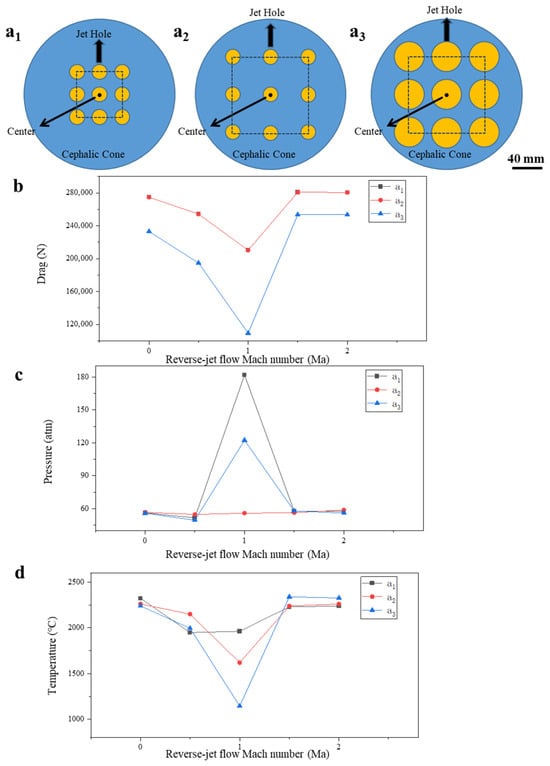
Figure 10.
Schematic structure of rectangularly distributed nine-jet holes and its simulation results. (a1) Schematic structure of rectangularly distributed nine-jet holes with a hole diameter of 20 mm and a rectangular side length of 60 mm. (a2) Schematic structure of rectangularly distributed nine-jet holes with a hole diameter of 20 mm and a rectangular side length of 100 mm. (a3) Schematic diagram of a rectangularly distributed nine-jet hole structure with a hole diameter of 40 mm and a rectangular side length of 100 mm; (b) 0–2 Ma reverse-jet Mach number, flight drag simulation results; (c) 0–2 Ma reverse-jet Mach number, total surface static pressure simulation results; (d) 0–2 Ma reverse-jet Mach number, total surface temperature simulation results.
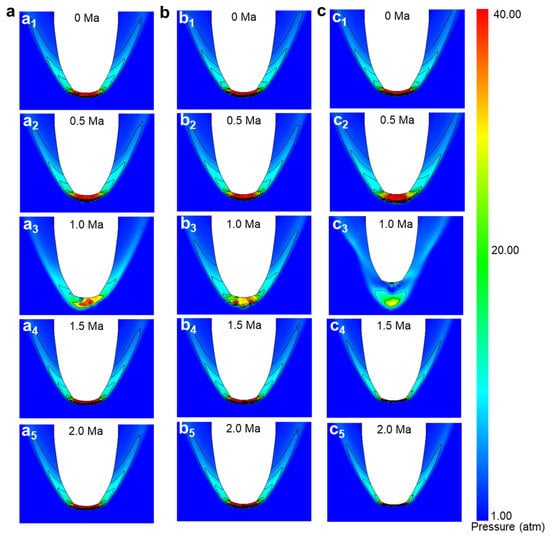
Figure 11.
Total surface static pressure simulation results of rectangular distribution nine-jet holes. (a1) Simulation results of total surface static pressure for 0 Ma reverse-jet Mach number of rectangularly distributed nine-jet orifices with 20 mm hole diameter and 60 mm rectangular side length. (a2) Simulation results of total surface static pressure for 0.5 Ma reverse-jet Mach number of rectangularly distributed nine-jet orifices with 20 mm hole diameter and 60 mm rectangular side length. (a3) Simulation results of total surface static pressure for 1.0 Ma reverse-jet Mach number of rectangularly distributed nine-jet orifices with 20 mm hole diameter and 60 mm rectangular side length. (a4) Simulation results of total surface static pressure for 1.5 Ma reverse-jet Mach number of rectangularly distributed nine-jet orifices with 20 mm hole diameter and 60 mm rectangular side length. (a5) Simulation results of total surface static pressure for 2.0 Ma reverse-jet Mach number of rectangularly distributed nine-jet orifices with 20 mm hole diameter and 60 mm rectangular side length. (b1) Simulation results of total surface static pressure at 0 Ma reverse-jet Mach number for a rectangularly distributed nine-jet orifice with a hole diameter of 20 mm and a rectangular side length of 100 mm. (b2) Simulation results of total surface static pressure at 0.5 Ma reverse-jet Mach number for a rectangularly distributed nine-jet orifice with a hole diameter of 20 mm and a rectangular side length of 100 mm. (b3) Simulation results of total surface static pressure at 1.0 Ma reverse-jet Mach number for a rectangularly distributed nine-jet orifice with a hole diameter of 20 mm and a rectangular side length of 100 mm. (b4) Simulation results of total surface static pressure at 1.5 Ma reverse-jet Mach number for a rectangularly distributed nine-jet orifice with a hole diameter of 20 mm and a rectangular side length of 100 mm. (b5) Simulation results of total surface static pressure at 2.0 Ma reverse-jet Mach number for a rectangularly distributed nine-jet orifice with a hole diameter of 20 mm and a rectangular side length of 100 mm. (c1) Simulation results of total surface static pressure of 0 Ma reverse-jet Mach number for a rectangular distribution of nine-jet holes with a hole diameter of 40 mm and a rectangular side length of 100 mm. (c2) Simulation results of total surface static pressure of 0.5 Ma reverse-jet Mach number for a rectangular distribution of nine-jet holes with a hole diameter of 40 mm and a rectangular side length of 100 mm.(c3) Simulation results of total surface static pressure of 1.0 Ma reverse-jet Mach number for a rectangular distribution of nine-jet holes with a hole diameter of 40 mm and a rectangular side length of 100 mm.(c4) Simulation results of total surface static pressure of 1.5 Ma reverse-jet Mach number for a rectangular distribution of nine-jet holes with a hole diameter of 40 mm and a rectangular side length of 100 mm.(c5) Simulation results of total surface static pressure of 2.0 Ma reverse-jet Mach number for a rectangular distribution of nine-jet holes with a hole diameter of 40 mm and a rectangular side length of 100 mm.
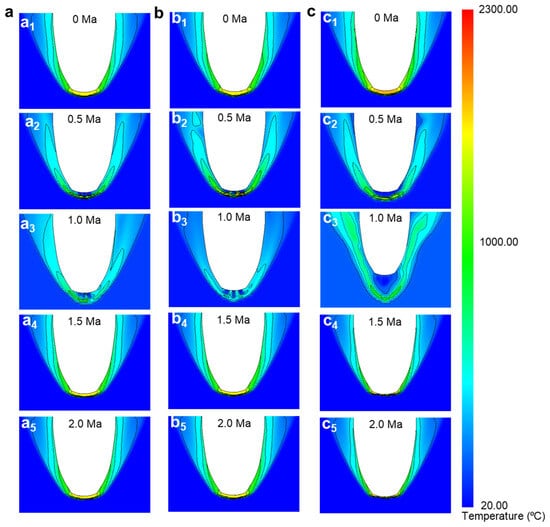
Figure 12.
Total surface temperature simulation results for rectangularly distributed nine-jet holes. (a1) Clouds of simulation results of total surface temperature of 0 Ma reverse-jet Mach number for rectangularly distributed nine-jet orifice with 20 mm hole diameter and 60 mm rectangular side length. (a2) Clouds of simulation results of total surface temperature of 0.5 Ma reverse-jet Mach number for rectangularly distributed nine-jet orifice with 20 mm hole diameter and 60 mm rectangular side length. (a3) Clouds of simulation results of total surface temperature of 1.0 Ma reverse-jet Mach number for rectangularly distributed nine-jet orifice with 20 mm hole diameter and 60 mm rectangular side length. (a4) Clouds of simulation results of total surface temperature of 1.5 Ma reverse-jet Mach number for rectangularly distributed nine-jet orifice with 20 mm hole diameter and 60 mm rectangular side length. (a5) Clouds of simulation results of total surface temperature of 2.0 Ma reverse-jet Mach number for rectangularly distributed nine-jet orifice with 20 mm hole diameter and 60 mm rectangular side length. (b1) Simulation results of total surface temperature at 0 Ma reverse-jet Mach number for a rectangularly distributed nine-jet orifice with a hole diameter of 20 mm and a rectangular side length of 100 mm. (b2) Simulation results of total surface temperature at 0.5 Ma reverse-jet Mach number for a rectangularly distributed nine-jet orifice with a hole diameter of 20 mm and a rectangular side length of 100 mm. (b3) Simulation results of total surface temperature at 1.0 Ma reverse-jet Mach number for a rectangularly distributed nine-jet orifice with a hole diameter of 20 mm and a rectangular side length of 100 mm. (b4) Simulation results of total surface temperature at 1.5 Ma reverse-jet Mach number for a rectangularly distributed nine-jet orifice with a hole diameter of 20 mm and a rectangular side length of 100 mm. (b5) Simulation results of total surface temperature at 2.0 Ma reverse-jet Mach number for a rectangularly distributed nine-jet orifice with a hole diameter of 20 mm and a rectangular side length of 100 mm. (c1) Simulation results of total surface temperature of 0 Ma reverse-jet Mach number for a rectangular distribution of nine-jet holes with a hole diameter of 40 mm and a rectangular side length of 100 mm. (c2) Simulation results of total surface temperature of 0.5 Ma reverse-jet Mach number for a rectangular distribution of nine-jet holes with a hole diameter of 40 mm and a rectangular side length of 100 mm. (c3) Simulation results of total surface temperature of 1.0 Ma reverse-jet Mach number for a rectangular distribution of nine-jet holes with a hole diameter of 40 mm and a rectangular side length of 100 mm. (c4) Simulation results of total surface temperature of 1.5 Ma reverse-jet Mach number for a rectangular distribution of nine-jet holes with a hole diameter of 40 mm and a rectangular side length of 100 mm. (c5) Simulation results of total surface temperature of 2.0 Ma reverse-jet Mach number for a rectangular distribution of nine-jet holes with a hole diameter of 40 mm and a rectangular side length of 100 mm.
Currently, among the various reverse-jet TPSs, the five-hole jet scheme (jet hole diameter: 40 mm, distance between centers of holes: 60 mm) shown in Figure 6(a3) achieves the best thermal-protection performance. The simulation results showed that by employing a reverse jet, the total surface static pressure of the five-hole jet became 37 atm, which is 51.7% lower than that in the case without the reverse jet (76.64 atm). Additionally, the total drag is 189 KN, which is 33.9% lower than that in the case without the reverse jet (286 KN), and the total surface temperature is 1509 °C, which is 31.2% lower than that in the case without the reverse jet (2192 °C). Thus, good thermal protection is achieved. The multi-hole reverse-jet experiment reported by Sriram showed that employing multiple holes is more favorable regarding heat reduction than a single-hole under the condition of a constant mass flow rate. This is because the jet energy provided by the jet hole with a small aperture is low, which favors the diffusion of the cooling material on the nose and fuselage surfaces of an aircraft; thus, further heat reduction can be achieved.
3.5. Jet Structure Design
Based on the simulation analysis of different reverse-jet schemes and the structure of an aircraft nose cone, we designed a five-hole jet device, as shown in Figure 13. When the jet system starts, the air intake at the back of the nose cone of the aircraft rotates inward and opens. The two semicircular devices on the right are the intake pipes of the entire jet device, and the gas enters the interior of the jet device directly from the intake pipes. When high-speed air is fed into the hub of the impeller and in contact with it, the impeller rotates at high speed, the gas flows backward in the blade, and the centrifugal force drains the air into the narrow unit housing, where it is slowed and pressurized. The gas flows into the nose cone through the pipe between the shell and impeller and its support plate. After passing through the bellows, the check valve is pushed open, and the gas is sprayed out of the cone to produce a reverse jet.
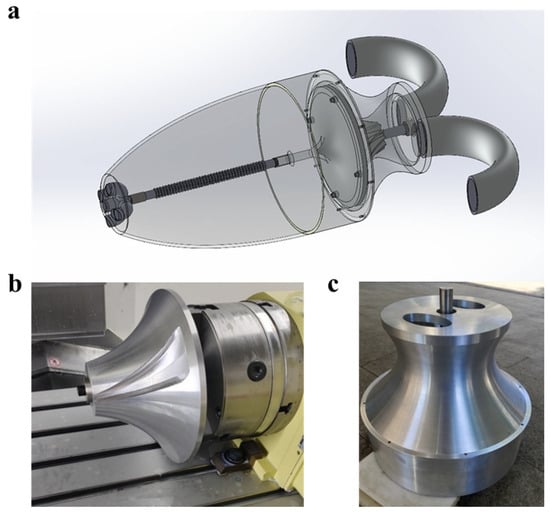
Figure 13.
Structure of a reverse-jet device. (a) Overall three-dimensional structural design drawing (b) turbine processing map (c) Cavity of reverse jet device.
Due to the limited experimental conditions, we only carried out functional experimental analysis of the designed model, i.e., we verified that the model can realize the five-hole jet required by the target, and as to whether it can realize the function of cooling and drag reduction as shown in the simulation, we hope that the verification can be accomplished in the subsequent research.
4. Conclusions
In this study, we employed FLOEFD CFD simulation software to establish a 3-D supersonic flow simulation model and simulate the effect of various reverse-jet schemes on the thermal protection of an aircraft in supersonic flight. The results showed that in the case of a single-hole reverse-jet flow, the jet hole diameter has a certain impact on the thermal-protection performance of the aircraft; however, this performance does not increase proportionally with the increase in the hole diameter. This is because, when the jet hole diameter becomes too large, the jet gas causes mutual interference and affects the thermal-protection performance. Additionally, according to the simulation results of the multi-hole reverse-jet scheme, the thermal-protection performance could not be improved by simply increasing the distance between the jet hole centers and the number of jet holes. This is because when this distance is reduced, the interaction between the two holes is increased, pushing the shockwave away from the wall surface and significantly reducing the heat flow on the wall. By assessing the thermal-protection performance of different schemes in the simulation model, we found that among the various reverse-jet thermal-protection schemes, the five-hole jet scheme with a jet hole diameter of 40 mm and a center distance of 60 mm achieves the best performance among all configurations studied. The performance differences between schemes are primarily governed by how effectively the jet configuration alters the upstream flow field structure and forms an insulating coolant layer. For single-hole jets, performance is limited by self-interference beyond an optimal diameter. For multi-hole jets, the interaction between jets is crucial: constructive interaction (e.g., in the optimal cross-distributed five-hole design) enhances coolant coverage and shock disruption, while excessive interaction (e.g., in the nine-hole array) diminishes jet penetration and stability. The simulation showed that, by employing a reverse jet, the total surface static pressure of this scheme became 37 atm. Compared with the case without a reverse jet (76.64 atm), a 51.7% reduction is achieved. The total drag is 189 KN, which is 33.9% lower than that without a reverse jet (286 KN), and the total surface temperature is 1509 °C, which is 31.2% lower than that in the case without a reverse jet (2192 °C).
Supplementary Materials
The following supporting information can be downloaded at: https://www.mdpi.com/article/10.3390/aerospace13010047/s1, Figure S1: Simulation results for different jet gases. Figure S2: Simulation results for different injection temperatures. Figure S3: Schematic diagram of the one-word distribution structure and its simulation results. Figure S4: Schematic diagram of the cross-distributed structure and its simulation results. Figure S5: Schematic diagram of circular center distance stacked bilayer distribution structure and its simulation results. Figure S6: Schematic structure of star-shaped pin distribution and its simulation results.
Author Contributions
Conceptualization, funding acquisition, Y.W.; writing—original draft, J.Z. (Jianbo Zhou), Z.W.; investigation, Y.G.; formal analysis, H.L.; supervision, R.P.; resources, J.Z. (Jieliang Zhao). All authors have read and agreed to the published version of the manuscript.
Funding
The authors are grateful for the financial support from the National Key Research and Development Program of China (No. 2021YFB3400200), Beijing Natural Science Foundation (2244086).
Data Availability Statement
The datasets used and analyzed during the current study are available from the corresponding author on reasonable request.
Acknowledgments
The authors would like to thank Shiyanjia Lab (www.shiyanjia.com) for their guidance on the analysis of the thermodynamic simulation modeling.
Conflicts of Interest
The authors declare that they have no competing interests.
Abbreviations
| TPS | Thermal protection system |
| CAD | Computer-aided design |
References
- Yin, N.; Xing, Z.G.; He, K.; Zhang, Z.N. Tribo-informatics approaches in tribology research: A review. Friction 2023, 11, 1–22. [Google Scholar] [CrossRef]
- Yi, Z.; Wang, X.; Li, W.; Qin, X.; Li, Y.; Wang, K.; Guo, Y.; Li, X.; Zhang, W.; Wang, Z. Interfacial friction at action: Interactions, regulation, and applications. Friction 2023, 11, 2153–2180. [Google Scholar] [CrossRef]
- John, D.; Anderson, J. Hypersonic and High-Temperature Gas Dynamics; American Institute of Aeronautics and Astronautics, Inc.: Cambridge, MA, USA, 2006. [Google Scholar]
- Bushnell, D.M. Shock wave drag reduction. Annu. Rev. Fluid. Mech. 2004, 36, 81–96. [Google Scholar] [CrossRef]
- Anderson, J.D. Hypersonic and High Temperature Gas Dynamics; Mc Graw-Hill: New York, NY, USA, 1989. [Google Scholar]
- Huang, J.; Yao, W. High temperature mechanical properties of strain-isolation-pad for thermal protection system. J. Spacecr. Rocket. 2018, 55, 848–855. [Google Scholar] [CrossRef]
- Huang, J.; Li, P.; Yao, W. Thermal protection system gap analysis using a loosely coupled fluid-structural thermal numerical method. Acta Astronaut. 2018, 146, 368–377. [Google Scholar] [CrossRef]
- Huang, J.; Yao, W.; Li, P.; Zhou, D.; Chang, C.; Lin, H. Investigation on dynamic behaviors of thermal protection system using a two degree-of-freedom nonlinear theoretical method. Acta Astronaut. 2018, 151, 828–835. [Google Scholar] [CrossRef]
- Maruyama, S.; Viskanta, R.; Aihara, T. Active thermal protection system against intense irradiation. J. Thermophys. Heat. Tr. 1989, 3, 389–394. [Google Scholar] [CrossRef]
- Krishna, A.; Parammasivam, K. Investigations of improved cooling effectiveness for ramp film cooling with compound angle film cooling jets. Aircr. Eng. Aerosp. Tec. 2021, 93, 971–984. [Google Scholar]
- Marc, F.; Tobias, G.; Achmed, S.; Bauer, H.J. Optimized inlet geometry of a laidback fan-shaped film cooling hole—Experimental study of film cooling performance. Int. J Heat Mass Tran 2019, 128, 980–990. [Google Scholar]
- Xiao, X.; Zhao, G.; Zhou, W. Numerical investigation of transpiration cooling for porous nose cone with liquid coolant. Int. J. Heat. Mass. Transf. 2018, 121, 1297–1306. [Google Scholar] [CrossRef]
- Wang, X.; Fan, X.; Wang, S.; Xiong, B. Discussion of the design method for porosity driven by pressure differences during transpiration cooling. Int. Commun. Heat Mass Transf. 2024, 152, 107260. [Google Scholar] [CrossRef]
- Zuo, J.; Zhang, S.; Qin, J.; Bao, W.; Cui, N. Performance evaluation of regenerative cooling/film cooling for hydrocarbon fueled scramjet engine. Acta Astronaut. 2018, 148, 57–68. [Google Scholar] [CrossRef]
- Luo, S.; Xu, D.; Song, J.; Liu, J. A review of regenerative cooling technologies for scramjets. Appl. Therm. Eng. 2021, 190, 116754. [Google Scholar] [CrossRef]
- Zhu, Y.; Peng, W.; Xu, R.; Jiang, P. Review on active thermal protection and its heat transfer for airbreathing hypersonic vehicles. Chin. J. Aeronaut. 2018, 31, 1929–1953. [Google Scholar] [CrossRef]
- Yan, D.; He, G.; Li, W.; Zhang, D.; Qin, F. Thermal analysis of regenerative-cooled pylon in multi-mode rocket based combined cycle engine. Acta Astronaut. 2018, 148, 121–131. [Google Scholar] [CrossRef]
- Singh, K.; Udayraj. Combined film and impingement cooling of flat plate with reverse cooling hole. Appl. Therm. Eng. 2022, 208, 118224. [Google Scholar] [CrossRef]
- Ma, C.; Zhang, H.; Zhang, J.; Wang, X. Transient experimental study on cooling performance of a radial turbine with impingement cooling in rotating state. Aerosp. Sci. Technol. 2024, 151, 109321. [Google Scholar] [CrossRef]
- Zhang, Z.; Yan, C.; Kang, D.-K.; Jiang, Z.-H. Numerical Study of Reverse Jet for Mitigating Shock/Shock Interaction Heating. Aerosp. Sci. Technol. 2022, 131, 108015. [Google Scholar] [CrossRef]
- Fan, D.; Feng, X.; Wei, H.; Dong, Z.; Zihan, J.; Jun, C.; Sen, L. Applications of counterflowing jet technology in hypersonic vehicle. Acta Aerodyn. Sin. 2017, 35, 485–495. (In Chinese) [Google Scholar]
- Silton, S.Z.; Goldstein, D.B. Optimization of an Axial Nose-Tip Cavity for Delaying Ablation Onset in Hypersonic Flow. In Proceedings of the 41st Aerospace Sciences Meeting and Exhibit, Reno, NV, USA, 6–9 January 2003. [Google Scholar]
- Srinath, S.; Reddy, K.P.J. Experimental investigation of the effects of aerospike geometry on aerodynamic drag and heat transfer rates for a blunt body configuration at hypersonic Mach numbers. Int. J. Hypersonics 2010, 1, 93–114. [Google Scholar] [CrossRef]
- Warren, C.H.E. An experimental investigation of the effect of ejecting a coolant gas at the nose of a bluff body. J. Fluid Mech. 1960, 8, 400–417. [Google Scholar] [CrossRef]
- Finley, P.J. The flow of a jet from a body opposing a supersonic free stream. J. Fluid. Mech. 1966, 26, 337–368. [Google Scholar] [CrossRef]
- Li, S.-B.; Wang, Z.-G.; Huang, W.; Liu, J. Effect of the injector configuration for opposing jet on the drag and heat reduction. Aerosp. Sci. Technol. 2016, 51, 78–86. [Google Scholar] [CrossRef]
- Shen, B.; Liu, W.; Yin, L. Drag and heat reduction efficiency research on opposing jet in supersonic flows. Aerosp. Sci. Technol. 2018, 77, 696–703. [Google Scholar] [CrossRef]
- Lu, H.; Liu, W. Investigation of thermal protection system by forward-facingcavity and opposing jet combinatorial configuration. Chin. J. Aeronaut. 2013, 26, 287–293. [Google Scholar] [CrossRef]
- Ni, Z.; Fang, S.; Guo, J.; Wang, Z. Research on drag reduction and heat prevention of hypersonic vehicle combined model with reverse jet and slot blowing. J. Phys. Conf. Ser. 2023, 2459, 012140. [Google Scholar] [CrossRef]
- Yamauchi, M.; Fujii, K.; Higashino, F. Numerical investigation of supersonic flows around a spiked blunt body. J. Spacecr. Rocket. 1995, 32, 32–42. [Google Scholar] [CrossRef]
- Cheung, L.C.; Zaki, T.A. An Eigen-Representation of the Navier–Stokes Equations. J. Comput. Appl. Math. 2023, 423, 114921. [Google Scholar] [CrossRef]
- Sheng, W. A Revisit of Navier–Stokes Equation. Eur. J. Mech. B. Fluids 2020, 80, 60–71. [Google Scholar] [CrossRef]
- Wu, X.; Wu, Z.; Liang, L.; Zhao, J.; Wang, W.; Yan, S. Bio-inspired design and performance evaluation of a novel morphing nose cone for aerospace vehicles. Aerosp. Sci. Technol. 2023, 137, 1270–9638. [Google Scholar] [CrossRef]
- Sriram, R.; Jagadeesh, G. Film cooling at hyper- sonic Mach numbers using forward facing array of micro jets. Int. J. Heat. Mass. Transf. 2009, 52, 3654–3664. [Google Scholar] [CrossRef]
Disclaimer/Publisher’s Note: The statements, opinions and data contained in all publications are solely those of the individual author(s) and contributor(s) and not of MDPI and/or the editor(s). MDPI and/or the editor(s) disclaim responsibility for any injury to people or property resulting from any ideas, methods, instructions or products referred to in the content. |
© 2025 by the authors. Licensee MDPI, Basel, Switzerland. This article is an open access article distributed under the terms and conditions of the Creative Commons Attribution (CC BY) license.