Article

Transient Temperature Evaluation and Thermal Management Optimization Strategy for Aero-Engine Across the Entire Flight Envelope

1
School of Energy and Power Engineering, Nanjing University of Aeronautics and Astronautics, Nanjing 200016, China
2
School of Aerospace Engineering, Tsinghua University, Beijing 100084, China
*
Authors to whom correspondence should be addressed.
Aerospace 2025, 12(6), 562; https://doi.org/10.3390/aerospace12060562
Submission received: 13 May 2025 / Revised: 12 June 2025 / Accepted: 18 June 2025 / Published: 19 June 2025
(This article belongs to the Special Issue Aircraft Thermal Management Technologies)

Abstract

:
With the enhancement of thermodynamic cycle parameters and heat dissipation constraints in aero-engines, effective thermal management has become a critical challenge to ensure safe and stable engine operation. This study developed a transient temperature evaluation model applicable to the entire flight envelope, considering fluid–solid coupling heat transfer on both the main flow path and fuel systems. Firstly, the impact of heat transfer on the acceleration and deceleration performance of a low-bypass-ratio turbofan engine was analyzed. The results indicate that, compared to the conventional adiabatic model, the improved model predicts metal components absorb 4.5% of the total combustor energy during cold-state acceleration, leading to a maximum reduction of 1.42 kN in net thrust and an increase in specific fuel consumption by 1.18 g/(kN·s). Subsequently, a systematic evaluation of engine thermal management performance throughout the complete flight mission was conducted, revealing the limitations of the existing thermal management design and proposing targeted optimization strategies, including employing Cooled Cooling Air technology to improve high-pressure turbine blade cooling efficiency, dynamically adjusting low-pressure turbine bleed air to minimize unnecessary losses, optimizing fuel heat sink utilization for enhanced cooling performance, and replacing mechanical pumps with motor pumps for precise fuel supply control.

1. Introduction

With the continuous advancement of aviation technology, particularly driven by the demands for higher thrust-to-weight ratios, greater efficiency, and lower emissions, the next generation of aero-engines is evolving towards increased complexity and higher efficiency. To meet the increasingly stringent performance requirements and compact engine designs, the thermodynamic cycle of aero-engines is being progressively enhanced [1]. Meanwhile, the widespread application of advanced stealth materials with low thermal conductivity has further intensified the thermal challenges faced by engines [2,3]. These developments not only require the engine to have higher power output, but also need to cope with more complex thermal management challenges. Consequently, effective thermal management has become a critical issue in aero-engine design, ensuring safe and stable operation under extreme conditions of high temperature and high pressure [4]. In this context, establishing a comprehensive transient temperature evaluation model applicable across the entire flight envelope is fundamental to engine thermal management.
Thermal management extends beyond traditional thermal control, focusing on optimizing the distribution, transfer, and utilization of heat at the system level. In advanced aero-engine thermal management systems, the fuel system not only handles fuel delivery and flow regulation but also plays a crucial role in overall thermal management by directly or indirectly cooling hydraulic oil, lubricating oil, and electronic components [5,6,7]. Therefore, comprehensive engine temperature assessment should consider not only the main flow path system (it refers to the core passage within the engine where the air/gas flows along the airflow path, undergoing compression, combustion, and expansion to perform work) but also the thermal effects of the fuel system. Furthermore, an effective engine temperature evaluation model should not only be capable of predicting the transient temperature variations of the working fluid in the mainstream path and fuel system under different flight conditions, but also accurately assess the thermal load on each component under various operating conditions. This reflects two essential aspects of the aero-engine temperature evaluation model: performance prediction and component temperature assessment.
During rapid acceleration and deceleration of an engine, the temperature difference between the working fluid and metal components induces significant heat transfer, which in turn affects the working capacity of the working fluid [8,9]. To address this phenomenon, numerous researchers have extensively investigated the impact of heat transfer on engine performance. Early studies applied transient simulations to simple jet engines and turbofan engines using heat transfer models based on empirical formulas, such as the F-parameter method and lumped parameter method (LPM) [10,11]. However, the LPM assumes a constant fluid temperature, which limits its applicability in complex heat transfer processes. To overcome this limitation, the subsequent research considered the change in fluid temperature in the heat transfer process, which provides more accurate simulation results [12]. Additionally, thermal network models, incorporating multiple heat source components and nonlinear differential equations, further enhanced the precision of inter-component heat exchange calculations [9]. Nevertheless, these methods remain limited in handling complex heat conduction modes, particularly in maintaining thermal calculation continuity across interfaces. To refine thermal simulations, researchers further adopted one-dimensional heat conduction models [13] and the finite element method [14] to improve the accuracy of heat transfer predictions. The finite element method provides a more detailed internal temperature distribution when estimating the heat transfer between the component and the working fluid [15]. With advancements in heat transfer analysis techniques, the component temperature evaluation method is no longer limited to simple heat flux calculation, evolving toward more precise multi-physics simulations. By incorporating three-dimensional numerical simulations that account for fluid–solid coupling effects, researchers have significantly improved the accuracy of temperature predictions. This approach is particularly effective in the thermal analysis of high-temperature components such as combustors and high-pressure turbines, providing a comprehensive understanding of their thermal behavior under various operating conditions [16].
Existing research indicates an inherent trade-off between engine performance prediction and detailed component temperature evaluation in the design and optimization of thermal management systems. Performance prediction typically requires simulations that cover the entire flight mission, necessitating high computational efficiency. However, employing excessively detailed three-dimensional simulations would lead to prohibitive computational costs, making them impractical for engineering applications. Conversely, overly simplified zero-dimensional or one-dimensional models lack the fidelity needed to accurately capture component temperature distributions. Therefore, achieving a balance between accuracy and computational efficiency while selecting appropriate modeling approaches remains a critical challenge in thermal management design.
In the assessment of the thermal management characteristics of fuel systems, extensive research has been conducted focusing on variations in fuel temperature. For instance, Yang et al. [17] developed a steady-state thermal management simulation program for fuel systems to calculate the distribution of fuel temperature. Kang et al. [18] analyzed the fuel temperature rise using Flowmaster software, and found that the fuel flow back to the tank could effectively reduce the fuel temperature. Liu et al. [19] constructed a thermal management system model for engines that includes an intermediate circulation using a thermal flow method, optimizing the heat exchange performance between oil and fuel. Moreover, the thermal generation within the fuel system itself has become a significant area of research. Oba and Gonda [20] proposed that a variable-speed fuel pump can effectively reduce thermal generation within the system. Oppenheimer et al. [21] demonstrated that reducing the capacity of the main pump in a dual-pump system can decrease thermal load on the fuel pump and enhance the system’s thermal resilience. Despite the significant advancements achieved in understanding the thermal management characteristics of fuel systems, current research primarily focuses on the impact of heat load on fuel temperature, lacking a systematic analysis of the heat generation by various components within the fuel system. Furthermore, there exists a strong coupling effect between the fuel system and the engine’s main flow path system. Figure 1 illustrates a schematic of the external piping system of a typical engine with a low bypass ratio. The fuel system precisely supplies fuel to the main flow path system (combustor) through the fuel controller and distributor. Meanwhile, the main flow path system extracts a significant amount of power from the high-pressure shaft, which is transmitted via the accessory gearbox to drive the fuel pump. However, existing research often treats the fuel system as a relatively independent subsystem, failing to adequately consider its coupling effects with the engine’s main flow path system. The lack of integrated models that simultaneously evaluate transient heat transfer in both subsystems represents a critical gap. Therefore, establishing a comprehensive transient temperature evaluation model that takes into account both the fuel system and the main flow path system is crucial for revealing the impact of fuel system operation on the thermal management performance of the engine. This task has emerged as a significant objective in the current research.
Existing research on engine thermal management often suffers from a trade-off between model accuracy and computational efficiency, lacks a systematic thermal analysis of the fuel system, and fails to adequately consider the coupling effects among multiple subsystems. These limitations hinder accurate performance evaluation at the whole-engine level. Aiming at the key challenges of aero-engine thermal management, this study constructed a transient temperature evaluation model suitable for analysis of the entire flight envelope. This model not only effectively reveals the impact of heat transfer effects on engine performance but also provides an in-depth analysis of the thermal management performance of the aero-engine during flight. Firstly, a detailed two-dimensional discretization of the metal components was performed based on the finite volume method, establishing a multi-physical coupling heat transfer analysis framework that includes both the main flow path system and the fuel system. Innovative multi-stage component-level heat transfer correction methods and refined thermal analysis methods for high-temperature components were proposed. Next, focusing on a typical low-bypass-ratio turbofan engine, the study systematically revealed the dynamic influence mechanisms of heat transfer effects on engine performance parameters during transient processes, under both cold acceleration and hot deceleration conditions. Finally, a comprehensive analysis of the performance of the thermal management system during complete flight missions was conducted, revealing the limitations of the existing thermal management design and proposing targeted optimization strategies. Compared to existing studies, the novelty of this work lies in the following:
(1) A transient temperature evaluation model incorporating fluid–solid coupling heat transfer effects is established to more accurately simulate unsteady thermal behaviors.
(2) A novel multi-stage component heat transfer correction method is proposed to improve the fidelity of high-temperature component analysis.
(3) The dynamic influence mechanism of heat transfer on aero-engine acceleration and deceleration performance is systematically revealed under both cold and hot transient conditions.
(4) For a complete flight mission, comprehensive recommendations for improving engine thermal management are proposed from multiple perspectives, supporting design decisions at both the component and system levels.
The transient temperature evaluation model and engine thermal management analysis method developed in this study not only provide theoretical support and technical assistance for the design and optimization of aero-engine thermal management systems, but also lay a solid foundation for enhancing the overall performance and reliability of the engines, demonstrating significant engineering application value.

2. Methodology

2.1. The Heat Transfer Analysis Based on the Finite Volume Method

As a typical open thermodynamic system, the aero-engine achieves energy conversion through the thermodynamic processes of working fluid continuously flowing through components such as the compressor, combustion chamber, and turbine. When conducting energy analysis of the aero-engine, the control volume analysis method is typically employed [22], with the mass conservation equation and energy conservation equation for the working fluid inside the volume given as follows:
m ˙ in = m ˙ out + d m CV d t
m ˙ in h in * = m ˙ out h out * δ Q d t + d E CV d t + W ˙
where m ˙ in and m ˙ out represent the mass flow rates at the system’s inlet and outlet, respectively; h in * and h out * represent the specific enthalpy carried by the fluid at the system’s inlet and outlet, respectively; W ˙ represents the power exerted by the system. m CV and E CV are the mass and energy of the working fluid in the volume, respectively; Q is the amount of heat transfer between the working fluid and the metal in the control volume.
Traditional modeling typically assumed that the entire aero-engine operates as an adiabatic system ( δ Q / d t = 0 in Equation (2)). However, during transient operation of the aero-engine, due to the thermal inertia of the engine components (the metallic parts of the engine), there exists significant heat exchange between the working fluid and the engine components. This heat exchange impacts the working capacity of the fluid. Therefore, accurately describing the heat transfer between the working fluid and the engine components is crucial for developing a model that reflects the actual operational characteristics of the engine.
To accurately describe the heat transfer process between the working fluid and the metal components, it is necessary to establish the temperature field variation in the metal components based on the principle of energy conservation. This is an unsteady-state heat conduction without internal heat sources. The governing equation for heat conduction in the metal components is given by the following differential equation:
ρ EM c EM V EM d T EM d t = d Q d t
where the subscript EM denotes the metal components of the engine; ρ , c , and V represent the density, specific heat capacity, and volume of the engine components involved in heat exchange, respectively.
To discretize the engine body of the aero-engine, the finite volume method (FVM) is employed to spatially discretize the various components. When the control volume is situated in the middle of the metal component, heat transfer occurs between the control volume and the neighboring control volumes on the upper, lower, left, and right sides. According to the fundamental law of heat conduction, the heat flux density q due to conduction can be expressed as follows:
q = k d T d x
where k is the thermal conductivity of the material.
Substituting Equation (4) into Equation (3), and employing central differencing and implicit time discretization, the discretized form of the governing equation for the central control volume P can be expressed as shown [22]:
ρ EM c EM Δ x Δ y T P i + 1 T P i Δ t unsteady   term = k EM T E i + 1 T P i + 1 Δ x Δ y k EM T P i + 1 T W i + 1 Δ x Δ y conduction   term   +   k EM T N i + 1 T P i + 1 Δ y Δ x k EM T P i + 1 T S i + 1 Δ y Δ x conduction   term
where the superscripts i and i + 1 represent the time sequence; Δ t denotes the time step; subscripts P represents the control volume, and W, E, N, and S refer to the left, right, upper, and lower sides of the control volume, respectively. The mesh sizes of the control volume are denoted by Δ x and Δ y , which correspond to the dimensions of the control volume in the x and y directions, respectively.
At the boundary, the control volume not only undergoes heat conduction with neighboring control volumes but also experiences convective and radiative heat exchange with the working fluid. For the convective heat transfer between the working fluid and the metal wall, the heat flux density is calculated using Newton’s cooling law. The heat flux densities for convective heat transfer can be expressed as follows [23]:
q = h ( T w T f )
The radiative heat transfer between the gas and the metal wall is calculated according to the radiative heat exchange formula. In practice, the combustor surface exposed to the flame is not an ideal black body, and its effective absorptivity is less than 1. To account for this effect, a correction factor of ( ε w + 1 ) / 2 can be introduced to calculate the radiative heat flux density [23]. Therefore, the heat flux densities for radiative heat transfer can be expressed as follows:
q = ε w + 1 2 σ ε g T g 4 α g T w 4
where the subscripts g, f, and w represent the gas, fluid, and solid wall, respectively; ε is the emissivity; α is the absorptivity; and σ is the Stefan–Boltzmann constant. h is the convective heat transfer coefficient between the working fluid and the engine components.
When discretizing the radiation term of the boundary control volume, the control volume center temperature is used instead of the boundary wall temperature to simplify the computation. Combining Equations (5)–(7), the discretized form of the control equation for the boundary control volume P can be expressed as follows:
ρ EC c EC Δ x Δ y T P i + 1 T P i Δ t unsteady   term = k E C T E i + 1 T P i + 1 Δ x Δ y k EC T P i + 1 T W i + 1 Δ x Δ y + k EC T N i + 1 T P i + 1 Δ y Δ x conduction   term + T ref i + 1 T P i + 1 1 / 2 k EC Δ y + 1 / h Δ x convention   term + ε w + 1 2 σ ε g T g i + 1 4 α g T P i + 1 4 Δ x radiation   term
where T ref is the reference temperature of the working fluid.
For the low-temperature components of the engine (e.g., fan, compressor, outer bypass duct, mixing chamber, and nozzle), only the convection term and conduction term are considered, and the radiation effect can be neglected [24]. Therefore, the radiation term in Equation (8) is set to zero. For high-temperature components such as the combustion and turbine, the combined effects of radiation, convection, and conduction must be considered. These high-temperature components are typically protected using film cooling, and the reference temperature for film cooling can be calculated using the following equation [8]:
T ref = T g + η ( T c T g )
where T c is the temperature of the cooling air, and η is the film cooling efficiency.
By obtaining the temperature T P i + 1 of the boundary nodes of the engine components through Equation (8), the heat transfer between the control volume and the working fluid at time Δ t can be calculated as follows:
Δ Q = T ref i + 1 T P i + 1 1 / ( 2 k Δ y ) + 1 / h Δ x Δ t + ε w + 1 2 σ ε g T g i + 1 4 α g T P i + 1 4 Δ x Δ t

2.2. Thermal Analysis of Multi-Stage Components

The off-design performance parameters of multi-stage components in aero-engines (such as axial-flow compressors and turbines) are typically derived from their respective characteristic maps. However, in the transient process, the heat transfer effect will have a second-order effect on these characteristic maps [25]. This is because the heat transfer between the working fluid and the engine components will change the gas temperature flowing through the components, which in turn affects the matching relationship between the stages. Additionally, due to the large temperature differences between the inlet and outlet of multi-stage components, the heat transfer rates at different positions vary significantly. Therefore, it is inaccurate to calculate the heat transfer process solely based on inlet or outlet parameters. When conducting thermal analysis of multi-stage components, it is essential to accurately describe the heat transfer processes between the stages, including heat exchange between the main air/gas and the blade, casing, and rotor, as well as the heat exchange between secondary air and the rotor (it should be noted that the secondary air system in this study is only used as a boundary condition for calculating heat transfer, and its internal transient effect is not considered). The outlet parameters of each stage should be corrected by heat transfer to ensure more accurate thermodynamic analysis of the aero-engine, as shown in Figure 2.
In this paper, the modeling principle of equal polytropic efficiency and equal stage work is used to model the multi-stage components. Figure 3 presents the thermal analysis process for the axial-flow compressor. First, the adiabatic model is used to calculate the outlet parameters at each stage of the compressor. Subsequently, according to the heat transfer modeling method based on the finite volume method described in Section 2.1, the heat transfer of each stage is calculated, and the heat transfer correction is performed on the outlet parameters of each stage. Finally, the compressor outlet correction parameters considering the heat transfer effect are obtained.
When establishing the heat transfer model of the compressor, appropriate simplification methods are adopted to address the complexity of its multi-stage structure. As the mainstream air flows over the inner surface of the compressor casing and the outer surface of the rotor, this process is equivalently modeled as airflow through an annular channel, with heat transfer calculations performed using the forced convection heat transfer model for internal duct flow [26]. For the compressor rotor, where secondary air flows, the inner surface and both sides of the rotor are in contact with the secondary air and are also affected by disk rotation. Therefore, the forced convection heat transfer model for rotating disks is employed to describe the heat transfer characteristics of this section [12]. Additionally, the heat transfer characteristics of the compressor blades are calculated using the corresponding blade heat transfer formulas to ensure accuracy. The specific calculation formulas and detailed descriptions can be found in Appendix A.

2.3. Thermal Analysis of High-Temperature Components

High-temperature components in aero-engines, primarily referring to the combustor and high-pressure turbine, generally operate in a high-temperature gas environment. Effective thermal protection for high-temperature components is crucial to ensure the reliable operation of the engine. The main measures for thermal protection of high-temperature components include the use of cooling air for cooling and the adoption of heat-resistant materials for thermal insulation. Figure 4 illustrates the thermal analysis of the combustor. The flame tube is divided into the primary zone, intermediate zone, and dilution zone along its axial direction [23]. The air enters through the inlet hole on the flame tube according to the predetermined requirements to ensure that the combustor can achieve efficient and stable combustion under different working conditions. The right side of Figure 4 is the heat transfer diagram of the flame tube wall. The heat transfer mode of the inner wall of the flame tube includes the radiation of high-temperature gas and the convective heat transfer with the cooling air. The outer wall of the flame tube exchanges heat with the cooling air flow through convective heat transfer, and exchanges heat with the casing of the combustor through radiation. When conducting thermal analysis of the combustor, all the heat transfer must be comprehensively considered.
The cooling air distribution ratios for different regions of the flame tube are shown in Figure 4. The outer casing of the combustor is simplified as an annular channel, with its heat transfer characteristics calculated using the forced convection heat transfer model for internal duct flow. The flame tube is simplified as a circular channel, where the convective heat transfer between its inner surface and the high-temperature gas, as well as between its outer surface and the surrounding cooling air, is computed using empirical correlations. The specific calculation formulas are detailed in Appendix A. Additionally, to accurately evaluate the radiative heat transfer from the high-temperature gas to the flame tube wall, the improved weighted sum of gray gases (WSGG) model is employed. This model is suitable for compressible gases and temperature-varying media and can accurately describe the radiative characteristics of the gas. Further details of this modeling method can be found in previous research conducted by the research group [27].
Figure 5 shows the schematic of thermal analysis for the high-pressure turbine. To mitigate the strong convective and radiative heat loads generated by the high-temperature gas, the high-pressure turbine adopts film cooling technology as its primary thermal protection method. The cooling air enters the main flow path through film holes located on the turbine casing, forming a protective air film on the exterior surface of the casing. This film effectively isolates the turbine from the thermal hazards of high-temperature gas to the turbine. In addition, the turbine blade not only relies on external film cooling, but also further reduces the temperature through the forced convection heat transfer between the internal cooling air and the blade. The heat absorbed by the blade surface will be transmitted to the turbine rotor along the radius direction. This heat is dissipated by forced convection through cooling air distributed on both sides of the rotor, ensuring the thermal safety of the rotor. The convective heat transfer calculation formulas for both the inside and outer surfaces of the turbine blades, as well as for both sides of the turbine rotor, are also listed in Appendix A.

3. Model and Verification

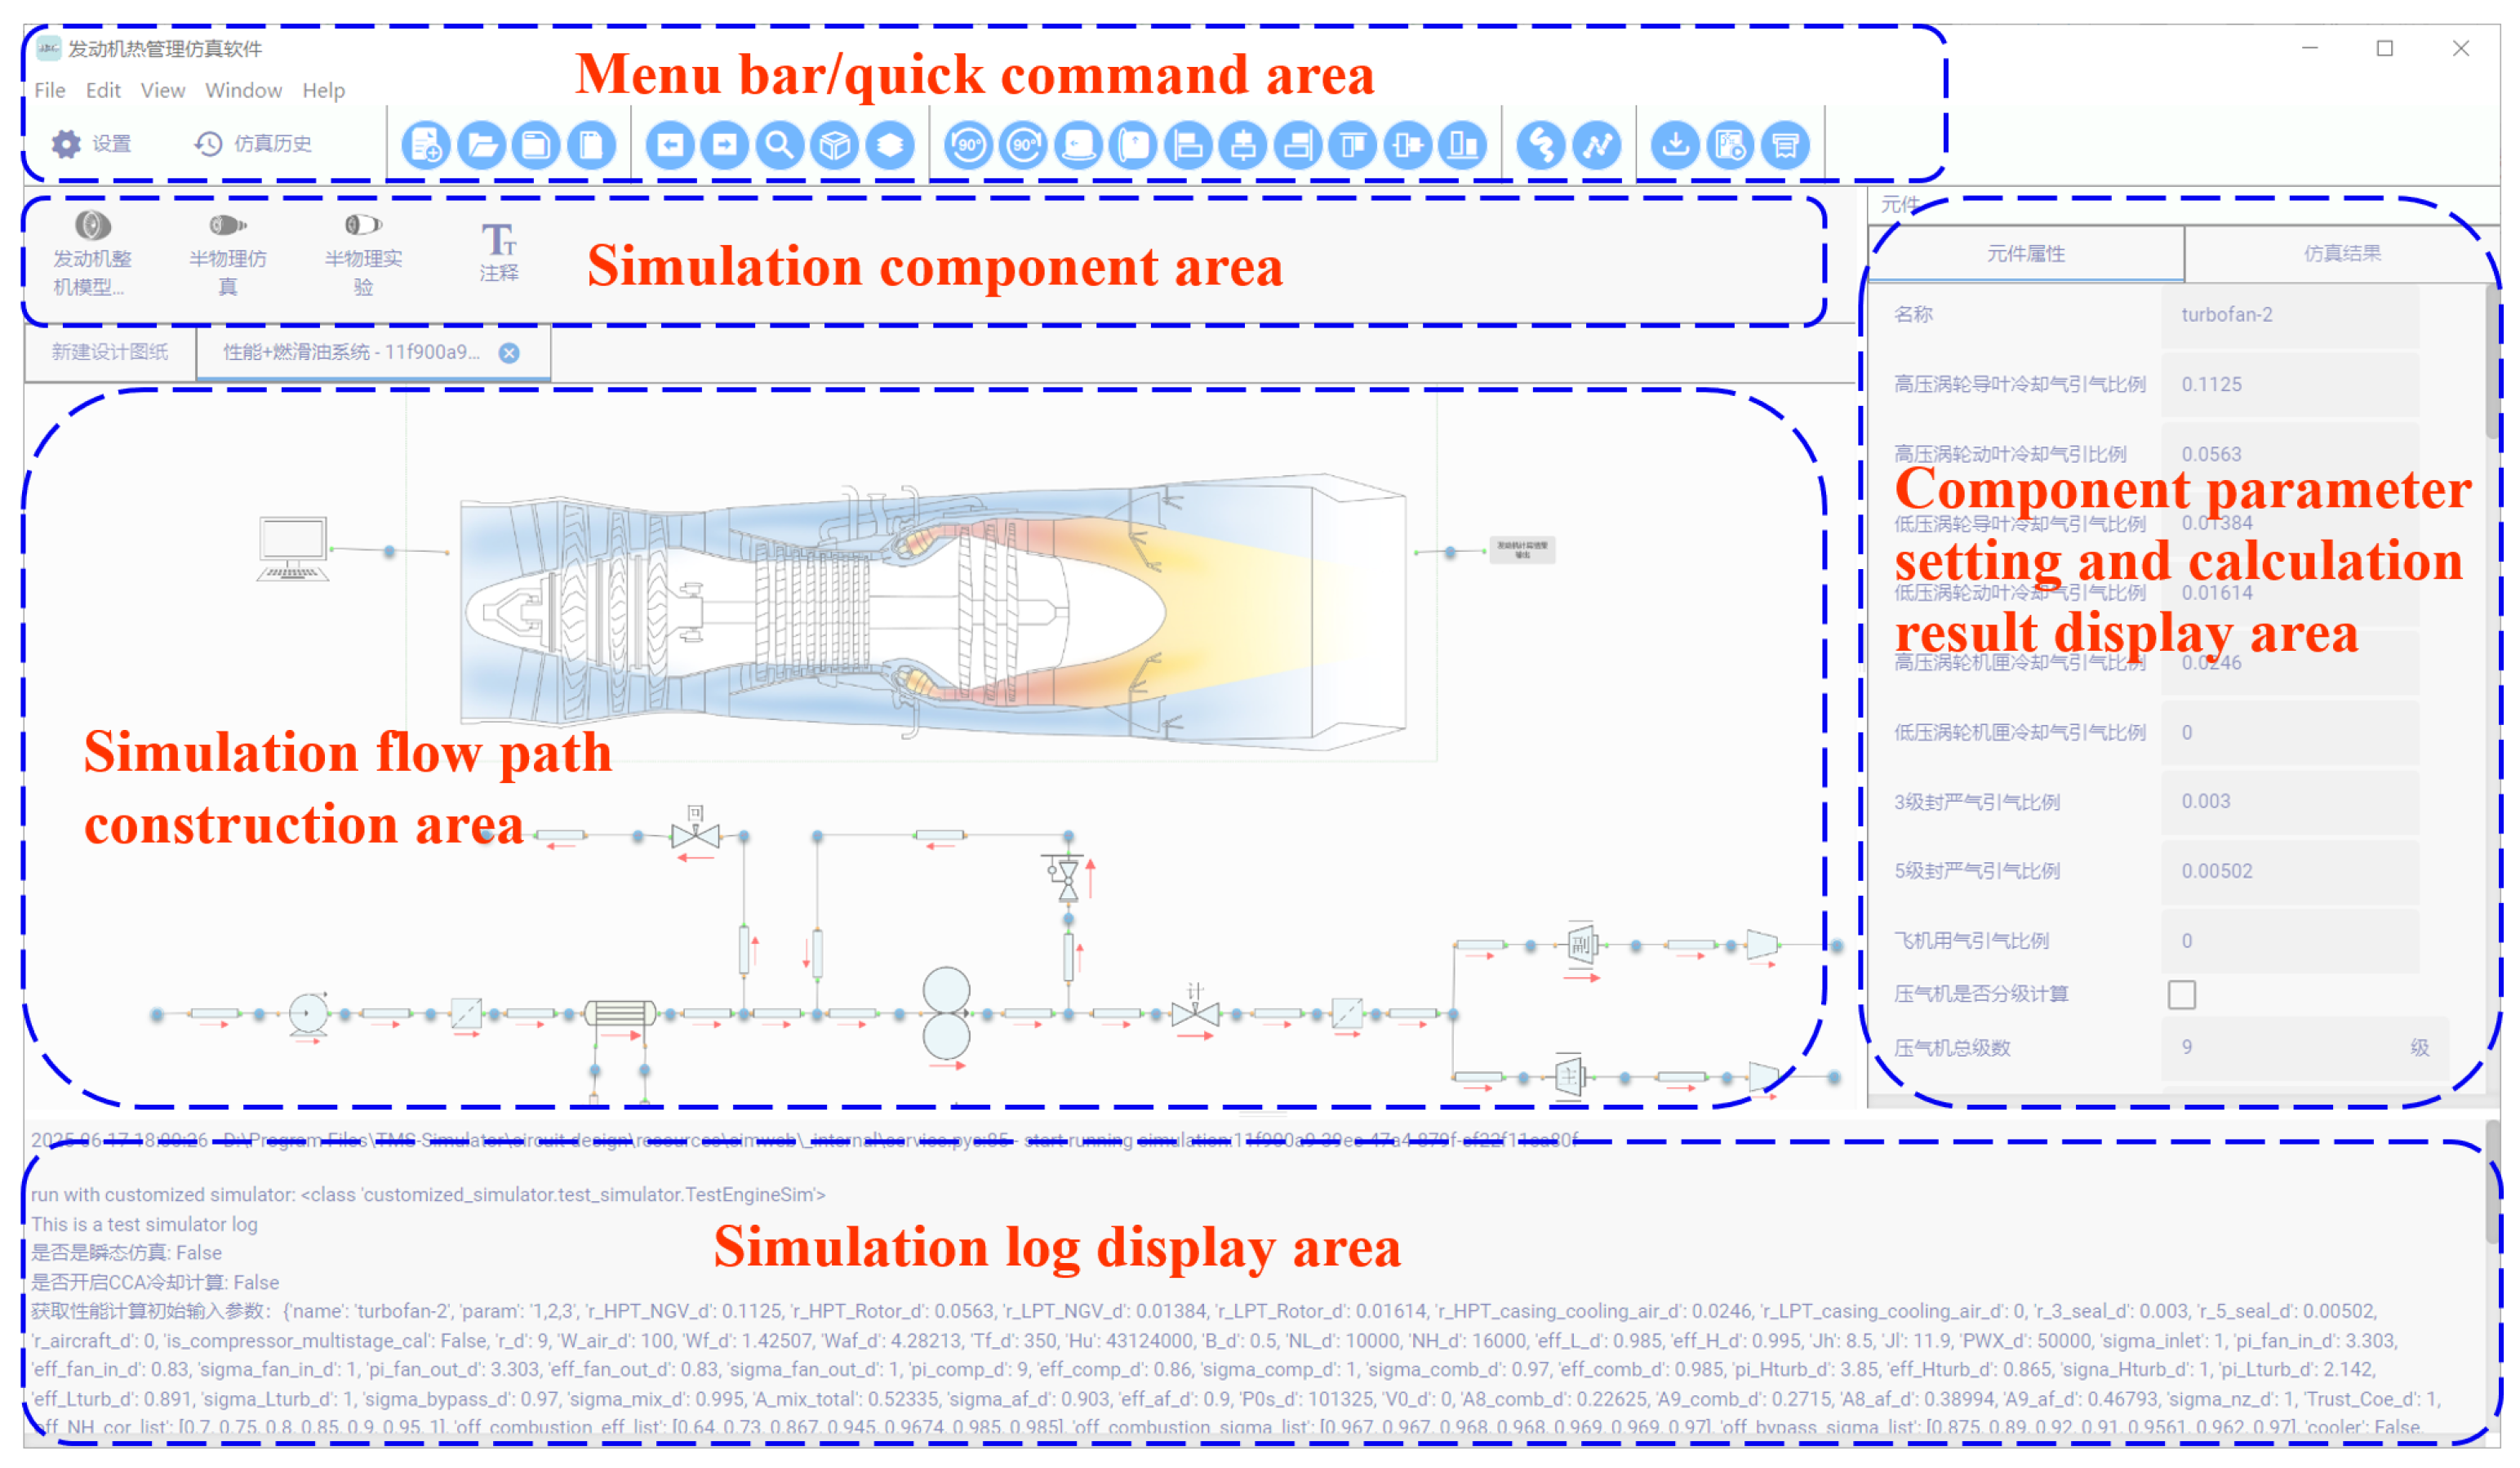
3.1. Model Description

The comprehensive heat transfer calculation model developed in this study for an aero-engine includes the performance model of the low-bypass-ratio turbofan engine and the advanced fuel thermal management system, as shown in Figure 6. The engine performance model includes several key components along the airflow path, including inlet, fan, compressor, combustor, high-pressure turbine (HPT), low-pressure turbine (LPT), bypass, mixer, afterburner, and exhaust nozzle. The interaction of these components affects the overall performance of the engine. It should be noted that in this study, the afterburner calculation is not considered, and the fuel system only provides fuel for the main combustor. The key design-point performance parameters for the engine performance model utilized in this study, under standard sea-level static ISA conditions, are presented in Table 1.
The power that drives the operation of the fuel thermal management system is extracted from the high-pressure shaft of the engine and transmitted to the fuel system after being decelerated by the gearbox. The fuel stored in the fuel tank is first filtered by a coarse filter to remove impurities. After being pressurized by the booster pump, it passes through the airborne heater and the engine heater in turn. The fuel absorbs the thermal load of the aircraft system and the engine lubrication system, respectively. The heated fuel is further pressurized by a gear pump and enters the fuel metering device. In the process of fuel metering, the fuel mass flow into the combustor is accurately controlled by adjusting the aperture of the differential pressure valve. A fuel return valve is employed to regulate the fuel temperature. If there is a risk of fuel overheating, the fuel return valve opens wider to allow more cool fuel from the aircraft to flow into the fuel system, thereby reducing the fuel temperature to an appropriate level. Additionally, during its return to the fuel tank, the fuel is cooled by a ram air cooler.
Based on the modeling methods described in Section 2, this study separately constructs heat transfer models for both the main flow path system and the fuel system. The main flow path system encompasses the fan, compressor, combustor, HPT, LPT, bypass, mixer, and afterburner, systematically simulating the heat transfer characteristics of each component. The fuel system includes the booster pump, high-pressure pump, filter, airborne heater, engine heater, ram air cooler, and associated valves, comprehensively considering the heat transfer process as the fuel flows through these components. Additionally, the connecting lines between fuel system components in Figure 6 represent tube components, which are also incorporated into the model to ensure the completeness and accuracy of the heat transfer calculations. In this paper, the engine structure parameters related to the heat transfer calculation refer to that of the F110 engine.
The small-bypass-ratio turbofan engine used in this paper adopts the structure with a one-stage HPT and a two-stage LPT. Figure 7 illustrates the distribution of cooling air for the turbines and the bleed air ratio (the proportion of bleed air to the compressor inlet flow). There are film cooling holes on the surface of the stator and rotor blades of the HPT. The cooling of the stator blades is achieved by utilizing air extracted from both the internal and external rings of the combustor. The cooling of the rotor blades only depends on the air extracted from the internal ring of the combustor. This cooling air enters the rotor blades through a pre-rotation system, which is not only used to cool the rotor blade, but also plays a sealing role. The LPT employs a solid blade design, with air from the intermediate stages of the compressor split into two parts: one portion is used to purge the high- and low-pressure turbine casings to control the tip clearance, while the other portion enters the low-pressure rotating cavity through ventilation holes in the stator blades of the LPT, primarily used for sealing and cooling the rotating cavity.
The model presented in this study was developed using a self-developed aero-engine thermal management simulation software V1.0 led by Nanjing University of Aeronautics and Astronautics. The software integrates component-level and system-level modeling capabilities, and its user interface is illustrated in Figure 8.

3.2. Accuracy Verification

In this paper, the heat transfer model was improved by heat transfer correction based on the ideal model. The ideal engine performance model and fuel system calculation model were validated in earlier research, with the specific modeling and validation processes detailed in reference [28,29]. In order to further verify the accuracy of the heat transfer model, this paper adopted the verification method of component experiment. Considering that the volume of the gear pump is large and its heat capacity has a significant effect on the fluid temperature, the gear pump was selected as the verification object. A schematic diagram of working principle is illustrated in Figure 9a. In this experiment, the method of step change in working fluid temperature was adopted. The working fluid of 40 °C in the cold tank first flowed through the gear pump. Once the inlet and outlet temperatures of the gear pump stabilized, the system swiftly switched to the hot tank using a change-over valve. By alternating the working fluid between the hot and cold tanks, the inlet temperature of the gear pump was elevated from 40 °C to 70 °C. During this process, real-time monitoring of the average temperatures of the gear pump body was conducted to evaluate the matching degree between the model predictions and the experimental data.
The comparison between simulation and experiment is presented in Figure 9b. The results indicate that the predicted average temperature of the gear pump is in good agreement with the actual measured value. The maximum error occurred during the switching of the cold and hot working fluids, with a maximum relative error of 2.6%. The average error throughout the simulation process was 1.07%. These errors are all within acceptable range, which verifies that the established heat transfer model performs well in terms of accuracy and reliability.
To further validate the accuracy of the proposed temperature evaluation model in predicting the thermal state of high-temperature components, a comparative study was conducted using the work of Young et al. [30] on high-pressure turbine blade temperature prediction. The simulation was performed under identical parameter settings as those reported in the reference study, with detailed conditions and results summarized in Table 2. Based on the proposed model, the calculated average temperature of the high-pressure turbine stator blade was 1070.6 K, compared to 1045.5 K reported in the literature, yielding a relative error of 2.4%. The results demonstrate that the proposed model achieves sufficient accuracy for engineering applications and can be effectively employed for thermal state evaluation of high-temperature components.

4. Results and Discussions

4.1. The Impact of Heat Transfer

To investigate the impact of heat transfer on engine performance during rapid-state transitions, this paper established two transient conditions: cold-state acceleration and hot-state deceleration. The process occurs in the ground state (H = 0, Ma = 0), and the initial temperature of the engine metal components and the working fluid is 288 K. The acceleration and deceleration of the engine are controlled by a predefined fuel control schedule, as shown in Figure 10a. The simulation begins from a ground idle state. After 5 s, the high-pressure shaft speed rapidly increases from 70% to 100% within 4 s (cold-state acceleration). The engine then maintains this maximum regime until 1000 s, allowing the metal components to reach a stable temperature. From 1000 s to 1004 s, the engine rapidly decelerates from the maximum state to the idle state (hot-state deceleration), and remains in the idle state until the simulation concludes.

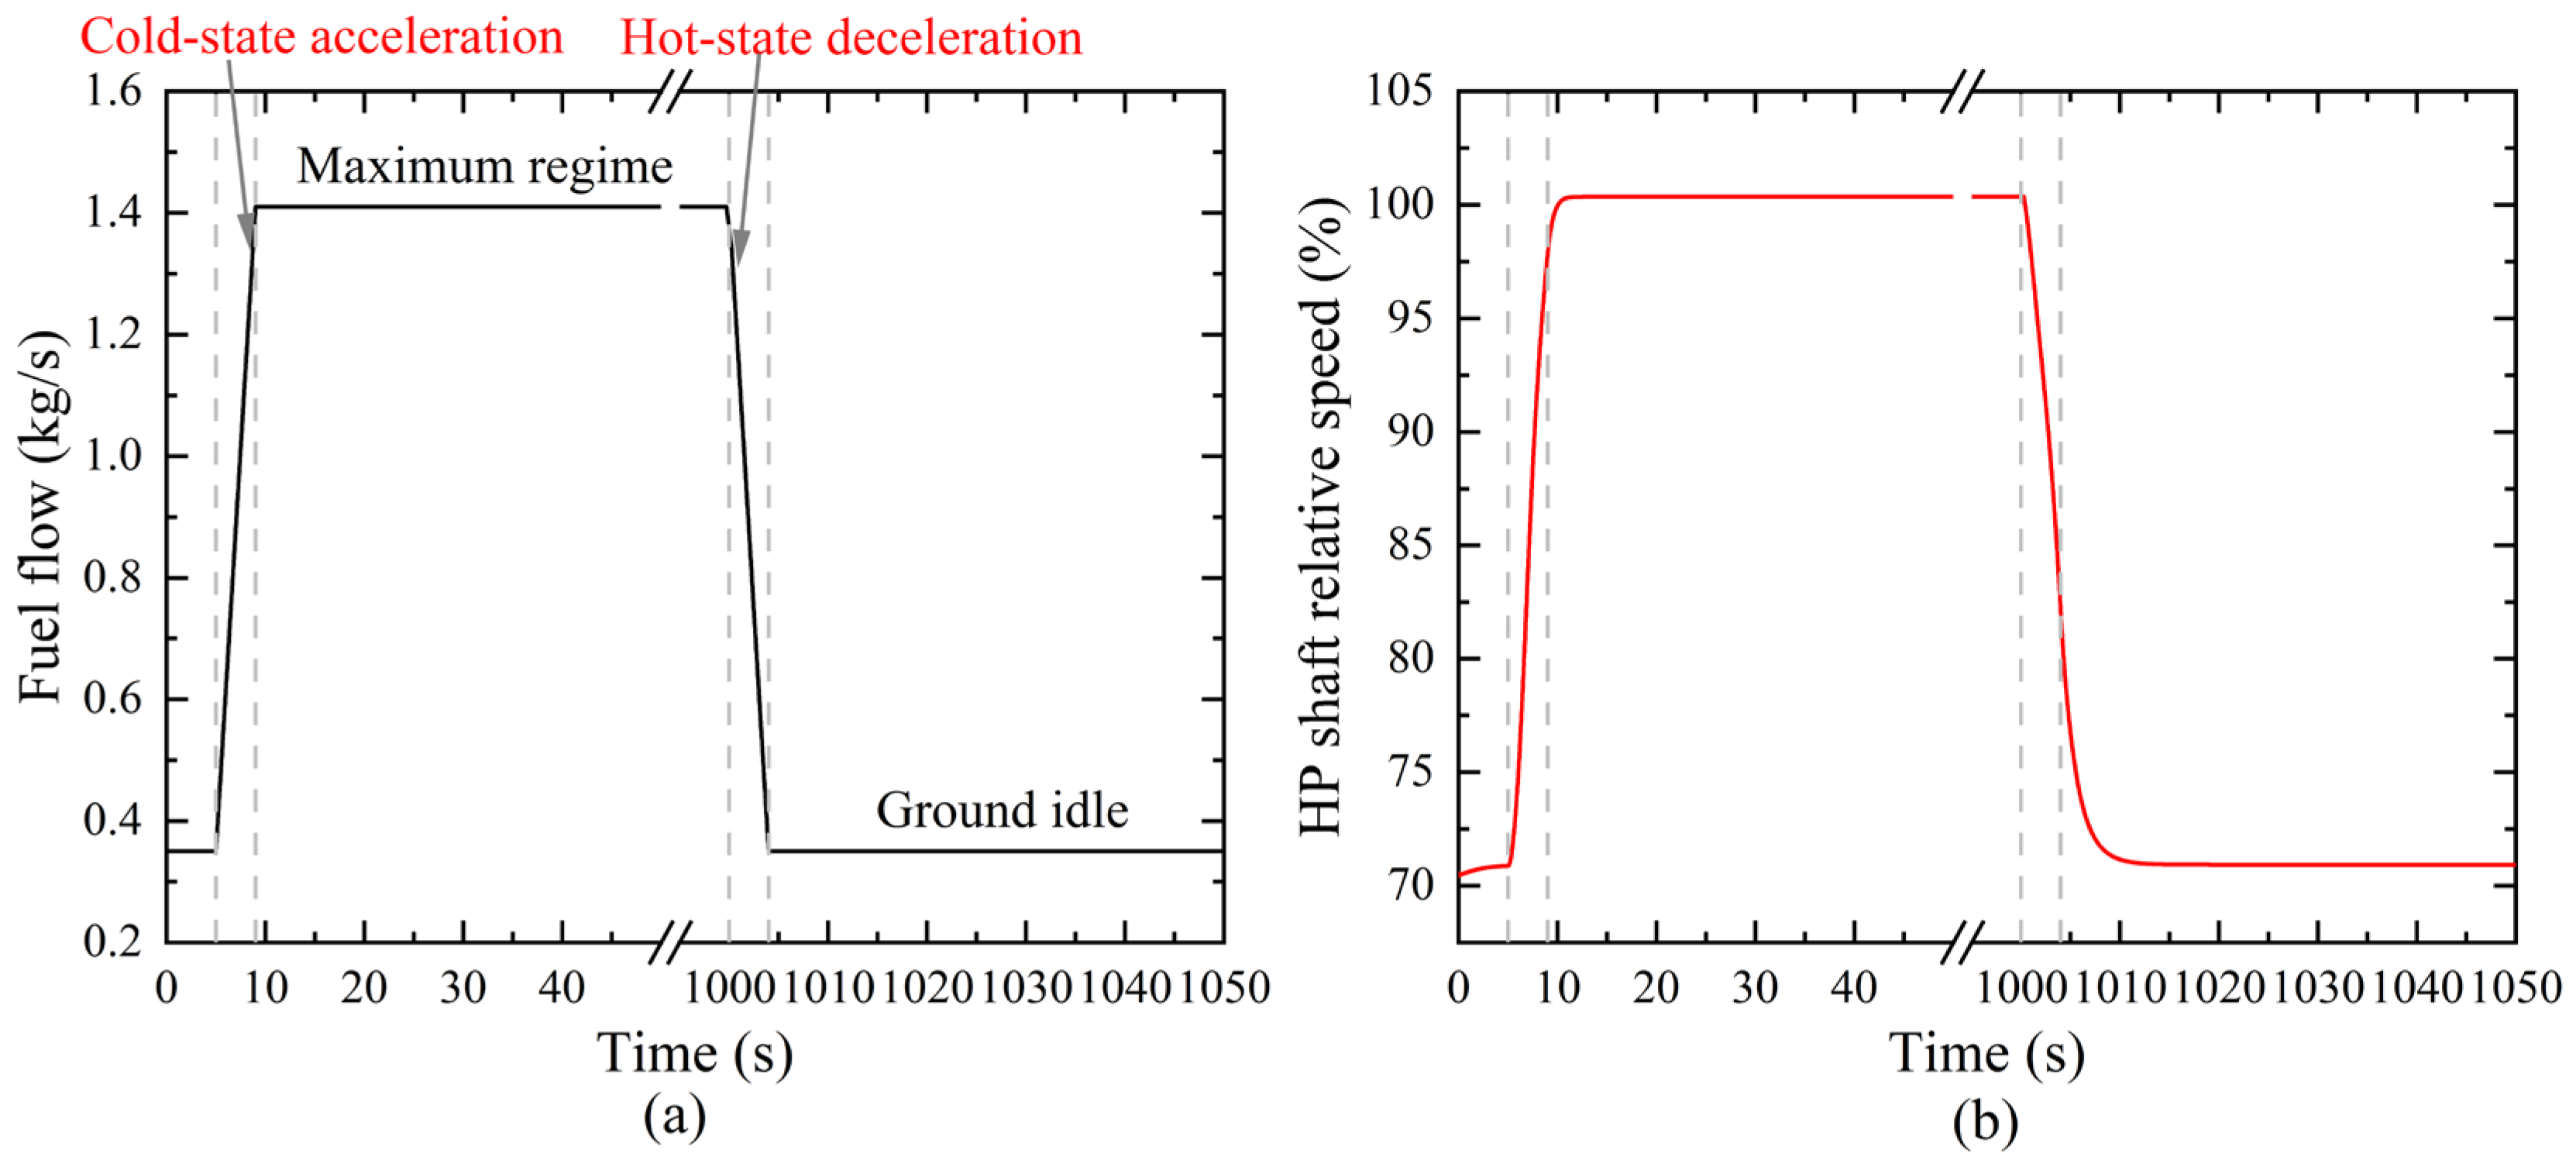
4.1.1. Cold-State Acceleration

Figure 11 illustrates the heat transfer power of various components and the proportion of total heat transfer power relative to the total energy input into the combustion chamber for the aero-engine cold-state acceleration considering the heat transfer effects. Among the components in the mainstream path of the aero-engine, the heat transfer power of the high-temperature components is the highest. Specifically, the maximum heat transfer power of the high-pressure and low-pressure turbines during the cold-state acceleration process reaches 600 kW, while the heat transfer power of the combustion chamber is 480 kW. This indicates that these components play a dominant role in the absorption and transfer of heat during the cold-state acceleration process. The total heat transfer power achieves its maximum value at the end of the acceleration process, exceeding 2600 kW, highlighting the significant impact of heat transfer effects on the transient performance of the engine.
Figure 11b shows the proportion of total heat transfer power relative to the total energy input into the combustion chamber. The results indicate that, during the early stage of the simulation, when the engine is in the cold state, the proportion of total heat transfer power is at its highest, exceeding 6%. As the acceleration process progresses, this proportion decreases to approximately 4.5% (at 9 s) by the end of the acceleration. This indicates that during the initial operation of the engine, a significant amount of energy is absorbed by the metal components. The transfer and absorption of energy are particularly pronounced in the high-temperature components.
Figure 12 compares the changes of net thrust, specific fuel consumption (SFC), relative speed of the high-pressure shaft and turbine inlet temperature between the model considering heat transfer effect and the conventional adiabatic model during cold-state acceleration. As shown in Figure 12a, during the cold-state acceleration, the engine considering heat transfer effects exhibits a significant reduction in work capacity compared to the conventional adiabatic model. The net thrust of the heat transfer model is consistently lower than that of the conventional model, with the maximum decrease in net thrust occurring at the end of the acceleration process, reaching a reduction of 1.42 kN. The specific fuel consumption (SFC) of the heat transfer model is higher than the conventional model, indicating that the engine exhibits higher fuel consumption, with a maximum increase of 1.18 g/(kN·s), as shown in Figure 12b. Furthermore, the change in work capacity caused by the heat transfer effects also impacts the high-pressure shaft, with the relative speed under the heat transfer model lower than that of the conventional model throughout the cold-state acceleration process. Figure 12d presents the variation in turbine inlet temperature. After considering the heat transfer, the engine absorbs a significant amount of heat, leading to a noticeable decrease in turbine inlet temperature under the same fuel supply rate, with a maximum reduction of 15.4 K. These results demonstrate that the heat transfer effects significantly influence engine performance during the cold-state acceleration, particularly in terms of the loss of engine work capacity and the reduction in fuel economy.
During the cold-state acceleration process, the heat transfer effects impact the fuel supply temperature and power extraction in the fuel system, as shown in Figure 13. As illustrated in the nozzle outlet temperature comparison in Figure 13a, the fuel supply temperature in the fuel system with heat transfer is lower than that in the conventional adiabatic model, which is consistent with the process of metal components absorbing heat from the fuel. Figure 13b shows the impact of heat transfer on the power extraction of the fuel system. During the ground idle and acceleration phases of the cold-state acceleration process, the power extraction in the heat transfer model is lower than that in the conventional model. However, at the maximum regime, the power extraction in the heat transfer model is higher than in the conventional model. This is primarily because the high-pressure pump in the fuel system is the main power-consuming component, with its average power consumption accounting for 96.11% of the total, as shown in Figure 13c. As the temperature of the fuel flowing through the high-pressure pump increases, the power consumption decreases. The explanation is as follows:
The high-pressure pump is a volumetric pump, and the increase in temperature leads to an increase in internal leakage, which reduces the mass flow rate through the pump, as shown in Figure 13d. According to the pump power calculation equation ( W p u m p = Δ p p u m p V ˙ p u m p / η p u m p , Δ p is the pressure rise across the pump; V ˙ is the volumetric flow rate; η is the pump efficiency), the decrease in mass flow rate directly leads to a reduction in the power extraction of the pump.

4.1.2. Hot-State Deceleration

Figure 14 illustrates the variation in heat transfer power in an aero-engine considering heat transfer during the hot-state deceleration process. During the hot-state deceleration, since the working fluid temperature is lower than the temperature of the metal components, the metal components release heat to the mainstream working fluid. Overall, the heat transfer power during the hot-state deceleration phase is much lower than during the cold-start acceleration phase, as shown in Figure 14a. The maximum heat power released by the metal components to the mainstream working fluid is 822.2 kW, which is significantly lower than the maximum heat transfer power observed during the cold-state acceleration phase. Similar to the cold-state acceleration process, the heat release power of the high-temperature components is higher than that of other components during the hot-state deceleration phase.
Figure 14b shows the proportion of total heat transfer power relative to the total fuel energy input to the combustor. During the thermal deceleration process, the heat released by the metal components to the mainstream working fluid reaches a maximum proportion of 6.83%. The influence of this heat transfer effect on engine performance and energy distribution remains significant during the hot-state deceleration phase. This result further underscores the importance of considering heat transfer effects for accurate engine performance prediction and optimization of energy management, particularly in transient response processes under different operating conditions.
Figure 15 compares the engine performance variations between the model considering heat transfer effects and the conventional adiabatic model. During the hot-state deceleration process, the metal components release heat to the working fluid, thereby enhancing the working ability of the working fluid. When considering heat transfer, the net thrust and high-pressure shaft speed are both superior to those of the conventional model. At 1004.72 s, the net thrust of the heat transfer model increases by 0.4 kN compared to the conventional model. The SFC of the heat transfer model is lower than that of the conventional model, with the maximum reduction in SFC exceeding 0.7 g/(kN·s), indicating that heat transfer can improve fuel economy during the hot-state deceleration phase. However, compared to the conventional model, the turbine inlet temperature is higher in the heat transfer model, suggesting that while heat transfer helps to improve the working ability, it also increases the thermal load on the turbine.

4.2. Heat Transfer Analysis Under Full Flight Mission

This section conducts a heat transfer analysis of the aero-engine based on a complete flight mission. In this flight mission, the control parameters for the flight were first determined. Figure 16a presents detailed flight data from the mission, including flight altitude, Mach number, and power-lever angle (PLA). Specifically, a PLA of 10° represents the engine operating in idle mode, while a PLA of 65° indicates the engine operating at maximum thrust. Figure 16b shows the position of this flight mission within the flight envelope, further illustrating the operating conditions of the engine under different flight states. In this flight mission, the heating power of the airborne heater and the cooling power of the ram air cooler in the fuel system were set as boundary conditions, as shown in Figure 17. The heating power of the engine heater (the lubrication heating power) is related to the engine speed, and was specified through an empirical relationship. The initial temperatures of both the engine body and the working fluid are set to 288 K. The fuel mass in the fuel tank is 3600 kg.

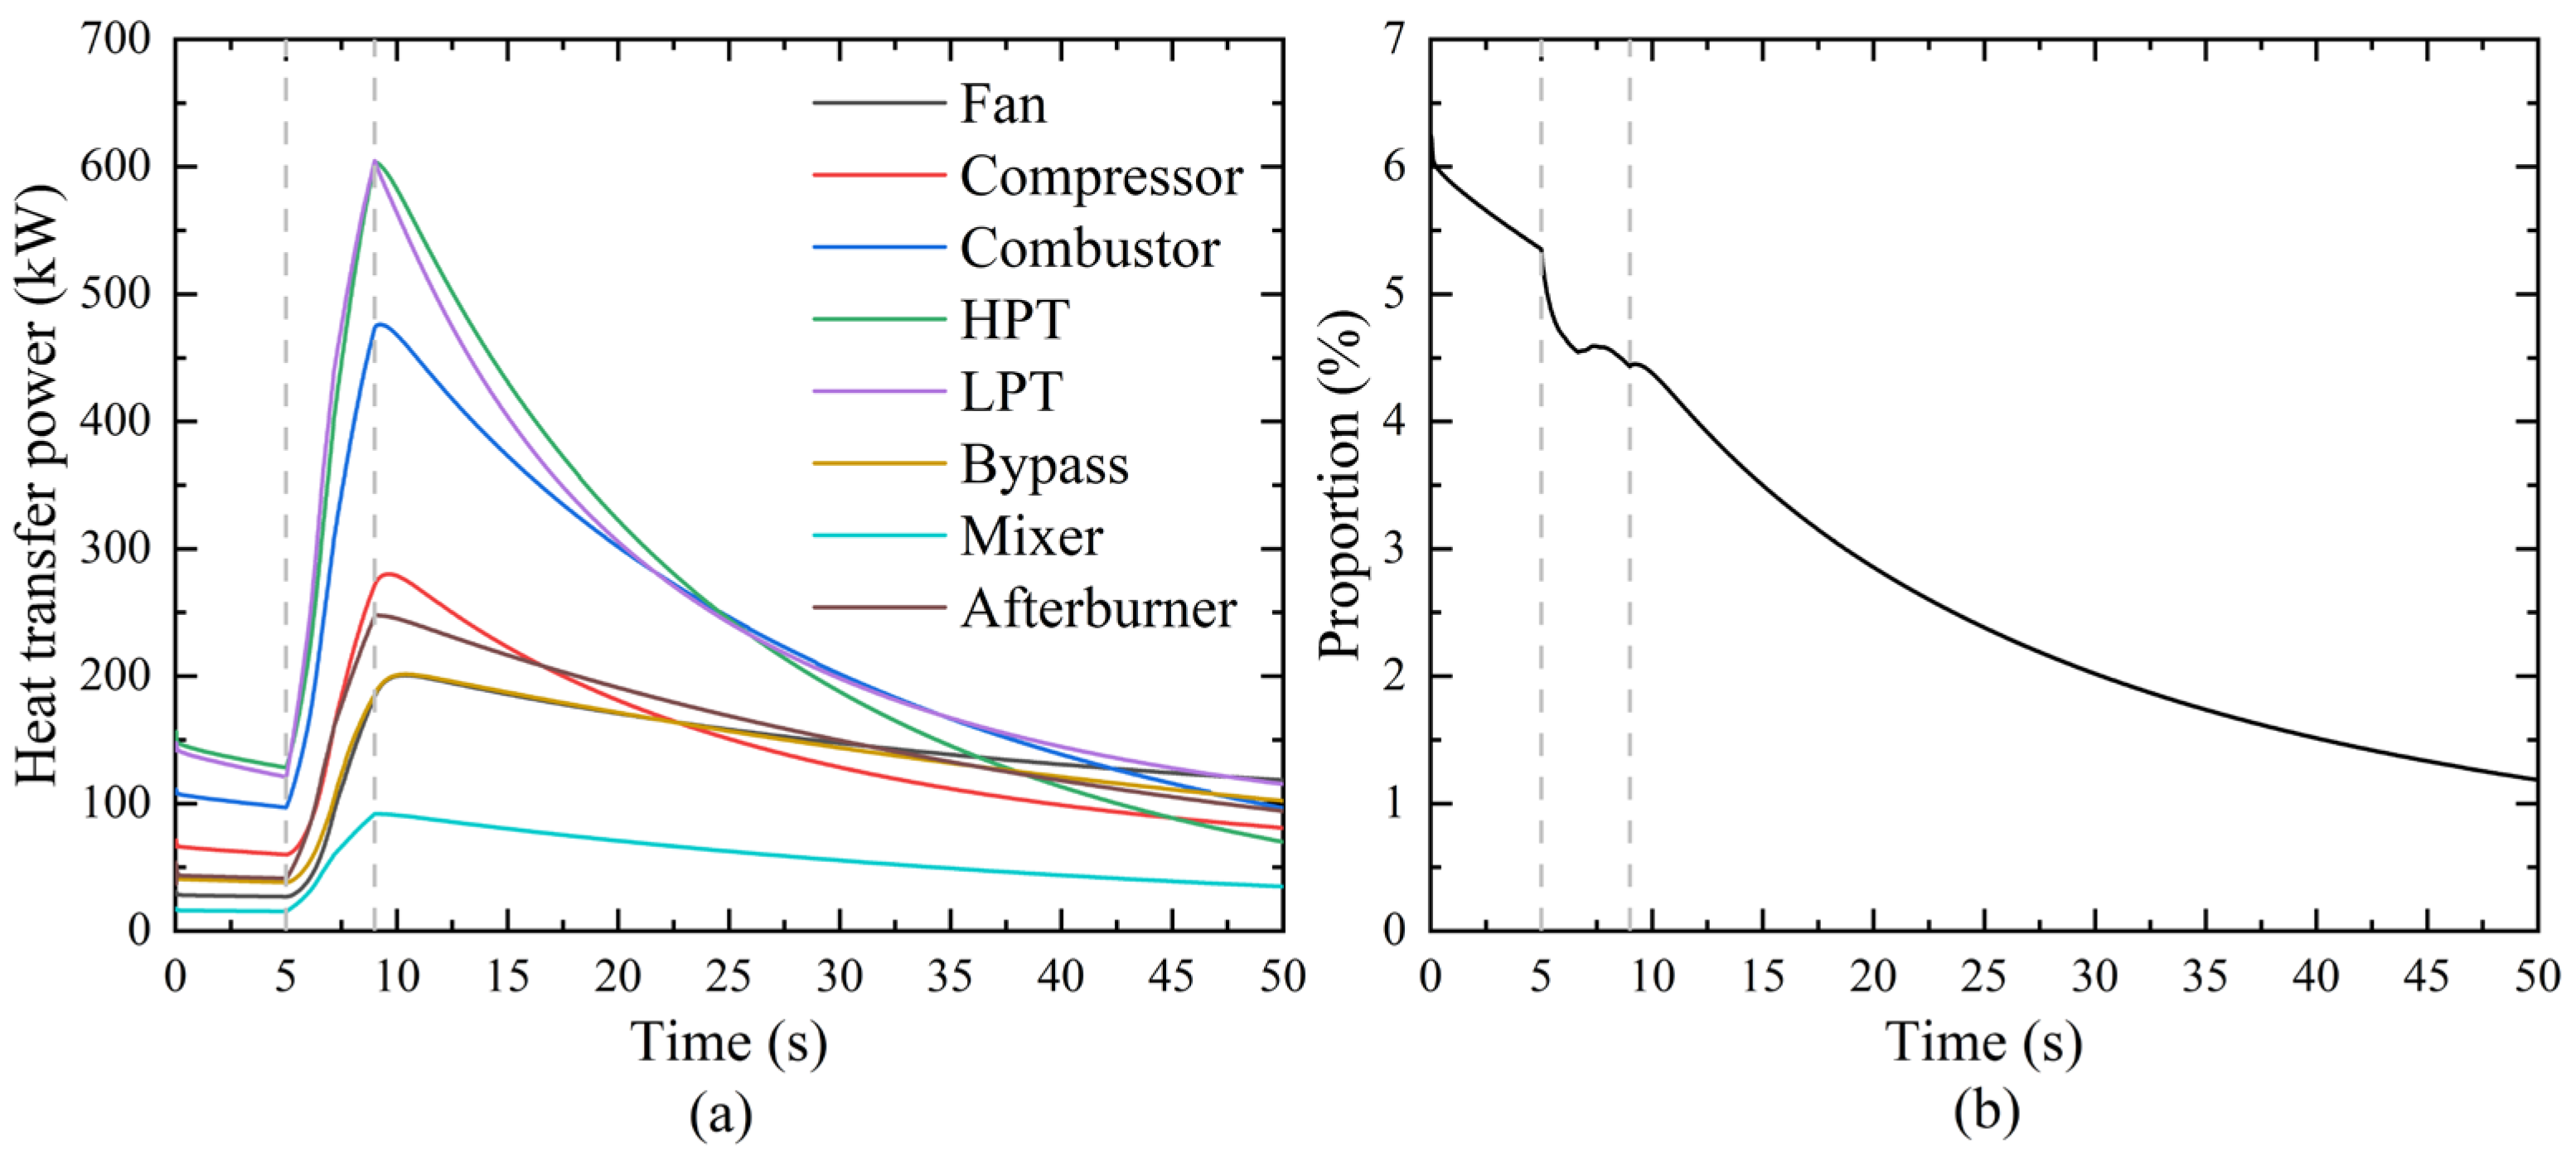
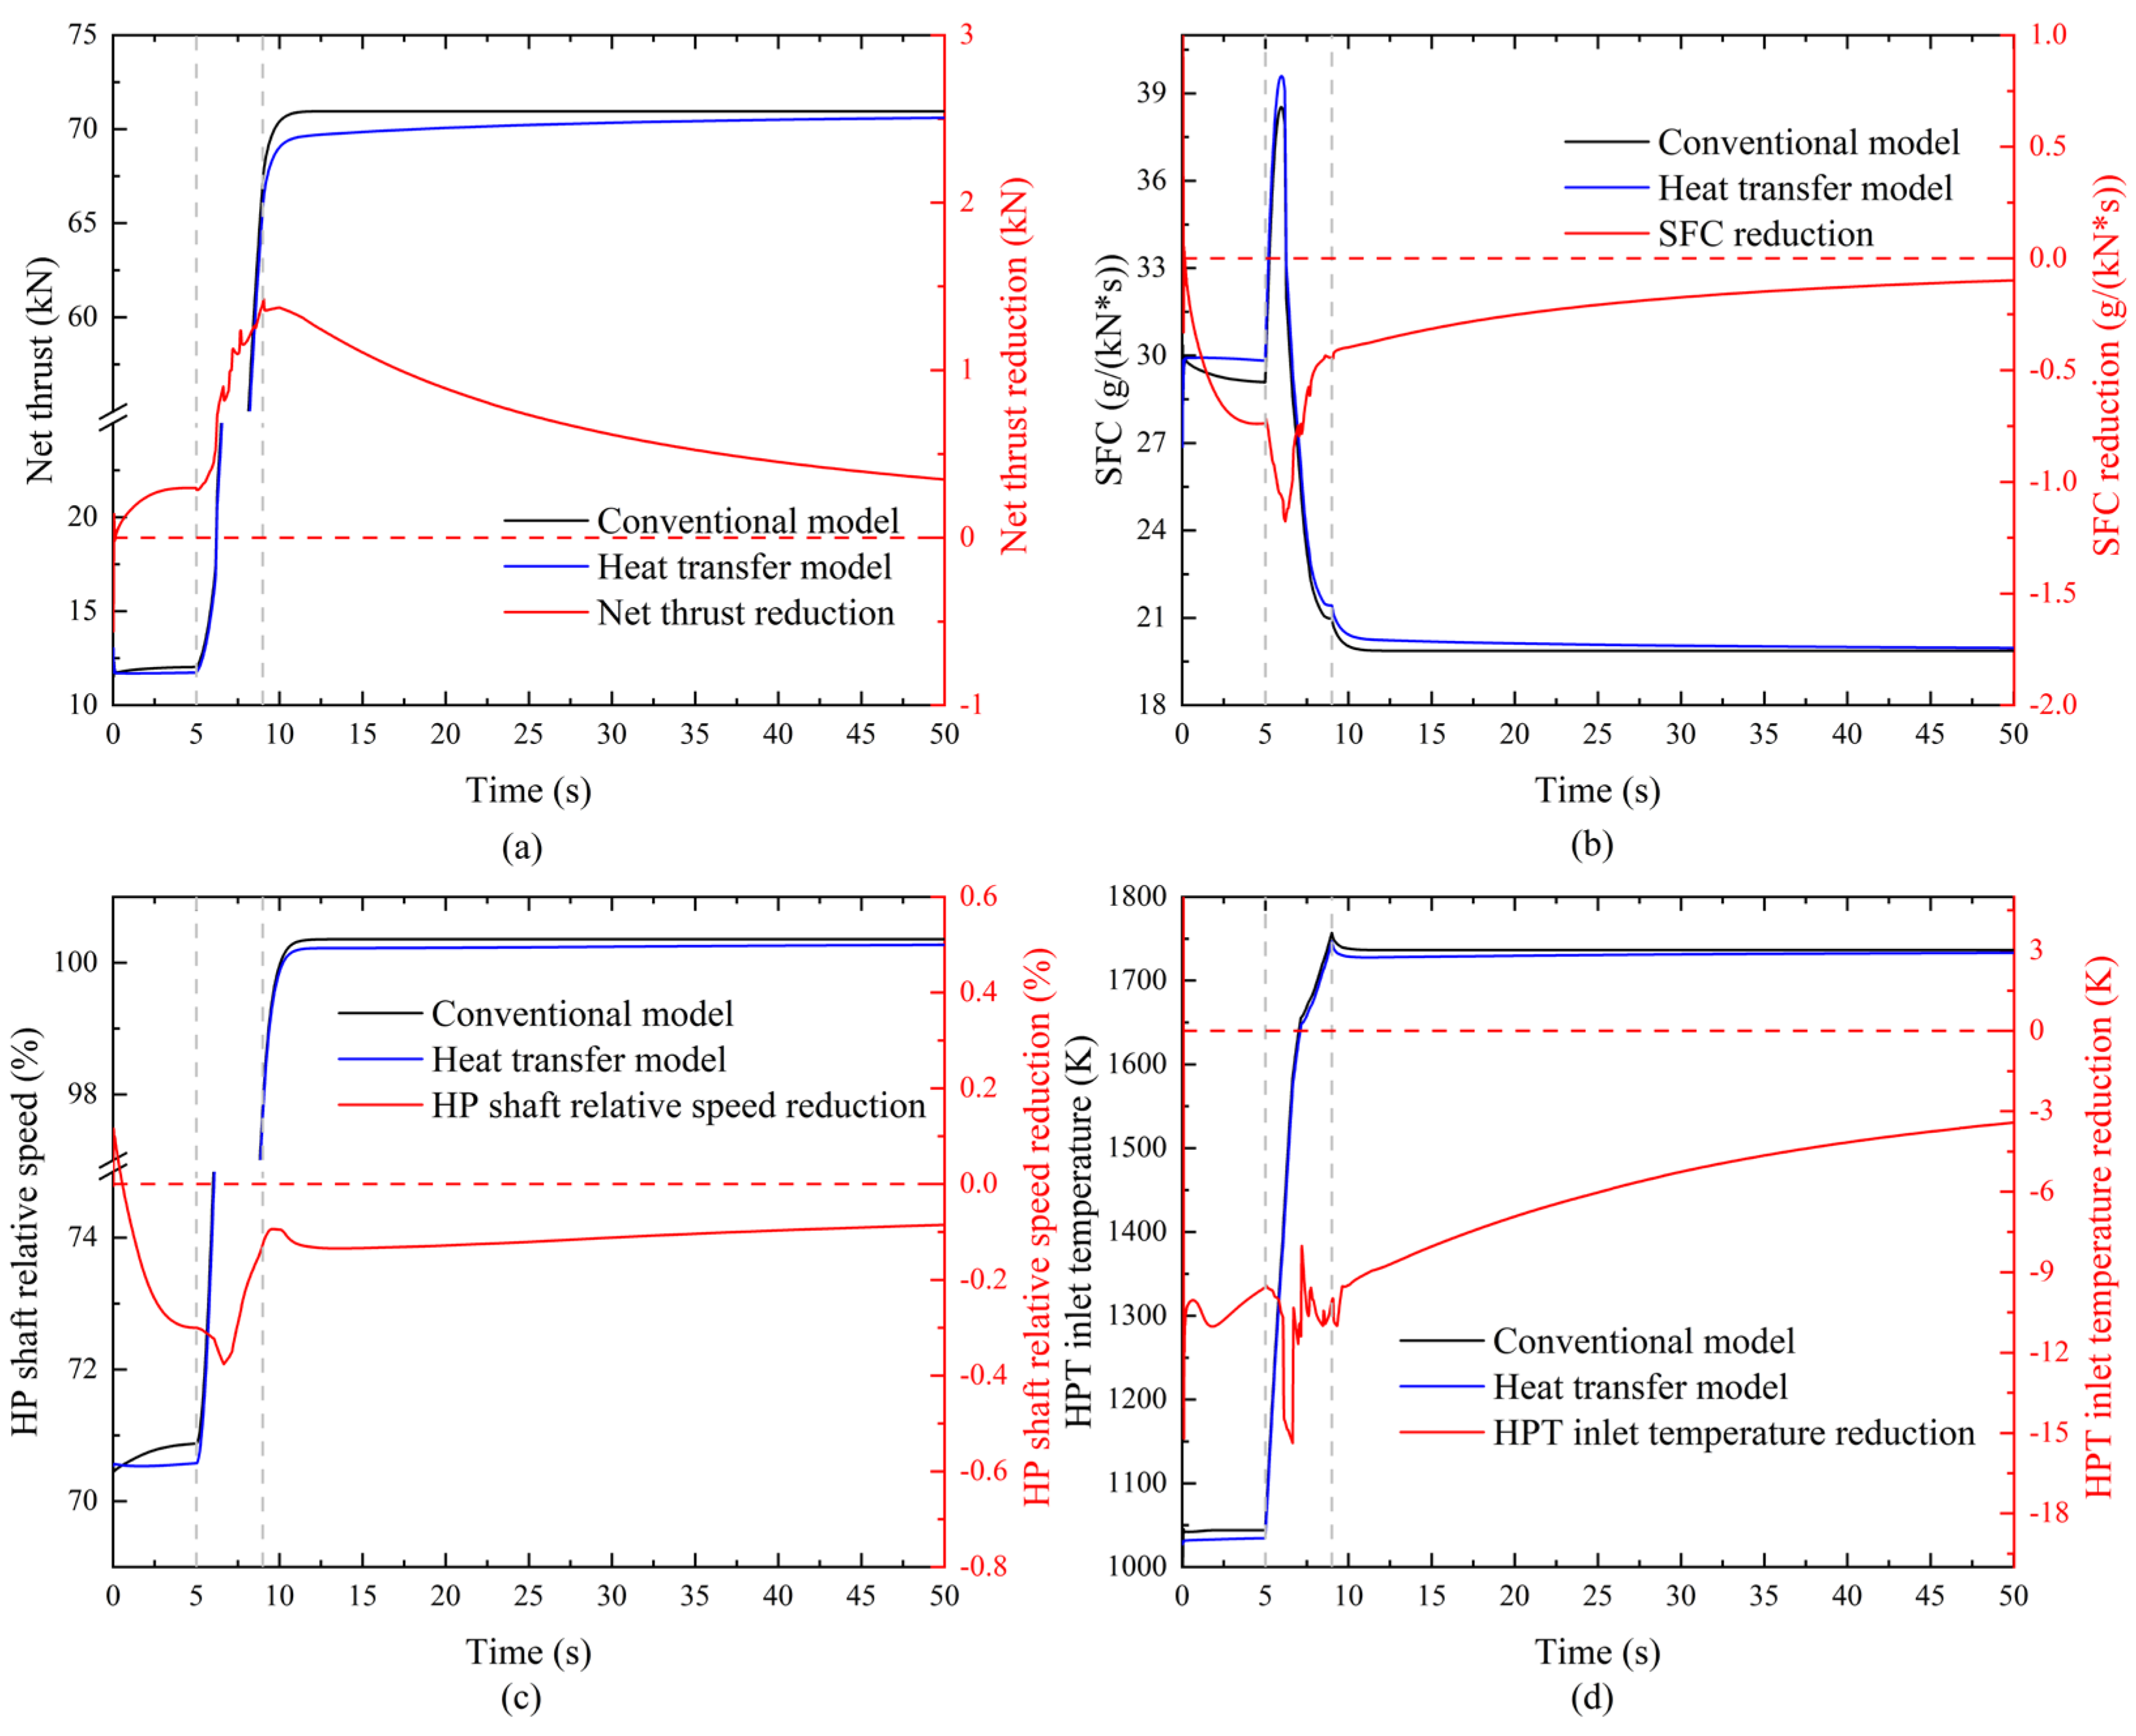
4.2.1. Heat Transfer Analysis of Aero-Engine Performance

This section first discusses the performance of the main flow system (aero-engine performance). Figure 18 illustrates the variations in net thrust and SFC during the flight mission. As shown in the figure, the SFC remains higher than the design point SFC for most of the flight. This indicates that under non-ideal operating conditions, fuel consumption increases notably, which adversely affects the fuel economy of the engine.
Subsequently, the thermal safety of the components in the aero-engine was analyzed from the heat transfer perspective. Figure 19a illustrates the variations in the inlet gas temperatures for the HPT and LPT. It can be observed that as the flight mission progresses, the inlet gas temperature of both the HPT and LPT undergoes significant fluctuations, particularly during the high-thrust phase, where the gas temperature increases notably. Figure 19b further displays the variations in the average temperatures of the HPT stator blades, HPT rotor blades, LPT first-stage stator blades, LPT first-stage rotor blades, and the LPT platform (as shown in region A of Figure 7). Due to the high-temperature environment of the HPT stator and rotor blades, their surfaces are equipped with a significant amount of film cooling (with the cooling airflow accounting for 16.4% of the core flow). Despite this, the maximum temperature of the HPT blades still exceeds 1200 K. In contrast, due to the relatively lower inlet gas temperature in the LPT, the temperature of the LPT blades remains consistently below 1100 K, even without film cooling.
The blue curve in Figure 19b illustrates the temperature variation in the LPT platform. As seen in Figure 7, the cooling air for the LPT platform is extracted from the intermediate stage of the compressor through a bleed air duct. Under the influence of this cooling air, the maximum temperature of the LPT platform reaches 1094 K. After stabilizing in the subsonic cruise condition, the temperature decreases to 866 K. At other low-speed operating conditions, the temperature remains even lower.
Based on the above heat transfer calculation results, two thermal management recommendations are proposed for the engine main flow system:
(1) Optimization of cooling air for HPT blades: Despite the substantial cooling air surrounding the HPT blades, the average temperature of the blades remains high due to the intense thermal environment. Excessive cooling air can significantly negatively impact engine performance. Therefore, the Cooled Cooling Air (CCA) technology can be considered to enhance the quality of the cooling air. As shown in Figure 20, low-temperature bypass air can be used to cool the high-temperature HPT cooling air. By using low-temperature cooling air, the amount of cooling air required to achieve the same cooling effect can be reduced, thereby improving engine performance. Furthermore, high-quality cooling air can effectively enhance the thermal safety of the blades.
(2) Reduction in cooling air for LPT platform: The temperature of the LPT platform is below 900 K for most operating conditions (see regions I and II in Figure 19b), indicating that the cooling air for the LPT platform is excessive, resulting in a waste of cooling resources. To address this, it is recommended to install an air bleed valve on the LPT bleed air system, as shown in Figure 20. On the premise of ensuring sealing requirements, dynamically adjusting the amount of LPT cooling air can effectively reduce an unnecessary increase in air extraction losses.

4.2.2. Heat Transfer Analysis of Fuel System

In the fuel system, due to the efficiency losses of the pump, a portion of the input work is converted into the internal energy of the fuel. Similarly, when fuel passes through resistance components, a portion of its mechanical energy is converted into internal energy due to viscous effects, causing an increase in fuel temperature. Therefore, this section analyzes the variations in fuel temperature and the heat generation distribution of various components in the fuel system during the entire flight mission.
Figure 21a shows the temperature variation at the fuel nozzle exit, with the red dashed line representing the maximum fuel temperature limit (422 K). It can be seen that the fuel temperature supplied to the combustor is below this limit for most operating conditions. This indicates that the fuel’s cooling capacity is not being fully utilized, leading to a waste of the fuel heat sink. Figure 21b displays the temperature rise of the high-pressure fuel path (the temperature difference between the nozzle outlet and the high-pressure pump inlet). In the subsonic cruise condition, the fuel temperature rise is approximately 25 K, indicating that the fuel system itself has an obvious heating effect on the fuel temperature.
Further analysis of the causes of the temperature rise are presented in Figure 21c, which shows the heat generation distribution of the various components. It is clear that the pressure differential valve and the high-pressure pump dominate the heat generation in the entire fuel system. Figure 21d illustrates the percentage of cumulative heat generation by each component during the flight mission. The results show that the pressure differential valve, high-pressure pump, metering valve, and fuel nozzle contribute 48.5%, 39.8%, 3.5%, and 4.8% of the total heat generation, respectively, while the remaining components account for only 3.4%. These data demonstrate that the primary heat generation in the fuel system is concentrated in the high-pressure fuel path, which is the main cause of the fuel temperature increase.
Based on the above heat transfer analysis results, the following two thermal management recommendations are proposed for the fuel system:
(1) Optimization of fuel nozzle outlet temperature: When the outlet temperature of the fuel nozzle (the temperature of fuel supplied to the combustor) is too low, it will not only lead to the waste of system cooling capacity, but also is not conducive to the efficient combustion of fuel in the combustor. Therefore, it is recommended to leverage the utilization of the fuel’s cooling potential across a wider range of operating conditions. The low-temperature fuel can be employed to cool selected high-temperature components, thereby increasing its enthalpy prior to injection. This preheating process facilitates enhanced atomization and combustion of the fuel, ultimately improving combustion efficiency and minimizing the loss of available thermal sink capacity.
(2) Replacement of mechanical fuel pump with motor pump: The mechanical fuel system extracts a substantial amount of power from the engine high-pressure shaft to meet the fuel supply demands during takeoff. This leads to excessive fuel supply under low load conditions, generating significant local return fuel, which in turn increases heat generation and power consumption in the system. To address this issue, it is recommended to replace the mechanical pump with a motor pump [31] which can precisely control the fuel supply to the combustor by adjusting its speed, as shown in Figure 22. This approach can not only reduce unnecessary energy waste, but also reduce the weight of the fuel system by removing the pressure difference valve and the metering valve.

5. Conclusions

This study established a comprehensive transient temperature evaluation model for the aero-engine incorporating fluid–solid coupled heat transfer effects. It systematically revealed the dynamic influence of heat transfer on engine performance and component thermal behavior. A thorough analysis of a typical low-bypass-ratio turbofan engine across the entire flight envelope was conducted, and targeted thermal management optimization strategies were proposed. The key findings of this study are as follows:
(1) During cold-state acceleration, the improved model predicts that the heat absorption power of metal components accounts for 4.5% of the total energy input to the combustor during cold-state acceleration. Compared to conventional adiabatic models, heat transfer effects lead to a maximum net thrust reduction of 1.42 kN during acceleration and an increase in SFC by 1.18 g/(kN·s). During hot-state deceleration, heat release from metal components enhances work output, increasing net thrust by 0.4 kN and reducing SFC by over 0.7 g/(kN·s).
(2) Although the HPT blade cooling air accounts for 16.4%, the average blade temperature still exceeds 1200 K, posing thermal safety risks. Meanwhile, excessive cooling air supply to the LPT platform leads to unnecessary bleed losses. Additionally, the insufficient utilization of the fuel heat sink causes a waste of the cooling capacity. Furthermore, the fuel system also generates excessive heat and extracts significant power from the HP shaft.
(3) Several optimization strategies are proposed. First, the introduction of CCA technology is recommended to reduce turbine cooling air temperature. Second, the implementation of a dynamic valve for LPT bleed air regulation is suggested to enable real-time adjustment of cooling air. Additionally, it is recommended to use fuel to cool more high-temperature components to reduce the waste of heat sink. Finally, the electric pump is used to replace the mechanical pump to accurately control the fuel supply of the combustor.
The transient temperature evaluation method proposed in this study demonstrates strong generality and scalability, making it applicable to thermal state analysis of various types of aero-engines, including high-bypass-ratio turbofan engines and turboshaft engines. By maintaining a balance between modeling accuracy and computational efficiency, the method provides a robust theoretical foundation for the design of thermal management strategies under diverse flight missions. Future research may focus on model validation using actual flight test data, as well as exploring integrated thermal management approaches in conjunction with intelligent control strategies.

Author Contributions

Conceptualization, W.G. and X.L.; Methodology, W.G., K.L. and B.S.; Software, S.Y.; Validation, S.Y. and Y.L.; Writing—original draft, W.G.; Writing—review & editing, X.L. and B.S. All authors have read and agreed to the published version of the manuscript.

Funding

This work is supported by the National Science and Technology Major Project of China (2019-III-0001-0044).

Data Availability Statement

Data are contained within the article.

Conflicts of Interest

The authors declare no conflict of interest.

Nomenclature

E Energy (J)
HAltitude (m)
MaMach number
Q Heat (J)
T Temperature (K)
V Component volume ( m 3 )
W ˙ Output power (W)
c Specific heat capacity ( J / ( kg K ) )
h Convective heat transfer coefficient ( W / ( m 2 K ) )
h * Specific enthalpy of the fluid (J/kg)
k Coefficient of thermal conductivity ( W / ( m K ) )
m ˙ Mass flow rate of fuel (kg/s)
q Heat flux density ( W / m 2 )
t Time (s)
Δ t Time step size (s)
Δ x Dimension of the control volume in the x direction
Δ y Dimension of the control volume in the y direction
Abbreviations
FVMFinite volume method
HPHigh-pressure
HPTHigh-pressure turbine
LPTLow-pressure turbine
SFCSpecific fuel consumption
Greek symbols
ρ Density ( kg / m 3 )
ε Emissivity
α Absorptivity
σ Stefan–Boltzmann constant
Subscript
CVControl volume
EMMetal components of the engine
cCooling air
fFluid
gGas
wSolid wall
inInlet
outOutlet
refReference value

Appendix A

In the heat transfer analysis of aero-engines, appropriate computational methods can be employed to simplify the heat transfer characteristics between different components and the working fluid, as shown in Figure A1. The flowchart of the thermal analysis solution for the entire aero-engine is shown in Figure A2. The specific computational methods are detailed in Table A1.
Figure A1. Simplified schematic diagram of aero-engine.
Aerospace 12 00562 g0a1
Figure A2. Flowchart for solving the thermal analysis of aero-engines.
Aerospace 12 00562 g0a2
Table A1. Heat transfer calculation description.
DescriptionCalculation
Forced convection in duct [26] D = 4 A / P
Re = m D / A μ
Pr = C p μ / k
h = 1.86 × Re 1 / 3 Pr 1 / 3 ( D / L ) 1 / 3 ( μ / μ w ) 0.14 k / D For   Re 2100  
h = 0.027 × Re 0.8 Pr 1 / 3 ( μ / μ w ) 0.14 k / D For   Re > 2100  
D is the hydraulic diameter of the duct; A is the flow cross sectional area of the duct; P is the wetted perimeter of the duct; Re is the Reynolds number; m is the mass flow rate of fluid; μ is the dynamic viscosity of fluid; Pr is the Prandtl number; C p is the constant pressure specific heat capacity of fluid; k is the thermal conductivity of fluids; L is the length of the duct; μ w is the dynamic viscosity of fluid at wall temperature; h is the convective heat transfer coefficient
Forced convection of rotating disk [12] Re = ( ρ ω R 2 ) / μ
Pr = C p μ / k
h = 0.616 × Pr 1 / 3 Re 1 / 2 k / R For   Re 240,000
h = 0.0267 × Pr 0.6 Re 0.8 k / R For   Re > 240,000
Re is the Reynolds number; ρ is the fluid density; ω is the angular velocity of disk; R is the rotation radius of the disk; μ is the dynamic viscosity of fluid; Pr is the Prandtl number; C p is the constant pressure specific heat capacity of fluid; k is the thermal conductivity of fluids; h is the convective heat transfer coefficient
Forced convection on the outer surface of the blade [32] D = C / 2
Re = ρ ( u 1 + u 2 ) / 2 D / μ
Pr = C p μ / k
b = sin β 2 / sin β 1
h = ( 0.0805 / b 2.85 0.0022 ) Re 0.74 b 0.34 Pr 1 / 3 k / D
Re is the Reynolds number; ρ is the fluid density; C is the blade perimeter; R is the rotation radius of the blade; μ is the dynamic viscosity of fluid; u 1 is the fluid inlet velocity; u 2 is the fluid outlet velocity; β 1 is the fluid inlet geometric angle; β 2 is the fluid outlet geometric angle; Pr is the Prandtl number; C p is the constant pressure specific heat capacity of fluid; k is the thermal conductivity of fluids; h is the convective heat transfer coefficient; D is the qualitative dimensions of the blade
Forced convection on the inner surface of the blade [32] D = 4 A / P
Re = m D / A μ
Pr = C p μ / k
h = 0.026 Pr 0.3 Re 0.8 k / D
D is the hydraulic diameter of the duct; A is the flow cross sectional area of the inner surface; P is the wetted perimeter of the inner surface; Re is the Reynolds number; m is the mass flow rate of fluid; μ is the dynamic viscosity of fluid; Pr is the Prandtl number; C p is the constant pressure specific heat capacity of fluid; k is the thermal conductivity of fluids; h is the convective heat transfer coefficient
Forced convection on the inner/outer surface of the flame tube [23]Inner surface:
h g = 0.017 k g / D 0.2 ( m g / ( A μ g ) ) 0.8
Outer surface:
h a = 0.02 k a / D 0.2 ( m a / ( A μ a ) ) 0.8
D is the flame tube diameter; A is the flame tube cross-sectional area; h g is the convective heat transfer coefficient with air; h a is the convective heat transfer coefficient with air; m a is the mass flow rate of air; m g is the mass flow rate of gas; μ g is the dynamic viscosity of gas; k g is the thermal conductivity of gas; μ a is the dynamic viscosity of air; k a is the thermal conductivity of air

References

  1. Liang, C.; Suo, D.; Sun, M. A Review on the Key Technologies of the Sixth Generation Fighter Engines in the US. Aeroengine 2016, 42, 93–97. [Google Scholar] [CrossRef]
  2. Wang, J.; Li, Y.; Liu, X.; Shen, C.; Zhang, H.; Xiong, K. Recent active thermal management technologies for the development of energy-optimized aerospace vehicles in China. Chin. J. Aeronaut. 2021, 34, 1–27. [Google Scholar] [CrossRef]
  3. Cheng, R.; Zhang, Z.; Chen, Z. Technical characteristics and implementation of the fourth-generation jet fighter engines. Acta Aeronaut. Astronaut. Sin. 2019, 40, 6–15. [Google Scholar]
  4. Van Heerden, A.S.J.; Judt, D.M.; Jafari, S.; Lawson, C.P.; Nikolaidis, T.; Bosak, D. Aircraft thermal management: Practices, technology, system architectures, future challenges, and opportunities. Prog. Aerosp. Sci. 2022, 128, 100767. [Google Scholar] [CrossRef]
  5. Doman, D.B. Fuel Flow Topology and Control for Extending Aircraft Thermal Endurance. J. Thermophys. Heat Transf. 2018, 32, 35–50. [Google Scholar] [CrossRef]
  6. Huang, G.P.; Doman, D.B.; Rothenberger, M.J.; Hencey, B.; DeSimio, M.P.; Tipton, A.; Sigthorsson, D.O. Dimensional Analysis, Modeling, and Experimental Validation of an Aircraft Fuel Thermal Management System. J. Thermophys. Heat Transf. 2019, 33, 983–993. [Google Scholar] [CrossRef]
  7. Huang, P.G.; Doman, D.B. Thermal Management of Single- and Dual-Tank Fuel-Flow Topologies Using an Optimal Control Strategy. J. Therm. Sci. Eng. Appl. 2018, 10, 041019. [Google Scholar] [CrossRef]
  8. Yang, Y.; Nikolaidis, T.; Pilidis, P. Quasi-2D thermal network based heat soakage model for gas turbine transient performance modification. Appl. Therm. Eng. 2024, 241, 122340. [Google Scholar] [CrossRef]
  9. Visser, W.P.J.; Dountchev, I.D. Modeling Thermal Effects on Performance of Small Gas Turbines. In Proceedings of the ASME Turbo Expo 2015: Turbine Technical Conference and Exposition, Montreal, QC, Canada, 15–19 June 2015; V001T01A014. [Google Scholar] [CrossRef]
  10. Fawke, A.J.; Saravanamuttoo, H.I.H. Digital computer simulation of the dynamic response of a twin-spool turbofan with mixed exhausts. Aeronaut. J. 1973, 77, 471–478. [Google Scholar] [CrossRef]
  11. Maccallum, N.R.L. The Performance of Turbojet Engines during the ‘Thermal Soak’ Transient. In Proceedings of the Institution of Mechanical Engineers, Conference Proceedings (Vol. 184, No. 7, pp. 23-29); Sage Publications, Sage UK: London, UK, 1969. [Google Scholar] [CrossRef]
  12. Naylor, P. Gas Turbine Transient Performance: Heat Soakage Modelling. Ph.D. Thesis, Cranfield University, Cranfield, UK, 2004. [Google Scholar]
  13. LI, Z. Aircraft Engine Transient Performance Modelling with Heat Soakage Effects. Ph.D. Thesis, Cranfield University, Cranfield, UK, 2019. [Google Scholar]
  14. Chapman, J.W.; Guo, T.-H.; Kratz, J.L.; Litt, J.S. Integrated Turbine Tip Clearance and Gas Turbine Engine Simulation. In Proceedings of the 52nd AIAA/SAE/ASEE Joint Propulsion Conference, Salt Lake City, UT, USA, 25–27 July 2016. [Google Scholar]
  15. Kratz, J.L.; Culley, D.E.; Chapman, J.W. Approximation of Engine Casing Temperature Constraints for Casing Mounted Electronics. In Proceedings of the 52nd AIAA/SAE/ASEE Joint Propulsion Conference, Salt Lake City, UT, USA, 25–27 July 2016. [Google Scholar]
  16. Wang, T.; Xuan, Y.; Han, X. Investigation on hybrid thermal features of aero-engines from combustor to turbine. Int. J. Heat Mass Transf. 2023, 200, 123559. [Google Scholar] [CrossRef]
  17. Yang, S.; Gou, W.; Lin, Y.; Xu, X.; Shi, B.; Liang, X. Steady State Simulation Program of Aero-Engine Thermal Management System. In Proceedings of the 6th China Aeronautical Science and Technology Conference, Wuzhen, China, 26–27 September 2023; Springer Nature: Singapore, 2024. [Google Scholar]
  18. Sizhao, K.; Xiuzhi, X.I.; Bo, L.I. Simulation and analysis of temperature of aviation engine fuel system based on Flowmaster software. J. Aerosp. Power 2020, 35, 722–731. [Google Scholar] [CrossRef]
  19. Liu, J.; Li, M.; Zhang, T.; Wang, Y.; Cao, Z.; Shao, W.; Chen, Q. Optimization of the aero-engine thermal management system with intermediate cycle based on heat current method. Appl. Therm. Eng. 2024, 237, 121793. [Google Scholar] [CrossRef]
  20. Oba, D.; Gonda, Y. Fuel System with Variable Speed Pump to Improve Thermal Management Ability for Aircraft Engines. In Proceedings of the ASME Turbo Expo 2014: Turbine Technical Conference and Exposition, Düsseldorf, Germany, 16–20 June 2014; p. V006T06A025. [Google Scholar] [CrossRef]
  21. Oppenheimer, M.W.; Sigthorsson, D.; Doman, D.B. Extending Aircraft Thermal Endurance by Fuel Pump Sizing. In Proceedings of the 2018 AIAA Guidance, Navigation, and Control Conference, Kissimmee, FL, USA, 8–12 January 2018. [Google Scholar]
  22. Tao, W. Numerical Heat Transfer, 2nd ed.; Xi’an Jiaotong University Press: Xi’an, China, 2001. [Google Scholar]
  23. Lefebvre, A.H.; Ballal, D.R. Gas Turbine Combustion: Alternative Fuels and Emissions; CRC Press: Boca Raton, FL, USA, 2010. [Google Scholar]
  24. Chen, F.P.; Chen, Y.C.; Song, K.R.; Li, Y.S. Study on the Influence of Heat Transfer Effect on Performance Simulation of Engine Transition State. In Proceedings of the 2019 IEEE 10th International Conference on Mechanical and Aerospace Engineering (ICMAE), Brussels, Belgium, 22–25 July 2019. [Google Scholar] [CrossRef]
  25. Walsh, P. Gas Turbine Performance; Blackwell Publishing: Oxford, UK, 2004. [Google Scholar]
  26. Holman, J.P. Heat Transfer, 10th ed.; McGraw-Hill Education: New York, NY, USA, 2010. [Google Scholar]
  27. Wang, B.; Xuan, Y. An improved WSGG model for exhaust gases of aero engines within broader ranges of temperature and pressure variations. Int. J. Heat Mass Transf. 2019, 136, 1299–1310. [Google Scholar] [CrossRef]
  28. Yang, S.; Lin, Y.; Yu, H.; Xu, X.; Liang, X. Analysis of the hot fuel return characteristics for a fuel thermal management system with multiple temperature limit points. J. Tsinghua Univ. 2024, 64, 841–851. [Google Scholar] [CrossRef]
  29. Gou, W.; Yang, S.; Lin, Y.; Shao, F.; Liang, X.; Shi, B. Dynamic blade tip clearance control of aero-engine by the integration of cooling air with fuel thermal management system. Appl. Therm. Eng. 2025, 261, 125042. [Google Scholar] [CrossRef]
  30. Young, J.B.; Wilcock, R.C. Modeling the Air-Cooled Gas Turbine: Part 2—Coolant Flows and Losses. J. Turbomach. 2002, 124, 214–221. [Google Scholar] [CrossRef]
  31. Morioka, N.; Oyori, H. Fuel System Design for the More Electric Engine. In Proceedings of the ASME Turbo Expo 2012: Turbine Technical Conference and Exposition, Copenhagen, Denmark, 11–15 June, 2012. [Google Scholar] [CrossRef]
  32. Cao, Y.; Tao, Z.; Xu, G. Aero-Engine Heat Transfer; Beihang University Press: Beijing, China, 2005. [Google Scholar]
Figure 1. Schematic diagram of external pipeline of turbofan engine.
Aerospace 12 00562 g001
Figure 2. Thermal analysis diagram of multi-stage components.
Aerospace 12 00562 g002
Figure 3. Compressor thermal analysis flowchart.
Aerospace 12 00562 g003
Figure 4. Thermal analysis diagram of combustor (Note: The cooling air distribution percentages are based on reference values for a typical engine and are used only to demonstrate the modeling approach).
Aerospace 12 00562 g004
Figure 5. Thermal analysis diagram of high-pressure turbine.
Aerospace 12 00562 g005
Figure 6. Heat transfer calculation model.
Aerospace 12 00562 g006
Figure 7. The distribution diagram of turbine cooling air.
Aerospace 12 00562 g007
Figure 8. Aero-engine thermal management simulation software interface.
Aerospace 12 00562 g008
Figure 9. Experimental device physical photo and comparison of the results. (a) The schematic diagram of working principle (b) The comparison between simulation and experiment.
Aerospace 12 00562 g009
Figure 10. Fuel control schedule during transient process. (a) Variation of fuel mass flow rate (b) Variation of relative speed of HP shaft.
Aerospace 12 00562 g010
Figure 11. Heat transfer power of components and ratio of total heat transfer power to total input energy during cold-state acceleration. (a) Variation of heat transfer power of each component (b) Proportion of total heat transfer power relative to the total energy input into the combustion chamber.
Aerospace 12 00562 g011
Figure 12. The impact of heat transfer on engine performance during cold-state acceleration. (a) Variation of net thrust (b) Variation of specific fuel consumption (c) Variation of HP shaft relative speed (d) Variation of HP turbine inlet temperature.
Aerospace 12 00562 g012
Figure 13. The impact of heat transfer on the fuel system during cold-state acceleration. (a) Variation of fuel nozzle outlet temperature (b) Variation of the extracted power of the fuel system (c) Percentage of pump power consumption (d) Variation of inlet flow rate of high-pressure pump.
Aerospace 12 00562 g013
Figure 14. Heat transfer power of components and ratio of total heat transfer power to total input energy during hot-state deceleration. (a) Variation of heat transfer power of each component (b) Proportion of total heat transfer power relative to the total energy input into the combustion chamber.
Aerospace 12 00562 g014
Figure 15. The impact of heat transfer on engine performance during hot-state deceleration. (a) Variation of net thrust (b) Variation of specific fuel consumption (c) Variation of HP shaft relative speed (d) Variation of HP turbine inlet temperature.
Aerospace 12 00562 g015
Figure 16. Flight mission control parameters (Note: The red numbers in the figure indicate the flight phase. 1—Ground idle, 2—Ground cruise, 3—Ground run, 4—Accelerated climb, 5—Constant rate climb, 6—Subsonic cruise, 7—In-flight descent, 8—Level acceleration, 9—Supersonic cruise, 10—Combat, 11—Evasion, 12—Subsonic cruise, 13—Descent, 14—Landing, 15—Ground stop, 16—Ground idle).
Aerospace 12 00562 g016
Figure 17. Boundary parameters of fuel system in flight mission.
Aerospace 12 00562 g017
Figure 18. Net thrust and SFC variations during flight mission. (a) Variation of net thrust (b) Variation of specific fuel consumption.
Aerospace 12 00562 g018
Figure 19. Temperature variations in working fluid and components during flight mission. (a) Variation of gas temperature (b) Variation of component temperature.
Aerospace 12 00562 g019
Figure 20. Schematic diagram of thermal management improvements for the main flow system.
Aerospace 12 00562 g020
Figure 21. Variations in fuel temperature and component heat generation during flight mission. (a) Variation of fuel nozzle outlet temperature (b) Variation of temperature rise in HP fuel path (c) The heat generation distribution of the various components (d) The percentage of cumulative heat generation by each component during the flight mission.
Aerospace 12 00562 g021
Figure 22. Schematic diagram of thermal management improvement for the fuel system.
Aerospace 12 00562 g022
Table 1. The engine performance parameters under standard sea-level static ISA conditions.
ParametersValue
Air mass flow rate (kg/s)100
LPC pressure ratio3.3
LPC isentropic efficiency0.83
HPC pressure ratio9
HPC isentropic efficiency0.86
Combustion efficiency0.987
Combustor exit temperature (K)1730
HPT isentropic efficiency0.87
LPT isentropic efficiency0.89
Low-pressure shaft speed (RPM)10,000
High-pressure shaft speed (RPM)16,000
Net thrust (kN)70.9
Specific fuel consumption (g/(kN·s))20.11
Table 2. Verification results of the average temperature of high-pressure turbine stator blade.
Calculation ParametersValueUnit
Combustor outlet temperature1700K
Turbine inlet pressure34bar
Coolant supply temperature867K
Coolant supply pressure34bar
Coolant/mainstream flowrate ratio0.145
Average temperature of the blade (Literature result)1045.5K
Average temperature of the blade (Model result)1070.6K
Relative error2.4%
Disclaimer/Publisher’s Note: The statements, opinions and data contained in all publications are solely those of the individual author(s) and contributor(s) and not of MDPI and/or the editor(s). MDPI and/or the editor(s) disclaim responsibility for any injury to people or property resulting from any ideas, methods, instructions or products referred to in the content.

