Abstract
The adaptive cycle engine (ACE) can modulate thermal cycle characteristics by adjusting variable geometry components, enabling rational distribution of bypass flow rates. As a key component of the ACE, the rear variable area bypass injector (RVABI) significantly influences the engine bypass ratio and consequently alters engine performance. RVABIs are typically categorized into three configurations based on their design: Translation Type, Rotary Type, and Hole Type. Previous studies have not fully elucidated the overall operating characteristics, internal flow mechanisms, and applicable scenarios of these different RVABI configurations. To address this problem, this paper first introduces and validates a three-dimensional (3D) simulation methodology for RVABIs. Subsequently, criteria for reasonably evaluating the operating characteristics of different RVABI configurations are defined. Following this, the differences in operating characteristics and internal flow mechanisms among the three RVABI configurations are systematically compared. Finally, the application scenarios for each configuration are identified. This work provides valuable insights to guide the configuration selection and parameter design of RVABIs in practical engineering applications.
1. Introduction
Adaptive cycle engines (ACEs) can significantly change the engine bypass ratio, thrust, and specific fuel consumption by adjusting the variable geometry components. This allows the engine to operate in both high thrust in turbojet mode and low specific fuel consumption in turbofan mode. As a result, the ACE can fulfill the mission under different operating conditions and demands, and the ACE is also considered one of the ideal powerplants for future advanced vehicles [1,2,3].
The variable area bypass injector (VABI) regulates the mixing performance of the core and bypass streams in ACEs. VABIs are categorized as either Front (FVABI), located upstream of the combustion chamber, or Rear (RVABI), positioned downstream of the turbine. Among the ACE’s variable geometry components, the RVABI serves a critical and distinct role. It is the location where the high-temperature core flow exiting the turbine merges with the low-temperature bypass flow from the fan. Furthermore, the RVABI’s variable geometry mechanism significantly influences the engine bypass ratio by modulating the effective flow areas of the core and bypass passages. By coordinating the variable geometry adjustment of the RVABI with other variable geometry components, ACE can achieve a wide range of bypass ratio variation, significantly enhancing its mission adaptability. During takeoff and maneuvering phases, the ACE operates in a low-bypass, high-thrust mode, while it switches to a high-bypass, low-fuel-consumption mode during cruise. As a result, the RVABI plays a critical role in improving the adaptability to complex mission of the ACE.
According to the different regulation schemes, RVABIs are usually categorized into Translation Type, Rotary Type and Hole Type [4] (shown in Figure 1). Due to the differences in the geometrical structure of different configurations of the RVABI, the aerodynamic characteristics and regulation capabilities are also different, which may cause greater differences than those of the traditional mixer. However, there is no systematic comparative analysis of the operating characteristics of the three RVABI configurations under ACE engine conditions in the existing literature. And there is no relevant literature systematically pointing out the application scenarios of the three configurations of RVABIs under different engine requirements.
Figure 1.
Structural diagrams of the RVABIs.
When designing and analyzing the performance of the ACE, the ideal (no wall friction) subsonic constant-area mixer model (referred to as the mixer model) [5,6,7,8,9,10] is used for the simulation of the VABI components in the traditional zero-dimensional (0D) model for the engine. Based on the assumption of static pressure balance and through the mass conservation equation, momentum conservation equation, and energy conservation equation, the model can achieve relatively good prediction results to simulate the RVABI performance at the design point. However, when deviating from the design point, the performance prediction of the RVABI will have a large error due to the large difference between the RVABI’s geometric structure and that of the mixer model. The mixer model cannot accurately take into account the variable geometric characteristics of RVABIs. Especially for the Hole Type RVABI, its geometry is more complicated and has more geometric parameters, so the simulation of its performance based on the mixer model has a large error. It is also difficult to accurately consider the effects of the variable geometric parameters and design geometric parameters of the different types of RVABI on performance. Therefore, it is necessary to propose a simulation, design, and analysis method for the different types of RVABI to evaluate the operating characteristics more reliably and the impact on the performance of ACE.
Scholars have conducted a series of studies on the flow mechanism and operating characteristics of mixers and VABIs. Liu Youhong et al. [11,12] carried out a lot of research work on lobed mixers and investigated the operating characteristics of mixers under various factors. Paterson et al. [13] found that large-scale transverse flow will lead to the distortion of the mixing interface, which increases both the thermal and momentum mixing efficiency. Werle et al. [14] pointed out that a streamwise vortex undergoes three stages of development: formation, development, and dissipation. Sheng ZQ et al. [15,16,17] carried out extensive research on the flow mechanisms of lobed mixers.
Runfu LIU et al. [18] introduced an optimized design of RVABIs based on the alternating area regulator to improve the velocity and temperature uniformity of the inlet airflow of a charge combustion chamber. Zhewen XU et al. [19] proposed a multi-fidelity simulation method based on the decoupling method, which can realize FVABI characteristic form and its matching calculation method with an ACE performance model. Ruoyu Wang et al. [20] utilized the control volume method to establish an improved VABI model and summarized the characteristic parameters that determine the aerodynamic performance of VABI. Leng Zhongming et al. [21] compared the computation of axisymmetric and non-axisymmetric FVABI models with different mixing angles and inlet/outlet pressure ratios. Song et al. [22] established a high-fidelity model of FVABI based on the support vector machine algorithm. Liu Baojie et al. [23] proposed a throughflow model by considering its working principles and the characteristics of the streamline curve throughflow method. Binglong Zhang et al. [24] carried out FVABI tests for specific operating conditions in ACE dual bypass mode as well as for different area ratios and different back pressure ratios. Huang et al. [25] summarized the change rule of adverse pressure gradient caused by radial velocity during the transition of internal flow mode in variable geometry for the axisymmetric RVABI.
Therefore, in this paper, the basic principles and RVABI 3D simulation model setups of the three configurations of RVABIs are first introduced, and the reliability of the simulation methods is verified. Then, the evaluation criterion for comparing the operating characteristics of different configurations of the RVABI are defined. The differences in the operating characteristics of different configurations are compared, and the mechanisms are analyzed. Finally, the applicable scenarios of the three configurations of the RVABI are given according to the analysis results.
2. RVABI 3D Simulation Model
2.1. Geometry of RVABIs
The geometry of the three configurations of the RVABI is given in Figure 1, and the variable geometry principles of each configuration of the RVABI are described below:
The Hole Type RVABI [26,27] geometry is shown in Figure 1a. There are few studies on the operating performance of this configuration of the RVABI. In this configuration, the core and bypass flow interfaces are separated by a ring baffle plate with holes, and 36 holes in total are distributed along the circumference of the baffle. The bypass flow can only pass through the holes. At the same time, in order to realize the variable geometry function of the RVABI, a horizontal actuator cylinder is mounted on the ring baffle plate. The horizontal actuator cylinder can be made to move forward and backward along the axis by changing the actuator valve, so as to increase/decrease the effective flow area of bypass flow and thus change the bypass ratio of the RVABI. The bypass ratio BPR of the RVABI is defined as the ratio of the inlet mass flow of the RVABI bypass flow m16 to the inlet mass flow of the core flow m6:
When the horizontal actuator cylinder is moved axially to the left, the effective flow area of the bypass flow increases, and the RVABI bypass ratio increases. Conversely, when the horizontal actuator cylinder is moved axially to the right, the RVABI bypass ratio decreases.
Figure 1b shows the geometry of the Translation Type RVABI, which is a relatively simple structure, with a horizontal actuator cylinder installed at the interface of core and bypass flow. The horizontal actuator cylinder can be moved forward and backward along the axis by adjusting the actuator valve. By adjusting the actuator valve, the horizontal actuator cylinder can be made to move forward and backward along the axis, thus increasing/decreasing the effective flow area of the bypass flow and changing the bypass ratio of the RVABI.
When the horizontal actuator cylinder is moved to the left along the axis, the effective flow area of the bypass flow increases, the mass flow of the bypass flow increases, and the bypass ratio of the RVABI increases. Conversely, when the horizontal actuator cylinder is moved to the right along the axis, the bypass ratio of the RVABI decreases.
Figure 1c shows the geometry of the Rotary Type RVABI, which is similar to the structure of the variable geometry nozzle. It consists of an actuation valve, an actuation ring, some ring hinge choke plates, tie rods, and other mechanisms. By adjusting the actuating valve, the actuating ring can drive the tie rods to pull the ring hinge choke plates, so that the ring hinge choke plates rotate. Then, the effective flow areas of the core and bypass flow can be changed, leading to a change on the RVABI bypass ratio.
When the ring hinge choke plates shrink to the core flow driven by the actuation valve, the effective circulation area of the bypass flow increases, the bypass mass flow increases, and the RVABI bypass ratio increases. On the contrary, when the ring hinge choke plates expand to the bypass flow driven by the actuation valve, the RVABI bypass ratio decreases.
While differing structurally and aerodynamically, the Hole Type and Translation Type RVABIs share a common actuation mechanism: linear displacement of the horizontal actuator cylinder achieves their variable geometry function. In contrast, the Rotary Type RVABI modulates both the core and bypass effective flow areas simultaneously via rotation of its ring hinge choke plates, demonstrating stronger coupling characteristics.
In order to reasonably evaluate the operating characteristics of different configurations of RVABIs, the external size set of the three configurations of RVABIs should be consistent, as shown in Figure 2. The radial dimensions of the three configurations of RVABIs mainly include outer diameter of the bypass flow D, inner diameter of the core flow 0.47D, outer diameter of the core flow 0.79D, inner diameter of the bypass flow 0.87D, and outlet radius 0.66D. The axial dimensions mainly include total length L, inlet section length Lin, and mixing section length Lmix.
Figure 2.
The size set of the RVABIs.
Horizontal direction is defined as the x-axis, and vertical direction is defined as the y-axis. The ratio of the horizontal coordinate to the total length x/L defines the cross section of the different positions along the flow direction; x/L is in the range of 0 to 0.4 for the inlet section and x/L is in the range of 0.4~1 for the mixing section. Mixing section length Lmix should be as long as possible for the RVABI. The mixing section of the RVABI should be as short as possible in order to reduce the size and weight of the engine. According to the conventional mixer design, the increase in the ratio Lmix/D is favorable to the mixing effect of the two streams of the core and bypass flow. However, at the same time, the weight of the RVABI as well as the friction loss will also increase. In this paper, the Lmix/D is set to 0.79.
The variable geometry realization and the definition of valve opening degree VO of the three configurations of RVABIs are as shown in Figure 2a. For the Hole Type RVABI, the variable geometry function is realized by changing the exposed length Le of the translation actuation valve. When the translation actuation valve is moved to the leftmost side, this state is defined as VO = 100%, and when the translation actuation valve is moved to the rightmost side, this state is defined as VO = 0%. As shown in Figure 2b, for Translation Type RVABI, the variable geometry function is realized by changing the exposed length Ls of the translation actuation valve. VO is defined as 100% when the translation actuation valve moves to the leftmost side, and VO is defined as 0% when the translation actuation valve moves to the rightmost side. As shown in Figure 2c, for Rotary Type RVABI, the variable geometry function is realized by changing the angle θ between the ring hinge choke plate and the horizontal axial direction. When θ = 155°, this state is defined as VO = 100%, and θ = 180°; this state is defined as VO = 0%.
2.2. RVABI 3D Simulation Method
Due to the large size and complex structure of the three RVABI models, the size of the mesh is too large, and the computational efficiency is too low if the 3D simulation of the whole model is carried out. Therefore, to enhance computational efficiency, this study employs a periodic sector model for the 3D simulations, considering only a representative circumferential sector of the full RVABI geometry. Periodic boundary conditions are applied to the two side faces of this sector. This approach significantly reduces the mesh size and thus improves computational efficiency. Using the sector angle of the Hole Type RVABI as the baseline, the same sector angle (360°/Number of Holes = 10°) is applied consistently across all three RVABI configurations.
In this paper, the commercial software ANSYS CFX 19.2 is used for RVABI CFD 3D simulation. The control equations are three-dimensional and compressible Reynolds averaged N-S equations, and an SST turbulence model [28] is employed. The SST turbulence model is particularly suitable for RVABI 3D CFD simulations due to its superior capability in accurately capturing flow separation and complex vortex structures [29]. The equations are discretized using a first-order high-precision format. The RVABI inlet boundary includes bypass flow inlet total temperature Tt16, total pressure Pt16 and core flow inlet total temperature Tt6, total pressure Pt6. The inlet flow direction is perpendicular to the inlet cross section. The RVABI outlet boundary condition is static pressure Ps. The two sides of the surface use the periodic boundary condition.
All the simulation cases in this paper use the unstructured grids, as shown in Figure 3. Due to the complexity of the flow field and the large gradient of parameter changes in the confluence area of RVABIs, local encryption is carried out in this area. At the same time, the boundary layer is added to the near-wall surface. In order to ensure that the grid settings can make the RVABIs’ 3D calculation results meet the calculation accuracy, the grid-independence of mesh size is verified in this paper. With the same geometric parameter settings and boundary condition settings, different mesh sizes are selected to obtain the curves of total mass flow and total pressure recovery coefficient of Hole Type RVABI, as shown in Figure 4. Total pressure recovery coefficient σ is defined as follows:
where m64 is the outlet mass flow.
Figure 3.
RVABIs computational grid.
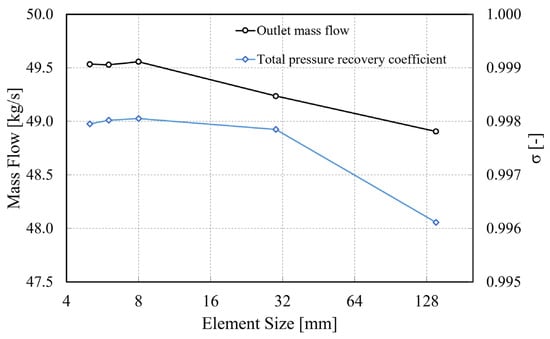
Figure 4.
Grid independence verification.
From the figure, when the mesh size is less than 6mm, there is no significant effect on the overall performance parameters of RVABIs with the increase in the grid number (mesh size decreases). The final number of grid cells in the computational domain is about 900,000 under this grid parameter. All the examples cited in this paper ensure that y+ is close to 1 to satisfy the requirements of the SST model.
In order to obtain the boundary conditions of RVABIs under the real engine operation, so as to reasonably evaluate the operating characteristics of different configurations of RVABIs under real engine operation, an ACE 0D model is built in this paper. The ACE is a double bypass configuration with an adaptive fan, as shown in Figure 5. After the expansion of the turbines, the core flow is mixed with the bypass flow from the rear fan in the RVABI.
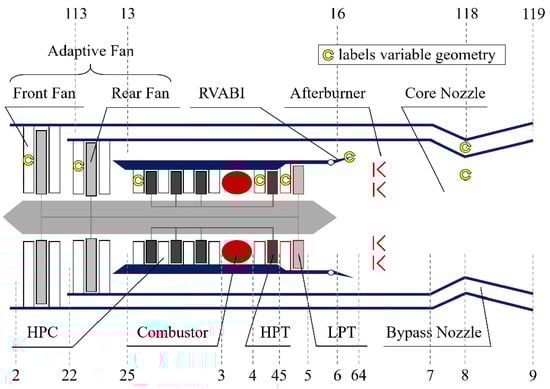
Figure 5.
Configuration of chosen ACE.
The calculation of the ACE 0D simulation model includes the design point calculation and off-design point calculation. The design point calculation needs to calculate the engine performance parameters under the selected design parameters under the given engine inlet conditions and key design parameters of each component. At the same time, the key feature area (e.g., nozzle throat cross section area) or characteristic map scaling factor (e.g., the characteristic map scaling factor of the impeller mechanical components) of the components for the off-design point calculation is obtained. In this paper, the ACE design point calculation is selected under the standard sea level condition (altitude is 0km, Mach number is 0). The design point parameters are selected as shown in Table 1.

Table 1.
Selection of ACE design point parameters.
The off-design point calculation is to determine the operating point characteristics of each component under the given engine inlet conditions and control laws to meet the matching requirements of the engine and output the engine performance parameters. For the ACE configuration in this paper, the low-pressure shaft physical speed NL is selected as the control law to ensure that the number of iterative variables and control equations are equal.
Setting ACE NL as 100%, 90%, and 80% for off-design point calculation, respectively, the inlet total temperature and total pressure of the mixer model in the ACE 0D model are extracted in Table 2, which are used as the boundary conditions for the 3D simulation of RVABIs. Based on the above method, the RVABI simulation boundary conditions under three engine conditions are obtained, which can comprehensively evaluate the operating characteristics of different configurations of the RVABI, and at the same time can study the trend of the operating characteristics of the RVABI under the environment of the ACE.
Table 2.
Mixer model boundary condition extracted in ACE 0D model.
2.3. Verification of the Simulation Method
The experiments of the two-dimensional (2D) slot nozzle ejector by Gerald B. Gilbert et al. [30] will be used for simulation, which will adopt the simulation method selected in this paper and be compared with the experimental results. Figure 6 and Figure 7 show the 2D slot nozzle ejector geometry for this experiment and the simulation computational grid.
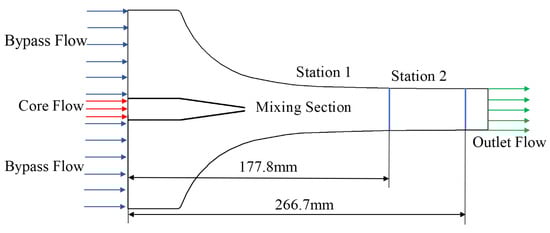
Figure 6.
Slot nozzle ejector model sketch.
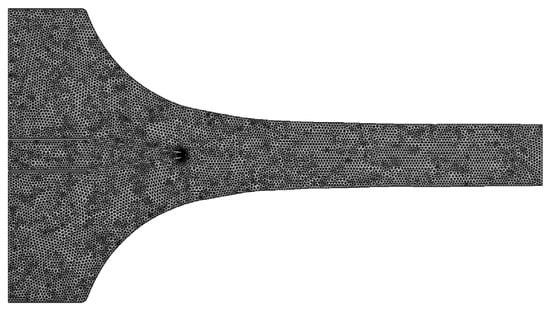
Figure 7.
Slot nozzle ejector computational grid.
The numerical 3D simulation method setting is consistent with the aforementioned case. The boundary conditions are consistent with the test. The simulation results are compared in Figure 8, which shows the velocity distribution of two cross sections with distances from the core flow nozzle of 177.8 mm and 266.7 mm in CFD simulation results and test results. As observed across both cross sections, the simulation results show good agreement with the experimental data. While minor discrepancies may be attributed to factors such as experimental measurement uncertainties and inherent CFD numerical errors, the overall deviations remain within an acceptable range, thereby verifying the reliability of the three-dimensional numerical simulation method employed in this study.
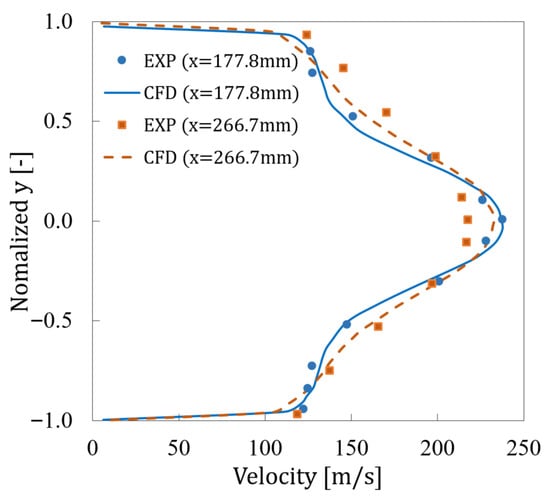
Figure 8.
Verification of the simulation method.
3. Comparison of RVABIs Under Fixed Geometry
3.1. Evaluation Criterion
In order to evaluate the operating characteristics of different configurations of RVABI, it is necessary to select a reasonable evaluation criterion to assess their performance. In this paper, the following factors are selected to evaluate the performance of RVABIs of different configurations.
- Adjustable range of bypass ratio BPR
The adjustable range of the bypass ratio refers to the range of the bypass ratio under fixed boundary conditions by adjusting the RVABI valve opening degree VO from 0% to 100%. Specifically, the maximum bypass ratio corresponds to 100% VO and the minimum bypass ratio corresponds to 0% VO. For the ACE, a larger adjustable range of the bypass ratio of RVABIs means that the ACE has a wider range of variable geometry adjustment strategies and higher flexibility, so the ACE has a wider range of operating conditions.
- 2.
- Total pressure recovery coefficient σ
The total pressure recovery coefficient is an index used to evaluate the mechanical energy loss when the gas flows through the RVABI. The reduction in the total pressure recovery coefficient will affect the thrust and fuel consumption performance of the ACE. Therefore, the RVABI should have as high total pressure recovery coefficient as possible. For the ACE, a higher total pressure recovery coefficient of the RVABI means that the ACE has a lower pressure loss, and the ACE has a lower specific fuel consumption and better economy.
- 3.
- Thermal mixing efficiency η
Thermal mixing efficiency is an index used to evaluate the RVABI’s two streams of air mixing effect that reflects the degree of temperature distortion of the exit cross section. Frost T H et al. [31] in 1966 first put forward the thermal mixing efficiency formula for evaluating the effect of the two streams of fluid mixing. This paper adopts an improved Frost thermal mixing efficiency formula [32]:
where Tt64 is the total temperature of the outlet section, Tt16 is the total temperature of the bypass flow inlet section, Tt6 is the total temperature of the inlet core flow section, and TtMix is the mass-averaged total temperature of the core and bypass airflow mixing sufficiently. TtMix can be calculated by the following formula:
For the ACE, a higher thermal mixing efficiency of the RVABI means that a smaller RVABI length can be selected to allow the RVABI outlet to achieve the requirement of the mixing effect, so that ACE can be relatively a smaller axial size and weight.
In order to reasonably compare and analyze the flow field characteristics and operating performance of different configurations of the RVABI, the following requirements should be met:
- (1)
- The external geometric parameters of the three configurations of the RVABI are consistent, including the inlet length Lin, mixing length Lmix, diameter D, etc., of the RVABI.
- (2)
- The boundary conditions of the three configurations of the RVABI are the same, including core and bypass flow inlet total temperature, total pressure, and outlet static pressure.
- (3)
- Compare the characteristics of the three configurations of the RVABI when BPR is consistent. When comparing different configurations of the RVABI, the geometrical adjustment mechanism should be changed to make different configurations of the RVABI have the same BPR. And the flow fields of different configurations of the RVABI are analyzed on this basis.
3.2. Comparison of Flow Field
The selected conditions for flow field comparison are the boundary conditions corresponding to 90% NL, and the valve of each RVABI is adjusted so that the bypass ratio is 0.25.
As shown in Figure 9, the Mach number distribution of the meridional flow field of RVABIs is shown. It can be seen that the flow field Mach number distribution of three configurations of the RVABI is basically the same in general. The bypass flow inlet Mach number is lower than 0.1, while the core flow inlet Mach number is higher, up to about 0.3. The reasons for the above phenomenon are as follows:
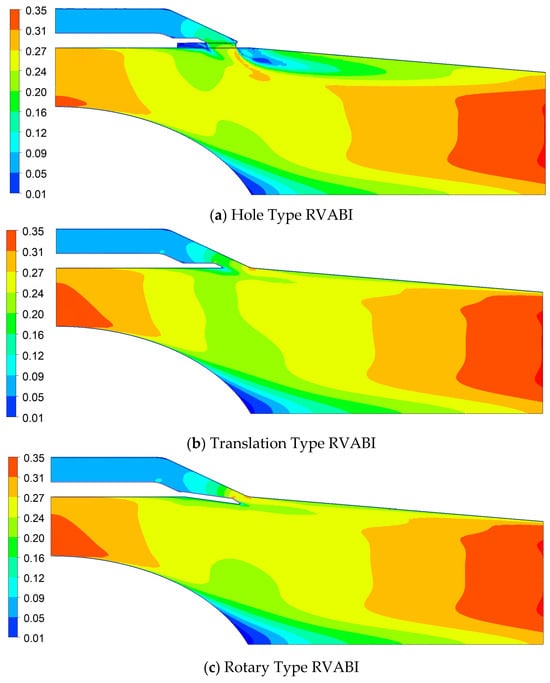
Figure 9.
Mach number distribution of the meridional for the RVABIs.
The mixing confluence of the two streams needs to meet Kutta’s law, i.e., the static pressures of the two streams are close to equal. At the same time, from the inlet of core and bypass flow to the confluence, the loss along the way is low and can be ignored. It can be considered that the total pressure at the confluence of core and bypass flow is equal to the total pressure at the inlet of core and bypass flow, respectively. Under the selected boundary condition, the total pressure of the core flow inlet of the RVABI is almost equal to the total pressure of the bypass flow inlet; therefore, the total pressure of the core flow at the confluence is also equal to the total pressure of the bypass flow. Consider the following equation:
It can be seen that at the confluence of core and bypass flow, the core flow Mach number is equal to the bypass flow Mach number. On the other hand, the core flow duct is gradually expanding in the flow direction. In the expanding subsonic duct, the Mach number decreases gradually in the flow direction. Thus, the core flow inlet Mach number is larger than the core flow Mach number at the confluence. The bypass flow duct is close to an equal-area duct before the confluence, but the effective flow area decreases instantly at the confluence. Thus, the bypass flow Mach number increases, so the Mach number of the entrance of the bypass flow should be smaller than the Mach number of the bypass flow at the confluence. In summary, the Mach number of the core flow is higher than the Mach number of the bypass flow.
After the confluence of the airflows, the airflow shear zone is formed. The flow duct gradually narrows, along with flow direction. It can be seen that the Mach number gradually increases in the exit to reach about 0.35, and the flow field Mach number distribution along the radial direction tends to be more uniform.
The Mach number distributions of different configurations of RVABI flow field are quite different at the confluence of the airflows. Especially for the Hole Type RVABI configuration, there is an obvious low Mach number region near the confluence, which indicates that vortex has appeared here, while there is no vortex at the confluence for the other two configurations.
3.3. Comparison of Thermal Mixing Efficiency
Figure 10 shows the thermal mixing efficiency of mixing section along the flow direction coordinate for the three configurations of the RVABI. Where the definition of different cross sections along the flow direction coordinates is referenced to the x/L axis in Figure 2. It can be seen that the thermal mixing efficiency of the Hole Type RVABI is significantly higher than that of the Translation Type RVABI and the Rotary Type RVABI, while the thermal mixing efficiency of the Translation Type RVABI and the Rotary Type RVABI are very close. At the selected RVABI boundary condition, the outlet thermal mixing efficiency of the Translation Type RVABI is lower by 48.3% and that of the Rotary Type RVABI is lower by 50.3% compared to the Hole Type RVABI.
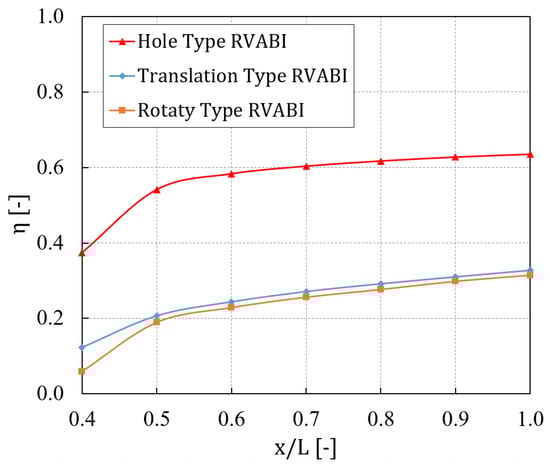
Figure 10.
Variation curve of thermal mixing efficiency of the RVABIs, along with flow direction.
The thermal mixing efficiency is mainly determined by two factors:
On the one hand, it is determined by the contact area of the two airflows. The larger the contact area is, the greater the momentum and energy exchange rate between the two airflows, and thus the greater the thermal mixing efficiency will be. The contact area between the core and bypass flow of the Hole Type RVABI is mainly determined by the total circumference of the holes, while the Translation Type RVABI and the Rotary Type RVABI contact areas are mainly determined by the circumference of the circle of confluence. The circumference of holes is obviously larger than that of the circle of confluence, so the contact area between the core and bypass flows of the Hole Type RVABI is larger than that of the other two configurations. From this perspective, the thermal mixing efficiency of the Hole Type RVABI is greater than the other two configurations.
On the other hand, the vortex system in the flow field will greatly enhance the mixing effect. The vortex systems of the three configurations of the RVABI will be analyzed in the following.
Vortex is usually associated with localized characteristics of fluid rotation. Streamwise vortex and azimuthal vortex are the two different types that characterize vortex flow.
Streamwise vortex is the vortex in which the axis of the vortex rotation is in the same direction as the main flow. In a flow field, streamwise vortex is usually associated with flow separation within the boundary layer. The streamwise vortex plays a key role in enhancing turbulent mixing and increasing momentum exchange within the boundary layer.
Azimuthal vortex is the vortex in which the direction of the axis of the vortex rotation is perpendicular to the direction of the main flow. This type of vortex is usually generated in the lateral motion of a fluid.
The streamwise vortex and azimuthal vortex can be defined by the vorticity. Vorticity is a physical quantity that describes the rotation of a fluid microcosm, and it is usually calculated based on the spatial derivative of the fluid velocity field. The following equation is the dimensionless definition of streamwise vortex:
where VCore is the core flow inlet mass-averaged velocity of the RVABI, l is the characteristic length of the RVABI, and w, v are the velocity components in the z-axis and y-axis directions, respectively.
Figure 11 gives the streamwise vortex distribution of the three configurations of the RVABI in the mixing section at x/L = 0.4. It can be seen that the Hole Type RVABI has a larger streamwise vortex with a maximum vortex intensity of more than 100. And the streamwise vortex has a kidney shape, which is periodically distributed along the circumference. The streamwise vortex is adherent to the wall, while the other two configurations almost do not have the streamwise vortex. The reason for the above phenomenon is analyzed as follows:
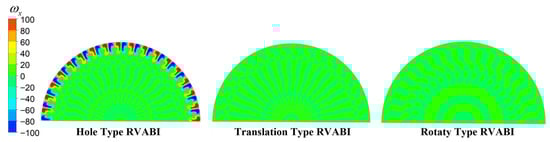
Figure 11.
Distribution of streamwise vortex of RVABIs in the mixing section at x/L = 0.4.
The bypass flow enters the core flow after passing through the rectangular holes. It undergoes a process of sudden expansion of the flow duct. At the same time, due to the boundary layer of rectangular holes, the fluid microcosm will rotate to the two sides under the action of frictional torque after flowing out of the rectangular holes. Then, the streamwise vortex is generated. It can be seen that the streamwise vortex is generated due to the friction moment of the two edges parallel to the axial direction in the rectangular holes and the action of the flow duct expansion. There is no mechanism for generating the streamwise vortex in the other two configurations, so only the Hole Type RVABI generates the streamwise vortex.
The following equation is the dimensionless definition of the azimuthal vortex:
where VCore is the core flow inlet mass-averaged velocity of the RVABI, l is the characteristic length of the RVABI, and ωy, ωz are the vorticity in the y-axis and z-axis directions, respectively, as determined by the following equation:
The azimuthal vortex distributions of the three configurations of the RVABI in the mixing section at x/L = 0.4 are given in Figure 12. It can be found that the azimuthal vortex intensity and distribution range of the Hole Type RVABI is much larger than the other two configurations. The azimuthal vortex of the Hole Type RVABI is in the shape of hollow circular holes periodically distributed along the circumference, while the azimuthal vortex of the other two configurations is in the shape of a circular ring. Meanwhile, it can be found that a certain intensity of azimuthal vortex is also generated at the center of the three configurations of the RVABI, which is caused by the continuous expansion of the flow duct under the action of the conical inner body. The reason for the above phenomenon is analyzed:
Figure 12.
Distribution of azimuthal vortex of RVABIs in the mixing section at x/L = 0.4.
The difference between the velocity of the bypass flow and core flow is large in the confluence, including the magnitude and direction of the velocity. Therefore, a velocity shear zone is formed after the confluence of the two airflows. The velocity gradient is large, and the larger velocity fluid microcosm drives the smaller velocity fluid microcosm to move and generate friction torque, and then the azimuthal vortex is generated. Therefore, the shape and intensity of the azimuthal vortex is determined by the shape and intensity of the velocity shear zone. Since the shape of the velocity shear zone is determined by the core and bypass flow interface, the shape of the azimuthal vortex is close to the shape of the rectangular hole periodically distributed along the circumference at the core and bypass flow interface of the Hole Type RVABI. Thus, the shape of the azimuthal vortex is shown as hollow circular holes periodically distributed along the circumference. In the other two configurations, the interface of the core and bypass flow is a circular ring, so the shape of the azimuthal vortex remains a circular ring. Meanwhile, the core and bypass flow interface area of the Hole Type RVABI is larger than that of the other two configurations, so the intensity and range of the velocity shear zone generated are larger than those of the other two configurations. Therefore, the intensity and range of the azimuthal vortex of the Hole Type RVABI should be larger than those of the other two configurations.
From the above analysis, it can be seen that the streamwise vortex intensity and azimuthal vortex intensity of the Hole Type RVABI are larger than those of the other two configurations. As the flow develops, the streamwise vortex and the azimuthal vortex will continuously suck the surrounding fluid for momentum and energy exchange. Thus, from this point of view, the thermal mixing efficiency of the Hole Type RVABI is also larger than that of the other two configurations.
In addition, according to Figure 10, it can be seen that the thermal mixing efficiency of the three configurations of the RVABI is increasing along the flow direction. The thermal mixing efficiency grows faster at the beginning of the mixing, gradually decreases with the development of the flow, and finally, tends to grow linearly and slowly. In order to explain this phenomenon, it is necessary to study the development process of the vortex along the flow direction. From the results calculated according to the simulation, the maximum streamwise vortex intensity of the Hole Type RVABI at the position x/L = 0.4 is about 160, while the maximum azimuthal vortex intensity is about 420. It is evident that the azimuthal vortex plays a significant role in promoting the core and bypass flow mixing. Take the Hole Type RVABI for example; the distribution of azimuthal vortex along the flow direction is given in Figure 13, and the position of different cross sections along the flow direction is referenced to the x/L axis in Figure 2.
Figure 13.
Evolution of azimuthal vortex intensity of Hole Type RVABI along the flow direction.
At x/L = 0.4, the azimuthal vortex is in the shape of hollow circular holes against the wall, which have similarities with the shape of rectangular holes. They are periodically distributed along the circumference, while the azimuthal vortex intensity is quite large at this time. When the fluid develops to the position at x/L = 0.6, the azimuthal vortex begins to diffuse to the center, and the hollow circular holes-like azimuthal vortex is broken into crescent shapes. The azimuthal vortex intensity decreases dramatically with the continuous dissipation of energy. At x/L = 0.8 position, the azimuthal vortex further breaks into elliptical shapes in periodic conjunction. The azimuthal vortex intensity continues to decrease but at a reduced rate. At x/L = 1.0, i.e., the exit of the RVABI, the azimuthal vortex is completely connected in the form of a circle. The azimuthal vortex intensity decreases by a small amount, which tends to be stabilized and kept in a small state.
According to the above analysis, it can be seen that the thermal mixing efficiency growth rate is faster at the beginning of mixing. This is because the azimuthal vortex intensity is larger at this time. With the development of the flow, the intensity of the azimuthal vortex along the flow direction is the first to fall sharply, the growth rate of thermal mixing efficiency is gradually reduced, and finally, the azimuthal vortex intensity tends to stabilize and remain in a small state. So, the thermal mixing efficiency tends to grow linearly and slowly finally.
3.4. Comparison of Total Pressure Recovery Coefficient
Figure 14 shows the total pressure recovery coefficient along the flow direction for the three configurations of the RVABI. From this figure, it can be seen that the total pressure recovery coefficient of the core and bypass flow in the three configurations of the RVABI are almost identical in the inlet section. The total pressure recovery coefficient of the core flow shows a slow decreasing trend with the flow direction, and the total pressure recovery coefficient of the bypass flow decreases faster with the flow direction. This is due to the fact that the core flow duct is relatively smooth, with only the total pressure loss due to frictional resistance. However, the bypass flow duct is relatively curved, including some obvious turning points, at which reflux will be generated. Thus, the total pressure loss in the bypass flow duct comes from both frictional resistance and reflux.
Figure 14.
Variation curve of total pressure recovery coefficient of RVABIs along the direction of flow.
After the mixing of the core and bypass flow, the total pressure recovery coefficient of the Hole Type RVABI shows a cliff-like decrease and continues to show a rapid decreasing trend until x/L = 0.6, while the total pressure recovery coefficient shows a slow decreasing trend after x/L = 0.6. This is due to the fact that, in the early stage of mixing, the vortex intensity of the Hole Type RVABI is larger, and the core and bypass flow are rapidly mixing. At that time, the friction intensity between the fluid microcosms is larger, which results in a larger energy loss. Thus, energy dissipation caused by the vortex system occupies a major position. With the continuous dissipation of the vortex along the flow direction, the vortex density gradually weakens and tends to stabilize, so the energy dissipation rate also slows down accordingly. Therefore, the total pressure recovery coefficient tends to decrease slowly and linearly; at this time, energy dissipation caused by friction loss occupies the main body.
For the other two configurations of the RVABI, after the core and bypass flow started mixing, the total pressure recovery coefficient did not fall off a cliff. The total pressure recovery coefficient shows a slow downward trend, and finally, the two configurations of the total pressure recovery coefficient of the RVABI are almost equal. The total pressure recovery coefficient of the Hole Type RVABI is significantly lower than that of the other two types of configurations. The total pressure recovery coefficient is calculated as 0.49% higher for the Translation Type RVABI and 0.46% higher for the Rotary Type RVABI compared to the Hole Type RVABI. This is due to the fact that the vortex density of the other two configurations of the RVABI are lower compared to the Hole Type RVABI, and the energy dissipation after mixing is still dominated by friction losses. Thus, the total pressure recovery coefficient does not drop off a cliff after mixing in the other configurations.
4. Comparison of RVABIs Under Variable Geometry
This section investigates the variable geometry characteristics of different RVABI configurations across various engine speeds within the ACE environment. While complex coupling interactions exist between the RVABI and the overall engine during operation, this study adopts a decoupling method for computational simplification. Specifically, the influence of different RVABI configurations on their boundary conditions within the ACE environment is not considered. Consequently, identical boundary conditions are assumed for all three RVABI configurations at each operating point.
To validate the decoupled approach, a multi-fidelity coupling simulation between the ACE 0D model and the high-fidelity RVABIs models is conducted (as the coupling simulation method falls beyond the scope of this study, detailed discussion is not provided here). Results indicate a ≤1.5% deviation between RVABI boundary conditions from coupled simulations and mixer boundary conditions from the ACE 0D model under the same operating points and bypass ratios. This confirms negligible sensitivity of the matching boundary conditions to either RVABI configuration or mixer modeling, thereby validating decoupling method reliability. However, the decoupled method may yield significant deviations under certain extreme operating conditions, where the coupled method remains essential.
The boundary conditions for the three RVABI configurations are set according to the mixer model boundary conditions of the ACE at 100%, 90%, and 80% NL, as detailed in Table 2. By systematically varying the RVABI valve opening (VO) from 0% to 100%, the variable geometry performance of each configuration under these different boundary conditions is obtained.
4.1. Comparison of Adjustable Range of Bypass Ratio
Figure 15 shows the comparison of the adjustable range of the bypass ratio BPR for the three configurations of the RVABI under three boundary conditions. It can be seen that the bypass ratio of the three configurations increases as the valve opening increases, but the magnitude of the change in bypass ratio varies among different configurations and boundary conditions. The Hole Type RVABI has the smallest adjustable range of the bypass ratio, followed by Translation Type RVABI, and the Rotary Type RVABI has the largest adjustable range of the bypass ratio. Taking the 90% NL condition as an example, the adjustable bypass ratio range of the Hole Type RVABI is 0~0.39, and that of the Translation Type RVABI is 0~0.53; compared with the Hole Type RVABI, the adjustable range of the bypass ratio is improved by 36%; and the Rotary Type RVABI has the largest adjustable range of the bypass ratio. The adjustable bypass ratio of the Rotary Type RVABI is 0~0.89, and the adjustable range of the bypass ratio of the Rotary Type RVABI is improved by 128% compared with that of the Hole Type RVABI. The reason for this phenomenon is analyzed as follows:
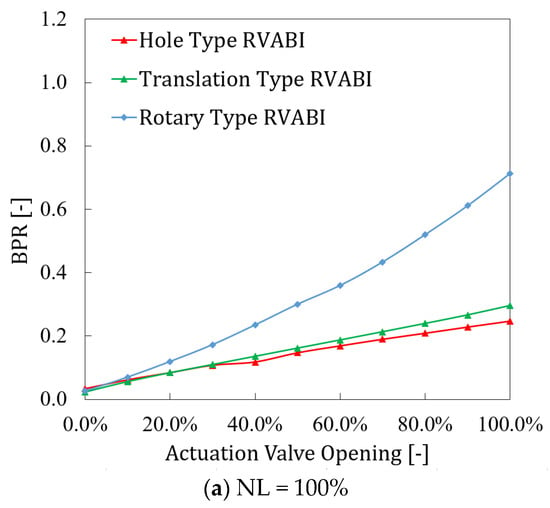
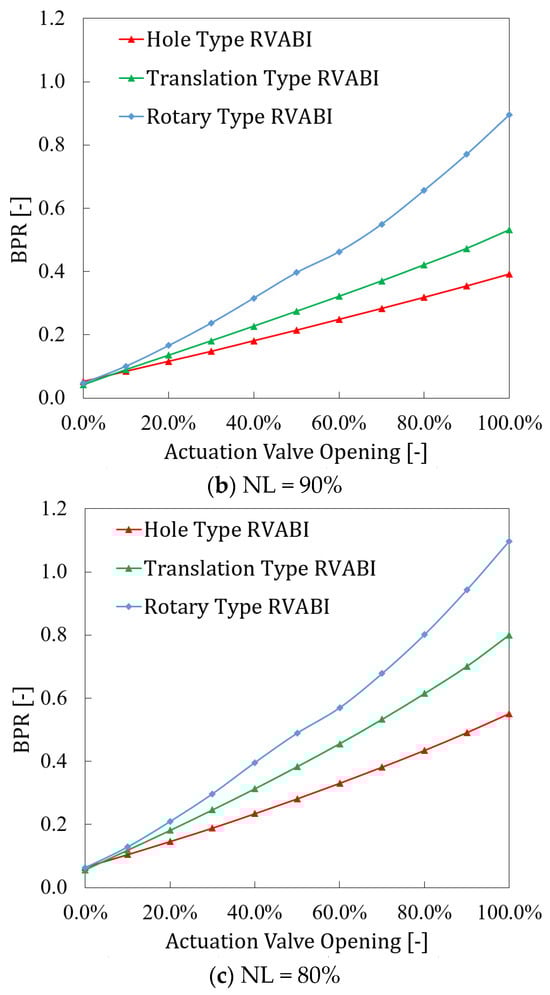
Figure 15.
Comparison of the bypass ratio adjustable range of RVABIs under three boundary conditions.
Under a fixed boundary condition, the bypass ratio is determined by the relationship between the effective flow area of the core and bypass flow. Increasing the effective flow area of the bypass flow or decreasing the effective flow area of the core flow will increase the bypass ratio of the RVABI. For the Hole Type RVABI, the effective flow area of the core flow is basically considered to be unchanged, while the effective flow area of the bypass flow is determined by the size of the rectangular holes on the ring baffle and VO of the valve. The larger the area of the rectangular holes and the larger the opening of the valve, the larger the effective flow area of the bypass flow and the larger the bypass ratio is. For Translation Type RVABI, the core flow effective circulation area is basically considered to be unchanged, and the bypass effective flow area is only determined by the VO of the valve. Without the restriction of the ring baffle on the effective circulation area, the maximum effective circulation area of the bypass flow can be larger than that of the Hole Type RVABI. Therefore, the adjustable range of the bypass ratio of the Translation Type RVABI is larger than that of the Hole Type RVABI. For the Rotary Type RVABI, with the ring hinge choke plate opening towards the core flow, the effective flow area of the bypass flow increases, and that of the core flow decreases, which makes the maximum bypass ratio of the Rotary Type RVABI increase greatly. Therefore, the adjustable range of the bypass ratio of the Rotary Type RVABI is larger than that of the Translation Type RVABI.
During the change in NL from 100% to 80%, the max adjustable bypass ratio of the three configurations is shown in Table 3. As can be seen, the adjustable range of BPR of the Hole Type RVABI increases by 129% from 100% NL to 80% NL, while the adjustable range of BPR of the Translation Type RVABI increases by 166% from 100% NL to 80% NL, which is the largest range of increase. The adjustable range of BPR of the Rotary Type RVABI increases by 56% from 100% NL to 80% NL. The bypass ratio adjustable range of all three configurations increases from 100% NL to 80% NL, which means that the bypass ratio adjustability of all three configurations of ACE RVABI improve at lower NL, with the Translation Type RVABI showing the greatest improvement.
Table 3.
Max adjustable bypass ratio for RVABIs under different boundary conditions.
4.2. Comparison of Thermal Mixing Efficiency Under Variable Geometry Adjustment
The thermal mixing efficiency η versus bypass ratio BPR for the three configurations of the RVABI are given in Figure 16 at the three boundary conditions. Taking the bypass ratio as the horizontal coordinate, the performance of different configurations of the RVABI can be compared under the same bypass ratio. From the figure, it can be found that the thermal mixing efficiency of the three configurations of the RVABI is at a high level when the bypass ratio is relatively small. The thermal mixing efficiency of the three configurations of the RVABI is reduced with the increase in the bypass ratio. The thermal mixing efficiency is reduced very quickly in the beginning, and then it is reduced at a slower rate to stabilize. The reason for this phenomenon is analyzed as follows:
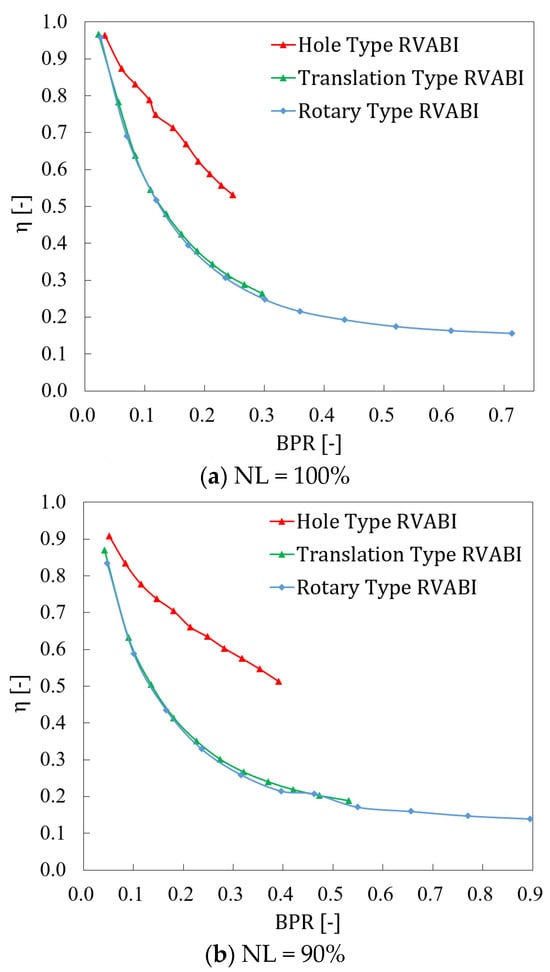
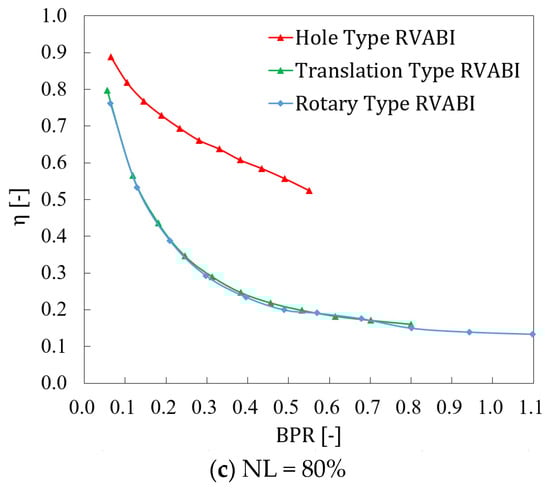
Figure 16.
Variation curve of thermal mixing efficiency versus bypass ratio of RVABIs under the three boundary conditions.
According to the definition, thermal mixing efficiency describes the degree of distortion of the RVABI outlet temperature field to a certain extent. When the bypass ratio is small and tends to 0, it can be approximated that there is almost only core flow fluid in the RVABI, and the outlet temperature distribution tends to be uniform. With the increase in bypass ratio, the core flow fluid flow gradually increases, there is more low-temperature bypass flow fluid and high-temperature core flow fluid mixing, the mixing difficulty rises, the mixing effect decreases, the degree of distortion of the temperature field at the exit of the RVABI intensifies, and therefore, the thermal mixing efficiency decreases rapidly. When the bypass ratio increases by enough, the two streams of fluid account for almost equal proportions of the total fluid. At that time, the increase in the bypass ratio on the reduction in thermal mixing efficiency reduces the degree of influence, so the curve tends to stabilize.
Under the same boundary condition and the same bypass ratio, the thermal mixing efficiency of the Translation Type RVABI and the Rotary Type RVABI are comparable. The thermal mixing efficiency of the Hole Type RVABI is always significantly larger than that of the Translation Type RVABI and the Rotary Type RVABI. This is due to the fact that the core and bypass flow fluid contact area and vortex intensity of the Hole Type RVABI are significantly larger than the other two configurations, as discussed earlier.
In addition, according to Figure 17, it can be found that under the same bypass ratio, the thermal mixing efficiency of the three RVABI configurations is higher at low NL than at high NL. The Hole Type RVABI has the most obvious thermal mixing efficiency improvement at low speeds, while the thermal mixing efficiency of the other two configurations does not change much. It can be seen that the thermal mixing efficiency of RVABIs is improved under the low NL of the ACE, and the Hole Type RVABI has the most significant thermal mixing efficiency improvement at low NL.
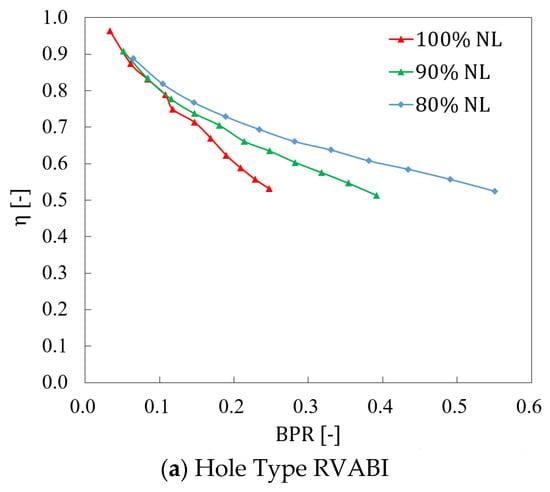
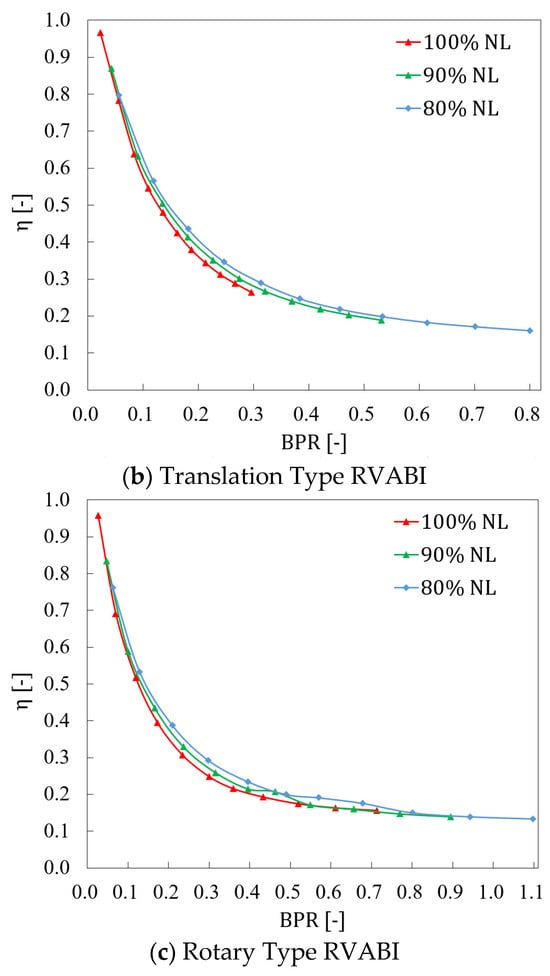
Figure 17.
Variation curve of thermal mixing efficiency with bypass ratio of RVABIs under the three boundary conditions.
4.3. Comparison of Total Pressure Recovery Coefficient Under Variable Geometry Adjustment
The total pressure recovery coefficient σ with bypass ratio BPR for the three configurations of the RVABI under three boundary conditions is presented in Figure 18. It can be seen that the total pressure recovery coefficient of the Translation Type RVABI is slightly higher than that of the Rotary Type RVABI and significantly higher than that of the Hole Type RVABI. The total pressure recovery coefficient of the Hole Type RVABI decreased rapidly with increasing bypass ratio, while those of the other two configurations of the RVABI showed a tendency of decreasing and then stabilized. And the decreasing magnitude was smaller than that of the Hole Type RVABI. The reason for this phenomenon was analyzed as follows:
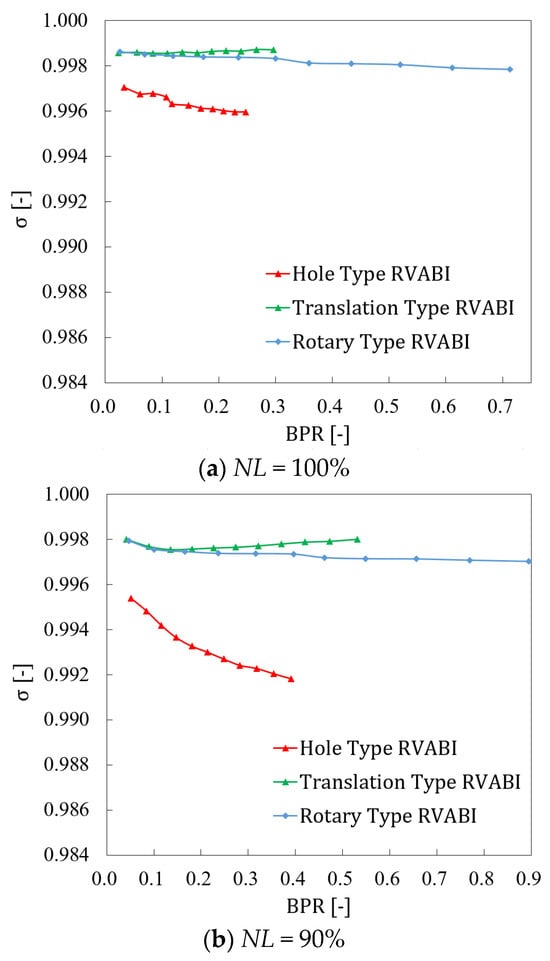
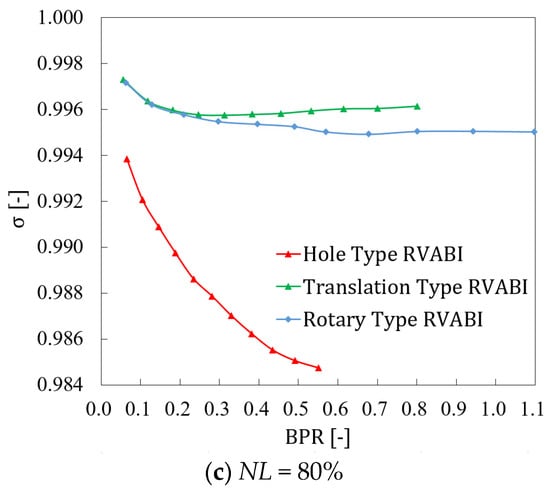
Figure 18.
Variation curve of total pressure recovery coefficient with bypass ratio of RVABIs under the three boundary conditions.
When the bypass ratio is small, the bypass flow is small, and it can be approximated that there is only core flow in the RVABI, and there is almost no mixing process. Therefore, the total pressure recovery coefficient decreasing caused by the vortex energy dissipation due to mixing can be ignored, and the reduction in the total pressure recovery coefficient is only considered as a factor of friction loss. Therefore, the total pressure recovery coefficient is higher when the bypass ratio is small. As the bypass ratio increases, the bypass mass flow increases, and the mixing process is not negligible. The vortex energy dissipation caused by the mixing process is dominant compared to the friction dissipation, the total pressure recovery coefficient decreases because the mixing process is enhanced, and the vortex energy dissipation increases with the increase in the bypass ratio. Since the vortex intensity of the Hole Type RVABI is significantly larger than the other two configurations, the total pressure recovery coefficient decreases significantly more for the Hole Type RVABI than the other two configurations. Subsequently, the vortex intensities of the Translation Type and Rotary Type RVABIs are gradually stabilized with the further increase in the bypass ratio, so the total pressure recovery coefficient is gradually stabilized. However, the total pressure recovery coefficient of the Hole Type RVABI is still decreasing because the vortex intensity is larger and decreases with the increase in bypass ratio.
In addition, by comparing the total pressure recovery coefficient of the three configurations under different boundary conditions, it can be found that the total pressure recovery coefficients of the RVABIs all decrease during the change in NL from 100% to 80%. The decrease in the total pressure recovery coefficient for the Hole Type RVABI is the largest. And the decrease in the total pressure recovery coefficient with the bypass ratio of the Hole Type RVABI is further accelerated in the low NL boundary condition. It can be seen that the total pressure recovery coefficients of the three configurations of the RVABI deteriorate at low NL condition, with the Hole Type RVABI having the most severe deterioration in the total pressure recovery coefficient.
Table 4 summarizes the comparison of key evaluation parameters for the three RVABI configurations. In summary, the Hole Type RVABI generates larger-scale vortices through its hole structure, which enhances the mixing of the core and bypass streams effectively. This contributes to a shorter mixing length, improved afterburner performance, and increased thrust benefit from mixing. Furthermore, the thorough mixing lowers the engine exhaust temperature, thereby reducing infrared radiation and enhancing infrared stealth capability [33]. Additionally, the reduction in exhaust temperature leads to a decrease in exhaust velocity. Since exhaust noise is proportional to the eighth power of exhaust velocity, this configuration also helps in mitigating noise emissions. However, these advantages come at the cost of intensified flow disturbances and a lower total pressure recovery coefficient, which may degrade overall engine performance under certain conditions. Therefore, the Hole Type RVABI is well-suited for engines prioritizing compact axial length, high afterburner performance, superior infrared stealth, and low exhaust noise.
Table 4.
Comparison of the main evaluation parameters of the RVABIs.
In comparison, the Translation Type RVABI offers a higher total pressure recovery coefficient, making it suitable for scenarios where engine fuel economy is a major concern. The Rotary Type RVABI provides a wide range of bypass ratio adjustability, ideal for applications demanding strong engine flow regulation capability, though it features the most complex variable geometry actuation mechanism.
5. Conclusions
In this paper, the operating characteristics and internal flow mechanisms of three RVABI configurations, including Translation Type, Rotary Type, and Hole Type, are compared and analyzed. Then, the applicable scenarios for the three configurations to be used in the ACE are summarized. The conclusions of the present study are drawn as follows:
- (1)
- The Hole Type RVABI has the largest contact area between the core and bypass flow and the highest vortex intensity, which leads to the highest thermal mixing efficiency and lowest total pressure recovery coefficient. The variable geometry of the Hole Type RVABI has the narrowest adjustable range of the bypass ratio.
- (2)
- Both the Translation Type and Rotary Type RVABIs have smaller contact areas between the core and bypass flow, while the vortex intensity of mixing flow in both is also lower, resulting in lower thermal mixing efficiency and a higher total pressure recovery coefficient compared with the Hole Type RVABI. The Translation Type RVABI has the medium adjustable range of the bypass ratio among the three configurations. The Rotary Type RVABI has the widest adjustable range of the bypass ratio.
- (3)
- For the operating conditions at 90% NL of the ACE, both the Translation Type and the Rotary Type RVABIs have approximately 50% lower thermal mixing efficiencies and 0.5% higher total pressure recovery coefficients compared to the Hole Type RVABI. In addition, compared to the Hole Type RVABI, the Translation Type RVABI has a 36% wider adjustable range of bypass ratios and the Rotary Type RVABI has a 128% wider adjustable range of bypass ratios.
- (4)
- With the operating condition changed from 100% NL to 80% NL, the adjustable range of the bypass ratio widens for all three configurations of the RVABI. The largest increase in the adjustable range of the bypass ratio was observed for the Translation Type RVABI. The thermal mixing efficiency increases while the total pressure recovery coefficient reduces for all three configurations of the RVABI. Among them, the Hole Type RVABI has the largest increase in thermal mixing efficiency and the largest decrease in total pressure recovery coefficient.
- (5)
- Overall, the thermal mixing efficiency of the Hole Type RVABI is highest among the three configurations, which is well-suited for engines prioritizing compact axial length, high afterburner performance, superior infrared stealth, and low exhaust noise. The total pressure recovery coefficient of the Translation Type RVABI is the highest among the three configurations, which is suitable for the application scenario preferring engine fuel economy. The adjustable range of the bypass ratio of the Rotary Type RVABI is the widest, which is suitable for the application scenario with higher requirements on engine flow regulation capability.
Author Contributions
Conceptualization, W.L. and W.Z.; methodology, B.W.; software, J.L. and W.K.; investigation, W.L. and L.J.; writing—original draft preparation, W.L.; writing—review and editing, W.Z., W.L. and B.W.; supervision, X.Z. All authors have read and agreed to the published version of the manuscript.
Funding
This research was funded by the National Major Science and Technology Project of China, grant number J2019-I-0021-0020.
Data Availability Statement
The data presented in this study are available on request from the corresponding author.
Conflicts of Interest
Author Lei Jin was employed by the company SinoHawk Technology Group Co., Ltd. The remaining authors declare that the research was conducted in the absence of any commercial or financial relationships that could be construed as a potential conflict of interest.
Abbreviations
The following abbreviations are used in this manuscript:
| ACE | Adaptive cycle engine |
| RVABI | Rear variable area bypass injector |
| 0D | Zero-dimensional |
| 2D | Two-dimensional |
| 3D | Three-dimensional |
| VABI | Variable area bypass injector |
| FVABI | Front variable area bypass injector |
| BPR | Bypass ratio of RVABI |
| σ | Total pressure recovery coefficient |
| D | Outer diameter of the bypass flow |
| L | Total length of RVABI |
| Lin | Inlet section length of RVABI |
| Lmix | Mixing section length |
| x/L | Labels for the cross section of the different positions along the flow direction |
| VO | valve opening degree |
| m | Mass flow |
| Tt | Total temperature |
| Pt | Total pressure |
| Ps | Static pressure |
| NL | The low-pressure shaft physical speed NL |
| CFD | Computational fluid dynamics |
| η | Thermal mixing efficiency |
| TtMix | Mass-Averaged Total Temperature of the core and bypass airflow mixing sufficiently |
| M | Mach number |
| k | Specific heat ratio |
| ωx | Streamwise vortex |
| ωn | Azimuthal vortex |
| VCore | The core flow inlet mass-averaged velocity of the RVABI |
| l | the characteristic length of the RVABI |
| u | velocity components in the x-axis directions |
| v | velocity components in the y-axis directions |
| w | velocity components in the z-axis directions |
| ωy | the vorticity in the y-axis directions |
| ωz | the vorticity in the z-axis directions |
References
- Westmoreland, J.S.; Howlett, R.A.; Lohmann, R.P. Progress with variable cycle engines. In Proceedings of the AIAA/SAE/ASME 15th Joint Propulsion Conference, Las Vegas, NV, USA, 18–20 June 1979; AIAA: Reston, VA, USA, 1979. [Google Scholar]
- Johnson, J.E. Variable Cycle Engines—The Next Step in Propulsion Evolution; Report No.: AIAA-1976-758; AIAA: Reston, VA, USA, 1976. [Google Scholar]
- Willis, E.A.; Welliver, A.D. Supersonic variable-cycle engines. In Proceedings of the 12th Propulsion Conference AIAA/SAE, Palo Alto, CA, USA, 26–29 July 1976; AIAA: Reston, VA, USA, 1976. [Google Scholar]
- Feng, Z.; Mao, J.; Hu, D. Review on the Development of Adjusting Mechanism in Variable Cycle Engine and Key Technologies. Aeroengine 2023, 49, 18–26. [Google Scholar]
- Tai, J.; Roth, B.; Mavris, D. Development of an NPSS Variable Cycle Engine Model; Report No.: 2005-1295; ISABE: Indianapolis, IN, USA, 2005. [Google Scholar]
- Zheng, J.C.; Tang, H.L.; Chen, M. Equilibrium running principle. analysis on an adaptive cycle engine. Appl. Therm. Eng. 2017, 132, 393–409. [Google Scholar] [CrossRef]
- Zheng, J.C.; Chen, M.; Tang, H.L. Matching mechanism analysis on an adaptive cycle engine. Chin. J. Aeronuat. 2017, 30, 706–718. [Google Scholar] [CrossRef]
- Chen, M.; Zhang, J.Y.; Tang, H.L. Interval analysis of the standard of adaptive cycle engine component performance deviation. Aerosp. Sci. Technol. 2018, 181, 179–191. [Google Scholar] [CrossRef]
- Jia, L.Y.; Chen, Y.C.; Cheng, R.H.; Tan, T.; Song, K. Designing method of acceleration and deceleration control schedule for variable cycle engine. Chin. J. Aeronuat. 2020.
- Kurzke, J.; Halliwell, I. Propulsion and Power: An Exploration of Gas Turbine Performance Modeling; Springer: Berlin/Heidelberg, Germany, 2018. [Google Scholar]
- Liu, Y.-H.; Zhang, S.-P.; Yang, X.; Xie, Y.; Shao, W.-R.; Wu, F. Effects of Cut Angles at Trailing Edge of Lobe on Aerothermodynamic Performance of Forced Mixing Exhaust System in Turbofan Engine. J. Propuls. Technol. 2013, 34, 734–740. [Google Scholar]
- Xiao, C.; Liu, Y.; Zhang, H. Effect of converging diverging mixing duct geometric parameters on performance of circularly lobed nozzle ejector. J. Aerosp. Power 1–9.
- Paterson, R.W. Turbofan mixer nozzle flow field—A benchmark experimental study. J. Eng. Gas Turbines Power 1984, 106, 692–698. [Google Scholar] [CrossRef]
- Werle, M.J.; Presz, W., Jr.; Paterson, R. Flow structure in a periodic axial vortex array. In Proceedings of the 25th AIAA Aerospace Sciences Meeting, Reno, NV, USA, 24–26 March 1987; p. 610. [Google Scholar]
- Sheng, Z.Q.; Huang, P.L.; Zhao, T.; Ji, J.Z. Configurations of lobed nozzles for high mixing effectiveness. Int. J. Heat Mass Transf. 2015, 91, 671–683, 25. [Google Scholar] [CrossRef]
- Sheng, Z.Q.; Yao, Y.; Xu, Y.H. Suggestions on investigations of lobed jet mixing. Aerosp. Sci. Technol. 2019, 86, 415–429. [Google Scholar] [CrossRef]
- Sheng, Z.Q. Jet mixing of lobed nozzles with spoilers located at lobe peaks. Appl. Therm. Eng. 2017, 119, 165–175. [Google Scholar] [CrossRef]
- Liu, R.; Li, Z.; Wang, Q.; Huang, Y.; You, Y. Numerical study of steady flow characteristics of a rear variable-area bypass injector with alternating area regulator. Chin. J. Aeronaut. 2024, 37, 180–198. [Google Scholar] [CrossRef]
- Xu, Z.; Li, M.; Tang, H.; Chen, M. A multi-fidelity simulation method research on front variable area bypass injector of an adaptive cycle engine. Chin. J. Aeronaut. 2022, 35, 202–219. [Google Scholar] [CrossRef]
- Wang, R.; Yu, X.; Zhao, K.; Liu, B.; An, G. Development and validation of a novel control-volume model for the injection flow in a variable cycle engine. Aerospace 2022, 9, 431. [Google Scholar] [CrossRef]
- Leng, Z.; Zhou, J. Numerical Investigation for Performance of Non-Axisymmetric Front Variable Area Bypasses Injector. J. Propuls. Technol. 2015, 36, 1465–1473. [Google Scholar]
- Song, F.; Zhou, L.; Wang, Z.; Lin, Z.; Shi, J. Integration of high-fidelity model of forward variable area bypass injector into zero-dimensional variable cycle engine model. Chin. J. Aeronaut. 2021, 34, 1–15. [Google Scholar] [CrossRef]
- Liu, B.; Jia, S.; Yu, X. Throughflow Calculation Method of Variable Cycle Engine Forward Variable Area Bypass Injector. J. Propuls. Technol. 2017, 38, 1689–1698. [Google Scholar]
- Zhang, B.; Liu, H.; Zhou, J.; Liu, H. Experimental research on the performance of the forward variable area bypass injector for variable cycle engines. Int. J. Turbo Jet Engines 2023, 40, 43–47. [Google Scholar] [CrossRef]
- Huang, G.; Chao, L.I.; Chen, X.I.A.; Qian, L.I. Investigations of entrainment characteristics and shear-layer vortexs evolution in an axisymmetric rear variable area bypass injector. Chin. J. Aeronaut. 2022, 35, 230–244. [Google Scholar] [CrossRef]
- Vdoviak, J.W.; McHugh, D.P. Variable Slot Bypass Injector System. U.S. Patent 5,694,767, 9 December 1997. [Google Scholar]
- Nash, D.O. Gas Turbine Engine Actuation System. U.S. Patent 5,136,840, 11 August 1992. [Google Scholar]
- Menter, F.R. Two-Equation Eddy-Viscosity Turbulence Models for Engineering Applications. AIAA J. 1994, 32, 1598–1605. [Google Scholar] [CrossRef]
- Tang, Y.; Wei, X.; Liu, Y. Hybrid RANS-LES Simulation of Rotor–Stator Interaction in a Compressor Stage Using a Grid-Adaptive Simulation Method. J. Turbomach. 2024, 147, 071001. [Google Scholar] [CrossRef]
- Gilbert, G.B.; Hill, P.G. Analysis and Testing of Two-Dimensional Slot Nozzle Ejectors with Variable Area Mixing Sections. NASA CR-2251; NASA: Washington, DC, USA, 1973. [Google Scholar]
- Frost, T.H. Practical bypass mixing systems for fan jet aero engines. Aeronaut. Q. 1966, 17, 141–160. [Google Scholar] [CrossRef]
- Xie, Y.; Liu, Y.H. A modified thermal mixing efficiency and its application to lobed mixer nozzle for aero-engines. Heat Transf. Res. 2011, 42, 317–335. [Google Scholar] [CrossRef]
- Zhao, M.; Zhu, H.; Qin, B.; Zhu, R.; Zhang, J.; Ghosh, P.; Wang, Z.; Qiu, M.; Li, Q. High-Temperature Stealth Across Multi-Infrared and Microwave Bands with Efficient Radiative Thermal Management. Nano-Micro Lett. 2025, 17, 1–15. [Google Scholar] [CrossRef]
Disclaimer/Publisher’s Note: The statements, opinions and data contained in all publications are solely those of the individual author(s) and contributor(s) and not of MDPI and/or the editor(s). MDPI and/or the editor(s) disclaim responsibility for any injury to people or property resulting from any ideas, methods, instructions or products referred to in the content. |
© 2025 by the authors. Licensee MDPI, Basel, Switzerland. This article is an open access article distributed under the terms and conditions of the Creative Commons Attribution (CC BY) license (https://creativecommons.org/licenses/by/4.0/).