Abstract
Micro-combustion-powered thermoelectric generators (μ-CPTEGs) combine the high energy density of hydrocarbons with solid-state conversion, offering compact and refuelable power for long-endurance electronics. Such characteristics make μ-CPTEGs particularly promising for aerospace systems, where conventional batteries face serious limitations. Their achievable performance hinges on how a swirl-stabilized flame transfers heat into the hot ends of thermoelectric modules. This study uses a conjugate CFD framework coupled with a lumped parameter model to examine how input power and equivalence ratio shape the flame/flow structure, temperature fields, and hot-end heating in a swirl combustor-powered TEG. Three-dimensional numerical simulations were performed for the swirl combustor-powered TEG, varying the input power from 1269 to 1854 W and the equivalence ratio from φ = 0.6 to 1.1. Results indicate that the combustor exit forms a robust “annular jet with central recirculation” structure that organizes a V-shaped region of high modeled heat release responsible for flame stabilization and preheating. At φ = 1.0, increasing Qin from 1269 to 1854 W strengthens the V-shaped hot band and warms the wall-attached recirculation. Heating penetrates deeper into the finned cavity, and the central-plane peak temperature rises from 2281 to 2339 K (≈2.5%). Consistent with these field changes, the lower TEM pair near the outlet heats more strongly than the upper module (517 K to 629 K vs. 451 K to 543 K); the inter-row gap widens from 66 K to 86 K, and the incremental temperature gains taper at the highest power, while the axial organization of the field remains essentially unchanged. At fixed Qin = 1854 W, raising φ from 0.6 to 1.0 compacts and retracts the reaction band toward the exit and weakens axial penetration; the main-zone temperature increases up to φ = 0.9 and then declines for richer mixtures (peak 2482 K at φ = 0.9 to 2289 K at φ = 1.1), cooling the fin section due to reduced transport, thereby identifying φ = 0.9 as the operating point that best balances axial penetration against dilution/convective-cooling losses and maximizes the TEM hot-end temperature at the fixed power.
1. Introduction
Micro-combustion-powered thermoelectric generators (μ-CPTEGs) are solid-state energy conversion devices based on the Seebeck effect. They offer numerous advantages, including compact size, low noise, no moving mechanical components, low maintenance requirements, and high reliability [1]. By directly converting the heat released from hydrocarbon fuel combustion into electricity, μ-CPTEGs provide much higher energy density than conventional batteries, making them highly promising for portable power supply applications [2]. In particular, their lightweight structure and long-term operational reliability make μ-CPTEGs attractive for UAVs and aerospace applications such as deep-space exploration, planetary surface missions, orbital operations, and other isolated environments. Prior studies have examined thermoelectric power for UAV onboard supply and micro-combustion-TE concepts under aerospace-relevant constraints, demonstrating the potential of compact, maintenance-free power sources for long-duration missions [3,4]. In the space domain, recent reviews highlight TEGs as complementary or alternative sources for CubeSats and small satellites, leveraging waste heat or dedicated heat sources and summarizing system-level design trade-offs in orbital environments [5,6]. Broader reviews of micro-combustion power systems also document advances in flame stabilization, combustor miniaturization, and system optimization that directly inform μ-CPTEG design for aerospace applications [7]. Despite their potential, the overall performance of μ-CPTEG is critically dependent on the design and quality of the combustor. Combustion stability, heat flux uniformity, and combustion efficiency directly influence the thermal input to the thermoelectric modules (TEMs) and thus play a decisive role in determining system output. Therefore, optimizing the combustor structure is essential for enhancing the energy conversion efficiency and practical viability of these systems [8].
Despite its potential advantages, the practical development of μ-CPTEGs is still hindered by several fundamental challenges. (i) The limited figure-of-merit (ZT) of commercially available Bi2Te3-based modules constrains the achievable thermoelectric conversion efficiency [9]. (ii) Significant parasitic heat losses, especially radiation from hot surfaces and conduction through structural supports, reduce the effective temperature difference across the TEMs and thus the overall system performance [10]. (iii) At the microscale, swirl-stabilized flames often suffer from local extinction and oscillatory anchoring, posing difficulties for maintaining stable and efficient heat delivery. Recognizing these persistent barriers highlights the importance of improved combustor-heat collector configurations and motivates ongoing research on enhancing flame stability, heat utilization, and thermoelectric conversion.
Building on this motivation, significant efforts have been devoted to the design of high-performance micro-combustors. For example, researchers at the Indian Institute of Technology Bombay have developed a series of micro-combustors, including three-step cylindrical micro-combustors [11,12], a dual micro-combustor [13], and planar stepped micro-combustors [14,15], all of which demonstrated notable improvements in output power and conversion efficiency. A research team from the University of Science and Technology of China developed a porous combustor-powered μ-CPTEG system capable of stable operation at ultra-lean conditions with an equivalence ratio as low as 0.46, highlighting excellent lean combustion characteristics [16]. Meanwhile, the group led by Zuo at Beijing Institute of Technology designed several porous micro-combustors and successfully implemented them into μ-CPTEG systems, achieving a maximum output power of 9.8 W and system efficiency exceeding 4% [17,18]. These high-performance combustors supply concentrated and stable heat fluxes that are efficiently transferred to the TEMs via advanced heat collectors, thereby significantly enhancing thermoelectric performance.
Among various combustor types, swirl combustors have received particular attention due to their ability to induce strong internal recirculation zones through angular momentum, which enhances fuel–air mixing, flame stability, and combustion intensity. In 2015, Shimokuri et al. at Hiroshima University developed a swirl combustor-driven μ-CPTEG that achieved an output of 8.1 W and an efficiency of 2.36%. Further optimization in 2017 led to improved performance with an output power of 18.1 W and an efficiency of 3.01% [19,20]. More recently, Rong Shen et al. at Zhejiang University of Science and Technology proposed a compact high-performance micro swirl combustor-based thermoelectric generator prototype. Under extreme, safe, and long-duration operating conditions, this system achieved output powers of 76.93 W, 69.58 W, and 56.21 W with corresponding efficiencies of 3.81%, 3.73%, and 3.29%, respectively, while maintaining a volume of only 863.65 cm3 and a weight of 2.470 kg [21]. Compared to Shimokuri’s earlier design, this prototype demonstrated substantial improvements in both power output and energy density, with emission levels comparable to domestic gas stoves, thereby showcasing excellent engineering feasibility and commercial potential. Collectively, these results underline the advantages of micro swirl combustors in improving combustion efficiency and thermal management, and their relevance for the advancement of microscale combustion-powered energy systems [22].
Earlier prototypes typically delivered only tens of watts with efficiencies generally below 3%, underscoring the challenge of achieving high output and efficiency simultaneously in μ-CPTEGs [23,24,25,26,27]. A recent porous-plate combustor design utilized flame-flame and flame-wall interactions to enhance heat flux and temperature uniformity, achieving 21.2 W output with 3.01% efficiency [28]. To date, it remains rare for direct combustion-powered μ-CPTEG to have successfully achieved both an output power above 50 W and a conversion efficiency exceeding 3.5%. In response to this challenge, the team led by Guoneng Li at Zhejiang University of Science and Technology recently proposed and experimentally validated a μ-CPTEG system that integrates a blower-assisted swirl combustor with an inverted T-shape heat collector [29]. This system successfully achieved a record output power of 76.3 W and a conversion efficiency of 4.11%, representing a significant advancement in the integrated design and optimization of combustor-collector systems.
While the experiments demonstrated the overall feasibility and record performance, they could not resolve the internal reacting-flow structure or the spatial distribution of the thermal field that governs TEM loading. Building on this configuration [29], the present numerical study complements the experiments by revealing the flame-anchoring pattern, quantifying temperature distribution, and clarifying how input power and equivalence ratio shape the thermal field, providing insights not accessible from measurements alone. These findings provide mechanistic understanding and engineering guidance for further optimization of μ-CPTEG systems.
2. Computational Methodology
2.1. Lumped Model Description
A three-dimensional lumped-parameter model was developed by integrating a swirl combustor, an inverted T-shaped heat collector, six commercial Bi2Te3-based TE modules, and two water coolers, with all geometries consistent with the experimental setup in Ref. [29] (Figure 1). To avoid the prohibitive cost of resolving each microscale TE leg while retaining the essential thermoelectric feedback on the global thermal field, the TE modules were homogenized as isotropic solid domains characterized by an effective thermal conductivity kTEM [29]. This approach captures the key coupled thermal-transport processes in thermoelectric conversion-Peltier effect, Joule heating, conduction, radiation, and convective heat transfer, providing a compact yet physically representative formulation.
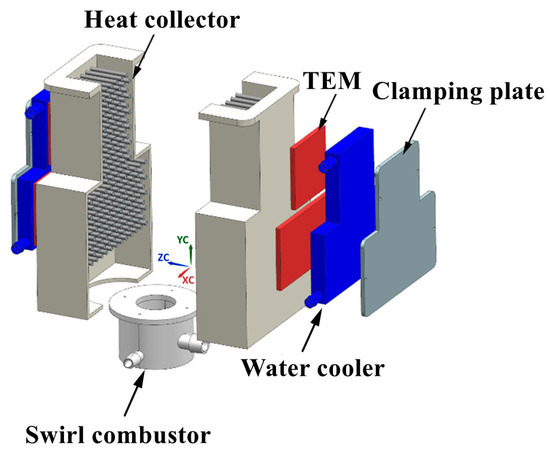
Figure 1.
Three-dimensional schematic of the micro swirl combustor-based TEG model.
The core of this lumped model is to reproduce the total heat flux through the TEMs, including not only direct conduction across the TE legs but also the additional heat flows associated with thermoelectric effects (Peltier and Joule) and the parasitic losses due to internal radiation and air conduction. The resulting effective conductivity , further accounting for the thermal resistance of the ceramic substrates was implemented in the conjugate heat-transfer framework of the CFD simulation.
First, the total heat flux through the TE legs, qh, was evaluated using Equation (1) [30], which explicitly accounts for Peltier heat, conductive flux, and Joule heating under the optimal electrical current determined by Equation (2) [31].
where N is the number of thermocouples, αP and αN are the Seebeck coefficients of the P-type and N-type TE legs, respectively. The hot-end and cold-side surface temperatures Th,ac and Tc,ac represent the actual hot-end and cold-side temperatures. kP, kN, ρP, and ρN are the thermal conductivities and electrical resistivities of the P-type and N-type legs. L and A are the length and cross-sectional area of each leg. VOC is the open-circuit voltage, and n accounts for electrical contact effects. The integral term describes the distributed internal resistance along the length of the TE leg. Th,ac and Tc,ac together with , required for evaluating the temperature-dependent , , and , were taken directly from the experimental measurements reported in Ref. [29].
To reflect the additional thermal effects induced by Peltier heat and Joule heat (referred to as “additional heat flux”), as well as the parasitic heat leak from internal air conduction and radiation (“additional heat leak”), an intermediate effective thermal conductivity of the TE legs is derived as:
where ATEM is the surface area of the TEM; β1 is the ratio of additional heat flux (Peltier and half Joule heat) to qh, and β2 is the ratio of additional heat leak (conduction and radiation losses) to total heat flux qTEM. The total heat flux qTEM considers all major contributions and is expressed as Equation (4) [32]:
where kair is the thermal conductivity of air, σ is the Stefan–Boltzmann constant, and ε is the emissivity of the ceramic substrate, taken as 0.4 [33]. Equation (4) serves as the basis for determining β2, and comprehensively accounts for conductive and radiative heat leak within the TE modules.
Finally, kTE,eff was combined with the thermal resistance of the ceramic substrates according to Equation (5) to obtain the overall effective thermal conductivity for the entire TE module.
where kc and Lc denote the thermal conductivity and thickness of the ceramic layers [34].
During the CFD simulations, the TEMs were thus modeled as solid domains with this experiment-informed . In this way, the lumped approach retains the temperature-dependent thermoelectric effects from measurements, while allowing prediction of the system-level heat-transfer and conversion behavior without explicitly resolving the individual P-type and N-type legs.
2.2. Computational Domain and Meshing
The computational domain is illustrated in Figure 2 and comprises both fluid and solid zones. The fluid zone includes a combustion chamber and a mixing chamber, while the solid zone consists of the swirl combustor, the pin-finned heat collector, the thermoelectric modules (TEMs), and the coolers. The material of the solid zones is uniform aluminum. The air and fuel inlets are specified as mass-flow inlets, with mass flow rates aligned with the experimental conditions reported in Ref. [29]. The outlet of the domain is defined as a pressure outlet with an operating pressure of 1 atm. Thermal interfaces between the hot-ends of the TEMs and the heat collector, as well as between the cold sides of the TEMs and the coolers, are modeled as coupled walls to ensure accurate heat transfer representation. The cold-side walls of the coolers are maintained at a constant temperature consistent with the experimental measurements in Ref. [29]. All other walls exposed to ambient air are treated as natural convection boundaries, with a convective heat transfer coefficient of 10 W/m2·K [35].
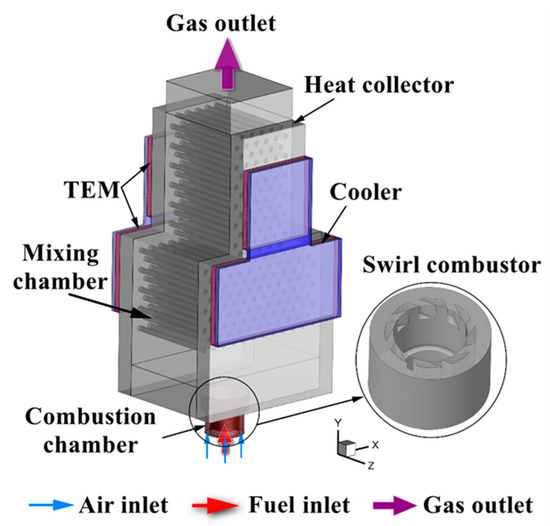
Figure 2.
Computational domain.
The computational domain was discretized using ANSYS FLUENT 14.0 Meshing with a polyhedral grid, as shown in Figure 3. To accurately resolve turbulent mixing, flame structures, and heat transfer details, local mesh refinement was applied to critical regions characterized by complex flow and steep temperature gradients, including the sudden expansion at the swirl combustor outlet, the vicinity of the pin fins, and the TEM contact surfaces. In contrast, coarser grids with gradual expansion were employed in regions with relatively uniform flow and temperature distributions, such as the distal sections of the heat collector, ensuring computational efficiency without compromising accuracy. Near-wall treatments were implemented using prismatic layers along the combustor walls and pin-fin surfaces to capture boundary-layer flow and heat transfer with high fidelity.
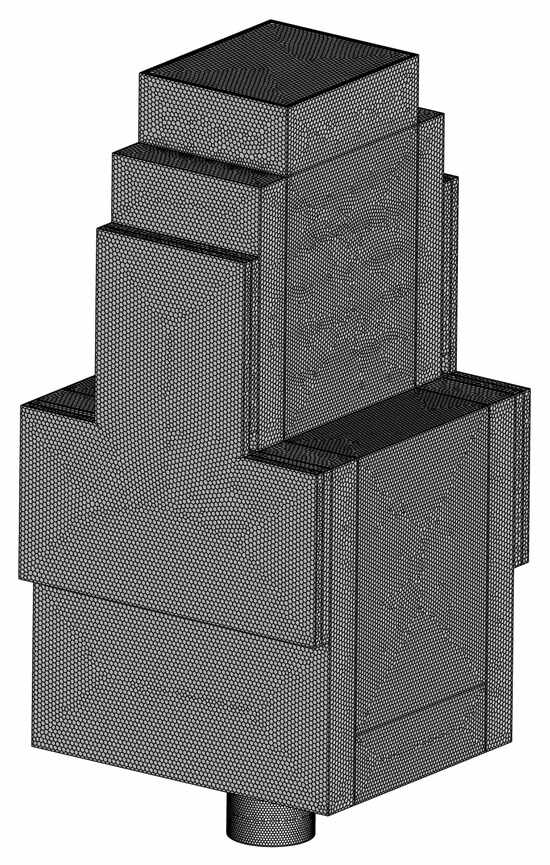
Figure 3.
Computational mesh.
A grid-independence study was conducted by using four successively refined grids consisting of 1.51 million, 3.76 million, 7.35 million, and 9.51 million cells. Figure 4 shows the axial temperature distribution in the combustion chamber predicted with these grids. The profiles converge as the mesh is refined, and the results for the 7.35 million grids and 9.51 million grids are nearly identical, indicating mesh-independent predictions. Therefore, a mesh size of 7.35 million provided a reliable balance between computational accuracy and efficiency.
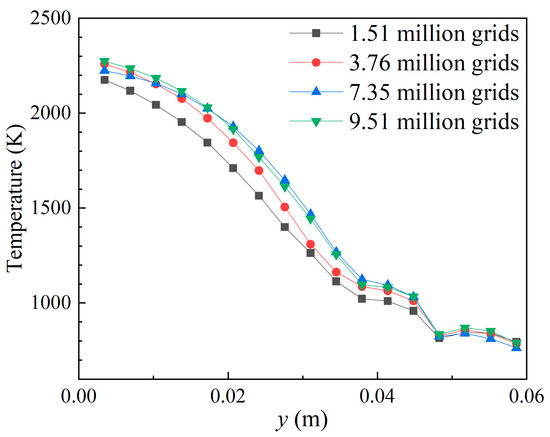
Figure 4.
Grid independence study.
2.3. Numerical Methods and Boundary Conditions
Three-dimensional steady-state Reynolds-Averaged Navier–Stokes (RANS) simulations were conducted in ANSYS FLUENT. The governing equations were solved using the finite-volume method with an implicit pressure-based solver. The swirling, turbulent flow was modeled with the Reynolds Stress Model (RSM) coupled with standard wall functions. Propane was employed as the fuel, and combustion was predicted using the Species Transport Model. Turbulence-chemistry interaction was described via the Finite-Rate/Eddy-Dissipation (FR/ED) approach, while a 2-step propane reaction mechanism was implemented to simulate the combustion process. The standard 2-step global propane-air reaction mechanism is described in Ref. [36], with the detailed Arrhenius coefficients presented in Table 1:

Table 1.
2-step global propane-air reaction mechanism [36]. Units are cm-sec-molc-kcal-Kelvins.
Thermal radiation effects were accounted for using the Discrete Ordinates (DO) model. The numerical methodology was validated against experimental data from our previous work [29], as depicted in Figure 5, demonstrating its reliability.
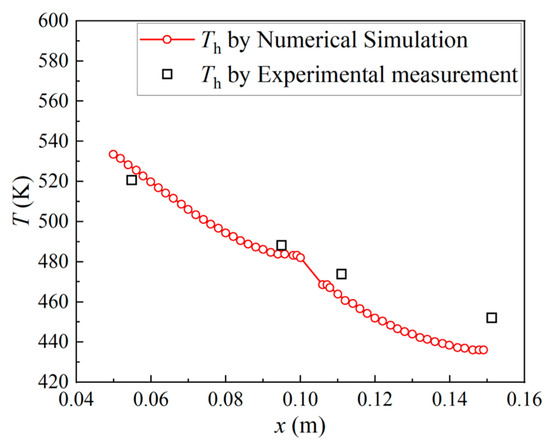
Figure 5.
Numerical method validation [29].
To investigate the effects of input power and equivalence ratio, a series of simulation conditions was examined, as summarized in Table 2. The input power, Qin, is given by:
where mC3H8 is the mass flow rate of propane, and the LHV represents the lower heat value of propane.
Table 2.
Simulation conditions.
The equivalence ratio (φ) is defined as:
where the numerator denotes the actual fuel-air ratio under operating conditions, while the denominator represents the stoichiometric fuel-air ratio corresponding to φ = 1.0 [37].
3. Results and Discussion
3.1. Internal Flow Field of the Swirl Combustor–Heat Collector Coupled System
Figure 6 depicts the velocity vectors on the cross-section at y = −0.012 m. Combustion air is forced through the passages between eight swirler blades, acquiring substantial tangential momentum and forming an annular swirling flow at the exit; a low-speed vortex core is evident at the center. Figure 7 shows the tangential and axial velocity distributions along the line from [(−0.015, −0.001, 0) → (0.015, −0.001, 0)]. The sign of the tangential velocity indicates a counter-clockwise rotation, with a peak magnitude of approximately 3.5 m/s. The axial velocity exhibits a double-peaked profile: positive peaks near the outer edges approach 8 m/s, while a pronounced central recirculation yields reverse velocities exceeding 4 m/s. These near-field characteristics establish the basic “annular jet with central recirculation” pattern that underpins the downstream flow and combustion.
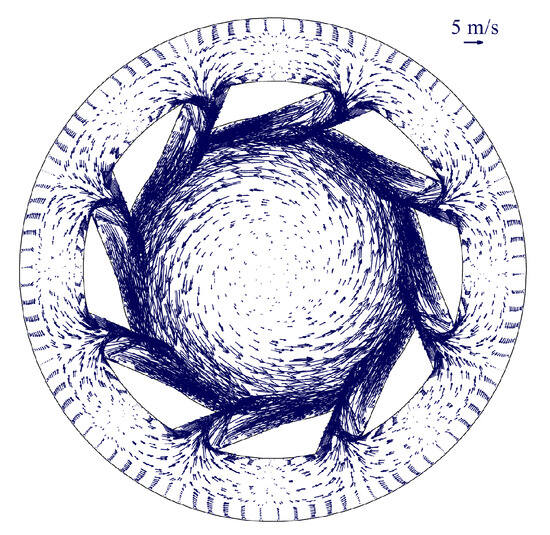
Figure 6.
Vectors at y = −0.012 m cross-section.
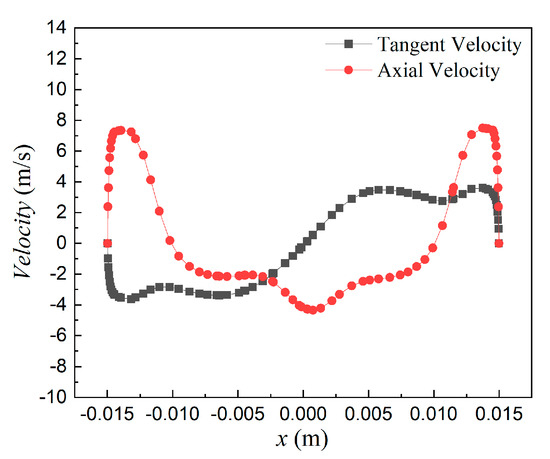
Figure 7.
Tangent and axial velocity distribution.
Figure 8 presents the axial velocity contours and two-dimensional streamlines on the central x-y plane of the swirl combustor-heat collector coupled system, highlighting the key flow structures that govern mixing and combustion stability. A pair of well-developed high-velocity streams (colored red) and a distinct recirculation zone (colored blue) are evident near the combustor outlet. Taking the nozzle exit plane as y = 0 with the y-axis pointing downstream, the flow domain can be divided into three regions: y < 0 m (swirl combustor section), 0 ≤ y ≤ 0.04 m (mixing chamber section), and y > 0.04 m (pin-finned heat-collector cavity). Immediately at the combustor exit (y ≈ 0 m), sudden expansion together with swirl forms a primary recirculation zone (Region 1) between the two high-velocity streams. Further downstream, a secondary recirculation zone (Region 2) develops near the first row of pin fins, driven by blockage and shear-layer entrainment; it is smaller in scale and attached to the inner edges of the high-velocity streams. Symmetric, large-scale wall-attached recirculation zones (Region 3) arise along both sidewalls of the mixing chamber, returning partially unburned gases to the main reaction zone and thereby increasing residence time and improving combustion completeness. At the lip and outlet corners, a small corner vortex (Region 4) induced by cold air entrainment and sharp edge separation enhances local convective heat transfer and reduces the thermal load on the outlet and adjacent walls. After the flow enters the finned region (y > 0.04 m), the pin fins impose blockage and partitioning: vortex structures that were relatively continuous in the mixing chamber break up into multiple upward-directed jets, and streamlines accelerate within the inter-fin passages and disperse upward. Overall, the flow in the three regions proceeds sequentially and produces a synergistic process comprising (i) cross-stream mixing, (ii) recirculation-based flame stabilization and recycling, and (iii) passive partitioning with subsequent downstream transport.
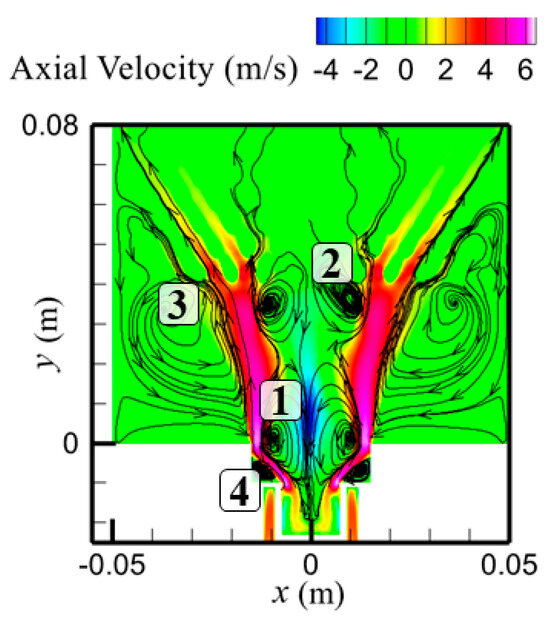
Figure 8.
Axial velocity contour and 2D streamlines.
Figure 9 presents the heat of reaction contour in the vicinity of the combustor and its exit, clarifying the flame-stabilization mechanism. The depicted V-shaped region reflects a time-averaged, turbulence-scaled representation of the reaction zone under the steady-state FR/ED approach, rather than a high-fidelity image of the instantaneous flame front. The modeled high-heat-release region is primarily located along the shear interface between the outer edge of Region 1 and the two high-velocity streams. Recirculation in Region 1 returns hot products and laterally conveys propane injected from the central fuel inlet toward the periphery, where it mixes and reacts with air issuing from the swirler passages. Meanwhile, the wall-attached recirculation zones (Region 3) bring hot flue gas back to the exit neighborhood, providing a thermally favorable background for the reaction layer. Consequently, a V-shaped, narrow, and continuous band of intense heat release forms. As the flow approaches the pin-fin section, this band rapidly dissipates, indicating that the downstream region is dominated by the transport of momentum and heat with little in situ heat release.
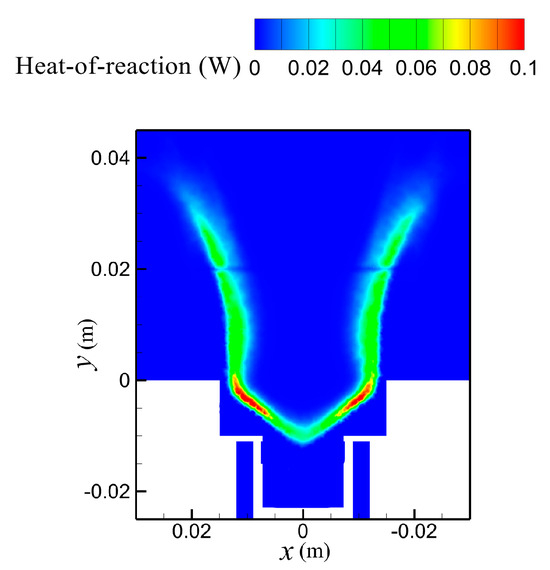
Figure 9.
Heat of reaction contour.
3.2. Effect of Input Power
Building upon the analysis of flow structures and heat release characteristics, this section investigates how variations in input power (Qin = 1269 W, 1520 W, 1679 W, 1854 W) at φ = 1.0 reshape the temperature field within the swirl combustor-based TEG.
Figure 10 shows the temperature fields on the central x-y plane for input powers Qin = 1269 W, 1520 W, 1679 W, and 1854 W. The field exhibits a V-shaped high-temperature band that follows the shear interface between the outer edge of Region 1 and the two high-velocity streams, and it strengthens and elongates as Qin increases: the hot zone penetrates farther into the downstream pin-finned region, and the fins become hotter. The peak temperature of the field rises from 2281 K at Qin = 1269 W to 2339 K at Qin = 1854 W, an increment of about 58 K (≈2.5%). Meanwhile, the temperature in the wall-attached recirculation zones (Region 3) increases overall, indicating an expanded lateral influence of the mixing chamber, which elevates the hot-end temperature of the lower pair of TEMs. As the flow enters the upper pin-fin section, the high-temperature band is stretched within the inter-fin passages and gradually weakens, and more heat is transferred farther downstream through convective and conductive coupling with the fins and cavity walls. With increasing Qin, the gas and fin temperature in the far end (upper section) of the heat collector also rise, which raises the hot-end temperature of the single upper TEM. Collectively, these maps qualitatively indicate that increasing Qin strengthens the thermal coupling between the flame and the heat collector and enlarges the spatial extent of the hot region.
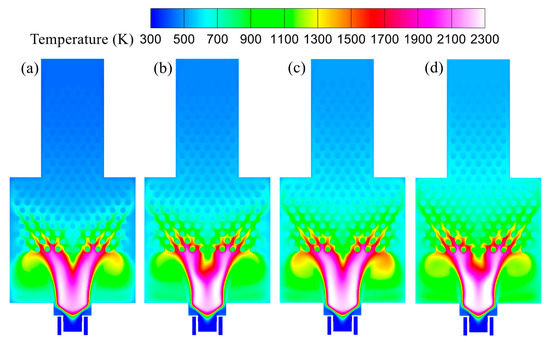
Figure 10.
Temperature distribution on the x-y central cross-section under various input powers. (a) Qin = 1269 W; (b) Qin = 1520 W; (c) Qin = 1679 W; (d) Qin = 1854 W.
Figure 11 presents temperature contours on the central z-y cross-section under different input powers. The V-shaped modeled flame issued by the swirler directly contacts the mixing chamber wall and the roots of the first row of pin fins. As Qin increases, the temperatures of the wall and the first-row fin roots in direct contact with the flame rise markedly, indicating a shorter thermal path for rapid heat transfer to the outer wall of the heat collector where the lower pair of TEMs are mounted, thereby benefiting power generation. In the finned region, temperature bands appear with a spacing that matches the fin pitch, evidencing stable thermal footprints across the span. As Qin increases, these bands shift to higher temperature levels and extend downstream along the y-axis, expanding their coverage toward the outlet.
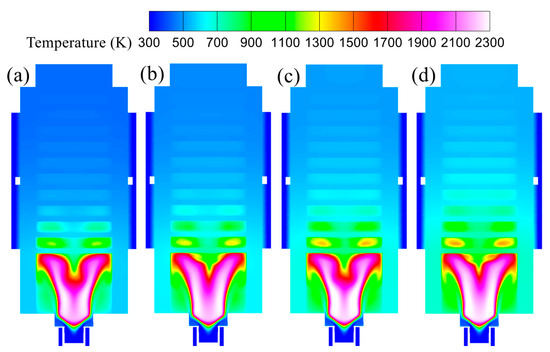
Figure 11.
Temperature distribution on z-y central cross-section under various input powers: (a) Qin = 1269 W; (b) Qin = 1520 W; (c) Qin = 1679 W; (d) Qin = 1854 W.
Figure 12a presents the laterally averaged hot-end temperature of the TEMs at two height intervals under different input powers Qin, where y = 0.06–0.09 m corresponds to the lower pair of TEMs and y = 0.11–0.15 m to the single upper TEM. For all cases, the curves decrease monotonically with height, indicating higher temperatures closer to the flame exit and a persistent negative axial gradient. As Qin increases from 1269 W to 1854 W, the entire profile shifts upward, with the maximum and minimum temperatures rising by approximately 22% and 20%, respectively. The lower tier exhibits a steeper slope and greater sensitivity to height, reflecting high heat flux and rapid axial attenuation near the flame. By contrast, the upper tier lies within the fin-array height range. In this zone, flow deceleration and longer residence time, cross-passage mixing, and fin–substrate conductive spreading act together to homogenize heating, yielding smaller ∣dT/dy∣ and a smoother axial distribution. This “steeper in the lower tier and gentler in the upper tier” pattern persists across all powers, implying that power escalation primarily elevates the overall level without fundamentally altering the axial organization of the temperature field.
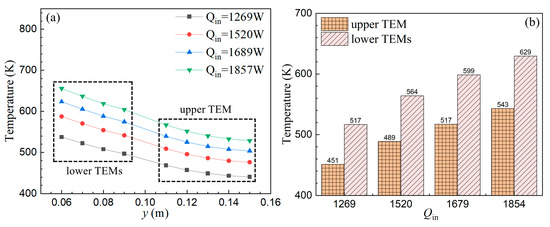
Figure 12.
Hot-end temperature of the TEMs: (a) Laterally averaged hot-end temperature distribution in axial direction; (b) Area-averaged hot-end temperature.
Figure 12b summarizes the area-averaged hot-end temperature as a function of Qin. The lower pair increases from 517 K at 1269 W to 564 K, 599 K, and 629 K at 1520 W, 1679 W, and 1854 W, a net rise of 112 K (21.7%). The upper module increases from 451 K to 489 K, 517 K, and 543 K over the same power levels, a net rise of 92 K (20.4%). The inter-row temperature difference enlarges from 66 K at 1269 W to 86 K at 1854 W, indicating progressively stronger divergence with increasing power. This amplification arises from two effects: geometric proximity of the lower pair to the primary heat-release zone shortens the thermal path and lowers the effective thermal resistance, producing a larger increment in wall heat flux; meanwhile, the upper module relies on downstream convection and axial conduction, where attenuation and losses reduce dT/dQin. The temperature-power relation is nonlinear. At low to medium powers (1269 W to 1520 W to 1679 W), the increases are approximately 47 K and 35 K for the lower pair and 38 K and 28 K for the upper module. From 1679 W to 1854 W, the marginal gains diminish to about 30 K and 26 K, respectively, indicating that the driving effect of added power gradually approaches a plateau at higher levels.
3.3. Effect of Equivalence Ratio
Under a fixed input power of Qin = 1854 W, this section investigates how the equivalence ratio (φ = 0.6, 0.75, 0.9, 1.0, 1.1) affects combustion, flow, and temperature fields within the swirl combustor-based TEG. Figure 13 presents the heat of reaction contours that visualize where intense reactions occur, thereby indicating the location and continuity of the reaction layer. As the equivalence ratio φ increases from 0.6 to 1.0, the high-intensity band along the shear interface becomes more compact and retracts toward the combustor exit. Meanwhile, the envelope of the flame front shortens in the axial direction. and the envelope of the flame front shortens in the axial direction. Pushing φ to 1.1 produces little additional change. This trend is consistent with the axial-velocity contours in Figure 14 under the same conditions. At φ = 0.6, the outer high-velocity streams penetrate farther downstream and entrainment is stronger, lifting and elongating the flame sheet. As φ increases, the air momentum decreases and entrainment weakens. The central recirculation (Region 1) anchors closer to the lip, and the reaction layer contracts and resides nearer the exit.
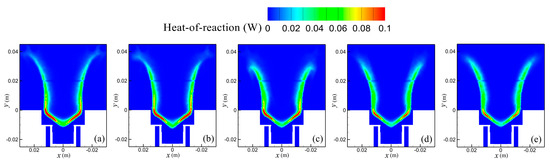
Figure 13.
Heat of reaction contour near the combustor exit: (a) φ = 0.6; (b) φ = 0.75; (c) φ = 0.9; (d) φ = 1.0; (e) φ = 1.1.
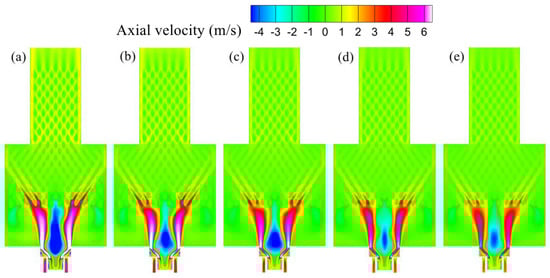
Figure 14.
Axial velocity contour: (a) φ = 0.6; (b) φ = 0.75; (c) φ = 0.9; (d) φ = 1.0; (e) φ = 1.1.
Figure 15 gives temperature contours on the same plane and power level. The temperature in the main reaction zone rises as φ moves from 0.6 to about 0.9, then declines slightly for richer mixtures. At first glance, this appears inconsistent with the progressive contraction of the high-reaction band in Figure 13, but the two observations are compatible. When φ increases from 0.6, the supply of cold air diminishes, so dilution and convective cooling weaken while local mixture approaches stoichiometry. The net effect is a higher temperature even though the reaction layer becomes geometrically narrower. Beyond φ = 0.9, oxygen limitation and product dilution curb local heat release, and the temperature peak subsides, decreasing from 2482 K at φ = 0.9 to 2289 K at φ = 1.1. The wall-attached recirculation regions (Region 3) warm from lean to near-stoichiometric conditions as cold-air sweeping lessens and recirculatory preheating strengthens. This effect is particularly pronounced at φ = 1.1: high-temperature gases in the mixing chamber are not efficiently conveyed into the pin-finned section; instead, insufficient axial momentum leads to impingement on and blockage by the first fin row, followed by the pronounced recirculation. Consistent with this behavior, Figure 15 (φ = 1.1) shows Region 3 attaining markedly higher temperatures than at φ= 1.0. In contrast, the pin-finned section shows a gradual temperature decrease with increasing φ, which is consistent with the reduced axial momentum documented in Figure 14 and the associated drop in transport of hot gases into the finned passages.
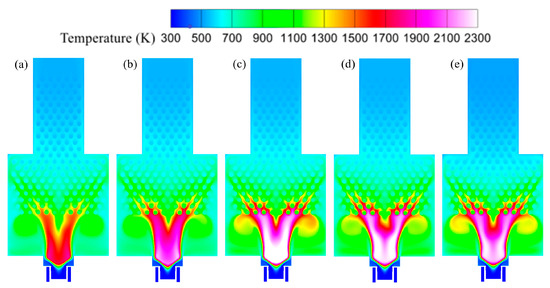
Figure 15.
Temperature distribution on x-y central cross-section under various equivalence ratios: (a) φ = 0.6; (b) φ = 0.75; (c) φ = 0.9; (d) φ = 1.0; (e) φ = 1.1.
Figure 16 compares the TEM hot-end temperature maps at different equivalence ratios. Across all conditions, the lower pair of TEMs consistently exhibits higher hot-end temperatures than the upper module and shows a more pronounced axial stratification: a stable hot layer forms near the lower edge (approximately 650 K), the temperature decreases monotonically with height, and spanwise undulations are evident, with higher temperatures near the flame centerline than at the lateral edges. By contrast, the upper TEM is overall cooler (about 510–570 K) and more laterally uniform, with nearly horizontal isotherms and a steady negative axial gradient without prominent hot spots.
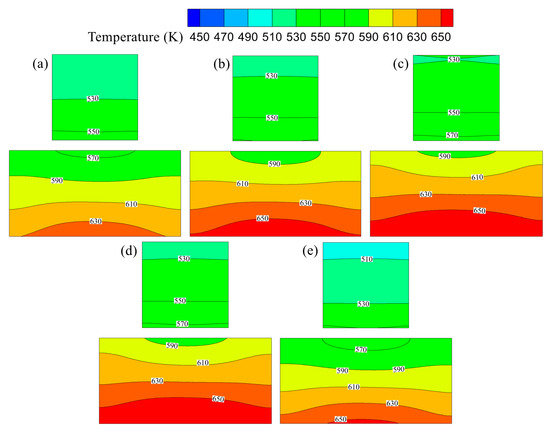
Figure 16.
Temperature distribution on the external surfaces of the heat collector corresponding to the TEM hot-end mounting locations: (a) φ = 0.6; (b) φ = 0.75; (c) φ = 0.9; (d) φ = 1.0; (e) φ = 1.1.
As the equivalence ratio increases from φ = 0.6 to 0.9, both tiers display a common upward shift in isotherms: in the upper tier, the 550–570 K band advances upward and warming near the lower edge intensifies; in the lower tier, the 610–630 K region rises and the 650 K hot layer thickens and extends upward. Raising the equivalence ratio from φ = 0.9 to 1.0 leads to divergent behavior: the lower tier remains nearly unchanged (the thickness and upper boundary of the hot layer are essentially maintained), whereas the 530–550 K isotherms in the upper tier move downward and the cool area enlarges, mainly because the axial penetration of hot gases into the pin-fin section weakens, reducing heating of the upper fin region. With a further increase to φ = 1.1, the combined effects of diminished axial penetration and blockage by the first fin row produce cooling in both tiers: the lower-tier isotherms shift downward and the hot layer thins, while the upper tier develops an extensive 490–510 K cool zone near the top, indicating aggravated heating deficiency at the far end and a more pronounced negative axial gradient. Collectively, these observations highlight a trade-off between axial transport and chamber dilution governed by the air supply. At fixed input power, an equivalence ratio of approximately φ = 0.9 maximizes the TEM hot-end temperature by balancing the gains in axial penetration and convective delivery of hot gases from added air against the competing penalties of dilution and convective cooling.
4. Limitations and Future Work
4.1. Limitations of the Lumped-Parameter TEM Model
While the lumped model with efficiently couples the thermoelectric modules to the combustor-heat-collector system, it assumes a uniform hot-end temperature and neglects the internal gradients among individual P-type and N-type legs.
The CFD results (Figure 16) reveal hot-end temperature variation in several tens of kelvin both axially and spanwise. Since the Seebeck coefficient, electrical resistivity, and thermal conductivity of TE materials are all temperature-dependent, this non-uniformity could lead to deviations in the predicted heat flux relative to a fully resolved microscale TEM model. A representative case at equivalence ratio φ = 1.0 exhibits a maximum, minimum, and average hot-end temperature of 650 K, 530 K, and 600 K, corresponding to , 1.18, and 1.21 W·m−1·K−1, respectively. This narrow spread (<5%) indicates that the homogenized treatment introduces only a minor bias in estimating global heat-transfer and conversion performance-adequate for the present focus on bulk flame-to-wall heat-transfer trends rather than detailed module-level power output.
Future work could further improve the TEM-system coupling by adopting a more detailed representation of the spatially non-uniform heat generation and transport within the modules, enabling better assessment of how local thermal variations affect overall heat-flux pathways and system-level feedback.
4.2. Limitations of Use of the FR/ED+Two-Step Global Reaction Mechanism
The conjunction use of the FR/ED model with a 2-step global propane reaction mechanism is motivated by the study’s focus on overall heat-release distribution and wall heat-transfer trends rather than species-level kinetics and has been widely adopted in combustor simulations for such engineering purposes [38,39,40]. However, this simplified mechanism cannot resolve intermediate radicals (OH, H, O) or high-temperature dissociation reactions that act as heat sinks, thus tending to over-predict peak flame temperature and smooth or slightly broaden the heat-release field, which in turn leads to an overall over-estimation of the thermal field and consequently higher predicted wall heat fluxes and TEM hot-end temperatures.
To assess the magnitude of the simplification error, we performed a sensitivity study on a simplified 2D computational domain under identical boundary conditions. Figure 17 presents the comparison of temperature contours obtained from the FR/ED model with the two-step global propane mechanism and from the EDC model with a detailed propane mechanism. The FR/ED+2-step case predicted a peak flame temperature of 2304.15 K, whereas the detailed-mechanism case yielded 2218.38 K—close to the adiabatic flame temperature of propane (≈2268 K). This discrepancy reflects the absence of radical-pool and dissociation chemistry in the 2-step model, which results in an over-prediction of wall heat flux levels. Despite the peak-temperature difference of about 3.9% relative to the detailed-mechanism prediction, the two simulations exhibited highly similar flame structures and overall temperature distributions, supporting the adequacy of the reduced chemistry for capturing global flame stabilization and engineering-relevant wall-heat-transfer trends. In this sense, the 2-step model represents a reasonable compromise for the present objectives, providing engineering-oriented insights into the coupled combustion–heat-transfer process, while we remain fully aware of its limitations.
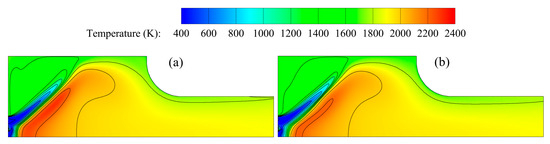
Figure 17.
Temperature contour: (a) by FR/ED+2-step. (b) by EDC + detailed mechanism.
Future work could consider incorporating advanced combustion-chemistry reduction strategies such as a Flamelet-Generated Manifold (FGM) based on detailed propane chemistry, which retains the essential radical-pool and dissociation pathways while markedly reducing computational cost. Such an approach offers a practical balance between fidelity and efficiency, and could further narrow the bias in peak-flame-temperature and wall-heat-flux predictions observed with the present global-2-step treatment.
4.3. Limitations of the Numerical Method Validation
Although the validation in this study relies primarily on the comparison of hot-end temperatures with the experimental data reported in Ref. [29], this approach is constrained by the lack of detailed local measurements such as velocity, species, or wall-resolved thermal data. Future studies will incorporate more comprehensive local validation as suitable diagnostic data become available.
To improve transparency and readability, Table 3 summarizes the principal modeling choices adopted in this study, including combustion and thermoelectric treatments, along with their advantages and limitations.
Table 3.
Summary of major modeling choices and their implications.
5. Conclusions
This work employed a conjugate CFD approach integrated with a lumped parameter model to quantify how input power and equivalence ratio govern the flame/flow topology, temperature field, and hot-end heating in a swirl combustor-based TEG. Three-dimensional simulations were conducted for this system with Qin varied from 1269 to 1854 W and φ from 0.6 to 1.1. The key conclusions of this study are as follows:
The combustor exit establishes an “annular jet with central recirculation” profile that organizes a V-shaped region of high modeled heat release for flame anchoring and preheating. Upon entering the pin-finned section, fin blockage and partitioning break the vortices into multiple upward jets, causing a rapid decay of the high-heat-release band; transport there is dominated by momentum and heat, with energy conveyed along inter-fin passages toward the outlet and conducted into the TEMs.
At φ = 1.0, increasing Qin from 1269 to 1854 W strengthens and lengthens the V-shaped hot band, warms Region 3, and drives heating deeper into the finned cavity; the central-plane peak temperature rises from 2281 to 2339 K (+58 K, ≈2.5%), and temperature streaks in the finned region shift upward and extend toward the outlet. Consistent with the temperature field changes, the TEM hot-end shows a persistent lower-upper disparity and diminishing incremental gains. Isotherms on both rows shift upward, with the lower pair heating faster (517 K to 629 K) due to its shorter thermal path and lower effective resistance near the main heat-release zone, while the upper module warms more mildly (451 K to 543 K) because it relies on downstream convection and conduction. Consequently, the inter-row gap of area-averaged temperature widens from 66 to 86 K, and the marginal temperature rise tapers at the highest power, while the axial organization of the temperature field remains essentially unchanged.
At fixed input power Qin = 1854 W, increasing φ from 0.6 to 1.0 causes the high-intensity reaction band along the shear interface to become more compact and retract toward the combustor exit, with a shorter axial flame envelope. In concert, axial penetration and entrainment weaken, the central recirculation anchors closer to the lip, and transport of hot gases into the pin-finned passages decreases (most pronounced at φ = 1.1). The main reaction-zone temperature rises from φ = 0.6 to φ = 0.9 and then decreases for richer mixtures due to oxygen limitation and product dilution (peak temperature dropping from 2482 K to 2289 K). Meanwhile, Region 3 warms because recirculatory preheating strengthens, whereas the pin-finned section cools with increasing φ, reflecting reduced downstream transport of heat and momentum. Correspondingly, the lower TEM row (near the combustor exit) is consistently hotter and more axially stratified than the upper TEM. From φ = 0.6 to φ = 0.9, isotherms in both rows shift upward; from 0.9 to 1.0, the responses diverge (lower nearly unchanged, upper cools); at 1.1, both rows cool, and the upper develops an extensive top cold zone. Overall, at fixed power φ = 0.9 best balance the gain from axial penetration against dilution/convective-cooling losses, yielding a higher TEM hot-end temperature.
Author Contributions
Conceptualization, K.H. and G.L.; methodology, K.H. and G.L.; validation, J.Z. and Y.Z.; formal analysis, K.H. and Y.Z.; investigation, K.H. and J.Z.; resources, K.H.; data curation, K.H. and K.L.; writing—original draft preparation, K.H. and J.Z.; writing—review and editing, G.L.; visualization, J.Z. and C.Y.; supervision, G.L.; project administration, G.L.; funding acquisition, K.H., G.L., C.Y. and K.L. All authors have read and agreed to the published version of the manuscript.
Funding
This research was funded by Fundamental Research Funds of Zhejiang University of Science and Technology (No. 2023QN008), Key R&D Program of Cixi City (No. CZ2025001), Zhejiang Provincial Natural Science Foundation of China (No. LHZSZ25E060002), and National Key R&D Program of China (No. 2022YFB4100202).
Data Availability Statement
The original contributions presented in this study are included in the article. Further inquiries can be directed to the corresponding author.
Conflicts of Interest
The authors declare no conflicts of interest. The funders had no role in the design of the study; in the collection, analyses, or interpretation of data; in the writing of the manuscript; or in the decision to publish the results.
Abbreviations
The following abbreviations are used in this manuscript:
| TEM | Thermoelectric module |
| μ-CPTEG | Micro-combustion-powered thermoelectric generator |
References
- Li, G.E.; Fan, Y.Q.; Li, Q.S.; Zheng, Y.; Zhao, D.; Wang, S.; Dong, S.; Guo, W.; Tang, Y. A review on micro combustion powered thermoelectric generator: History, state-of-the-art and challenges to commercialization. Renew Sustain. Energy Rev. 2025, 207, 114897. [Google Scholar] [CrossRef]
- Snyder, G.J.; Lim, J.R.; Huang, C.K.; Fleurial, J.-P. Thermoelectric microdevice fabricated by a MEMS-like electrochemical process. Nat. Mater. 2003, 2, 528–531. [Google Scholar] [CrossRef]
- Fleming, J.; Ng, W.; Ghamaty, S. Thermoelectric Power Generation for UAV Applications. In Proceedings of the 1st International Energy Conversion Engineering Conference (IECEC), Portsmouth, NH, USA, 17–21 August 2003. [Google Scholar]
- Velidi, G.; Yoo, C.S. A Review on Flame Stabilization Technologies for UAV Engine Micro-Meso Scale Combustors: Progress and Challenges. Energies 2023, 16, 3968. [Google Scholar] [CrossRef]
- Soares, G.B.; Ledesma, J.J.G.; da Silva, E.A.; Junior, O.H.A. Thermoelectric Generators Applied as a Power Source in CubeSats: State of the Art. Energies 2025, 18, 173. [Google Scholar] [CrossRef]
- Palaporn, D.; Tanusilp, S.A.; Sun, Y.; Pinitsoontorn, S.; Kurosaki, K. Thermoelectric materials for space explorations. Mater. Adv. 2024, 5, 5351–5364. [Google Scholar] [CrossRef]
- Jia, Q.E.; Mei, Y.Q.; Feng, C.L.; Ding, J.; Cai, L.; Luo, B. A review of enhancing micro combustion to improve energy conversion performance in micro power system. Int. J. Hydrogen Energy 2022, 47, 22574–22601. [Google Scholar]
- Li, G.; Zhu, Z.; Zheng, Y.; Guo, W.; Tang, Y. Development of a powerful hybrid micro thermoelectric generator based on an ultrahigh capacity miniature combustor. Appl. Therm. Eng. 2022, 206, 118039. [Google Scholar] [CrossRef]
- Cao, T.; Shi, X.L.; Li, M.; Hu, B.; Chen, W.; Liu, W.-D.; Lyu, W.; MacLeod, J.; Chen, Z.-G. Advances in bismuth-telluride-based thermoelectric devices: Progress and challenges. eScience 2023, 3, 100122. [Google Scholar] [CrossRef]
- Jaziri, N.; Boughamoura, A.; Müller, J.; Mezghani, B.; Tounsi, F.; Ismail, M. A comprehensive review of Thermoelectric Generators: Technologies and common applications. Energy Rep. 2020, 6, 264–287. [Google Scholar] [CrossRef]
- Yadav, S.; Sharma, P.; Yamasani, P.; Mezghani, B.; Tounsi, F.; Ismail, M. A prototype micro-thermoelectric power generator for micro- electromechanical systems. Appl. Phys. Lett. 2014, 104, 123903. [Google Scholar] [CrossRef]
- Yadav, S.; Yamasani, P.; Kumar, S. Experimental studies on a micro power generator using thermo-electric modules mounted on a micro-combustor. Energy Convers. Manag. 2015, 99, 1–7. [Google Scholar] [CrossRef]
- Aravind, B.; Khandelwal, B.; Kumar, S. Experimental investigations on a new high intensity dual microcombustor based thermoelectric micropower generator. Appl. Energy 2018, 228, 1173–1181. [Google Scholar] [CrossRef]
- Aravind, B.; Raghuram, G.K.S.; Kishore, V.R.; Kumar, S. Compact design of planar stepped micro combustor for portable thermoelectric power generation. Energy Convers. Manag. 2018, 156, 224–234. [Google Scholar] [CrossRef]
- Aravind, B.; Saini, D.K.; Kumar, S. Experimental investigations on the role of various heat sinks in developing an efficient combustion based micro power generator. Appl. Therm. Eng. 2019, 148, 22–32. [Google Scholar] [CrossRef]
- Qian, P.; Yuan, X.P.; Chen, Z.W.; Luo, C.; Huang, Z.; Zhu, X.; Liu, M. Experimental study on a high efficient and ultra-lean burn meso-scale thermoelectric system based on porous media combustion. Energy Convers. Manag. 2021, 234, 14. [Google Scholar] [CrossRef]
- Zhao, Z.; Zuo, Z.; Wang, W.; Kuang, N.; Xu, P. Experimental studies on a high performance thermoelectric system based on micro opposed flow porous combustor. Energy Convers. Manag. 2022, 253, 115157. [Google Scholar] [CrossRef]
- Zhu, X.; Zhao, Z.; Zuo, Z.; Jia, B.; Wang, W.; Xu, P. Experimental studies on the role of thermoelectric module structure in developing a powerful miniature power generator with a meso-scale opposed flow porous combustor. Appl. Therm. Eng. 2023, 230, 120586. [Google Scholar] [CrossRef]
- Shimokuri, D.; Hara, T.; Matsumoto, R. Development of a small-scale power system with meso-scale vortex combustor and thermo-electric device. J. Micromech. Microeng. 2015, 25, 104004. [Google Scholar] [CrossRef]
- Shimokuri, D.; Taomoto, Y.; Matsumoto, R. Development of a powerful miniature power system with a meso-scale vortex combustor. Proc. Combust. Inst. 2017, 366, 4253–4260. [Google Scholar] [CrossRef]
- Shen, R.; Li, G.; Zhu, Y.; Tang, Y.; Guo, W.; Zheng, Y.; Huang, K. Development of a compact high-performance combustion powered thermoelectric generator based on swirl burner. Energy 2024, 286, 129455. [Google Scholar] [CrossRef]
- Li, G.; Zhu, Z.; Zheng, Y.; Guo, W.; Tang, Y.; Ye, C. Experiments on a powerful, ultra-clean, and low-noise-level swirl-combustion-powered micro thermoelectric generator. Energy 2023, 263, 125825. [Google Scholar] [CrossRef]
- Vican, J.; Gajdeczko, B.F.; Dryer, F.L.; Milius, D.; Aksay, I.; Yetter, R. Development of a microreactor as a thermal source for microelectromechanical systems power generation. In Proceedings of the Name of the Twenty-Ninth international symposium on combustion, Sapporo, Japan, 21–26 July 2002. [Google Scholar]
- Jiang, L.Q.; Zhao, D.Q.; Guo, C.M.; Wang, X. Experimental study of a plat-flame micro combustor burning DME for thermoelectric power generation. Energy Convers. Manag. 2011, 52, 596–602. [Google Scholar] [CrossRef]
- Zhang, Y.; Wang, X.; Cleary, M.; Schoensee, L.; Kempf, N.; Richardson, J. High-performance nanostructured thermoelectric generators for micro combined heat and power systems. Appl. Therm. Eng. 2016, 95, 83–87. [Google Scholar] [CrossRef]
- Singh, T.; Marsh, R.; Min, G. Development and investigation of a non-catalytic self-aspirating meso-scale premixed burner integrated thermoelectric power generator. Energy Convers. Manag. 2016, 117, 431–441. [Google Scholar] [CrossRef]
- Aravind, B.; Khandelwal, B.; Ramakrishna, P.A.; Kumar, S. Towards the development of a high power density, high efficiency, micro power generator. Appl. Energy 2020, 261, 114386. [Google Scholar] [CrossRef]
- Aravind, B.; Hiranandani, K.; Kumar, S. Development of an ultra-high capacity hydrocarbon fuel based micro thermoelectric power generator. Energy 2020, 206, 118099. [Google Scholar] [CrossRef]
- Li, G.; Zhi, Y.; Wang, S.; Zheng, Y.; Shen, R.; Guo, W.; Tang, Y. Hydrocarbon combustion powered micro thermoelectric generator with an inverted T-shape heat collector. Appl. Therm. Eng. 2025, 259, 124808. [Google Scholar] [CrossRef]
- Lee, H.; Sharp, J.; Stokes, D.; Pearson, M.; Priya, S. Modeling and analysis of the effect of thermal losses on thermoelectric generator performance using effective properties. Appl. Energy 2018, 211, 987–996. [Google Scholar] [CrossRef]
- Rowe, D.M. Thermoelectrics Handbook (Macro to Nano); CRC Press: London, UK, 2006. [Google Scholar]
- Li, G.; Ying, J.; Zheng, Y.; Guo, W.; Tang, Y.; Ye, C. Analytical design model for waste heat thermoelectric generator and experimental verification. Energy Convers. Manag. 2022, 252, 115034. [Google Scholar] [CrossRef]
- Li, G.N.; Yi, M.B.; Tulu, M.B.; Zheng, Y.; Guo, W.; Tang, Y. Miniature self-powering and self-aspirating combustion-powered thermoelectric generator burning gas fuels for combined heat and power supply. J. Power Sources 2021, 506, 230263. [Google Scholar] [CrossRef]
- Shackelford, J.F.; Alexander, W.; Pork, J.S. CRC Materials Science and Engineering Handbook; CRC Press: New York, NY, USA, 2002. [Google Scholar]
- Li, G.; Zheng, Y.; Guo, W.; Zhu, D.; Tang, Y. Mesoscale combustor-powered thermoelectric generator: Experimental optimization and evaluation metrics. Appl. Energy 2020, 272, 115234. [Google Scholar] [CrossRef]
- Westbrook, C.K.; Dryer, F.L. Simplified Reaction Mechanisms for the Oxidation of Hydrocarbon Fuels in Flames. Combust. Sci. Technol. 1981, 27, 31–43. [Google Scholar] [CrossRef]
- Li, G.; Zhu, D.; Zheng, Y.; Guo, W. Mesoscale combustor-powered thermoelectric generator with enhanced heat collection. Energy Convers. Manag. 2020, 205, 112403. [Google Scholar] [CrossRef]
- Briones, A.M.; Sekar, B.; Thornburg, H. Characteristics of Bluff Body Stabilized Turbulent Premixed Flames. In Proceedings of the ASME 2011 Turbo Expo: Turbine Technical Conference and Exposition, Vancouver, BC, Canada, 6–10 June 2011. [Google Scholar]
- Thabari, J.A.; Maragkos, G.; Moorthamers, Y.; Snegirev, A.; Merci, B. Numerical study of the impact of global mechanisms in LES of propane pool fire using the EDC—Finite-rate chemistry approach. Fire Saf. J. 2025, 156, 104472. [Google Scholar] [CrossRef]
- Zettervall, N.; Nordin-Bates, K.; Nilsson, E.J.K.; Fureby, C. Large Eddy Simulation of a premixed bluff body stabilized flame using global and skeletal reaction mechanisms. Combust. Flame 2017, 179, 1–22. [Google Scholar] [CrossRef]
Disclaimer/Publisher’s Note: The statements, opinions and data contained in all publications are solely those of the individual author(s) and contributor(s) and not of MDPI and/or the editor(s). MDPI and/or the editor(s) disclaim responsibility for any injury to people or property resulting from any ideas, methods, instructions or products referred to in the content. |
© 2025 by the authors. Licensee MDPI, Basel, Switzerland. This article is an open access article distributed under the terms and conditions of the Creative Commons Attribution (CC BY) license (https://creativecommons.org/licenses/by/4.0/).