Abstract
The impact freezing of supercooled water droplets poses a significant threat to the safety of aircraft and power transmission equipment. In recent years, extensive research has been conducted using numerical methods to investigate this phenomenon. However, existing models often incorrectly predict premature freezing near the droplet–air contact line during the early stage of impact, thereby unreasonably suppressing the spreading process in these regions. To address this limitation, this study proposes a velocity-gate-based activation control strategy for the Darcy momentum source, enabling its dynamic adjustment during simulation. The methodology integrates the Volume of Fluid (VOF) model, the solidification model, and the dynamic contact angle (DCA) model with the proposed dynamic Darcy source, while accounting for the influence of supercooling on physical properties. The numerical simulations are performed using COMSOL Multiphysics 6.3 and validated against experimental spreading factor data. The results demonstrate that the proposed methodology effectively eliminates nonphysical freezing during the initial spreading stage, and the predicted spreading factors agree well with experiments, with a maximum relative deviation of up to 11.7% across all simulated cases. The proposed approach improves consistency with real-world behavior and enhances the reliability of existing numerical tools for aircraft icing prediction and anti-icing design.
1. Introduction
In fields exposed to extreme weather conditions, such as aerospace and wind power generation, the impact and subsequent freezing of supercooled water droplets, leading to ice accretion, are widely encountered. In the aerospace sector, supercooled droplets within clouds may strike the surface of an aircraft and rapidly form ice layers, which disrupt normal flight operations and, in severe cases, may even lead to catastrophic accidents [,,]. In wind power generation, icing caused by supercooled droplets under extremely low temperatures presents significant challenges to the reliable operation of wind turbines. Ice accretion alters the geometry of turbine blades, markedly degrades their aerodynamic performance, reduces power generation efficiency, and shortens blade service life []. Hence, research on the icing behavior of supercooled water droplets is of considerable importance.
The freezing mechanism of sessile supercooled droplets has been extensively studied, and it is widely accepted that the process involves five stages: supercooling, nucleation, recalescence, solidification, and solid cooling [,]. Typically, the phase transition begins when nucleation occurs under the supercooled state, followed by a rapid recalescence stage (lasting approximately 10–100 ms). During this stage, the release of latent heat of solidification raises the droplet temperature to the freezing point (0 °C), forming a mixture of ice and water. Finally, in the solid cooling stage, the solid–liquid interface propagates upward from the cooled substrate toward the droplet top until complete freezing is achieved.
In practice, however, droplet impact and freezing are more common than sessile freezing, making it necessary to couple solidification processes with droplet impact dynamics to capture the more realistic, complex mechanisms. Recently, many researchers have investigated the freezing behavior of impacting supercooled droplets using experimental methods [,,,,,] and numerical simulations [,,,,]. For example, Zhao et al. [] employed a three-phase Lattice Boltzmann Method (LBM) to simulate the freezing of droplets impacting cold surfaces and observed bubble formation during impact. Jin et al. [] used many-body dissipative particle dynamics (MDPD) to investigate droplet dynamics on curved substrates, concluding that contact time decreases with increasing impact velocity. At present, the most common approach for simulating multiphase gas–liquid-solid flows with phase change is to combine enthalpy -based solidification models with the Volume of Fluid (VOF) method. In simulations of supercooled droplets, to account for velocity suppression in freezing regions, researchers often introduce a Darcy momentum source, treating the frozen zone as a high-resistance porous medium, thereby adding an additional damping term in the momentum equation. For instance, Liu et al. [] applied this approach to simulate droplet impacts on superhydrophobic spheres and found that supercooling significantly affects droplet retraction, with the stable spreading area increasing as the degree of supercooling rises. Similarly, Zhang et al. [] studied droplet impact on cold surfaces and reported that both spreading and recoiling amplitudes decrease compared to non-supercooled droplets, leading to reduced maximum spreading ratios but increased final freezing ratios. Moreover, larger Weber numbers, higher supercooling, and smaller contact angles exacerbate these differences. Chang et al. [] employed this modeling approach and showed that the initial supercooling degree is the dominant factor influencing heat transfer between the droplet and the substrate.
Although the combined VOF-solidification-Darcy momentum source framework is well established, one critical issue in the simulation of supercooled droplet impact has been largely overlooked: erroneous activation of the Darcy momentum source. When ambient temperatures are set below the freezing point, simulations often falsely identify freezing regions at the droplet–air interface during the initial impact stage. As a result, the Darcy source suppresses local velocities at the contact line prematurely. In contrast, experimental observations consistently indicate that freezing begins at the droplet–substrate contact line and then gradually propagates from the bottom into the droplet until reaching the upper surface [,,]. This means that freezing should not occur at the droplet–air interface during the early impact stage. In numerical simulations, the error introduced by this false activation is small when the impact velocity is low, as the effect of Darcy momentum source is limited. However, at higher impact velocities, the suppression becomes significant in these misidentified regions, distorting the spreading morphology and undermining the physical credibility of the simulations. This effect is illustrated in Figure 1, which shows spurious freezing at the droplet–air interface leading to distorted droplet shapes during the early spreading stage.
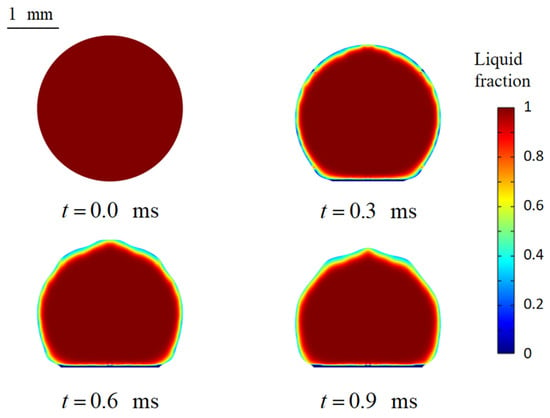
Figure 1.
Simulated droplet morphology with the conventional always-on Darcy source, illustrating distortion of the spreading shape during the initial impact stage.
Previous studies have demonstrated [,,,] that velocity suppression in freezing regions primarily occurs during the retraction stage, while freezing near the droplet–substrate contact line during spreading does not significantly hinder the spreading process, since the unfrozen upper portion of the droplet continues to expand. Motivated by this insight, we propose a velocity-gate-based activation control strategy, which activates the Darcy momentum source only during the late spreading and retraction phases. In other words, no Darcy damping is applied during the initial high-velocity spreading stage, and the source term is introduced only after the spreading velocity falls below a threshold. This strategy avoids erroneous suppression at the droplet–air interface during the early spreading stage and better aligns with experimental observations of freezing fronts propagating outward from the substrate. We incorporate this approach into the conventional modeling framework and validate its accuracy against experimental data under various operating conditions.
2. Numerical Model of Supercooled Droplet Impact
2.1. VOF (Volume of Fluid) Method
The VOF method [], based on the Eulerian framework, tracks phase interfaces by solving the continuity equation for the volume fraction of each phase in single- or multiphase flows. This method introduces the phase volume fraction
(j = 1, 2), which facilitates reconstruction of the interface within each computational cell, as expressed in Equation (1):
where
. In the VOF method, the governing equations for mass and momentum conservation of incompressible two-phase flow are given as:
where
denotes the velocity vector,
is the pressure,
is the gravity vector,
is the surface tension force per unit volume,
is the viscous stress tensor,
is the momentum source term,
is the volume-fraction-averaged density, and
is the volume-fraction-averaged dynamic viscosity.
In this work, air is treated as the primary phase, whereas the three states of water during solidification—ice, ice–water mixture, and liquid water—are collectively defined as the secondary phase. For each computational cell, the relevant physical properties are determined using weighted averages based on the local volumetric phase fractions. Accordingly, the volume-fraction-averaged density and viscosity in each cell are expressed as:
To account for the influence of surface tension, the widely used continuum surface force (CSF) model proposed by Brackbill et al. [] is adopted to calculate the surface tension force:
where
is the surface tension coefficient, and
is the curvature of the interface, given by
It should be noted that when the contact angle is not zero, the presence of a wall modifies the local surface normal direction and consequently affects the adhesion of the fluid on the wall. Therefore, in calculating the average surface curvature at the contact line, it is first necessary to determine the unit normal vector of the interface on the adjacent wall cells:
where
is the unit vector normal to the wall,
is the unit vector tangent to the wall, and
is the contact angle.
2.2. Incorporation of Supercooling
The solidification process of a supercooled droplet impacting a cold surface can be divided into two stages. The first stage spans from nucleation to the end of recalescence, during which the droplet transforms into an ice–water mixture. The second stage is characterized by slow freezing driven by heat transfer until the remaining liquid is fully solidified [,]. In numerical simulations, the nucleation process is difficult to incorporate. Considering that impact-induced vibrations significantly increase the probability of nucleation [], experimental observations have shown that nucleation occurs almost instantaneously when a droplet contacts a cold surface []. Therefore, in this study, it is assumed that a supercooled droplet completes the nucleation and recalescence stage immediately upon impact or within an extremely short period, such that the impact of a supercooled droplet can be equivalently modeled as the impact of an ice–water mixture.
This transformation alters the physical properties of the droplet. The ice mass fraction
within the ice–water mixture can be determined from the energy balance equation [,], which is given as:
where
denotes the supercooling degree and
represents the Stefan number, defined as the ratio of sensible heat to latent heat []. Accordingly, this formulation allows the calculation of the physical properties of the ice–water mixture at the end of the nucleation-recalescence stage, including the equivalent latent heat, density, specific heat capacity, and thermal conductivity:
Through Equations (8)–(10), the equivalent parameters of the ice–water mixture can be determined, which are then employed as the initial conditions for the subsequent droplet impact and freezing process.
2.3. Solidification Model
On the basis of mass and momentum transfer captured by the VOF method, a solidification model is employed to calculate heat transfer during the droplet impact freezing process. In this model, the ice–water mixture is treated as a single liquid phase, with its latent heat and physical properties obtained from Equations (9) and (10). During phase change, the liquid fraction in each computational cell is calculated using the enthalpy-porosity approach combined with enthalpy balance. The total enthalpy of liquid and solid phases in a cell can be expressed as the sum of sensible enthalpy and latent enthalpy:
where the sensible enthalpy can be expressed as
where
and
denote the reference enthalpy and reference temperature, respectively. The latent enthalpy is defined as
is the liquid fraction, which is given by
where
and
denote the solidus temperature and liquidus temperature, respectively. Here,
represents the phase change temperature interval, which is introduced to mitigate the abrupt variation in physical properties near the freezing point and thereby ensure numerical convergence []. In this study,
is set to 0.2 °C. Based on the liquid fraction, the temperature-dependent physical properties can then be obtained as
where
denotes the thermal conductivity
or other temperature-dependent parameters.
Therefore, the energy equations for all phases in the solidification model can be uniformly expressed as
where
is the fluid velocity and
is the energy source term.
In addition, the enthalpy-porosity method treats the mushy zone as a porous medium, where the porosity is equal to the liquid fraction within each cell and decreases from 1 to 0 as solidification progresses. In the fully solidified region, the porosity reduces to zero, and consequently the velocity vanishes. In simple terms, as the droplet gradually freezes, the porosity in the ice–water transition region decreases and the velocity correspondingly diminishes. This effect is realized by introducing a Darcy momentum source term [], which is expressed as
where
is a small constant (0.001) introduced to avoid division by zero.
is the mushy zone constant that controls the damping intensity of the velocity during solidification, and it is generally regarded as an empirical parameter in enthalpy–porosity models. A larger value of
leads to a faster reduction in velocity to zero as the material solidifies. Reported values of
typically range from 104 to 107 [,,,]. In this study,
is set to 5 × 10⁶, following these works and considering the convergence requirements of the present simulations.
2.4. DCA (Dynamic Contact Angle) Model
On an ideal smooth surface, the contact angle
remains constant. However, in reality, surface roughness causes the contact angle to vary with the velocity of the contact line, resulting in a dynamic change, which is referred to as the dynamic contact angle (DCA) []. Several empirical models for the dynamic contact angle have been proposed, among which the empirical model developed by Kistler [] has shown good agreement with experimental data [] and has therefore been widely adopted. In this model, the dynamic contact angle
is defined as
where
is the Hoffman function [], which is expressed as
is the inverse Hoffman function, and
denotes the capillary number:
where
is the dynamic viscosity,
is the surface tension coefficient, and
is the contact line velocity tangential to the interface. The equilibrium contact angle
takes different values during the advancing and receding processes, which can be expressed as
where
is the advancing contact angle and
is the receding contact angle. In many studies, the variation in contact angle has been simplified to improve computational efficiency, typically by assigning
as the static contact angle, i.e., the contact angle of a stationary droplet, or by using
for all cases [,,]. To better capture realistic behavior, the present study adopts the actual dynamic contact angle, with values determined according to Equation (21). Specifically, the liquid phase remains attached to the solid substrate at the contact line, while the wall boundary condition is treated with a Navier slip formulation. This allows the liquid to remain attached but with a very small tangential velocity, which is only used to evaluate the capillary number for the Kistler relation. In this way, the apparent contact angle is dynamically updated. The advancing and receding contact angles used in this study are adopted from experimental datasets reported in the literature, consistent with the validation cases discussed in Section 3.
2.5. Proposed Dynamic Darcy Momentum Source
As discussed in Section 2.3, the Darcy momentum source is commonly employed to mimic the progressive reduction in velocity as a droplet solidifies. However, in supercooled droplet impact simulations, when the ambient temperature is set below the freezing point, the model tends to misidentify the droplet–air interface as a frozen region at the very beginning of spreading. This premature activation leads to unrealistic velocity suppression, especially at high Reynolds numbers, where the distortion of droplet morphology becomes pronounced (as illustrated earlier in Figure 1).
Considering that freezing along the droplet–substrate contact line during spreading does not significantly hinder the expansion, since the unfrozen upper portion of the droplet continues to spread, causing the suppression effect mainly takes place during the retraction phase [,,,,,]. Motivated by this, we propose a velocity-gate-based activation control strategy that dynamically adjusts the Darcy momentum source. Specifically, the maximum spreading velocity is used as a reference, and a threshold parameter
is introduced; once the instantaneous spreading velocity decreases below
times this maximum, the Darcy source term is activated to represent velocity suppression in freezing regions. This approach avoids nonphysical suppression during early spreading and more accurately reproduces experimentally observed freezing fronts that initiate at the substrate and propagate upward. The dynamic Darcy source term is given as:
here,
denotes the instantaneous spreading velocity of the droplet,
/2 and
/2 are the threshold velocities for the dynamic Darcy momentum source,
represents the maximum spreading velocity, and
is a coefficient ranging between 0 and 1. In addition,
is introduced as a small velocity tolerance to ensure numerical convergence, it is set to 0.02 m/s in this study, and is chosen as small as possible within solver stability limits. The gate parameter
is regarded as an empirical calibration constant, analogous to the mushy-zone constant
. Its specific value is determined later in Section 3.1 through comparison with experiments.
The implementation of the velocity-gated Darcy activation is illustrated in Figure 2. In this study, the reference maximum velocity
is obtained from a preliminary run without Darcy damping, which coincides with the true maximum velocity since the Darcy source is inactive before the gate is triggered. During the production run, the instantaneous spreading velocity
is evaluated at each time step and compared with the fixed threshold
. Once both conditions
and
are satisfied, the Darcy momentum source is gradually activated and remains on for the remainder of the simulation. Here,
is introduced to prevent mis-triggering at the very beginning of spreading, when the instantaneous velocity can be small.

Figure 2.
Flowchart of the velocity-gated Darcy activation strategy.
2.6. Numerical Model Setup
All simulations are performed using COMSOL Multiphysics 6.3, a commercial finite element software. Given the pronounced axisymmetric characteristics of droplet impact and freezing, a two-dimensional axisymmetric coordinate system is adopted for the simulations, as illustrated in Figure 3. The initial droplet temperature is set at the liquidus side of the mushy interval (
). This ensures that the droplet is entirely liquid with no pre-existing solidified region. This treatment is consistent with the physical assumption that nucleation and recalescence occur instantaneously upon impact, so the droplet has reheated to the freezing point at the start of the simulation. To reduce computational cost and, more importantly, to be consistent with the assumption that the droplet temperature returns to the freezing point upon first contact, the droplet is initialized with its bottom tip touching the substrate and assigned an initial velocity. This strategy has also been widely employed in previous studies [,,,,]. The initial droplet diameter is set to
, and the computational domain is defined as
, with the configuration shown in the right half of Figure 3. The left half of Figure 3 provides the symmetric illustration corresponding to the axisymmetric model. The left boundary of the computational domain is specified as the axis of symmetry, while the top and right boundaries are treated as pressure outlets. The bottom boundary is defined as a wetted wall, where the dynamic contact angle model is applied. To ensure accuracy while maintaining computational efficiency, the mesh is locally refined around the droplet and gradually coarsens in regions farther away, which only contain air and had negligible influence on the droplet dynamics. The general initial and boundary conditions are summarized in Table 1. Case-specific parameters such as droplet diameter, impact velocity, substrate temperature, and ambient temperature are varied to match the corresponding experimental conditions presented in Section 3.2 and Section 3.3.
The time-dependent simulations are carried out using the built-in implicit solver. An adaptive backward differentiation formula (BDF) scheme of order 1–2 is employed. The maximum timestep is restricted to 1 × 10⁻⁶ s, while the initial timestep is set to 1 × 10⁻⁹ s. The relative tolerance is specified as 1 × 10⁻⁵. Under these settings, the actual timestep vary adaptively within 10−9~10−6 s. To examine mesh independence, four different levels of mesh refinement are tested by varying the minimum element size near the droplet interface and contact line (5 μm, 2.5 μm, 1.2 μm, and 0.6 μm), while keeping the maximum element size in the far-field air domain fixed at 50 μm. The results show that the difference in maximum spreading factor between the 1.2 μm and 0.6 μm meshes is less than 1%. Therefore, the mesh with a minimum element size of 1.2 μm and a maximum size of 50 μm is adopted for all subsequent simulations as a compromise between accuracy and computational cost.

Table 1.
General initial and boundary conditions used in the simulations.
Table 1.
General initial and boundary conditions used in the simulations.
| Condition | Specification |
|---|---|
| Left boundary (computational domain) | Axis of symmetry |
| Top and right boundaries (computational domain) | Pressure outlet, representing surrounding air to reduce computational cost |
| Bottom boundary (computational domain) | Cold wall with dynamic contact angle model |
| Initial droplet position | Placed on substrate surface |
| Initial droplet temperature | ) |
| Ambient temperature | Case-dependent, matched to experiments |
| Substrate temperature | Case-dependent, matched to experiments |
| Computational domain | (scaled with initial droplet diameter) |
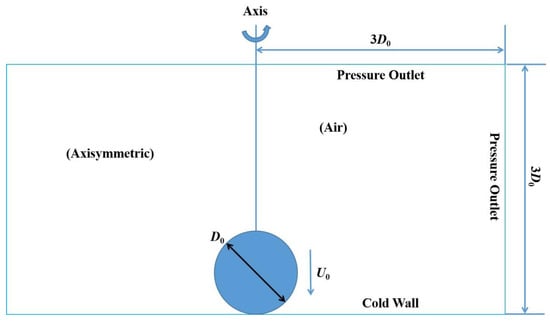
Figure 3.
Physical model (right half) and axisymmetric plane (left half).
3. Results and Discussion
3.1. Dynamic Variation in the Contact Angle
As described in Section 2.4, the equilibrium contact angle
is set to the actual receding and advancing angles during droplet spreading and retraction, respectively. To ensure numerical convergence, the abrupt variations in contact angle are smoothed using a formulation analogous to Equation (14). Specifically, when
m/s, the advancing contact angle
is adopted; when
m/s, the receding contact angle
is used. For intermediate velocities,
is interpolated between
and
following the approach of Equation (14). This formulation implies that when
,
exactly equals
.
To highlight the variations in contact angle during the spreading and retraction processes, simulations are performed on a surface with pronounced contact angle hysteresis, characterized by
[]. The initial droplet diameter and temperature are set to
mm and
, respectively. Both the ambient temperature
and the substrate temperature
are maintained at 15 °C. The impact velocity is specified as
m/s. Under these conditions, Figure 4a,b illustrate the droplet morphologies at t = 2.5 ms during spreading and at t = 11.0 ms during retraction, along with the corresponding local contact angle distribution as a function of the horizontal distance
from the symmetry axis on the substrate.
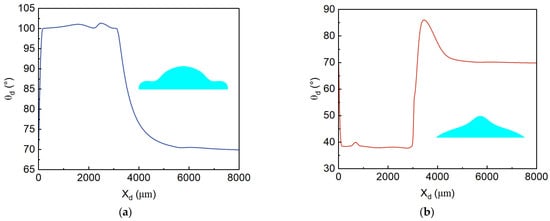
Figure 4.
Contact angle distribution at different wall positions and the corresponding droplet morphology: (a) spreading stage at t = 2.5 ms; (b) retraction stage at t = 11.0 ms.
For Figure 4a, the droplet is in the spreading stage, and the dynamic contact angle
obtained from the Kistler model with
,
approaches the advancing angle
near the symmetry axis. At locations farther away from the symmetry axis, the contact line velocity
is zero. As a result, according to Equation (20), the capillary number
, and substitution into Equation (18) yields
. As noted earlier, when
,
exactly equals
. Therefore, at these locations, the dynamic contact angle is
. Similarly, in Figure 4b, near the symmetry axis,
approaches the receding angle
, while at positions farther away it tends toward
. This demonstrates that the present formulation effectively captures the dynamic variation in the contact angle during both spreading and retraction stages.
3.2. Validation of the Proposed Model
3.2.1. Determination of Velocity-Gate Parameters
The velocity-gate parameter
governs the activation timing of the Darcy momentum source. To identify a parameter that better reflects the real physical process, we take the experimental data reported in [] as a reference. The corresponding operating condition is characterized by
, droplet supercooling degree
,
,
m/s,
, and an initial droplet diameter
of 2.84 mm. In the simulations, the physical properties of water below the freezing point are assigned according to Table 2 [].

Table 2.
Physical properties of water [].
We perform simulations with different values of
. To evaluate which value provides results closer to the real physical behavior, we introduce the dimensionless spreading factor
, where
denotes the instantaneous droplet–substrate contact diameter and
is the initial droplet diameter. The temporal evolution of
for different
values is plotted in Figure 5, together with the experimental data for direct comparison. In addition, Table 3 summarizes the maximum spreading factor () and the corresponding time obtained from both experiments and simulations.
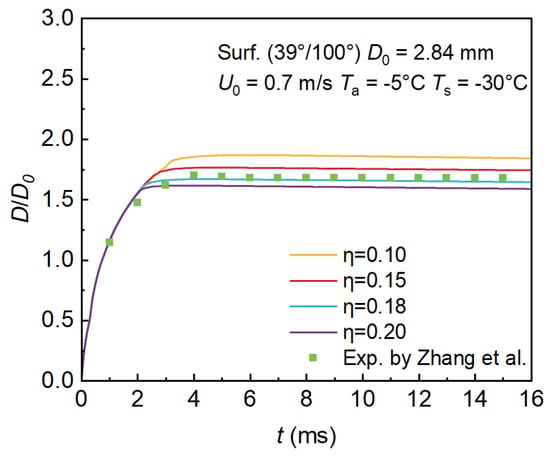
Figure 5.
Comparison of spreading factors obtained with different
values and experimental measurements under hydrophilic substrate conditions reported in reference [].

Table 3.
Maximum spreading factors and corresponding time (ms), together with relative deviations (%), obtained from simulations with different η values and experimental measurements under hydrophilic substrate conditions reported in reference [].
As shown in Table 3, when
= 0.18, the relative deviation of the maximum spreading factor from the experimental value is only −1.76%, whereas larger deviations are observed for other
values. Moreover, the corresponding arrival time of the maximum spreading factor is 4.2 ms, which differs from the experimental measurement by only 0.2 ms. From Figure 5, it can be further observed that the spreading factor curve obtained with
= 0.18 matches well with the experimental data. Therefore,
= 0.18 is considered the optimal gate parameter for the simulations.
3.2.2. Droplet Morphology Comparison
In the previous subsection, the optimal gate parameter was identified. In this subsection, we further present the droplet morphologies simulated under this parameter to validate the capability of the proposed method in capturing the actual physical shapes.
First, the early spreading stage is examined. The proposed velocity-gate-based activation control strategy for the Darcy momentum source is specifically designed to address the spurious application of the Darcy source at the liquid-air interface during the initial spreading phase. Therefore, we compare the simulated morphology under the optimal gate parameter with that obtained without employing this strategy, as shown in Figure 6.
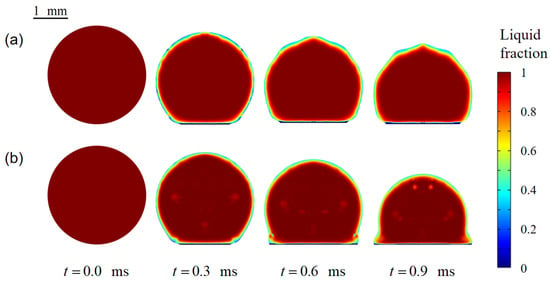
Figure 6.
Comparison of droplet morphologies during the early spreading stage under different strategies: (a) Darcy momentum source activated throughout the spreading process; (b) the proposed velocity-gate-based activation strategy.
As illustrated in Figure 6b, although erroneous freezing regions are still identified at the liquid-air interface during the early spreading stage, the droplet morphology remains unaffected since the Darcy momentum source is not activated, and thus no artificial velocity suppression occurs.
In addition, Figure 7 compares the droplet morphology predicted by the proposed method under the optimal gate parameter with the corresponding experimental observations. It is evident that the proposed strategy captures the droplet morphology with high fidelity, demonstrating good agreement with experimental results.

Figure 7.
Comparison of droplet morphologies on a hydrophilic substrate between the experimental results of reference [] and the present simulation: (a) experiment; (b) simulation.
3.2.3. Comparison of Spreading Factor
To further demonstrate the effect of the proposed velocity-gated activation strategy, we compare it with the conventional always-on Darcy source, in which the porous-medium damping is applied throughout the entire freezing process solely based on the liquid fraction. Figure 8 presents the temporal evolution of the spreading factor () under both strategies, together with experimental data for reference. It is observed that the always-on Darcy source strategy leads to a significant underprediction of the spreading factor, since spurious freezing near the liquid–air interface suppresses the local velocities prematurely. In contrast, the proposed velocity-gated strategy successfully eliminates such nonphysical suppression, and the predicted spreading evolution shows much better agreement with the experiments.
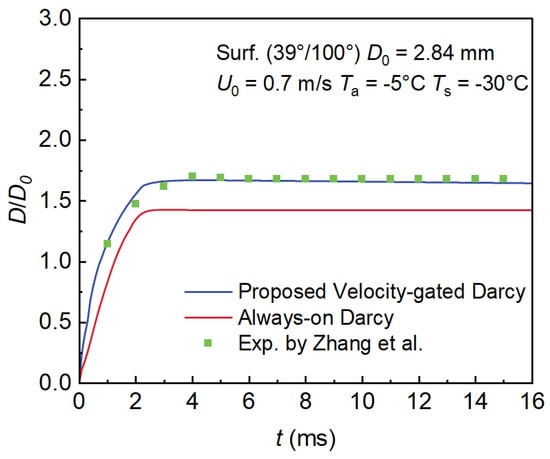
Figure 8.
Spreading factor obtained with the conventional always-on Darcy source and the proposed velocity-gated Darcy source, compared with experimental data [].
In addition, Table 4 summarizes the maximum spreading factor () and the corresponding time obtained with the two strategies. The proposed method reduces the relative deviation of the maximum spreading factor from −15.88% (always-on Darcy) to −1.76%, and the relative deviation of the corresponding time from −27.55% to +5.0%. These results confirm that the velocity-gated activation significantly improves the accuracy of predicting impact dynamics.

Table 4.
Comparison of maximum spreading factor and corresponding time (ms), including relative deviations (%), between the conventional always-on Darcy source and the proposed velocity-gated Darcy source, together with experimental results [].
3.3. Validation of the Proposed Model Under Multiple Operating Conditions
In the previous subsection, the model was validated against the experimental results reported in [], and the findings demonstrated that the proposed method can accurately capture the droplet impact process under that condition. In this subsection, we extend the investigation to different operating conditions to further examine the applicability of the proposed approach.
First, simulations are conducted for another set of superhydrophobic substrate conditions reported in []. The substrate exhibits a contact angle of
, while the remaining parameters are kept consistent with the hydrophilic case discussed in the previous subsection. Figure 9 presents the temporal evolution of the spreading factor obtained from both simulations and experiments.
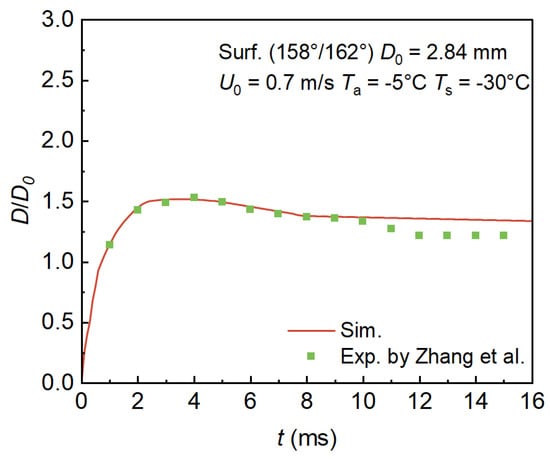
Figure 9.
Comparison of the spreading factor obtained from simulations and experimental measurements under the superhydrophobic substrate condition reported in reference [].
The maximum spreading factor predicted by the simulation is 1.52, differing from the experimental value of 1.53 by only 0.01, indicating that the proposed strategy can still accurately predict the maximum spreading factor under superhydrophobic conditions. As shown in Figure 9, the simulation captures the droplet dynamics well during the spreading and early recoiling stages. However, at later times, freezing at the droplet–substrate contact line causes the spreading factor to be fixed, preventing the reproduction of the secondary recoiling observed in the experiment. This leads to slightly higher simulated values in the later stage. Nevertheless, the simulation successfully captures the physical phenomenon where contact line freezing results in an almost constant spreading factor. Therefore, the proposed method remains effective in reproducing the supercooled droplet impact behavior on superhydrophobic substrates.
Subsequently, we refer to multiple experiments reported by Kong et al. [] and vary the droplet size, impact velocity, temperature, and substrate wettability in the simulations to examine the performance of the proposed method under different conditions. We first consider the case with
,
mm,
m/s, and a hydrophilic substrate with a contact angle of
. The comparison of the simulated and experimental spreading factor is shown in Figure 10a. It can be observed that, under hydrophilic conditions, the proposed method successfully captures the spreading evolution of the supercooled droplet at a high Reynolds number. The predicted maximum spreading factor differs from the experimental value by only 1.0%, as summarized in Table 5.
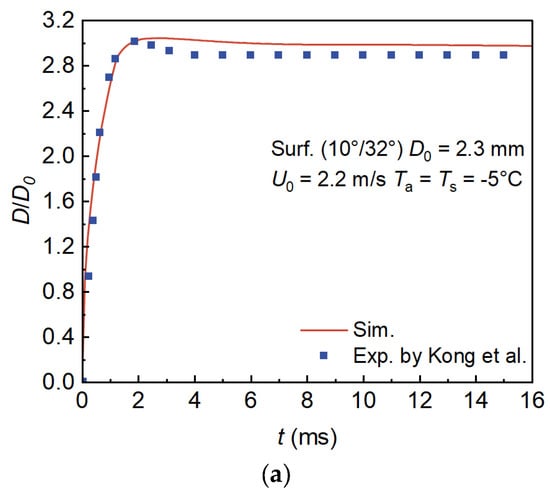
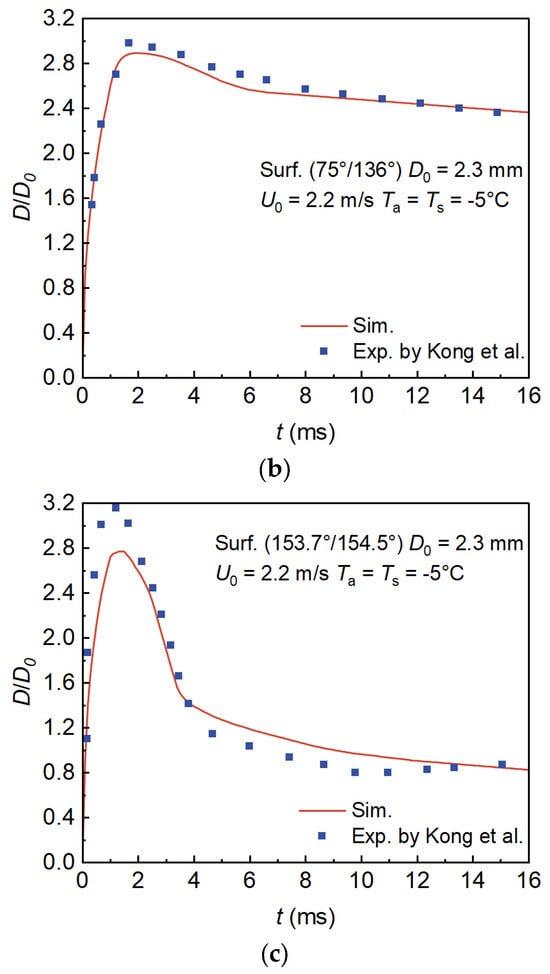
Figure 10.
Comparison of spreading factors between simulations and experiments under high Reynolds number conditions at −5 °C for droplets impacting substrates with different wettabilities []. (a) Hydrophilic substrate, (b) Hydrophobic substrate, (c) Superhydrophobic substrate.

Table 5.
Comparison of maximum spreading factors, including relative deviations (%), from simulations and experiments for high-Reynolds-number droplet impact at −5 °C on substrates with different wettabilities [].
Next, we replace the substrate with a hydrophobic surface () while keeping the other conditions unchanged. The results are shown in Figure 10b. In this case, the simulated spreading factor agrees well with the experimental measurements, with a prediction error of −2.7% for the maximum spreading factor, indicating that the model can reliably predict the droplet impact process on a hydrophobic substrate.
Finally, we examine the case with a superhydrophobic substrate (), and the results are presented in Figure 10c. Although the predicted maximum spreading factor exhibits a relative deviation of −11.7%, the simulation still captures the overall spreading-recoiling dynamics well. In particular, the predicted spreading factor during the recoiling stage closely matches the experimental data, suggesting that the model remains capable of providing meaningful predictions under this condition. The relatively larger deviation mainly arises from two aspects: first, the limitation of the dynamic contact angle correlation when extrapolated to extremely high apparent angles, which cannot fully represent the actual wetting behavior on textured superhydrophobic surfaces; and second, the Darcy damping formulation suppresses the velocity of frozen regions completely, while in reality partially frozen layers on superhydrophobic substrates may still undergo slip-like motion together with the droplet. This over-constraint of the spreading stage leads to an underprediction of the maximum spreading factor, although the subsequent recoil is reproduced satisfactorily.
We further simulate the experiments conducted under different temperature conditions, and the maximum spreading factors obtained from both simulations and experiments are summarized in Table 6. Figure 11a presents the comparison under hydrophilic conditions () with
,
mm, and
m/s. As shown in the figure, at lower temperature conditions with a hydrophilic substrate, the simulation accurately predicts the droplet spreading behavior, and the error in the maximum spreading factor is only −1.64%.

Table 6.
Maximum spreading factors of supercooled droplets, including relative deviations (%), at lower temperatures on substrates with different wettabilities [].
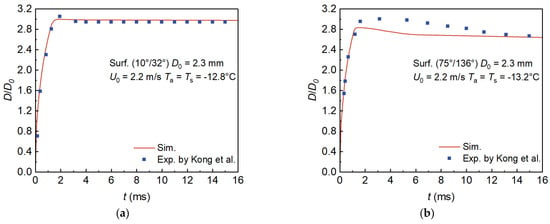
Figure 11.
Comparison of spreading factors between simulations and experiments under lower temperature conditions for droplets impacting substrates with different wettabilities []. (a) T = −12.8 °C, hydrophilic substrate; (b) T = −13.2 °C, hydrophobic substrate.
Figure 11b shows the comparison for a hydrophobic substrate () with
while keeping the other parameters unchanged. It can be observed that the simulation still reproduces the spreading factor evolution well, with a prediction error of −5.33% for the maximum spreading factor. Compared with the warmer case in Figure 10b, the deviation becomes larger here due to the stronger freezing effect. At lower temperatures, the freezing region expands more rapidly, the Darcy-type damping is enhanced, and the retraction is more strongly suppressed. In particular, part of the kinetic energy that would normally be converted into surface energy to drive rebound is dissipated by the Darcy sink, so the droplet tends to be “frozen” earlier in the retraction stage, leading to larger discrepancies from the experiments. Nevertheless, the predictive capability of the proposed method remains valid, as the relative deviation is still limited to −5.33%. This tendency reflects a common limitation of Darcy-type momentum sink models and will be further addressed in future work.
In addition, the velocity-gated strategy introduces negligible computational overhead, since the additional cost is only a simple conditional check. More importantly, by delaying the activation of the Darcy damping until after the initial high-velocity spreading stage, the solver avoids excessive resistance when velocities change rapidly. This helps maintain numerical stability in the most dynamic phase, so convergence is generally improved and the overall simulation is completed faster.
These results confirm that the proposed method is robust under diverse operating conditions and improves the accuracy of existing prediction tools for aircraft icing.
4. Conclusions
This study developed a velocity-threshold-based activation strategy for the Darcy momentum source to improve the simulation of supercooled droplet impact and freezing. The main findings are summarized as follows:
- The dynamic contact angle model is improved by specifying the real advancing and receding angles as the equilibrium contact angle in the spreading and recoiling stages. This treatment improves the accuracy of spreading and recoiling predictions compared with simplified static angle assumptions.
- The proposed strategy effectively eliminates the influence of the nonphysical misidentification of freezing regions near the contact line in the early stage of spreading, ensuring that droplet spreading remains undistorted. And the predicted morphology agrees well with experiments.
- The proposed approach is further examined under a wide range of conditions, including variations in contact angle, temperature, impact velocity, and droplet size. The simulations consistently capture the temporal evolution of the spreading factor and show good agreement with experimental measurements. The relative deviation in the predicted maximum spreading factor remains within acceptable limits, with the largest observed discrepancy being 11.7%, demonstrating the robustness and reliability of the model.
Overall, the results demonstrate that the proposed method is robust under diverse operating conditions and enhances the accuracy of existing numerical tools for aircraft icing prediction and anti-icing design.
Author Contributions
Conceptualization, Y.W. and L.W.; methodology, Y.W.; software, Y.W. and X.W.; validation, Y.W., L.W. and R.C.; formal analysis, P.C.; investigation, Y.W.; resources, X.J.; data curation, X.J. and L.W.; writing—original draft preparation, Y.W. and L.W.; writing—review and editing, L.W.; visualization, X.W.; supervision, R.C. and P.C.; project administration, X.J.; funding acquisition, X.J. All authors have read and agreed to the published version of the manuscript.
Funding
This research received no external funding.
Data Availability Statement
Data will be made available on reasonable request.
Conflicts of Interest
The authors declare no conflicts of interest.
Abbreviations and Notations
The following abbreviations are used in this manuscript:
| Abbreviations | |
| VOF | Volume of fluid |
| DCA | Dynamic contact angle |
| LBM | Lattice Boltzmann method |
| MDPD | Many-body dissipative particle dynamics |
| CSF | Continuum surface force |
| BDF | Backward differentiation formula |
| Notation | |
| Volume fractions of the primary (air) and secondary (water-ice) phases | |
| Density, kg·m−3 | |
| Velocity vector, m·s−1 | |
| Momentum source term, N·m−3 | |
| Gravity acceleration, m·s−2 | |
| Viscosity, Pa·s | |
| Surface tension coefficient, N·m−1 | |
| Curvature, m−1 | |
| Unit normal vector, m | |
| Contact angle, ° | |
| Ice mass fraction | |
| Supercooling degree, °C | |
| Freezing temperature (point), °C | |
| Stefan number | |
| Specific heat, J·kg−1·K−1 | |
| Latent heat of solidification, J·kg−1 | |
| Thermal conductivity, W·m−1·K−1 | |
| Enthalpy, J·kg−1 | |
| Liquid water fraction in the secondary (water-ice) phase | |
| Solidus temperature, °C | |
| Liquidus temperature, °C | |
| Phase change temperature range, °C | |
| Physical properties | |
| Energy source term, J·m−3·s−1 | |
| Mushy zone constant | |
| Dynamic contact angle, ° | |
| Capillary number | |
| Equilibrium contact angle, ° | |
| Velocity tangential to the interface, m·s−1 | |
| Advancing contact angle, ° | |
| Receding contact angle, ° | |
| Dynamic Darcy source term, N·m−3 | |
| Upper velocity thresholds of Dynamic Darcy source term, m·s−1 | |
| Lower velocity thresholds of Dynamic Darcy source term, m·s−1 | |
| Gate parameter of Dynamic Darcy source term | |
| Maximum spreading velocity, m·s−1 | |
| Darcy source term change velocity range, m·s−1 | |
| Time threshold to prevent mis-triggering of Dynamic Darcy source term, s | |
| Initial droplet diameter, m | |
| Ambient air temperature, °C | |
| Surface temperature, °C | |
| Initial droplet impact velocity, m·s−1 | |
| Horizontal distance, m | |
| Spreading factor | |
| Maximum spreading factor |
References
- Cao, Y.; Wu, Z.; Su, Y.; Xu, Z. Aircraft flight characteristics in icing conditions. Prog. Aerosp. Sci. 2015, 74, 62–80. [Google Scholar] [CrossRef]
- Van Zante, J.; Bond, T. Overview of NASA’s in-flight icing education and training for pilots. In Proceedings of the 41st Aerospace Sciences Meeting and Exhibit, Reno, NV, USA, 6–9 January 2003; American Institute of Aeronautics and Astronautics: Reno, NV, USA, 2003. [Google Scholar]
- Zhang, X.; Wu, X.M.; Min, J.C. Aircraft icing model considering both rime ice property variability and runback water effect. Int. J. Heat Mass Transf. 2017, 104, 510–516. [Google Scholar] [CrossRef]
- Dalili, N.; Edrisy, A.; Carriveau, R. A review of surface engineering issues critical to wind turbine performance. Renew. Sustain. Energy Rev. 2009, 13, 428–438. [Google Scholar] [CrossRef]
- Alizadeh, A.; Yamada, M.; Li, R.; Shang, W.; Otta, S.; Zhong, S.; Ge, L.; Dhinojwala, A.; Conway, K.R.; Bahadur, V.; et al. Dynamics of ice nucleation on water repellent surfaces. Langmuir 2012, 28, 3180–3186. [Google Scholar] [CrossRef]
- Hindmarsh, J.P.; Buckley, C.; Russell, A.B.; Chen, X.D.; Gladden, L.F.; Wilson, D.I.; Johns, M.L. Imaging droplet freezing using MRI. Chem. Eng. Sci. 2004, 59, 2113–2122. [Google Scholar] [CrossRef]
- James, R.L.; Phillips, V.T.J.; Connolly, P.J. Secondary ice production during the breakup of freezing water drops on impact with ice particles. Atmos. Chem. Phys. Discuss. 2021, 21, 18519–18530. [Google Scholar] [CrossRef]
- Zhao, Y.; Zuo, Z.; Tang, H.; Zhang, X. Ice coverage induced by depositing a water drop onto the supercooled substrate at extreme low vapor pressure. Crystals 2021, 11, 691. [Google Scholar] [CrossRef]
- Zhang, X.; Zhu, Z.; Zhang, C.; Yang, C. Reduced contact time of a droplet impacting on a moving superhydrophobic surface. Appl. Phys. Lett. 2020, 117, 151602. [Google Scholar] [CrossRef]
- Wang, H.; Wu, Q.; Okagaki, J.; Alizadeh, A.; Shamim, J.A.; Hsu, W.-L.; Daiguji, H. Bouncing behavior of a water droplet on a super-hydrophobic surface near freezing temperatures. Int. J. Heat Mass Transf. 2021, 174, 121304. [Google Scholar] [CrossRef]
- Schremb, M.; Roisman, I.V.; Tropea, C. Normal impact of supercooled water drops onto a smooth ice surface: Experiments and modelling. J. Fluid Mech. 2018, 835, 1087–1107. [Google Scholar] [CrossRef]
- Ding, B.; Wang, H.; Zhu, X.; Chen, R.; Liao, Q. Water droplet impact on superhydrophobic surfaces with various inclinations and supercooling degrees. Int. J. Heat Mass Transf. 2019, 138, 844–851. [Google Scholar] [CrossRef]
- Zhao, J.; Li, X.; Cheng, P. Lattice Boltzmann simulation of a droplet impact and freezing on cold surfaces. Int. Commun. Heat Mass Transf. 2017, 87, 175–182. [Google Scholar] [CrossRef]
- Jin, L.; Wang, Y.L. Numerical study on effects of large curved superhydrophobic surfaces on droplet post-impact dynamics. Colloid Interface Sci. Commun. 2022, 51, 100676. [Google Scholar] [CrossRef]
- Liu, X.; Min, J.; Zhang, X.; Hu, Z.; Wu, X. Supercooled water droplet impacting-freezing behaviors on cold superhydrophobic spheres. Int. J. Multiph. Flow 2021, 141, 103675. [Google Scholar] [CrossRef]
- Zhang, X.; Liu, X.; Wu, X.; Min, J. Impacting-freezing dynamics of a supercooled water droplet on a cold surface: Rebound and adhesion. Int. J. Heat Mass Transf. 2020, 158, 119997. [Google Scholar] [CrossRef]
- Chang, S.; Liang, D.; Song, M.; Leng, M. Numerical investigation on impingement dynamics and freezing performance of micrometer-sized water droplet on dry flat surface in supercooled environment. Int. J. Multiph. Flow 2019, 118, 150–164. [Google Scholar] [CrossRef]
- Ding, M.; Shang, Y.; Vetrano, M.R.; Hussong, J.; Roisman, I.V. Freezing in a drop impacting a cold substrate: Where dendrites can’t penetrate? J. Colloid Interface Sci. 2025, 700, 138372. [Google Scholar] [CrossRef]
- Kant, P.; Koldeweij, R.B.J.; Harth, K.; van Limbeek, M.A.J.; Lohse, D. Fast-freezing kinetics inside a droplet impacting on a cold surface. Proc. Natl. Acad. Sci. USA 2020, 117, 2788–2794. [Google Scholar] [CrossRef]
- Ho, W.C.G.; Chen, C.J.; Kay, B.A.; Palmer, R.E. Nucleation at the contact line observed on nanotextured surfaces. Phys. Rev. Lett. 2014, 113, 235701. [Google Scholar] [CrossRef]
- Chang, S.; Qi, H.; Zhou, S.; Yang, Y. Experimental study on freezing characteristics of water droplets on cold surfaces. Int. J. Heat Mass Transf. 2022, 194, 123108. [Google Scholar] [CrossRef]
- El Ghossein, J. Investigating Droplet Impact Dynamics on Engineered Surfaces: Effects of Roughness, Wettability, and Prospects for Anti-Icing Applications. Ph.D. Thesis, Virginia Tech, Blacksburg, VA, USA, 2025. [Google Scholar]
- Hirt, C.W.; Nichols, B.D. Volume of fluid (VOF) method for the dynamics of free boundaries. J. Comput. Phys. 1981, 39, 201–225. [Google Scholar] [CrossRef]
- Brackbill, J.U.; Kothe, D.B.; Zemach, C. A continuum method for modeling surface tension. J. Comput. Phys. 1992, 100, 335–354. [Google Scholar] [CrossRef]
- Czys, R.R. Ice initiation by collision-freezing in warm-based cumuli. J. Appl. Meteorol. 1989, 28, 1098–1104. [Google Scholar] [CrossRef]
- Sun, M.; Kong, W.; Wang, F.; Liu, H. Impact freezing modes of supercooled droplets determined by both nucleation and icing evolution. Int. J. Heat Mass Transf. 2019, 142, 118431. [Google Scholar] [CrossRef]
- Zhang, X.; Wu, X.M.; Min, J.C. Freezing and melting of a sessile water droplet on a horizontal cold plate. Exp. Therm. Fluid Sci. 2017, 88, 1–7. [Google Scholar] [CrossRef]
- Feuillebois, F.; Lasek, A.; Creismeas, P.; Pigeonneau, F.; Szaniawski, A. Freezing of a subcooled liquid droplet. J. Colloid Interface Sci. 1995, 169, 90–102. [Google Scholar] [CrossRef]
- Bejan, A.; Kraus, A.D. Heat Transfer Handbook; John Wiley & Sons: Hoboken, NJ, USA, 2003. [Google Scholar]
- Hu, A.; Yuan, Q.; Guo, K.; Wang, Z.; Liu, D. 3D simulations of freezing characteristics of double-droplet impact on cold surfaces with different wettability. Entropy 2022, 24, 1650. [Google Scholar] [CrossRef]
- Voller, V.R.; Prakash, C. A fixed grid numerical modelling methodology for convection-diffusion mushy region phase-change problems. Int. J. Heat Mass Transf. 1987, 30, 1709–1719. [Google Scholar] [CrossRef]
- Shen, F.; Fang, W.-Z.; Zhang, S.; Zhang, X.; Yang, C.; Tao, W.-Q. Numerical simulations of freezing behaviors of water droplets impacting cold hydrophobic surfaces. Appl. Therm. Eng. 2025, 258, 124521. [Google Scholar] [CrossRef]
- Eral, H.B.; Mannetje, D.J.C.M.T.; Oh, J.M. Contact angle hysteresis: A review of fundamentals and applications. Colloid Polym. Sci. 2013, 291, 247–260. [Google Scholar] [CrossRef]
- Kistler, S.F. Hydrodynamics of wetting. In Wettability; Berg, J.C., Ed.; Marcel Dekker: New York, NY, USA, 1993; p. 311. [Google Scholar]
- Ji, B.; Song, Q.; Yao, Q. Numerical study of hydrophobic micron particle’s impaction on liquid surface. Phys. Fluids 2017, 29, 077102. [Google Scholar] [CrossRef]
- Voinov, O.V. Hydrodynamics of wetting. Fluid Dyn. 1977, 11, 714–721. [Google Scholar] [CrossRef]
- Yang, F.; Cruikshank, O.; He, W.; Kostinski, A.; Shaw, R.A. Nonthermal ice nucleation observed at distorted contact lines of supercooled water drops. Phys. Rev. E 2018, 97, 023103. [Google Scholar] [CrossRef]
- Tavakoli, F.; Davis, S.H.; Kavehpour, H.P. Freezing of supercooled water drops on cold solid substrates: Initiation and mechanism. J. Coat. Technol. Res. 2015, 12, 885–891. [Google Scholar] [CrossRef]
- Dalgamoni, H.N.; Yong, X. Numerical and theoretical modeling of droplet impact on spherical surfaces. Phys. Fluids 2021, 33, 052112. [Google Scholar] [CrossRef]
- Hu, Z.; Chu, F.; Wu, X. Double-peak characteristic of droplet impact force on superhydrophobic surfaces. Extrem. Mech. Lett. 2022, 52, 101665. [Google Scholar] [CrossRef]
- Haynes, W.M. CRC Handbook of Chemistry and Physics, 95th ed.; CRC Press: Boca Raton, FL, USA, 2014. [Google Scholar]
- Kong, W.; Wang, L.; Bian, P.; Liu, H. Effect of surface wettability on impact-freezing of supercooled large water droplet. Exp. Therm. Fluid Sci. 2022, 130, 110508. [Google Scholar] [CrossRef]
Disclaimer/Publisher’s Note: The statements, opinions and data contained in all publications are solely those of the individual author(s) and contributor(s) and not of MDPI and/or the editor(s). MDPI and/or the editor(s) disclaim responsibility for any injury to people or property resulting from any ideas, methods, instructions or products referred to in the content. |
© 2025 by the authors. Licensee MDPI, Basel, Switzerland. This article is an open access article distributed under the terms and conditions of the Creative Commons Attribution (CC BY) license (https://creativecommons.org/licenses/by/4.0/).