Abstract
For military missions, the helicopter is a versatile aircraft with many benefits. However, the high levels of noise radiation enable large acoustic detection ranges. For mission success, knowledge of acoustic radiation and propagation is paramount. This paper describes the results of acoustic measurements for a helicopter that is typically used for operations by the German special forces. The measurements include identification of the global noise radiation during different flight conditions, determination of the time between acoustic detection and arrival at the target location, and determination of the acoustic detection distance. Different approaches and departure procedures were executed, and the acoustic radiation was measured. Results indicate that during approaches, the most noise is generated either during the transition from steady level flight to descent/deceleration or at the end of the flare procedure. For the helicopter considered here, a left turn departure generates more noise at a target location then a right turn departure.
1. Introduction
Helicopters are versatile aircraft, with the distinct ability to take off and land vertically on unprepared terrain as one of their main benefits. This benefit is exploited in many missions by special forces, to move operators and/or equipment to unprepared locations. However, the deployment of helicopters also has drawbacks: they are slow compared to fixed-wing aircraft, and they radiate high noise levels. Noise of a helicopter is characterized by a highly directional radiation pattern and depends strongly on the flight condition. Knowledge of this noise radiation is relevant in military missions since the helicopter can be acoustically detected at large distances. Combined with the low speed and close ground proximity, this makes the helicopter vulnerable to attack, diminishes the element of surprise, and increases mission risk.
For civil applications, much work has been published on noise abatement flight procedures [1,2,3,4]. The same technology can be used for military applications, although the goal for military applications is usually to avoid any acoustic detection, by humans or electronic detection equipment, rather than to minimize annoyance. Therefore, the usual metrics applied for civil applications, such as Sound Exposure Level or Effective Perceived Noise Level, do not apply. Military applications may also include procedures that actually maximize noise as a way to deter, scare, or intimidate. Efforts were made to determine the acoustic detection of helicopters with field tests by Loewy [5] and further refined with laboratory experiments by Ollerhead [6] and via a flight test [7]. Further investigations include [8,9,10]. In addition, acoustic detection is considered during helicopter design [11]. Measurements of the acoustic radiation of military helicopters are reported in [12,13].
Noise prediction tools for helicopters usually depend on a database of noise hemispheres for the description of noise sources [4,14,15]. This database can be obtained by dedicated flight tests [16] or by numerical simulation [1,17]; both approaches have advantages and disadvantages. For the current application, the choice was made to obtain initial data by a flight test. This kind of data can be used in noise prediction tools, but it is also useful to understand, support and explain the results of other acoustic measurements for helicopters.
In this paper, the noise emission of the H145-LUH-SOF helicopter is assessed, with a focus on missions for the German special forces (Kommando Spezialkräfte, KSK). In oder to achieve this goal, the German Aerospace Center (DLR) cooperated with the KSK, the Wehrtechnische Dienststelle 61 (WTD61), and Hubschraubergeschwader 64 (HSG64), to perform acoustic measurements. Operational procedures were defined by KSK and HSG64, while WTD61 provided the helicopter, terrain for the measurements, and optical flight path tracking by kinetheodolite (KTH). DLR operated ground-based microphones, coordinated the tests, and conducted the data fusion and subsequent post processing of all data. Ground-based microphones are easier to manage and set up than more complex layouts, which require for instance a pole/mast/crane [12] or suspended microphones from a hot air balloon [18]. Some argue that the added cost and complexity of microphones mounted above ground are not justified against the added value [19]. Directorate of Flight Safety of the German Bundeswehr was involved to enable data collection from the helicopter’s onboard flight data recorder (FDR). The helicopter was operated by a joint crew of WTD61 and HSG64.
In addition to the measurement of the specific noise radiation for predetermined flight conditions, the measurements include the acoustic assessment of intervention time and detection distance. Intervention time is defined as the amount of time between the first acoustic detection at a target location and the arrival of the helicopter at that target location. Detection distance is the distance at which a helicopter can be acoustically detected. Measurements of intervention time and detection distance were meant to provide first data points with a direct practical relevance. Here, different approach and departure procedures were executed in order to assess the noise radiation over large distances.
In this paper, the experimental setup is described first. After that, the results for the source identification, detection distance measurements, and intervention time measurement are presented and discussed. At the end, conclusions are drawn and recommendations for future measurements are proposed.
2. Materials and Methods
This section describes the experimental setup and equipment that were used during the experiments.
2.1. Helicopter
The H145-LUH-SOF helicopter is a light utility helicopter (LUH) for special operations forces (SOF) based on the BK117-D2; manufactured by Airbus Helicopters, Donauworth, Germany, see Figure 1. It has a 4-blade main rotor and a 10-blade Fenestron. This is a H145M with specific modifications for use by special forces. It has many optional pieces of exterior equipment, which can be combined in any way necessary for the mission at hand. External equipment can be relevant to acoustic radiation, because it affects the drag of the helicopter and the center of gravity and thereby the trim. It is also possible for external equipment to generate flow noise. Table 1 shows the optional exterior equipment considered here along with two configurations that were deemed most relevant by HSG64. The electronic warfare system (EWS) dispensers are four boxes that are mounted to the landing gear. Fast rope beams are special equipment on the left and right, mounted to the supports for the rescue winch. They can be folded in or out or not mounted. These beams are used to connect fast ropes to exit the helicopter. The two configurations were flown during the source identification tests. Detection distance and intervention time measurements were conducted only for configuration D, as this is the most relevant configuration for practical approaches. At the start of a mission, the helicopter is usually close to the maximum take-off weight. Upon arrival, 240 kg of fuel is consumed (on average), so that the weight upon arrival is 3460 kg. It is desirable to keep the weight within 2% of this value to generate representative and consistent results. Therefore, the weight was kept within the range 3391–3529 kg. This was accomplished by loading 138 kg in lead bags roughly every 45 min. The loading of lead bags was documented to keep track of the total weight of the aircraft. Before refueling, the lead bags were removed again. We did not attempt to keep the center of gravity at the same location, and fuel was replaced with lead bags. We did, however, ensure that the center of gravity stayed within the allowable limits.
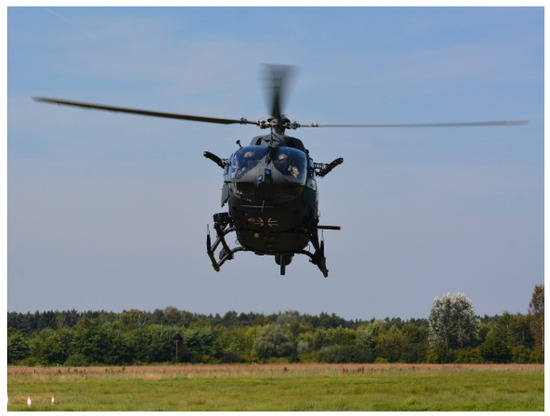
Figure 1.
H145-LUH-SOF in the configuration used during the flight experiments, with left and right fast rope beams extended.

Table 1.
H145-LUH-SOF exterior equipment configurations.
The BK117-D2 has an automatic rotor speed control which is based on density altitude and airspeed, and rotor speed varies in the range 96.5–107 %. Below 1500 ft, there is no change in rotor speed with density altitude. It is important to keep this variable rotor speed in mind, because the acoustic radiation is dependent on the tip Mach number of the rotors and the tonal frequencies of the rotor scale with rotor speed. For source identification, it is best to keep all parameters as constant as possible. There are three rotor speed regimes: one below 55 kts, one in the range 55–70 kts, and one above 120 kts. In the range 70–120 kts the rotor speed is undefined in the flight manual; most likely, it varies linearly. Since a rather large change in rotor speed occurs at 55 kts, it is best to avoid test points at this airspeed.
In order to be able to merge data from different sources (DLR, KTH, FDR), these need to be synchronized, which is performed based on time.
2.2. Microphone Layout
Due to a large amount of water on the terrain, because of excessive rain, it was not possible to place all microphones at predetermined positions. Positions had to be found on the terrain that had the least water. Therefore, the microphone positions appear to be scattered; however, the influence on the measurements is relatively small, as the final positions were accurately measured by differential GPS provided by WTD61. The microphone positions are plotted in Figure 2 in the local coordinate system. Here, is aligned with the middle of a road and positive in the east direction, is positive in the north direction, and is positive upwards. The road along was also used as visual guidance by the pilots; 1/2″ condenser microphones were placed on grass, inverted, and mounted on white circular ground plates with a diameter of 40 cm, made of aluminum. The distance between the microphone membrane and the plate was set to 7 mm. The microphones were connected to a wireless measurement system that can be controlled remotely via WLAN; time was synchronized by GPS. Data was recorded with a sample rate of 48 kHz and a resolution of 16 bits. This setup was also used in previous measurements [20,21] and is shown in Figure 3a. Microphones were connected to the measurement system by a cable with a length of at least 10 m. Microphones M1–M15 were used for source identification, and microphones M16–M33 were used for detection distance (Section 3.2.2) and intervention time (Section 3.2.1) measurements. M28 and M29 were mounted on a tripod 1.2 m above ground and directed in the positive direction. M1–M15 were located such that an equidistant spacing on a reconstructed hemisphere would be obtained for a flyover height of 80 m above the origin of the M coordinate system.
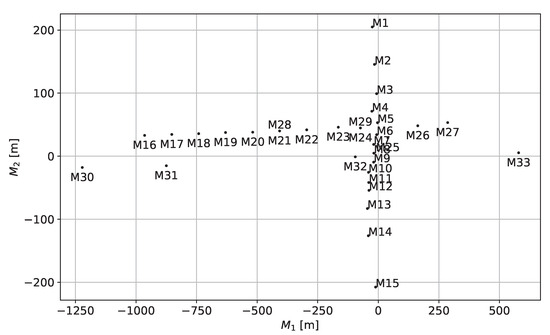
Figure 2.
Microphone layout in the M coordinate system.
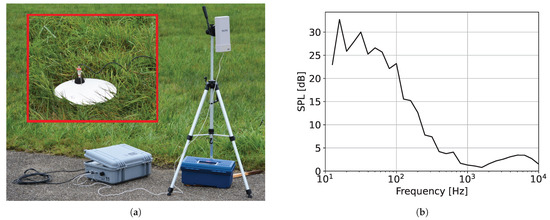
Figure 3.
Photo of the measurement suitcase (bottom left), WLAN antenna (right), and microphone on ground plate (inset top left) (a). Background noise spectrum for microphone M15 (b).
A typical 1/3 octave band spectrum of the background noise for microphone M15 is shown in Figure 3b. At other microphones, the background level is similar.
2.3. Time Synchronization
Position data and time synchronization are very important in these acoustic measurements; therefore, we chose to use the KTH stations provided and operated by WTD61 in addition to the onboard data from the flight data recorder (FDR). Due to certification requirements, it was not possible to attach additional measurement equipment (GPS sensor, inertia platform) to the helicopter. The KTH is an optical tracking system that uses multiple cameras to track the aircraft and determine its position by triangulation. The tracking is accomplished throufh post processing by semi-manual tracking of the rotor head in the images captured by the system. The accuracy is typically better than 20 cm. The time synchronization between the KTH and DLR acoustic stations was tested prior to the flight tests. A small balloon was burst at a distance of 1.5 m from a DLR microphone. The bursting of the balloon was simultaneously observed by one KTH station. The accuracy of this test is limited by the frame rate of the KTH, which is 25 Hz (40 ms). The result of this test indicated a synchronization within this time frame.
In addition, photos, with time stamps, of the helicopter passing over the photo reference point were taken for source identification measurements. The photo reference point was located at the origin of the M coordinate system. These photos were used to evaluate the flyover height in near real time. An example photo is shown in Figure 4. With a known measure of a component of the helicopter, such as the rotor diameter, the offsets and , relative to the photo reference point (center of the image), can be calculated. With additional information on the camera lens, the height above the reference point can be derived.
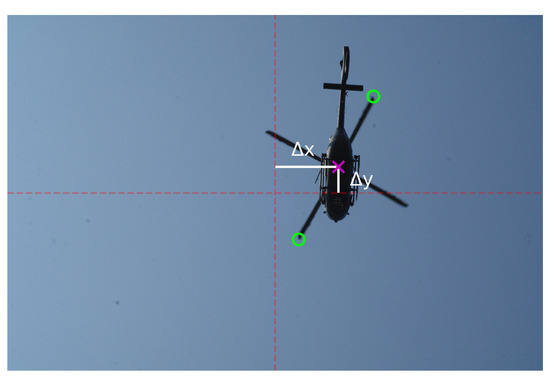
Figure 4.
Photo of the helicopter flying over the photo reference point. Blade tips are marked with green circles, the rotor head is marked with a magenta cross, and the offsets relative to the center of the image (photo reference location) are shown in white.
Post processing of the images with time stamps shows that the time synchronization between acoustic measurements and KTH during the source identification measurements was better than 40 ms. The most accurate position information was provided by the KTH. Synchronization with FDR varied between 1 and 3 s. The photos were also used to correct this FDR time.
2.4. Weather Conditions
Atmospheric conditions, such as humidity, wind, and temperature gradients can have a significant effect on the acoustic propagation through the atmosphere, especially for large propagation distances [22,23]. Therefore, DLR operated a ground-based weather station near the DLR measurement containers, located near m. Furthermore, limited weather data is available from the FDR. For the majority of measurement points, the wind velocity was well below 5.1 m/s (10 kts), which is a requirement for noise certification measurements according to Annex 16 [24]. The wind velocity measured by the FDR was consistently above the wind velocity measured on the ground, which makes physical sense because of the atmospheric boundary layer. The wind direction from the FDR and the ground station also showed a fair correlation. From the temperature measurements, it can be observed that the onboard temperature was always below the temperature on ground; there were no indications of a temperature inversion.
3. Results
The results were obtained during a measurement campaign of two weeks in September 2021 in a military training area just south of Manching airport in Germany.
3.1. Source Identification
The goal of the source identification flights is to measure the acoustic radiation in different directions and flight conditions. For these measurements, microphones M1–M15 were used. Note that no beamforming was applied. However, microphone M4 was not present for all measurements since the ground was too wet at this location. For these measurements, low-wind conditions are desirable. For all flights, high-quality KTH data is available, which is used to remove the Doppler frequency shift from the acoustic signal by solving the retarded time equation; this is similar to the method described in [25], with the difference being that in this paper, constant wind is also accounted for, instead of a quiescent homogeneous atmosphere. As part of the solution, the distance between the source and observer is also obtained, which is used to compensate for spherical spreading effects. Variations in rotor speed can be compensated for based on rotor speed data from the FDR. Many flights were executed with the aid of the auto-pilot; however, the auto-pilot disengages below 80 m above ground level and the pilot had to fly the remaining part of the procedure by hand. This only applies to descent flight procedures. The accuracy of the desired flight path is in the order of 10 m. Data for source identification was only used when the helicopter was within 700 m of the microphones.
Attitude angles () from the FDR were used to transform the data into a right-handed reference frame fixed to the helicopter. The origin of the H frame is in the main rotor head, with along the rotor mast and positive in the direction from rotor head to fuselage. is in the symmetry plane of the helicopter and positive forward. In the H frame, it is possible to define points at a constant reference distance () from the origin by two angles:
The data can now be visualized by a polar plot where is in the radial direction and is in the azimuth direction. A “top” view of a hemisphere for a descent flight at 90 kts and configuration A is shown in Figure 5a.
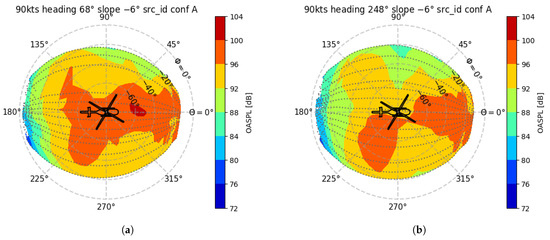
Figure 5.
Top view of measured hemisphere for descent at 90 kts, flying in the positive direction, with aircraft configuration A (a). Top view of measured hemisphere for descent at 90 kts, flying in the negative direction, with aircraft configuration A (b).
The overall sound pressure level is computed by dividing the time signal in intervals of 0.5 s, and this is shown in Figure 5a,b in decibels. The reference pressure was Pa. It can be seen in Figure 5a that, for this flight condition, most of the noise is radiated forward and to the forward right side. The least noise is radiated to the back of the helicopter. Note that each time interval contains a piece of the full time signal and can be translated to the frequency domain with an amplitude and phase. Most noise prediction tools take this information into account. Note that no noise information is available for . This is due to the use of ground-based microphones. If this information is needed for accurate noise modelling, the microphone setup must be extended by a mast or pole to ensure that microphones are up above the ground level [12]. Flying the helicopter at a lower altitude will cause ground effect interference (interaction of rotor downwash with the ground). Placing microphones further away from the flight path will result in a bad signal-to-noise ratio and increased refraction effects. Figure 5b shows the same hemisphere obtained by flying in the opposite direction. This gives an indication of the variations that occur for such measurements. Sources of variation in the measurements include the control inputs necessary to keep the inherent unstable helicopter on a prescribed flight path, variations in inflow due to atmospheric disturbances, and variations in the atmosphere causing variations in acoustic propagation. Multiple measurements for the same flight condition can be combined to form a single hemisphere, e.g., least squares fit based on spherical harmonics or Fourier series [26]; however, such techniques were not applied here.
The purpose of these post-processing steps is to make the acoustic signal as stationary as possible and to transform the data to a frame of reference that moves with the helicopter, which generalizes the data.
The measurements indicate that a difference between configuration A and D can be observed in the acoustic results. Figure 6 shows the hemisphere for the same flight condition as in Figure 5a,b, but for the aircraft in configuration D. It must however be noted that this observation is based on two measurements per configuration, which is not much, and more measurements would be necessary for a statistically reliable difference. The general directivity is very similar; mainly, differences in level are observed. At high speed, the differences are more pronounced than at low speed.
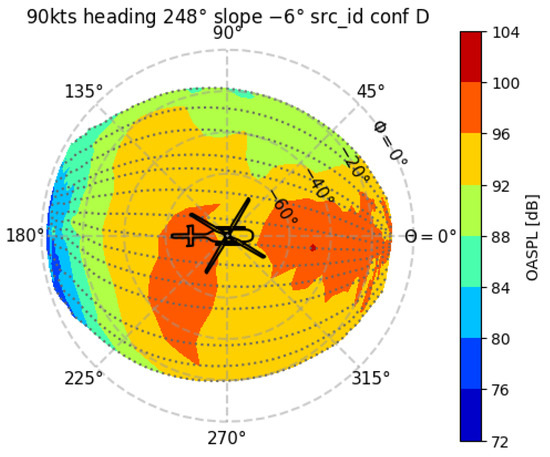
Figure 6.
Top view of measured hemisphere for descent at 90 kts, flying in the negative direction, with aircraft configuration D.
3.2. Operational Procedures
For military intervention missions, there are mainly two approach strategies. Either the landing point of the helicopter is far from the target and the goal is to make sure the helicopter is not acoustically detected at the target, or the helicopter flies directly onto the target and uses the element of surprise to its advantage. For the first strategy, a suitable landing point should be chosen depending on atmospheric conditions (wind direction, wind magnitude, and temperature gradients), terrain (use of mountains/vegetation to shield noise), and flight procedure (avoiding noisy flight conditions, direct noise away from the target). For the second strategy, knowledge of the intervention time is relevant. Intervention time is the amount of time between the first acoustic detection at the target and the arrival of the helicopter (on the ground) at the target.
In order to measure detection distance and intervention time, the helicopter executed different approaches and departure procedures for different landing points. Table 2 provides the GPS coordinates and the coordinates in the M coordinate system of these landing points. The landing points were chosen based on estimates of the detection distance and visual features on the ground to enable the pilots to execute multiple approaches toward the same location.

Table 2.
Overview of landing points used for detection distance and intervention time measurements.
A typical acoustic time signal of the helicopter approach and departure, in the negative direction, to and from landing point R1 is shown in Figure 7a for microphone M32. Note that the helicopter lands far from microphone M32, takes off again, makes a turn to fly away from the microphones, and does not fly over or by microphone M32. The acoustic pressure as a function of the emission time is shown in blue. The helicopter is at the landing point (on the ground) at time 0; this moment was reported by the crew by radio with an accuracy of s. When the helicopter is far from the microphone ( s), the acoustic signal is relatively constant in time. It contains mostly background noise. As the helicopter comes closer to the microphone, the amplitude of the acoustic signal rises and contains the signature of the first main rotor harmonic. During this time, the helicopter can be acoustically detected at the microphone position. As the flare is initiated, typical blade vortex interaction noise can be heard. This type of noise is richer in frequency content and more intense than noise from only the first main rotor harmonic, as can also be seen in the spectrogram in Figure 7b. Once the helicopter is in hover and on the ground, the acoustic signal is again constant and lower in amplitude (while the rotor is unloaded and may go into idle mode with reduced RPM). As the helicopter takes off again, the noise increases. In this case, a departure with a curve to the right is initiated, which brings the helicopter even closer to microphone M32 and the amplitude of the signal increases accordingly. As the helicopter makes its turn, it directs the loading noise of the Fenestron to the microphone; the Fenestron radiates tonal noise (mostly sideways) in a higher frequency band than the main rotor, to which the human ear is more sensitive. More details on the noise generated by the Fenestron are available from [21]. After completing the departure turn, the helicopter increases its distance from the microphone again and the acoustic signal quickly drops below background noise levels (the helicopter radiates significantly less noise to the back, compared to the front, in forward flight). The different phases of the approach are also shown by text labels in Figure 7a.
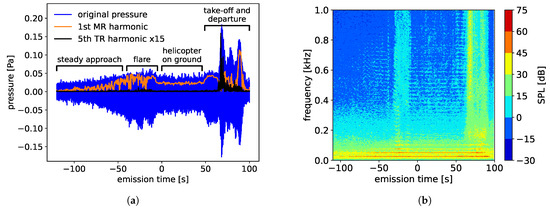
Figure 7.
Acoustic time signal for an approach to landing point R1 and microphone M32 (a) and corresponding spectrogram (b).
The raw acoustic pressure signals and derivatives like the sound pressure level or other traditional acoustic metrics are not suitable for estimating the time of detection of the helicopter, since the signal contains all kinds of background noise, like birds, bees, wind, etc. A filtering must be applied in order to eliminate these sounds, while retaining possible helicopter noise. A filtering based on the first main rotor blade passing frequency (BPF) is proposed. In the case of thickness noise (and the absence of BVI noise), the first main rotor BPF is a good estimate for the amplitude of the spectrum. Also, this harmonic has the lowest frequency and is expected to travel the furthest. The orange line in Figure 7a indicates the amplitude of the first main rotor BPF extracted based on filtering [27], which is assumed to be representative of the acoustic detectability. The black line shows the fifth Fenestron BPF harmonic (amplified 15 times), which is assumed to be representative of the Fenestron noise intensity. Although the Fenestron has unequal blade spacing, the tone at 10 times the shaft speed (fifth BPF due to rotor constructed from two identical halves) is still dominant for many flight conditions. This black line indicates that during the approach, no noise from the Fenestron is detected. This is also expected due to the shielding effect of the Fenestron casing. However, during departure, the first large peak in the noise is caused by the Fenestron.
Figure 8a,b give an example for an approach where BVI occurs. On the left, the acoustic pressure in the time domain is shown at the moment when the helicopter is still more than 2 km away from microphone M33. The signal is dominated by the first main rotor BPF. However, small oscillations (annotated in red) can be seen, which are caused by BVI. Even though these oscillations are very small, they can be heard in the recording. On the right is a spectrum of a (larger) time section around 92 s before landing. The lower horizontal axis shows the frequency in Hz, while the upper horizontal axis shows the main rotor harmonic BPF number. The higher harmonics caused by BVI can be clearly seen (marked by the red arrow). Even though they are two orders of magnitude smaller than the first main rotor harmonic, they can be heard because they occur in a frequency band to which the human ear is much more sensitive compared to the first few main rotor BPF harmonics. So when BVI occurs, the first BPF is no longer a good estimate of the spectrum. In order to detect BVI, a filtering in the range of 15–25 main rotor BPF harmonics is useful. When high-quality data is available, Doppler frequency shift and rotor RPM variations can be compensated to obtain a clean acoustic signal where the rotor harmonics are located at well-defined frequencies. However, due to time synchronization issues with the FDR data and the relative inaccurate position, disturbances will cause the frequencies to shift to unknown locations. For this reason, a more wide band filtering based on the wavelet transform in the frequency range 300–700 Hz is used here [28].
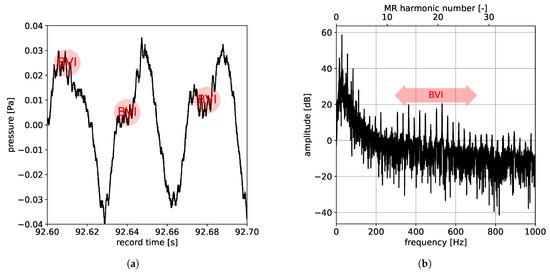
Figure 8.
Acoustic time signal (a) and spectrum (b) for record 110 and microphone M33. At 92 s, the helicopter is approximately 2 km from the microphone.
From the data presented in Figure 7a, it is expected that the intervention time is most likely determined by the steady part of the approach, while the acoustic detection distance is most likely determined by the flare and departure phases. This could indicate that in order to minimize the intervention time, it makes sense to investigate different approach speeds and to ensure that no braking/deceleration or steep descent occurs during the steady approach phase, since descent/braking might cause BVI noise. In order to minimize the detection distance, it makes sense to assess different flare and departure procedures.
For the intervention time, it is irrelevant how much noise is generated once the detection threshold has been exceeded. However, for the detection distance, care should be taken during the entire approach, landing, take-off, and departure procedures to limit the generated noise. This means that limiting the detection distance is more demanding than minimizing the intervention time.
Note that the microphone layout required for intervention time measurements is different from the one required for the detection distance. For the intervention time, it is necessary to have the landing point at the microphone location, while for detection distance, the microphones are far from the landing point.
3.2.1. Intervention Time
Intervention time measurements were conducted with microphones M30–M33 placed on a road along the axis, and the helicopter executed different approaches and departure procedures for landing point R1, very close to microphone M33. Departure procedures were executed for initial detection distance assessment with the other microphones. This microphone setup was necessary to be able to measure early in the morning while the grass was still wet, since acoustic equipment cannot be placed on very moist/wet surfaces. The approaches were conducted in the negative direction. Because of the flight being very close to the ground and far from the KTH stations, no optical tracking was possible by KTH; therefore, data is only available from the FDR, which is not good enough to enable de-Dopplerization of the acoustic time signal. The acoustic filtering was thus performed on the raw time signal with very wide filter bandwidths. No correction for variable rotor RPM was conducted.
Some measurements contain an external disturbance, most likely from a second helicopter that was operating in the area (estimated distance km). Based on the tone around 30 Hz, this could very well be a 5-blade Airbus helicopter that was seen in the area during the measurements. It was not possible to do extensive post processing in real time during the measurements, in order to ensure that no interference occurred during the measurements. Therefore, the detection of this disturbance was carried out during post processing after the flight tests. This example indicates that for this type of measurement, very strict limitations on allowable air traffic in a wide range (multiple kilometers) must be ensured, especially for aircraft generating similar noise. At a recording time of 140 s, the audible level displays a minimum around 300 Hz. This can be understood based on the shape of the spectrum. At low frequencies, the spectrum is dominated by lower harmonics, which drop off with increasing order. Harmonics due to unsteady loading typically manifest themselves at higher frequencies; see also Figure 8b.
A model for the detectability of helicopter noise in the presence of possible masking was proposed by Ollerhead [6]. The input of the model is a third octave band spectrum of the background noise (with possible masking) and a third octave band spectrum of the noise where the helicopter is possibly present. The output of the model is the audible level spectrum in decibels. The spectrum is converted to critical band levels, after which it is combined with the background noise critical band level to account for masking. A positive value in any frequency band of the audible level spectrum indicates detection. Note that the model indicates that a signal can be detected in the presence of the given background noise masking. The model does not discriminate between types of acoustic source; e.g., noise from an insect can also exceed the threshold and cause an audible level above zero. An audible level above zero should therefore be interpreted with some caution. A plot of the audible level as a function of the record time for microphone M33 is shown in Figure 9. The record time always starts at 0, such that in the figure, there is ≈50 s of acoustic measurement time included to the left. This record time is useful for correlating the time signal with the audio recording while listening. Landing occurs at a record time of 180 s. From the figure, it can be seen that detection occurs around 110 s for a frequency around 50 Hz. The detection threshold of human hearing is frequency-dependent, and the threshold increases with decreasing frequency below 1 kHz. Therefore, human detection at the lower frequencies is not determined by the first BPF, but by the second, third, or fourth BPF. A larger helicopter with a rotor that rotates slower may generate higher absolute levels but may have a shorter intervention time, based on human detection, due to the lower frequencies.
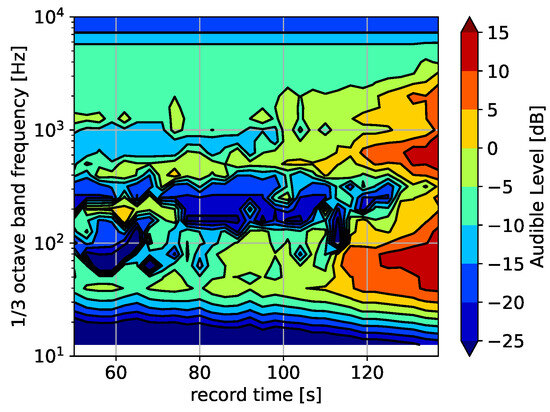
Figure 9.
Audible level for rec 102 and microphone M33.
The plot in Figure 10a shows the acoustic pressure at microphone M33 in dark gray as a function of the record time for an approach to landing point R1, at a speed of 80 kts. The orange line indicates the amplitude of the filtered first BPF. In Figure 9, a detection occurs at a record time of 110 s; at this time, the amplitude of the first BPF is about Pa (54.5 dB), as can be see in Figure 10a. However, from the orange line, it can be seen that a capable listener (possibly with a microphone) will be able to detect the helicopter around a record time of 80 s, well before a human, according to the Ollerhead model. Before 80 s, the orange line is relatively constant and close to 0; it only filters out background noise variations at the first BPF. Note that the detection criteria defined by Ollerhead were found to be very conservative compared to field tests [7]. For a 50% probability of detection, a sound pressure level 10 dB above Ollerhead’s threshold was found [7]. In the context of this paper, this suggests a 50% probability of detection occurring for a spectrum with an amplitude of the first BPF of 64.5 dB.
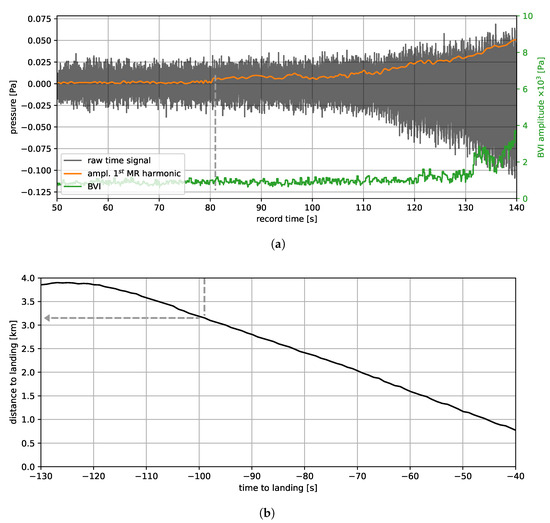
Figure 10.
Acoustic intervention time evaluation for rec 102, microphone M33. Approach at 80 kts to landing point R1 with the helicopter in configuration D. Acoustic pressure and extracted main rotor and BVI noise (a). Helicopter distance to landing point as a function of time (b). The gray dashed arrow can be used to correlate an acoustic pressure amplitude to a distance.
The amplitude envelope estimate of the BVI signal is plotted in Figure 10 (multiplied by ) by the green line. For Figure 10, it can be seen that the acoustic detection is caused by thickness noise from the main rotor. BVI starts to be relevant at a record time above 130 s.
The lower plot in Figure 10 shows the distance to the landing point in kilometers on the vertical axis and the time to landing in seconds on the horizontal axis. The time axis on the upper and lower plots is synchronized such that a vertical line can be drawn from the upper plot to the lower plot to determine the corresponding time to landing and the distance to the landing point (shown by the gray arrows in Figure 10). For this particular recording, the maximum intervention time is at a time to landing of about −99 s and at that moment, the helicopter is at a distance of 3.1 km from the landing point. The distance to landing as a function of time is mostly linear, since the approach speed is constant. The deviation at the left for time to landing s is caused by the curve that the helicopter made to line up for the approach.
For approaches at low height, the observer sees the helicopter rotor mainly in the rotor plane. This means that mostly thickness noise will be heard by the observer. The thickness noise radiates mostly in the rotor plane and in the forward direction of the advancing blade. Based on this fact, an approach was proposed that does not fly directly to the target but approaches it at an offset. At the last moment, the helicopter initiates a sharp banked curve to finally land at the target. These approaches were flown with an offset of about 300 m. The benefit of later detection hopefully outweighs the extra time needed for the final turn to the landing point.
Results for these approaches at an offset indicate that the distance at the moment of detection is indeed marginally smaller compared to the same procedure without offset, but the intervention times are longer. The benefit of the offset is less than the penalty of the extra time needed for the final curve.
3.2.2. Detection Distance
Most approaches and departures for detection distance measurement were flown along the axis. So, the approaches and departures were in line with the microphones M16–M29. Approaches were flown very close to the ground, meaning that optical tracking by the KTH was limited and KTH data is only available for the departure phase. Many combinations of approach and departure procedures were conducted.
In order to best compare the procedures, the acoustic signal is split into an approach part and a departure part. The approach part of the procedure is defined as the part of the procedure up to the time of landing; the departure is defined as the part of the procedure from the time of landing till the end of the acoustic recording. Microphones M16–M29 were used; these were arranged along a line in order to capture detection at different distances and to capture a possible acoustic shadow zone. However, during the measurements, no significant wind occurred.
The acoustic time signals were filtered to extract the amplitude of the first main rotor BPF. From this amplitude, the maximum value is determined during the approach and departure phase. This gives two maximum amplitudes per microphone, one for the approach phase and one for the departure phase.
Post processing of the detection distance measurements is more challenging than the intervention time measurements, since there are significant velocity and rotor speed variations during the approach, flare, and departure phases of the procedure. Therefore, we chose to de-Dopplerize the acoustic data and to remove the rotor speed variation, both based on FDR data (even though this is not ideal due to the issues with the FDR). Initial processing to extract Fenestron noise or BVI noise have been attempted; however, these did not yield convincing results and were omitted. Approach procedures were conducted at approach speeds of 60, 70, 80, and 90 kts. Figure 11a provides the averaged computed speed per approach.
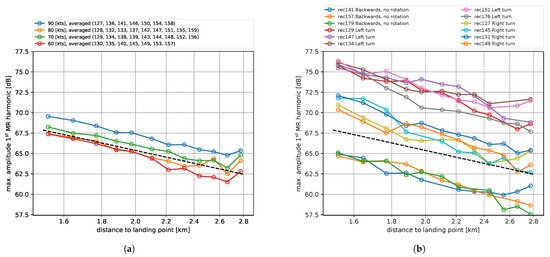
Figure 11.
Averaged detection distance for approaches at different speeds to landing point RE1 (a). Detection distance for departures from landing point RE1 (b). The black dashed line shows the theoretical amplitude decay due to the inverse distance law.
Every microphone location is shown by a circular marker; its location along the vertical axis indicates the maximum amplitude of the first main rotor BPF extracted by filtering during the entire approach. The black dashed line shows the theoretical amplitude decay due to the inverse distance law. Results are averaged over at least seven approaches at each approach speed. Given a detection threshold in dB, a horizontal line can be drawn from the vertical axis to the intersection with one of the curves. The intersection of this line with the curves gives the detection distances for the different approach speeds on the horizontal axis. As a threshold, a value of 64.5 dB, which was determined in the previous section, could be used. However, depending on the desired probability of detection, a different threshold should be used. As expected, the highest approach speed is the loudest and generates the largest detection distance. As the approach speed is decreased, the detection distance at the same detection threshold decreases. It is not fully understood why the approach at 80 kts is so quiet or the approach at 70 kts is so loud. It should be noted that the results at a distance of 2.8 km from the landing point are questionable. Here, the distance to the helicopter is the largest and the signal-to-noise ratio is the worst.
By using the emission times of the maximum amplitudes, the helicopter position and speed at the moment of maximum noise generation can be determined. These data correlate well between different microphones and show that for the approaches at 60 kts, the maxima occur while the helicopter is at the end of the flare, while for other speeds, the maxima are generated during the transition from flight at constant speed to a deceleration. These results are consistent for nearly all microphone locations, which is an indication that no significant atmospheric propagation effects occurred, which is consistent with the very low wind conditions. At an approach speed above 90 kts, it is likely that the maximum noise will be generated during the steady phase of the approach, because of the increase in thickness noise.
Figure 11b shows the maximum noise level for each microphone for the departure phase. Again, the inverse distance law is shown by the dashed line. The lower three curves show the results of a departure with rearward flight without rotation. The four middle curves show departures by a right turn, and the upper five curves show departures by a left turn. Other departures, such as tighter curves and 180-degree rotation in hover or sideward flight, were also tested. In theory, the most silent method of departure is expected to be rearward flight without rotation. This way, the Fenestron, which mainly radiates sideways, is not exposed and the distance to the target is kept to a maximum. Even though this departure is difficult from an operational point of view (degraded handling, bad visibility, problematic in formation landing) it is very useful to verify that the most silent departure procedure in theory correlates with the experiment. Also, it provides a lower bound with which to compare other departure procedures. From Figure 11b, it is clear that rearward flight without rotation is the most silent departure, as expected theoretically.
A left turn departure generates more noise at the microphones than a right turn departure. A plausible explanation for this is that a left turn exposes the advancing blade side and therefore directs more noise in the direction of the microphones. To illustrate this, Figure 12 shows relevant flight parameters, obtained from the FDR, and the acoustic pressure around the time of maximum noise at the microphones in the departure phase. In blue, it shows the parameters for a left curve departure. In orange, it shows the parameters for a right curve departure. The upper left plot gives the acoustic pressure measured at microphone M26, on the middle left is the airspeed in knots, and on the lower left is the roll angle in degrees. It can be seen that the roll angle is about for the left turn and about for the right turn. This implies that the left turn is taken more tightly than the right turn, which is also shown by the flight path, which shows a tighter left turn. A tighter turn (at the same speed) implies a higher load factor and could be a cause for extra noise generation. On the right is a plot of the flight path (for the time window that corresponds to the left plots) relative to the landing point located at . Considering the noise directivity of the helicopter in the speed range 60–80 kts it can be observed that high noise radiation is present to the right back (azimuth angle and ). It must, however, be kept in mind that the measured hemispheres are for steady flight, whereas the departure is a maneuver (accelerated and turning). It is also possible that the wake development in a left turn is different from that in a right turn, which could lead to more noise generation and/or different directivity. Further investigation is necessary to fully explain the exact cause of the difference between left and right curve departure.
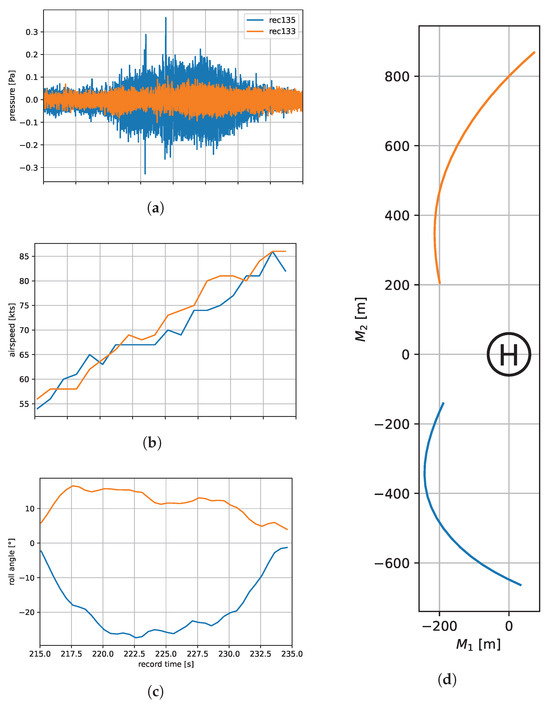
Figure 12.
Comparing noise and flight parameters for a left turn departure in blue and a right turn departure in orange. Acoustic pressure time history (a), airspeed (b), roll angle (c), and flight path as seen from above (d). The landing and take-off location is shown by the H.
One strategy to minimize the detection distance for the approach phase is to not approach the target straight on but offset, in such a way that the advancing blade side is exposed less. This type of approach was attempted during the intervention time measurements, discussed in Section 3.2.1. During the approach, BVI noise should be avoided by a moderate descent rate and no deceleration until the flare. If stick inputs are necessary, acceleration should be preferred over deceleration even if a higher speed implies more thickness noise. For departure, a turn opposite to the sense of main rotor rotation is recommended in order to minimize noise radiation in the direction of the target. This implies different landing points for helicopters with different senses of rotation for the main rotor.
A possible recommendation for operations (with multiple helicopters) could be to land the loudest helicopter the furthest away from the target and have that helicopter perform a rearward departure after all other helicopters of the formation have passed or landed. For a helicopter with a conventional tail rotor, this may not apply since acoustic shielding is only provided by the fuselage and not by any tail rotor casing.
4. Conclusions
Flights test with an H145-LUH-SOF helicopter were conducted to investigate the acoustic radiation. DLR operated several ground-based microphones, while WTD61 operated the helicopter in cooperation with HSG64. The helicopter position was tracked optically and by GPS via the onboard flight data recorder. The goals of the measurements were to gather acoustic radiation data for use in noise prediction tools, to measure intervention times and detection distances.
For source identification, microphones were distributed along a line perpendicular to the flight path. The helicopter was flown over the microphones while maintaining a constant airspeed, heading, and glideslope. By assuming that the noise source (helicopter) is constant in time, a scan of the noise emission is captured by the ground microphones. The measurements were post-processed and correlated with the optical position measurements and attitude angles from the flight data recorder. This results in a so-called noise hemisphere, a half-sphere which describes the directional acoustic radiation of the helicopter for one flight condition. The source identification measurements were conducted for different combinations of airspeed and glideslope. The tests were conducted for two different configurations of the helicopter. In addition to input for noise prediction tools, the data can serve to illustrate how the noise directivity changes with flight conditions and/or aircraft configurations. Most flights were conducted twice; however, more measurements will enable statistical analysis and increase the reliability of the results.
Detection distance measurements aimed to determine the distance beyond which the helicopter cannot be acoustically detected. For missions where the detection distance is relevant, care should be taken to minimize noise during the approach, flare, and departure phases. Therefore, missions involving landing well away from the target (to avoid acoustic detection) are more demanding in terms of noise management (helicopter handling) than missions where the helicopter flies directly to the target and only the time between acoustic detection and arrival at the target is relevant (intervention time). Depending on the defined threshold of detection, it can be concluded from the current measurements that the maximum detection distance is approximately 3 km (for the atmospheric conditions during the measurements).
The detection distance is dominated by the flare phase and the departure phase of the procedure. The most silent departure procedure is backwards flight without rotation. This was expected from a theoretical point of view and was also confirmed by experimentation. From the measurements, it can be seen that a departure with a left turn generates more noise at the target than a right turn. This is likely caused by the specific noise directivity of the helicopter.
Measurements of the intervention time were meant to evaluate the amount of time between the first acoustic detection at a target location and the subsequent landing of the helicopter at that target location. In this case, it does not matter how much noise the helicopter generates after it has exceeded a certain acoustic detection threshold at the target. Depending on the threshold and flight procedure, typical intervention times range between 50 and 120 s. From the measurements, it is observed that the intervention time is determined by the steady part of the approach procedure. So, the acoustic detection takes place before the helicopter initiates its deceleration, descent, and flare. In order to minimize the intervention time, it is useful to keep the approach speed to a minimum, to lower the blade tip Mach number, and to avoid the generation of blade vortex interaction noise, which can be caused during braking and/or descent. If cyclic control inputs are required by the pilot, acceleration should be preferred over deceleration. It is expected that atmospheric conditions will have a significant effect on the intervention time and additional measurements for different atmospheric conditions are recommended to assess this effect.
Funding
This research received no external funding.
Data Availability Statement
Data is available from DLR at reasonable request.
Acknowledgments
The author wishes to acknowledge colleagues from the DLR acoustic department (AS-TEA) and the DLR helicopter department (AS-HEL-BS) for their support during the acoustic measurements. Furthermore, the author wishes to thank the personnel from WTD61 and HSG64 for their support during the preparations and execution of the flight tests.
Conflicts of Interest
The author declares no conflicts of interest.
Abbreviations
The following abbreviations are used in this manuscript:
| BPF | Blade Passing Frequency |
| BVI | Blade Vortex Interaction |
| DLR | Deutsches Zentrum für Luft- und Raumfahrt e.V. |
| EWS | Electronic Warfare System |
| FDR | Flight Data Recorder |
| GPS | Global Positioning System |
| HSG64 | Hubschraubergeschwader 64 |
| KTH | Kinotheodoliten |
| KSK | Kommando Spezialkäfte |
| LUH | Light Utility Helicopter |
| RPM | Revolutions Per Minute |
| SOF | Special Operations Forces |
| WLAN | Wireless Local Area Network |
| WTD61 | Wehrtechnische Dienststelle 61 |
References
- Yin, J.; Buchholz, H. Toward Noise Abatement Flight Procedure Design: DLR Rotorcraft Noise Ground Footprints Model. J. Am. Helicopter Soc. 2007, 52, 90–98. [Google Scholar] [CrossRef]
- Spiegel, P.; Guntzer, F.; Le Duc, A.; Buchholz, H. Aeroacoustic Flight Test Data Analysis and Guidelines for Noise-Abatement-Procedure Design and Piloting. In Proceedings of the 34th European Rotorcraft Forum, Liverpool, UK, 16–18 September 2008. [Google Scholar]
- Guntzer, F.; Spiegel, P.; Lummer, M. Genetic Optimization of EC-135 Noise Abatement Flight Procedures Using an Aeroacoustic Database. In Proceedings of the 35th European Rotorcraft Forum, Hamburg, Germany, 22–25 September 2009. [Google Scholar]
- Hartjes, S. An Optimal Control Approach to Helicopter Noise and Emissions Abatement Terminal Procedures. Ph.D. Thesis, TU Delft, Delft, The Netherlands, 2015. [Google Scholar] [CrossRef]
- Loewy, R.G. Aural detection of helicopters in tactical situations. J. Am. Helicopter Soc. 1963, 8, 36–53. [Google Scholar] [CrossRef]
- Ollerhead, J.B. Helicopter Aural Detectability; Technical Report; Eustis Directorate U.S. Army Air Mobility Research and Development Laboratory: Fort Eustis, VA, USA, 1971. [Google Scholar]
- Hartman, L.; Sternfeld, H. An Experiment in Aural Detection of Helicopters; Technical Report AD 917355L; Eustis Directorate U.S. Army Air Mobility Research and Development Laboratory: Fort Eustis, VA, USA, 1973. [Google Scholar]
- Abrahamson, A.L. Correlation of Actual and Analytical Helicopter Aural Detection Criteria; Technical Report USAAMRDL-TR-74-102A; Eustis Directorate U.S. Army Air Mobility Research and Development Laboratory: Fort Eustis, VA, USA, 1975; Volume 1. [Google Scholar]
- Mueller, A.W.; Smith, C.D.; Shepherd, K.P.; Sullivan, B.M. A New Version of the Helicopter Aural Detection Program, ICHIN; Technical Report; NASA Langley Research Center: Hampton, VA, USA, 1986. [Google Scholar]
- Mueller, A.W.; Smith, C.D. Helicopter Main-Rotor Speed Effects-A Comparison of Predicted Ranges of Detection from the Aural Detection Program ICHIN and the Electronic Detection Program ARCAS; Technical Report NASA-TM-104134; NASA Langley Research Center: Hampton, VA, USA, 1991. [Google Scholar]
- Niesl, G.; Arnaud, G. Reduction of the noise signature of the Eurocopter EC 135. In Proceedings of the Flight Vehicle Integration Panel Symposium on “Advances in Rotorcraft Technology”, Ottawa, ON, Canada, 27–30 May 1996. [Google Scholar]
- Tuinstra, M.; Sijtsma, P. Measurement of Helicopter Noise Hemispheres Utilizing a 100m vertical Array. In Proceedings of the 38th European Rotorcraft Forum, Amsterdam, The Netherlands, 4–7 September 2012. [Google Scholar]
- Conner, D.A.; Stephenson, J.H.; Sims, B.W.; Watts, M.E.; Greenwood, E.; Smith, C.D. Joint Eglin Acoustics Week 2013 Data Report; NASA Technical Report NASA/TM–2017-2196813494; NASA: Washington, DC, USA, 2017.
- Conner, D.A.; Burley, C.L.; Smith, C.D. Flight Acoustic Testing and Data Acquisition for the Rotorcraft Noise Model (RNM). In Proceedings of the Americal Helicopter Society 62nd Annual Forum Proceedings, Phoenix, AZ, USA, 9–11 May 2006. [Google Scholar]
- Le Duc, A.; Spiegel, P.; Guntzer, F.; Lummer, M.; Buchholz, H.; Götz, J. Simulation of Complete Helicopter Noise in Maneouver Flight Using Aeroacoustic Flight Test Database. In Proceedings of the American Helicopter Society 64th Annual Forum Proceedings, Montreal, QC, Canada, 26 April 26–1 May 2008. [Google Scholar]
- Spiegel, P.; Buchholz, H.; Pott-Pollenske, M. Highly Instrumented BO105 and EC135-FHS Aeroacoustic Flight Tests including Maneuver Flights. In Proceedings of the American Helicopter Society 61th Annual Forum Proceedings, Grapevine, TX, USA, 1–3 June 2005. [Google Scholar]
- Gennaretti, M.; Serafini, J.; Bernardini, G.; Castorrini, A.; De Matteis, G.; Avanzini, G. Numerical characterization of helicopter noise hemispheres. Aerosp. Sci. Technol. 2016, 52, 18–28. [Google Scholar] [CrossRef]
- Sickenberger, R.; Schmitz, F.; Jaeger, S.M. Rotorcraft External Far-Field Noise Measurement Using a Hot Air Balloon. In Proceedings of the American Helicopter Society 74th Annual Forum Proceedings, Phoenix, AZ, USA, 14–17 May 2018. [Google Scholar] [CrossRef]
- Tuinstra, M.; van Oosten, N.; Olsen, H. The Development of a European Helicopter Noise Model. In Proceedings of the 44th European Rotorcraft Forum, Delft, The Netherlands, 18–21 September 2018. [Google Scholar]
- Olsman, W.F.J.; Gursky, B.I. Segment-wise Measurement of Helicopter Approach Noise with a Reduced Microphone Setup. In Proceedings of the American Helicopter Society 70th Annual Forum Proceedings, Montreal, QC, Canada, 20–22 May 2014. [Google Scholar]
- Olsman, W.F.J. Experimental investigation of Fenestron noise. J. Am. Helicopter Soc. 2022, 67, 16–27. [Google Scholar] [CrossRef]
- Olsman, W.F.J.; Lummer, M. Influence of Wind on the Noise Footprint of a Helicopter Landing. In Proceedings of the 38th European Rotorcraft Forum, Amsterdam, The Netherlands, 4–7 September 2012. [Google Scholar]
- Tuinstra, M. A Fast Atmospheric Sound Propagation Model for Aircraft Noise Prediction. Int. J. Aeroacoust. 2014, 13, 337–361. [Google Scholar] [CrossRef]
- International Civil Aviation Organization. International Standards and Recommended Practices, 3rd ed.; International Civil Aviation Organization: Montreal, QC, Canada, 1993; Volume 1, Annex 16. [Google Scholar]
- Greenwood, E.; Schmitz, F.H. Separation of Main and Tail Rotor Noise from Ground-Based Acoustic Measurements. J. Aircr. 2014, 51, 464–472. [Google Scholar] [CrossRef]
- Mobley, F. Interpolation of aircraft source noise directivity patterns modeled by spherical harmonics. Proc. Meet. Acoust. 2016, 25, 045003. [Google Scholar] [CrossRef]
- Olsman, W.F.J. Method for the Extraction of Helicopter Main and Tail Rotor Noise. J. Aircr. 2017, 55, 805–816. [Google Scholar] [CrossRef]
- Stephenson, J.; Greenwood, E. Effects of Vehicle Weight and True versus Indicated Airspeed on BVI Noise During Steady Descending Flight. In Proceedings of the American Helicopter Society 71th Annual Forum Proceedings, Virginia Beach, VA, USA, 5–7 May 2015. [Google Scholar]
Disclaimer/Publisher’s Note: The statements, opinions and data contained in all publications are solely those of the individual author(s) and contributor(s) and not of MDPI and/or the editor(s). MDPI and/or the editor(s) disclaim responsibility for any injury to people or property resulting from any ideas, methods, instructions or products referred to in the content. |
© 2025 by the author. Licensee MDPI, Basel, Switzerland. This article is an open access article distributed under the terms and conditions of the Creative Commons Attribution (CC BY) license (https://creativecommons.org/licenses/by/4.0/).