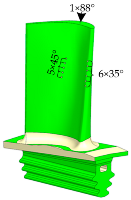
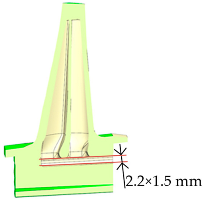
Abstract
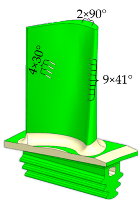
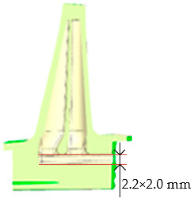
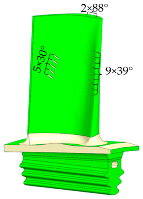
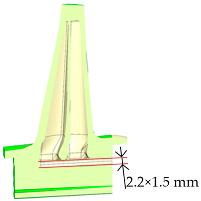
To address issues such as leading-edge and trailing-edge ablation and cracking of turbine blades during operation in an engine, this study integrates the characteristics of additive manufacturing technology and utilizes a comprehensive simulation and design platform for turbine-cooled blades to design three schemes of film cooling structures. Numerical simulations were employed to optimize the blade cooling configurations, resulting in a finalized cooling structure scheme, which was then subjected to experimental evaluation of its cooling performance. An experimental platform for turbine blade cooling effectiveness was established, capable of simulating actual engine operating parameters. Based on this platform, experimental studies were conducted to investigate the effects of key parameters—including pressure ratio(β), temperature ratio(K), and flow ratio(B) on the cooling effectiveness and the dimensionless temperature distribution on the blade surface. Experimental results show that within the studied operating conditions, the β has a greater impact on the cooling effectiveness of the blade compared to variations in B and K. When the β = 1.2, the cooling effectiveness of the blade surface is 0.130, and when β = 1.6, the effectiveness increases to 0.176, representing a 35.38% improvement. Within the tested range, variations in flow ratio resulted in a 19.12% increase in cooling effectiveness, while changes in temperature ratio led to a 26.62% improvement.
1. Introduction
With the continuous improvement of aero-engine performance, the temperature at the combustor exit has been steadily increasing [1], placing higher demands on the materials and cooling technologies of turbine blades due to the rising turbine inlet temperatures. The turbine inlet temperature of next-generation aero-engines is expected to reach 2400 K [2]. Such excessively high temperatures can lead to blade creep, cracking, and ablation, posing serious threats to engine operation. Therefore, in addition to improving the high-temperature resistance of materials, it is urgently necessary to implement effective enhanced cooling technologies for turbine blade cooling [3].
At present, turbine blade cooling technologies mainly include film cooling [4,5], impingement cooling [6,7], convective cooling [8,9], advanced cooling structures [10,11], and thermal barrier coating (TBC) technologies [12,13]. The optimization of these technologies requires consideration of multi-physics coupling mechanisms involving aerodynamics, heat transfer, and structural strength. Numerous experimental and numerical studies have been conducted by researchers worldwide to investigate the effects of cooling structure design and aerodynamic parameter variations on the overall cooling performance of turbine blades.
In terms of cooling structure design, Rao et al. [10] proposed the use of W-shaped ribs in multi-jet impingement cooling to enhance heat transfer performance. At a Reynolds number of 30,000, the W-shaped ribs increased the average impingement heat transfer area of the test plate by approximately 9.6%, with negligible additional pressure loss. Haydt et al. [14,15,16,17] systematically studied the geometric parameters of backward-expanded film cooling holes. Experimental results showed that increasing the lateral expansion angle, reducing the hole spacing, and enlarging the exit area significantly improved the spanwise-averaged film cooling effectiveness downstream, with a maximum improvement of up to 23%.
Regarding variations in aerodynamic parameters, Gao et al. [18] experimentally found that under moderate blowing ratio conditions (M = 0.9), the highest film cooling effectiveness was achieved near the hole region, while higher blowing ratios (M = 1.5) were required in the downstream region to maintain effective film coverage. Narzary et al. [19] investigated the effect of density ratio on film cooling of turbine blades through experiments. The results showed that as the density ratio increased, film cooling effectiveness improved over most regions of both the pressure and suction sides. Jeong et al. [20] experimentally studied the influence of density ratio and blowing ratio on film cooling effectiveness. The results indicated that under high blowing ratio conditions, the film cooling effectiveness near the leading edge increased with increasing density ratio.
As a critical component of aero-engines, the manufacturing quality of turbine blades directly influences their service life and operational stability [21]. These blades feature complex aerodynamic profiles, a high density of film cooling holes with small diameters, and non-linear hole distributions along the blade span, all of which significantly complicate the fabrication process. Traditional manufacturing methods, such as subtractive machining and electrochemical processing, face considerable limitations when dealing with such intricate geometries and fine structures [22,23,24].
Additive manufacturing (AM) [25,26,27,28], which builds components layer by layer, offers a promising solution by enabling near-net-shape fabrication of complex internal cooling structures. This technology achieves a dimensional accuracy in the order of 0.1 mm, reduces production lead times to less than two weeks, and improves material utilization by more than 40 percent. These advantages make AM particularly well suited for producing components with the geometric complexity and precision required in aerospace applications [29]. Given the intricate airfoil geometry, the small size of the film cooling holes, and the complex flow exit angles characteristic of turbine blades, this study selects additive manufacturing as the preferred fabrication approach for the experimental blade specimens.
In summary, most existing studies are based on similar principles [30] and are conducted under simplified experimental conditions, while experimental data on the cooling performance of turbine blades under real engine operating conditions remain insufficient. Therefore, in this study, three film cooling schemes were proposed based on the original turbine working blade, utilizing a turbine blade simulation and design platform [31]. By optimizing the number, angle, and arrangement of film cooling holes, an improved turbine blade model was developed.
To ensure the dimensional accuracy of the complex internal cooling channels and film holes, the experimental blades were fabricated using selective laser melting (SLM) technology. Subsequently, a gas turbine blade cooling effectiveness test platform was established. This platform, which integrates a model combustor and a multi-stage air supply system, was capable of simulating the inlet temperature gradients and coolant-to-mainstream flow ratios characteristic of real aero-engine conditions. Using this platform, experimental studies were conducted to investigate the effects of flow ratio, temperature ratio, and pressure ratio on the thermal performance of turbine working blades. The findings provide both theoretical and engineering support for the thermal protection design of turbine blades.
2. Experimental System and Conditions
2.1. Experimental System
Figure 1 illustrates the schematic diagram of the experimental system for measuring the cooling effectiveness of turbine blades. The entire system consisted of a high-enthalpy air supply system, a kerosene supply system, a single-cup combustion chamber model, a secondary air supply system, a circulating cooling water system, a cascade test section, and a data acquisition system. The high-enthalpy air supply system was capable of continuously delivering air at a maximum flow rate of 3.0 kg/s and a maximum pressure of 5.5 MPa. The air source tank located upstream of the heater had a volume of 50 m3, which ensured a stable and continuous air supply throughout the blade cooling effectiveness experiments.
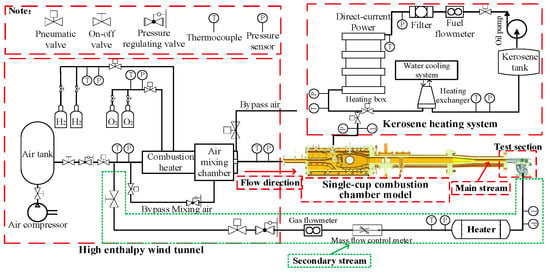
Figure 1.
Schematic diagram of the experimental system.
The experimental procedure was as follows: Based on the required mainstream gas temperature, pressure, and flow rate under the turbine blade test conditions, the operating parameters for the high-enthalpy air heater and the combustor were calculated. The high-temperature gas by combustion flowed through a 1170.5 mm-long sector-shaped wind tunnel, where it fully developed before entering the cascade test section for the cooling effectiveness experiment. The secondary air supply system adopted a high-pressure air tapping scheme. After pressure stabilization and flow control through a valve assembly and flow controller, the air was heated to the required temperature by an electric air heater and then introduced into the interior of the turbine blade test article.
2.2. Test Blade
Figure 2 shows the model of the turbine blade test section. The test section consisted of one experimental blade and two end-support (companion) blades, together forming two periodic sector-shaped cascades. The experimental blade was fabricated using additive manufacturing technology, with the nickel-based superalloy IN-738 selected as the blade material. This alloy had a maximum temperature resistance of up to 1173 K. The blade had a chord length of 19.94 mm, an overall height of 26.95 mm, and a minimum wall thickness of approximately 0.5 mm along the airfoil. The tenon measured approximately 20 mm in length, and the total blade volume was 2089.6 mm3.Thermocouples and pressure probes were installed 110 mm upstream of the cascade channel to measure the mainstream gas inlet temperature, total pressure, and static pressure.
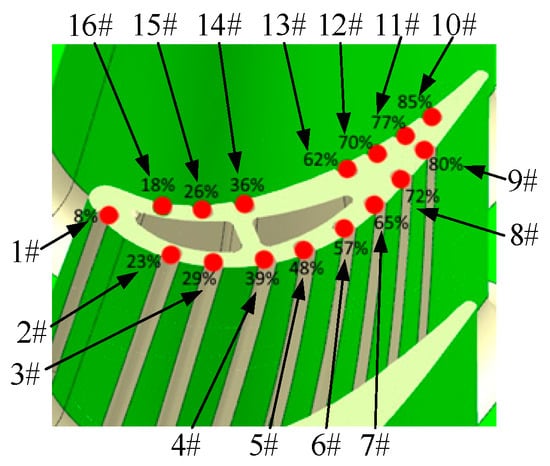
Figure 2.
Schematic diagram of turbine blade measurement points.
Figure 2 also shows the schematic diagram of the thermocouple layout on the turbine blade surface. The measurement points were located at the 50% blade height cross-section, and their positions along the arc length of this section were indicated in the figure. A total of 16 K-type sheathed thermocouples with a diameter of 0.5 mm were embedded in blade-7 on the pressure side and 9 on the suction side. To prevent any adverse effects on film cooling performance from directly welding thermocouples onto the blade surface, thermocouple mounting grooves were printed during the blade fabrication process. The thermocouples were then fixed into the grooves using laser welding. A coating made of the same material as the blade was sprayed onto the surface to fill the gap between the thermocouples and the grooves. The thinnest part of the coating above the embedded thermocouples was approximately 0.05 mm. The surface was carefully polished to ensure that the aerodynamic profile of the blade remained unchanged. The appearance of the blade after thermocouple embedding and coating is shown in Figure 3.
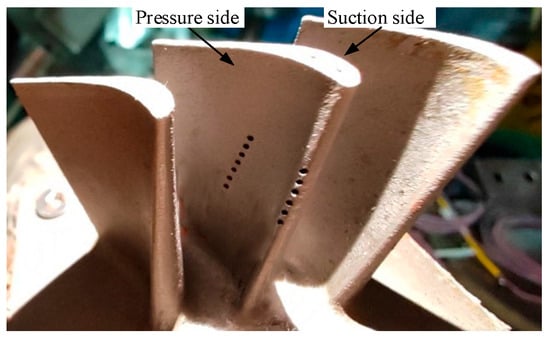
Figure 3.
Photos of test blade with thermocouples.
2.3. Experimental Parameters and Definitions
The flow ratio is defined as
where mc is the secondary flow mass flow rate, and mg is the mainstream gas mass flow rate.
B = mc/mg
The temperature ratio is defined as
where Tc is the secondary flow temperature, and Tg is the mainstream gas temperature.
K = Tg/Tc
The gas pressure ratio is defined as
where
is the cascade gas inlet total pressure, and pout is the cascade gas outlet static pressure.
The dimensionless temperature on the blade surface is defined as
where Tw is the turbine blade surface temperature.
ε = Tw/Tg
The cooling effectiveness of the blade is defined as
The arc-length averaged cooling effectiveness of the turbine blade is defined as
where S is the total arc-length of the blade outer surface at the 50% span section, and ΔSi is the arc-length corresponding to measurement point i.
2.4. Experimental Uncertainty Analysis
The measurement parameters of the turbine blade, along with the ranges and accuracies of the instruments used in the experiment, are listed in Table 1. The experimental results primarily focused on investigating the cooling effectiveness (η) of the blade surface and the dimensionless temperature (ε) on the blade surface.

Table 1.
Measurement parameters and instruments for the blade experiment.
The η on the blade surface is defined as
where, Tg, Tw, and Tc represent the mainstream gas temperature at the cascade inlet, the blade surface temperature, and the secondary air temperature, respectively. According to the standard error analysis method proposed by Moffat et al. [32], the uncertainties of the cooling effectiveness and the dimensionless surface temperature in this experiment had been 4.2% and 3.17%, respectively, indicating that the experimental measurements of the turbine blade’s cooling performance in this study were reliable.
3. Numerical Simulation
In this study, a fluid-structure coupled numerical simulation method was adopted. The realizable k-ε turbulence model [33,34] was used, and the pressure-based segregated solver was employed. The discretization scheme for the governing equations utilized the third-order QUICK scheme. The pressure-velocity coupling was handled using the SIMPLEC algorithm, and the pressure interpolation was performed using the standard scheme. Pressure, momentum, turbulent kinetic energy, and energy equations were all discretized with second-order accuracy. The average temperature variation on the blade surface during the final 1000 iterations was less than 0.08%.
3.1. Computational Model and Boundary Conditions
Figure 4 shows the original turbine blade model of a certain type of engine, in which no film cooling structures were designed. The computational model and boundary conditions are illustrated in Figure 5. To prevent backflow at the inlet and outlet of the fluid domain during the simulation, which could affect the stability of the calculation, the gas inlet and outlet regions were appropriately extended.
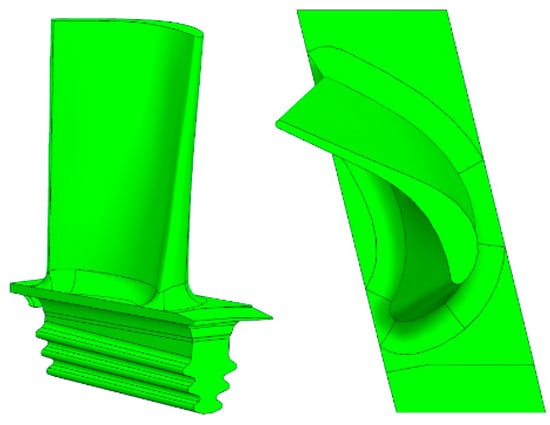
Figure 4.
Original turbine blade model.
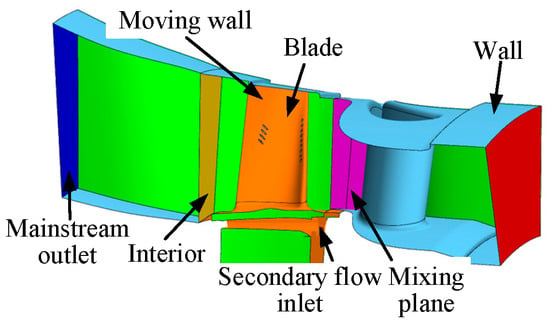
Figure 5.
Computational domain and boundary conditions of turbine blade calculation.
3.2. Mesh
The gas passage, blade cascade passage, and secondary air passage were defined as the fluid domain, while the blade airfoil and blade tenon were defined as the solid domain. The mesh division is shown in Figure 6. To better capture the flow and heat transfer details near the wall surfaces, boundary layer meshes were applied in regions of the fluid domain adjacent to the solid walls, with a total of five layers and the first layer corresponding to y+ < 1. In regions with steep parameter gradients, such as around the film cooling holes and the leading edge, mesh refinement was applied. The total number of mesh elements in the solid domain of the blade was 800,000, while the fluid domain contained 4.2 million elements.
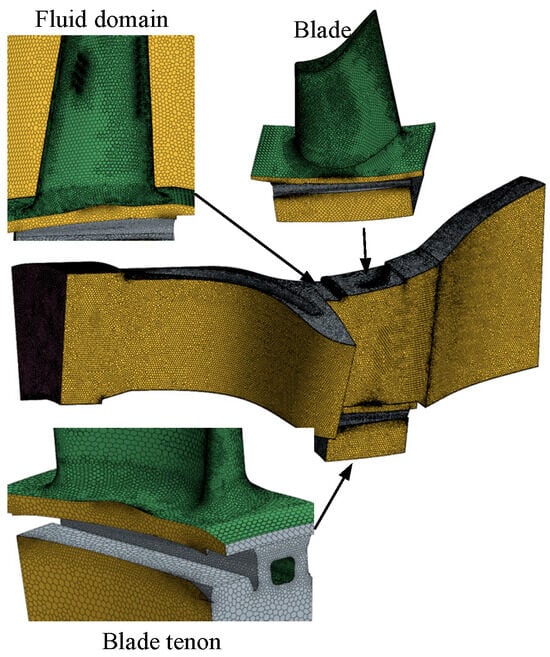
Figure 6.
Computational domain and grid.
3.3. Grid Independence
Numerical simulations were carried out using the original turbine blade structure as an example, and a grid independence verification process was conducted. The results of the grid independence study are presented in Table 2.

Table 2.
Grid independence validation.
Five sets of meshes with different densities, ranging from 1 million to 9 million elements, were used to evaluate the sensitivity of the simulation results to grid resolution. During the simulations, the average temperatures of the blade body and tenon, as well as the cooling efficiency and total pressure at the thermocouple #1, were selected as the comparison parameters. When the mesh count exceeds 5 million, the variations in the average temperature of the blade body and tenon, cooling efficiency, and total gas pressure are less than 0.5%. Therefore, a mesh containing 5 million elements was ultimately selected for subsequent simulations, and this mesh resolution was used for the grid generation of blades with different cooling structure designs.
3.4. Numerical Calculation Conditions
At the engine design point, the flow ratio was 1.0% (with pc = 0.8 Mpa), the temperature ratio was 1.46, and the pressure ratio of the was 1.41. Table 3 presents the operating conditions used in the numerical simulations. In the table,
represents the total pressure at the inlet of the mainstream gas, Tg is the inlet temperature of the mainstream gas, mg is the mainstream gas mass flow rate, pc is the total pressure at the secondary air inlet, and Tc is the secondary air inlet temperature.

Table 3.
Calculation conditions.
During the numerical simulation, the inlet temperature Tg was set to 1286.4 K. A user-defined function (UDF) was used to define the gas inlet boundary conditions, and the outlet temperature distribution factor at the gas inlet was set to 0.2.
3.5. Validation of the Simulation Results
Figure 7 shows the comparison between the experimental and simulated dimensionless temperature distribution curves on the blade surface. Both the experimental and numerical conditions correspond to the engine design point. The temperature data were obtained at 16 measurement points located along the 50% blade height cross-section, with each value representing the average temperature within a φ = 0.6 mm area around the measurement point. In the figure, the X-axis represents ΔSi/S, with the origin corresponding to the blade leading-edge stagnation point. The negative X-axis direction corresponds to the suction side, and the positive X-axis direction corresponds to the pressure side.
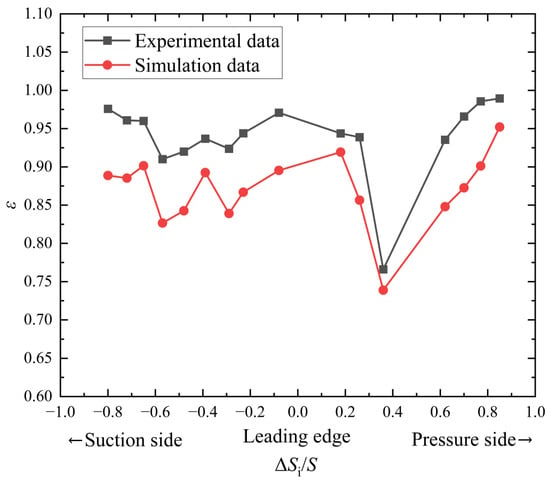
Figure 7.
Comparison of simulation and experimental data.
The experimental data and simulation results showed good overall agreement In terms of trend. The maximum deviation between the simulation and experimental results was 9.65%, while the minimum deviation was 2.59%.
The discrepancies between the experimental and simulation results were mainly attributed to the following factors:
- (1)
- Local deviations between the actual thermocouple installation locations and the mesh nodes in the simulation caused a mismatch between the measured and computed temperatures;
- (2)
- In the numerical simulation, the prescribed state of the mainstream gas in the turbine blade passage may have differed from the actual gas conditions in the experiment;
- (3)
- The thermocouple installation and coating process on the blade surface may have introduced measurement errors, leading to discrepancies between the actual and simulated temperature values.
4. Numerical Results and Discussion
4.1. Temperature Field of the Original Turbine Blade
Figure 8 shows the surface temperature distribution contour of the original turbine blade under the engine design point conditions. From the figure, four main high-temperature regions and two secondary high-temperature regions near the blade tip can be observed on the blade surface. The main high-temperature areas are primarily concentrated along the leading edge and trailing edge within the 40% to 80% blade height range. The highest temperature in the leading-edge hot region reaches 1154 K, while the trailing-edge hot region peaks at 1145 K. The secondary high-temperature areas near the blade tip reach a maximum of 1096 K, and the average temperature of the blade and tenon is 1025.3 K.
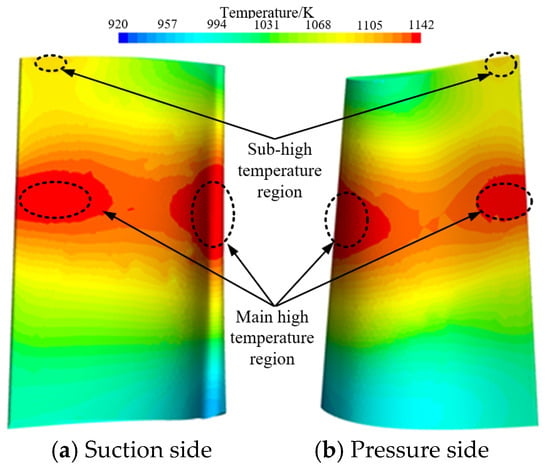
Figure 8.
Surface temperature distribution of turbine blade.
The reason for this distribution is that the original turbine blade was designed without film cooling structures and is a solid blade. The formation of high-temperature regions on the blade surface essentially results from the coupled effects of fluid flow and heat transfer. The high-temperature gas enters the working blade passage from the turbine guide vanes, and the flow state and heat transfer characteristics between the turbine guide vanes and working blades determine that the high-temperature zones are concentrated in the mid-span region of the blade. The temperature distribution characteristics of the blade’s high-temperature areas correspond closely with those of the combustor outlet.
The original turbine blade material Is the nickel-based superalloy IN-738, which has a maximum temperature resistance of approximately 1173 K. Since the highest temperatures in the leading and trailing edge hot regions approach the material’s temperature limit, it is necessary to design cooling structures for the turbine blade to ensure its normal operation.
4.2. Design of the Blade Film Cooling Structure
Based on the temperature field analysis of the original turbine blade in the previous section, film cooling holes should be arranged near the blade leading edge and trailing edge to reduce the temperature in the high-temperature regions. Additionally, since the main high-temperature areas are concentrated within the 40% to 80% blade height range along the leading and trailing edges, the cooling structure design incorporates a denser distribution of film cooling holes in this region.
The original turbine blade has a solid structure without any film cooling holes. According to the distribution characteristics of the high-temperature regions described above, the turbine blade cooling structure was optimized using a comprehensive simulation and design platform for turbine cooled blades. Three targeted film cooling structure designs were proposed. Table 4 and Table 5 present the specific parameters of these three cooling structure schemes, while Table 6 shows the turbine blade models and internal cooling channel layouts for Schemes 1 to 3.

Table 4.
Number of film cooling holes and parameters of internal cooling channels.

Table 5.
Film cooling hole angle.

Table 6.
Model of cooling structure.
Compared to Scheme 1, Scheme 2 increased the number of trailing edge film cooling holes and modified the discharge angles of the film holes at the leading edge and blade tip, as well as the dimensions of the internal cooling channels. Compared to Scheme 2, Scheme 3 reduced the number of film cooling holes at the leading edge and blade tip and adjusted the discharge angles of the film holes at the leading and trailing edges.
Figure 9 shows the definition of the film cooling hole orientation. The exit point O of the film cooling hole is defined as the intersection of the hole’s central axis and the blade surface. A local reference coordinate system is established with point O as the origin: the surface normal direction is defined as the Z-axis, the tangential direction along the blade height as the Y-axis, and the tangential direction along the flow direction as the X-axis.
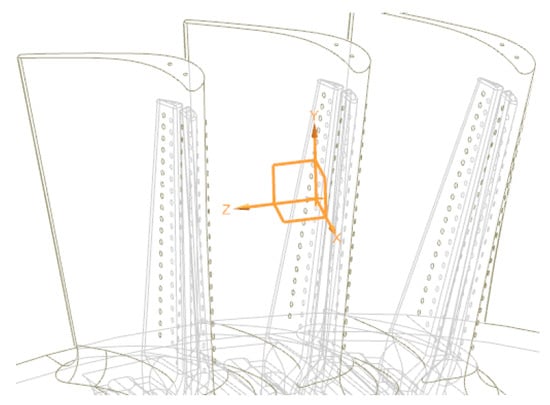
Figure 9.
Schematic diagram of film cooling hole angle.
Reference plane A is defined as the XZ plane, and reference plane B as the YZ plane. The film cooling hole angle is defined as the angle between the central axis of the cooling hole and the XY plane.
4.3. Surface Temperature Distribution of the Blade
Figure 10 presents the surface temperature distribution contours of the turbine blade under design-point conditions for Schemes 1 to 3, while Table 7 compares the blade temperature and aerodynamic performance parameters for the three schemes. Compared with the original turbine blade temperature distribution shown in Figure 8, the incorporation of cooling structures in Schemes 1 to 3 effectively reduced the surface temperature and decreased the area of high-temperature regions on the blade.
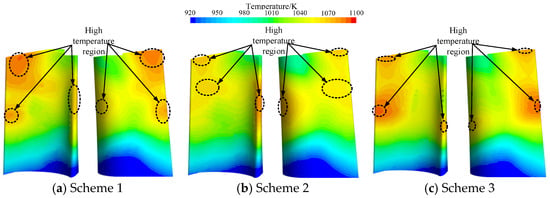
Figure 10.
Temperature distribution of turbine blade surface.

Table 7.
Parameter comparison of Schemes 1~3.
In Scheme 1, film cooling holes were arranged along the blade leading edge, trailing edge, and tip. The combined effects of convective heat transfer from the coolant jets and the film isolation effect effectively reduced the blade surface temperature. Compared to the original turbine blade, the maximum temperature at the leading edge decreased by 5.74%. However, due to the relatively large outlet angle (41°) of the leading-edge film cooling holes, the film coverage was weakened, resulting in insufficient coolant coverage over the trailing-edge tip region. Consequently, the maximum temperature in the blade tip high-temperature region was 1083 K, only 1.19% lower than that of the original blade.
The presence of film cooling holes at the trailing edge in Scheme 1 helped reduce the area of high-temperature regions at the trailing edge, with the maximum temperature dropping by 7.83%. Meanwhile, the implementation of the cooling structure significantly lowered the average temperature of the blade body and root, which decreased by 13.14% compared to the original turbine blade.
The total cooling airflow through the film cooling holes of a single blade in Scheme 1 was 4.57 g/s. Compared to the original solid blade without cooling structures, the increased secondary cooling airflow led to greater aerodynamic losses. Therefore, it is necessary to comprehensively evaluate the trade-off between the secondary airflow consumption and the blade cooling effectiveness to propose an optimal cooling structure design.
To address the issues of large total cooling airflow and the large outlet angle of the leading-edge film holes in Scheme 1, Scheme 2 reduces the leading-edge film hole angle to 39° and increases the number of trailing-edge film holes, aiming to optimize the temperature characteristics of the trailing edge and the trailing-edge tip high-temperature region. Additionally, the internal cooling channel dimensions were reduced, lowering the total cooling airflow to 3.47 g/s.
In Scheme 2, the maximum temperature at the leading edge is 1082.4 K, which is similar to that of Scheme 1. However, the high-temperature region at the trailing edge shifts closer to the trailing-edge tip, located around 75~80% of the blade height. The maximum temperature in the trailing-edge high-temperature region decreases by 6.57% compared to Scheme 1. Furthermore, the high-temperature area at the trailing-edge tip is reduced, with its maximum temperature lowered by 4.79% relative to Scheme 1. Due to the reduced cooling airflow, the average temperature of the blade body and root increased by 0.34% compared to Scheme 1.
By modifying the blade’s cooling structure, Scheme 2 significantly improves the blade’s temperature distribution. The maximum temperatures remain within the material’s allowable range. However, the total cooling airflow per blade is still 3.47 g/s, which, although reduced, still causes a degree of aerodynamic loss compared to the original turbine blade.
To further reduce the total secondary cooling airflow, Scheme 3 decreases the number of film cooling holes and modifies the outlet angles of both the leading- and trailing-edge holes to enhance coolant coverage efficiency. Compared to Scheme 2, Scheme 3’s maximum leading-edge temperature is 1018.0 K, a 5.95% reduction. The high-temperature region distribution at the trailing edge is similar to that of Scheme 1, but its maximum temperature is 11.39% higher than in Scheme 2, and the high-temperature area is also enlarged. Due to the further reduction in the number of film cooling holes, the trailing-edge tip high-temperature area expands, and its maximum temperature increases by 1.68% compared to Scheme 2-though it still remains lower than in Scheme 1.
Meanwhile, the further reduction in cooling airflow in Scheme 3 leads to a 0.99% increase in the average temperature of the blade body and root compared to Scheme 2.
4.4. Film Hole Flowline Distribution Characteristics
Figure 11 shows the flowline distribution diagrams of blade film hole outflow under design-point conditions for engine Schemes 1~3. As shown in the figure, the cooling air jets in Scheme 1 exhibit poor wall-attachment performance, resulting in jet detachment and horseshoe vortex formation. The cooling airflow is biased toward the blade tip, leading to insufficient coverage in the trailing edge region and a relatively large high-temperature area near the trailing edge tip. Additionally, some streamlines bypass the blade tip, further weakening the cooling effectiveness.
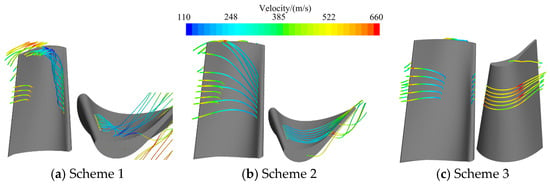
Figure 11.
Streamlines emanating from film cooling holes.
To address the poor wall-attachment performance of the film hole outflow in Scheme 1, Scheme 2 reduces the front-edge outflow angle to 39°, while adjusting the internal cooling channel dimensions and increasing the number of film holes. The total cooling air mass flow rate is reduced to 3.47 g/s, enhancing the wall-adherence effect and further improving blade cooling performance. However, the outflow streamlines from the front-edge film holes still show partial flow bypassing the blade tip, resulting in localized small-scale vortex remnants, which are not favorable for efficient utilization of the cooling air.
Compared to Scheme 2, Scheme 3 further optimizes the front-edge film hole outflow angle. The outflow streamlines from the front-edge film holes directly target the suction side and exhibit a parallel laminar pattern. The film coverage is improved, and the streamline attachment performance is significantly better than in the previous two schemes.
4.5. Final Experimental Blade Scheme
Based on the analyses in Section 4.3 and Section 4.4, Scheme 3 significantly improves the cooling air coverage efficiency by adjusting the arrangement and angles of the film cooling holes. Under a relatively low total cooling air mass flow rate, it effectively enhances the surface temperature characteristics of the turbine blade. Compared to the original turbine blade, Scheme 3 reduces the blade surface maximum temperature to 1180 K, a decrease of 12.90%, and the average temperature of the blade body and tenon to 902.0 K, a decrease of 12.03%. Overall, all temperatures remain below the thermal limit of the IN-738 alloy (1173 K). The total cooling air mass flow rate in Scheme 3 is 2.0 g/s, representing reductions of 56.24% and 43.98% compared to Scheme 1 and Scheme 2, respectively, resulting in minimal aerodynamic loss of the blade. With the lowest cooling cost, Scheme 3 achieves efficient thermal protection and is therefore selected as the final optimized scheme for further experimental investigation on blade overall cooling efficiency.
5. Experimental Results and Analysis
According to the actual operating conditions of the original turbine blade, the design point flow ratio is 1.0%, the temperature ratio is 1.46, and the pressure ratio is 1.41. The specific experimental conditions for the optimized turbine blade are shown in Table 8. The gas inlet temperature distribution follows the same pattern as the simulation results, with a temperature distribution factor of 0.2. During the experiment, the variation of the flow ratio and temperature ratio was achieved by adjusting the secondary air flow rate and temperature, while the change in the pressure ratio was realized by regulating the mainstream gas pressure.

Table 8.
Turbine blade experimental conditions.
5.1. Effect of B on Cooling Performance
Figure 12 presents the dimensionless temperature distribution and cooling efficiency of the turbine rotor blade at different flow ratios under conditions of a temperature ratio of 1.2 and a pressure ratio of 1.41. In the figure, the X-axis represents ΔSi/S, with the origin corresponding to the blade leading-edge stag-nation point. The negative X-axis direction corresponds to the suction side, and the positive X-axis direction corresponds to the pressure side.
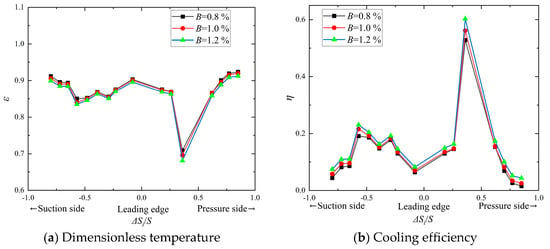
Figure 12.
Effect of B on turbine blade cooling performance.
From Figure 12, as the B increases, the dimensionless temperature of the blade gradually decreases, while the cooling efficiency improves. The underlying reason is that with a higher mass flow ratio, a larger amount of cooling air covers the blade surface, expanding the coverage area. Additionally, the increased cooling air absorbs more heat from the mainstream, resulting in a lower temperature rise, a reduced mixing temperature with the mainstream (heat transfer temperature). The cooling efficiency on the pressure side of the blade is higher than that on the suction side. When the B is 0.8%, the average dimensionless temperature on the pressure side is 0.879 with an average cooling efficiency of 0.171, while the average dimensionless temperature on the suction side is 0.866 with an average cooling efficiency of 0.146. When the B increases to 1.2%, the dimensionless temperature decreases by 1.70%, and the average cooling efficiency increases by 14.60%.
Figure 13 shows the blade cooling efficiency averaged along the arc length as a function of the flow ratio. As the B increases, the cooling efficiency gradually improves. When the B increases from 0.8% to 1.2%, the blade surface cooling efficiency rises from 0.136 to 0.162, an increase of 19.12%.
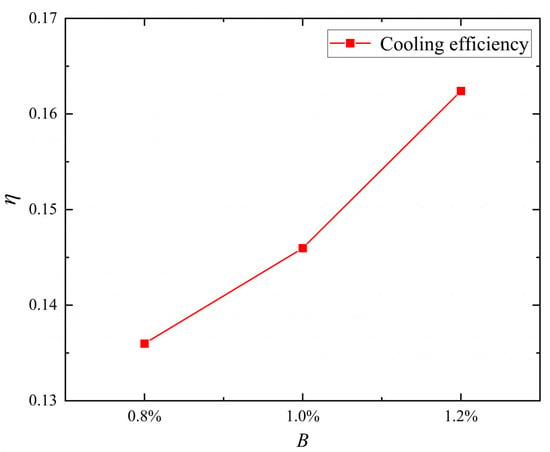
Figure 13.
Variation curve of blade cooling efficiency with B.
The underlying reason can be explained based on the definition of the blowing ratio (M = ρcuc/ρgug, where ρc and uc are the density and velocity of the cooling air, and ρg and ug are the density and velocity of the mainstream gas). With an increase in the B, the blowing ratio increases. Under conditions where the densities of the mainstream gas and cooling air are comparable, an increased B leads to a higher momentum ratio of the cooling air. This enhances the secondary flow’s resistance to the mainstream impact. A higher blowing ratio strengthens the ability of the cooling air to resist the mainstream flow, making it easier for the cooling air to form a continuous coverage layer on the blade surface.
Although increasing the secondary air flow ratio can effectively enhance the blade cooling efficiency, it can also cause part of the air to lose its cooling effectiveness and result in greater aerodynamic losses. Therefore, reasonably adjusting the secondary air flow is crucial for improving the cooling efficiency of the blade.
5.2. Effect of K on Cooling Performance
Figure 14 shows the dimensionless temperature distribution and cooling efficiency variations of the turbine blade under a flow ratio of 1.0% and a pressure ratio of 1.41 at different temperature ratios. As the temperature ratio increases, the dimensionless temperature of the blade gradually decreases (Figure 14a), and the cooling efficiency correspondingly increases (Figure 14b).
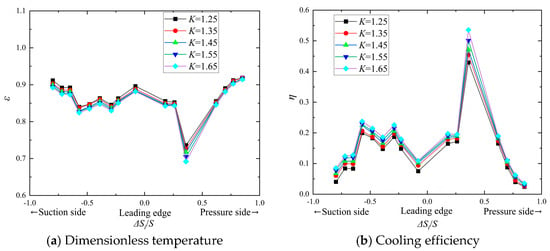
Figure 14.
Effect of K on turbine blade cooling performance.
The underlying reason is that increasing the K is achieved by lowering the temperature of the cooling air. As the cooling air temperature decreases, the mixing temperature near the wall between the cooling air and mainstream also decreases, which reduces the heat transfer from the mainstream to the blade, thereby improving cooling effectiveness. Within the experimental conditions, the cooling effectiveness on the blade pressure side is higher than that on the suction side. When the K equals 1.65, the average dimensionless temperature on the pressure side is 0.846, with an average cooling efficiency of 0.189; on the suction side, the average dimensionless temperature is 0.856, with an average cooling efficiency of 0.165. Compared to the condition at K = 1.25, the dimensionless temperature decreased by 1.19%, and the average cooling efficiency increased by 14.55%.
Figure 15 shows the variation of blade cooling efficiency under different temperature ratios. As the K increases, the blade cooling efficiency gradually rises. When K = 1.25, the blade cooling efficiency is 0.139; when K = 1.65, it increases to 0.176, representing an improvement of 26.62%.
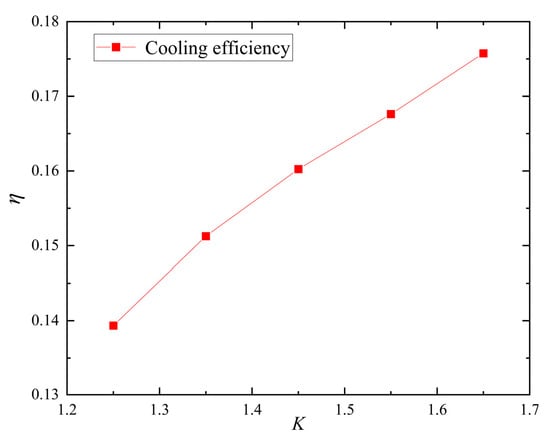
Figure 15.
Variation curve of blade cooling efficiency with K.
The underlying mechanism can be explained based on the density ratio (DR = ρc/ρg). As the K increases, the absolute temperature of the cooling air decreases, leading to an increase in its density and consequently a higher density ratio relative to the mainstream. A higher density ratio implies that, under the same blowing ratio, the cooling air has greater momentum and enhanced shear resistance, allowing it to adhere more stably to the blade surface under mainstream impingement, thereby suppressing mixing and ingestion of hot mainstream gas. This not only extends the coverage of the cooling film on the blade surface but also improves the integrity and stability of the film layer.
Additionally, the reduced cooling air temperature lowers the effective heat transfer temperature resulting from near-wall mixing with the mainstream, which weakens the thermal driving force from the mainstream to the wall. In other words, the cooling air benefits from both density and low-temperature advantages, which enhances the kinetic retention of the film layer while reducing the thermodynamic heat transfer driving force, significantly improving the blade cooling effectiveness.
5.3. Effect of β on Cooling Performance
Figure 16 shows the dimensionless surface temperature distribution and cooling efficiency variations of the turbine blade under B = 1.0% and K = 1.46 at different pressure ratios. During the experiment, variations in the pressure ratio were achieved by adjusting the mainstream gas pressure, while maintaining consistent flow and temperature ratios between the mainstream gas and the secondary cooling air. As the pressure ratio increases, the nondimensional temperature on the blade surface gradually decreases (Figure 16a), and the blade cooling effectiveness correspondingly increases (Figure 16b).
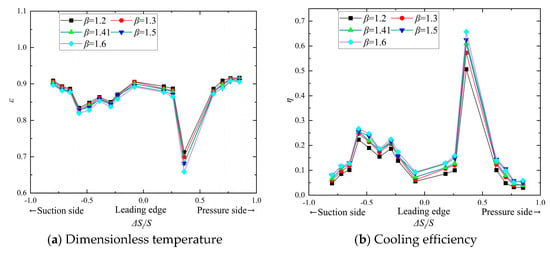
Figure 16.
Effect of β on turbine blade cooling performance.
The effects of β on blade cooling performance are similar to those of flow ratio and temperature ratio. The cooling efficiency on the pressure side of the blade is higher than that on the suction side. When the β increases from 1.2 to 1.6, the dimensional temperature on the pressure side decreases by 2.33%, with the average cooling effectiveness improving by 43.41%. On the suction side, the nondimensional temperature decreases by 1.48%, and the average cooling effectiveness increases by 28.24%.
Figure 17 shows the variation of the cooling efficiency on the blade surface with respect to the β. As the β increases, the cooling efficiency on the blade surface gradually rises. When the β is 1.2, the cooling efficiency is 0.130; when β increases to 1.6, the cooling efficiency reaches 0.176, representing an increase of 35.38%.
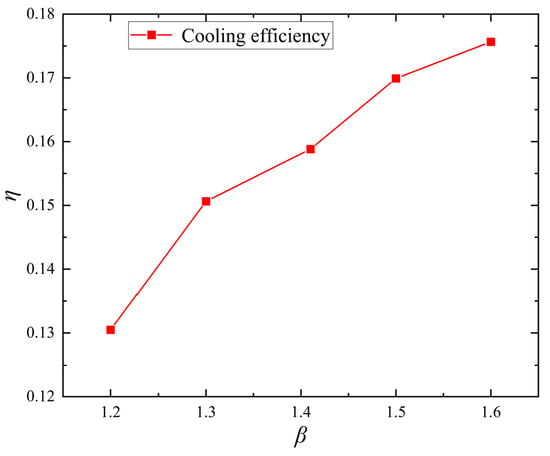
Figure 17.
Variation curve of blade cooling efficiency with β.
The underlying mechanism can be explained by the momentum ratio in film cooling, which has an optimal range. If the momentum ratio is too high, the cooling jet tends to penetrate the mainstream, failing to adhere closely to the blade surface, and can induce strong kidney-shaped vortices that draw high-temperature mainstream gas toward the wall, thereby increasing local heat transfer and reducing cooling effectiveness. Conversely, when the momentum ratio is moderately reduced, the cooling air more easily remains attached along the wall, forming a continuous and stable cooling film that mitigates the thermal attack from the mainstream.
Under the experimental conditions of this study, the cooling air mass flow ratio is kept constant, so the secondary flow mass flow and velocity are essentially unchanged. As the pressure ratio increases, the mainstream channel pressure rises, leading to an increase in mainstream density while the cooling air density changes little. Consequently, the overall momentum ratio between the cooling air and the mainstream decreases. For cases where the initial momentum ratio is relatively high, this reduction brings it closer to the optimal value, improving the attachment of the cooling air on the blade surface, enhancing the film cooling coverage, lowering wall heat transfer, and ultimately increasing blade cooling effectiveness.
5.4. Discussion
The prototype turbine blades investigated in this study were designed without cooling structures, which exposes them to a high risk of erosion under high-temperature conditions. To reduce the blade temperature without significantly increasing the aerodynamic losses of the engine, cooling structure optimization was implemented to achieve temperature control. In the cooling design, the mass flow ratio of the cooling air is a key control parameter, and its optimization aims to minimize the extracted cooling air while ensuring that the blade surface temperature remains within the allowable range of the material. For the nickel-based superalloy IN-738 (Manufacturer: Xi’an Guohong Tianyi Intelligent Technology Co., Ltd., City: Xi’an, Country: China), the long-term allowable temperature is approximately 1123 K [35,36]. Under the engine design point condition with a cooling flow ratio of B = 1.0%, the maximum blade surface temperature was 1105.7 K, within the safe range of the material. Further reducing the flow ratio would bring the blade temperature close to the material limit, while increasing the flow ratio, although lowering the blade temperature would significantly increase aerodynamic losses. Therefore, B = 1.0% was selected as the optimal cooling flow ratio for the blade.
At a temperature ratio of K = 1.25, the maximum blade surface temperature was 1100.8 K; when K increased to 1.65, the maximum surface temperature further decreased to 1091.8 K. These results indicate that within the tested temperature ratio range, the blade surface temperature remains below the material’s allowable limit. However, a too-low temperature ratio would divert more high-quality compressed air into the cooling passages, reducing the amount of mainstream air available to the combustor and decreasing engine thrust. Considering both blade thermal safety and overall engine performance, the optimal temperature ratio range in this study is determined to be 1.25~1.46.
Furthermore, variations in the β also significantly affect cooling performance and overall engine performance. At β = 1.2, the maximum blade surface temperature was 1117.9 K; increasing β to 1.41 reduced the maximum temperature to 1114.1 K, and further increasing β to 1.6 lowered it to 1103.8 K. A moderate increase in the pressure loss ratio effectively reduces blade temperature, but excessive increases can intensify the mixing between cooling air and mainstream flow, increasing flow losses. Considering both cooling effectiveness and aerodynamic penalties, the recommended optimal pressure loss ratio range is 1.2~1.5.
6. Conclusions
Based on the study, the following conclusions were drawn:
- (1)
- Within the experimental conditions, as the flow ratio increased from 0.8% to 1.2%, the cooling efficiency rose from approximately 0.136 to 0.162, an increase of 19.12%. A higher flow ratio enlarges the cooling air coverage area, reduces temperature rise after absorbing mainstream heat, and enhances internal cooling passage heat transfer, thereby significantly improving cooling efficiency. However, excessively high flow ratios may lead to partial loss of cooling effectiveness and increased aerodynamic losses, making the proper selection of secondary flow crucial.
- (2)
- Within the investigated experimental conditions, when the temperature ratio increased from 1.25 to 1.65, the cooling efficiency increased from approximately 0.139 to 0.176, a rise of 26.62%. Increasing the temperature ratio lowers the cooling air temperature and increases its density, thereby increasing the density ratio. This enhances the adherence of the cooling air to the blade surface, suppresses mixing and entrainment, and reduces wall heat transfer, resulting in a significant improvement in cooling efficiency.
- (3)
- Within the investigated experimental conditions, increasing the pressure loss ratio from 1.2 to 1.6 raised the cooling efficiency from 0.130 to 0.176, an improvement of 35.38%. A higher pressure loss ratio increases the mainstream density, reducing the momentum ratio between the cooling air and mainstream, which allows the cooling air to adhere more easily to the blade surface, enhances film coverage, lowers wall heat transfer, and improves cooling efficiency.
- (4)
- For the turbine blades studied, the optimal parameters are a cooling flow ratio of 1.0%, a temperature ratio of 1.25~1.46, and a pressure loss ratio of 1.2~1.5.
- (5)
- The cooling structure of the turbine blade was optimized based on numerical simulation methods and manufactured using additive manufacturing technology. Experimental results show that the blade’s overall cooling performance meets the design requirements.
Author Contributions
Conceptualization, J.J. and S.D.; methodology, J.J. and S.D.; software, J.J. and S.D.; validation, J.J., S.D. and R.D.; formal analysis, J.J. and Z.W.; investigation, J.J.; resources, J.J. and Y.F.; data curation, S.D., R.D. and P.L.; writing—original draft preparation, J.J.; writing—review and editing, S.D. and R.D.; visualization, W.F.; supervision, W.F. and S.D.; project administration, S.D.; funding acquisition, S.D. All authors have read and agreed to the published version of the manuscript.
Funding
This research was funded by the Multidisciplinary Collaborative Design Platform Development Project for Ultra-High Temperature Cooled Blades.
Data Availability Statement
The original contributions presented in this study are included in the article. Further inquiries can be directed to the corresponding author.
Conflicts of Interest
The authors declare no conflicts of interest.
Abbreviations
The following abbreviations are used in this manuscript:
| β | Pressure ratio |
| K | Temperature ratio |
| B | Flow ratio |
| TBC | Thermal barrier coating technology |
| mc | Secondary flow mass flow rate |
| mg | Mainstream gas mass flow rate |
| Tc | Secondary flow temperature |
| Tg | Mainstream gas temperature |
| pc | Total pressure at the secondary air inlet |
| Cascade gas inlet total pressure | |
| pout | Cascade gas outlet static pressure |
| Tw | Turbine blade surface temperature |
| S | Total arc-length of the blade outer surface at the 50% span section |
| ΔSi | Arc-length corresponding to measurement point i |
| ε | Blade surface dimensionless temperature |
| η | Cooling effectiveness |
References
- Kong, X.; Zhang, Z.; Zhu, J.; Xu, J.; Zhang, Y. Research Progress on Cooling Structure of Aeroengine Air-Cooled Turbine Blade. J. Propuls. Technol. 2022, 43, 6–28. [Google Scholar] [CrossRef]
- Zeng, Q.; Chen, X. Combustor Technology of High Temperature Rise for Aero Engine. Prog. Aerosp. Sci. 2023, 140, 100927. [Google Scholar] [CrossRef]
- Nourin, F.N.; Amano, R.S. Review of Gas Turbine Internal Cooling Improvement Technology. J. Energy Resour. Technol. 2020, 143, 080801. [Google Scholar] [CrossRef]
- Zhu, H.; Xie, G.; Zhu, R.; Sunden, B. Comparisons on Flow Characteristics and Film Cooling Performance of Cylindrical and Sister Holes with/without internal coolant crossflow. Int. J. Therm. Sci. 2022, 182, 107791. [Google Scholar] [CrossRef]
- Ye, L.; Liu, C.-L.; Liu, H.-Y.; Zhu, H.-R.; Luo, J.-X. Experimental and Numerical Study on the Effects of Rib Orientation Angle on Film Cooling Performance of Compound Angle Holes. Int. J. Heat Mass Transf. 2018, 126, 1099–1112. [Google Scholar] [CrossRef]
- Chen, G.; Liu, Y.; Rao, Y.; He, J.; Qu, Y. Numerical Investigation on Conjugate Heat transfer of Impingement/Effusion Double-wall Cooling with Different Crossflow Schemes. Appl. Therm. Eng. 2019, 155, 515–524. [Google Scholar] [CrossRef]
- Zhang, M.; Wang, N.; Han, J.C. Internal Heat Transfer of Film-cooled Leading Edge Model with Normal and Tangential Impinging Jets. Int. J. Heat Mass Transf. 2019, 139, 193–204. [Google Scholar] [CrossRef]
- Zhang, M.; Wang, N.; Han, J.C. Overall Effectiveness of Film-cooled Leading Edge Model with Normal and Tangential Impinging Jets. Int. J. Heat Mass Transf. 2019, 139, 577–587. [Google Scholar] [CrossRef]
- Jia, G.; Zhang, L.; Lu, C.; Luo, J.; Huang, X. Film Cooling Performance with Internal Coolant Channel Crossflow. J. Aerosp. Power 2015, 30, 823–830. [Google Scholar] [CrossRef]
- Rao, Y.; Chen, P.; Wan, C. Experimental and Numerical Investigation of Impingement Heat Transfer on the Surface with Micro W-shaped Ribs. Int. J. Heat Mass Transf. 2016, 93, 683–694. [Google Scholar] [CrossRef]
- Kalghatgi, P.; Acharya, S. Flow Dynamics of a Film Cooling Jet Issued From a Round Hole Embedded in Contoured Crate. J. Turbomach. 2019, 141, 081006. [Google Scholar] [CrossRef]
- Zhang, Z.; Zeng, W.; Bian, X.; Gao, G.; Xiao, B. Effects of Thermal Barrier Coating on Temperature and Stress of Turbine Rotor Blade. J. Propuls. Technol. 2023, 5, 218–231. [Google Scholar] [CrossRef]
- Zhu, J.; Zhao, C.; Qiu, L. Thermal Protection Effectiveness of Thermal Barrier Coatings in Turbine Blade Applications. J. Aerosp. Power 2019, 34, 2503–2508. [Google Scholar] [CrossRef]
- Haydt, S.; Lynch, S. Cooling Effectiveness for a Shaped Film Cooling Hole at a Range of Compound Angles. J. Turbomach. 2019, 141, 041005. [Google Scholar] [CrossRef]
- Haydt, S.; Lynch, S. Flowfield of a Shaped Film Cooling Hole Over a Range of Compound Angles. In Proceedings of the ASME Turbo Expo 2018: Turbomachinery Technical Conference and Exposition, Oslo, Norway, 11–15 June 2018. [Google Scholar] [CrossRef]
- Haydt, S.; Lynch, S.; Lewis, S. The Effect of a Meter-Diffuser Offset on Shaped Film Cooling Hole Adiabatic Effectiveness. J. Turbomach. 2017, 139, 091012. [Google Scholar] [CrossRef]
- Haydt, S.; Lynch, S.; Lewis, S. The Effect of Area Ratio Change Via Increased Hole Length for Shaped Film Cooling Holes with Constant Expansion Angles. J. Turbomach. 2018, 140, 051002. [Google Scholar] [CrossRef]
- Gao, Z.; Narzary, D.P.; Han, J.C. Film Cooling on a Gas Turbine Blade Pressure Side or Suction Side with Axial Shaped Holes. Int. J. Heat Mass Transf. 2008, 51, 2139–2152. [Google Scholar] [CrossRef]
- Narzary, D.P.; Liu, K.-C.; Rallabandi, A.P.; Han, J.-C. Influence of Coolant Density on Turbine Blade Film-Cooling Using Pressure Sensitive Paint Technique. J. Turbomach. 2012, 134, 031006. [Google Scholar] [CrossRef]
- Jeong, J.Y.; Kwak, J.S.; Park, J.S.; Lee, K. Measurement of Film Cooling Effectiveness for the First-Stage Vane and Endwall of a Gas Turbine with Fan-Shaped Holes. In Proceedings of the ASME Turbo Expo 2017: Turbomachinery Technical Conference and Exposition, Charlotte, NC, USA, 26–30 June 2017. [Google Scholar] [CrossRef]
- Zhang, X. Application of Metal Additive Manufacturing in Aero-engine. J. Aerosp. Power 2016, 31, 10–16. [Google Scholar] [CrossRef]
- Yu, Z.; Guo, Y.; Sun, H.; Zhang, J.; Sun, X. Recent Progress in Structural Integrity of Novel Materials and Advanced Techniques. Acta Aeronaut. Astronaut. Sin. 2024, 45, 029888. [Google Scholar] [CrossRef]
- Zhang, X.; Tao, C.; Liu, C.; Hu, C.; Chen, X. Investigation of Processing Methods and Development of Gas Holes of Engine Blade. Mater. Rep. 2013, 27, 117–120. [Google Scholar] [CrossRef]
- Sambhav, K.; Tandon, P.; Kapoor, S.G.; Dhande, S.G. Mathematical Modeling of Cutting Forces in Microdrilling. J. Manuf. Sci. Eng. 2013, 135, 014501. [Google Scholar] [CrossRef]
- Li, P.; Yang, T.; Li, S.; Liu, D.; Hu, Q.; Xiong, W.; Zeng, X. Direct Laser Fabrication of Nickel Slloy Samples. Int. J. Mach. Tools Manuf. 2005, 45, 1288–1294. [Google Scholar] [CrossRef]
- Dinda, G.P.; Dasgupta, A.K.; Mazumder, J. Texture Control During Laser Deposition of Nickel-based Superalloy. Scr. Mater. 2012, 67, 503–506. [Google Scholar] [CrossRef]
- Tabernero, I.; Lamikiz, A.; Martínez, S.; Ukar, E.; Figueras, J. Evaluation of the Mechanical Properties of Inconel 718 Components Built by Laser cladding. Int. J. Mach. Tools Manuf. 2011, 51, 465–470. [Google Scholar] [CrossRef]
- Acharya, R.; Bansal, R.; Gambone, J.J.; Das, S. Modeling of Solidification and Microstructure Evolution in the Scanning Laser Epitaxy (SLE) Process for Additive Manufacturing with Nickel-Base Superalloy Powders. In Proceedings of the ASME 2013 International Mechanical Engineering Congress and Exposition, San Diego, CA, USA, 15–21 November 2013. [Google Scholar] [CrossRef]
- Doubrovski, Z.; Verlinden, J.C.; Geraedts, J.M.P. Optimal Design for Additive Manufacturing: Opportunities and Challenges. In Proceedings of the ASME 2011 International Design Engineering Technical Conferences and Computers and Information in Engineering Conference, Washington, DC, USA, 28–31 August 2011. [Google Scholar] [CrossRef]
- Luo, J. Research of External Film Cooling Performance of Turbine Blade with Different Internal Cooling Structures. Ph.D. Thesis, Northwestern Polytechnical University, Xi’an, China, 2014; pp. 17–37. [Google Scholar] [CrossRef]
- Dong, S. Comprehensive Simulation Design Platform for Turbine Cooling Blades. Available online: http://www.lgsim.com/wllqypzhfzsjpt (accessed on 1 July 2025).
- Moffat, R.J. Describing the Uncertainties in Experimental Results. Exp. Therm. Fluid Sci. 1988, 1, 3–17. [Google Scholar] [CrossRef]
- Walters, D.K.; Leylek, J.H. Impact of Film-Cooling Jets on Turbine Aerodynamic Losses. J. Turbomach. 1999, 122, 537–545. [Google Scholar] [CrossRef]
- Na, S.; Zhu, B.; Bryden, M.; Shih, T. CFD Analysis of Film Cooling. In Proceedings of the 44th AIAA Aerospace Sciences Meeting and Exhibit, Reno, NV, USA, 9–12 January 2006. [Google Scholar] [CrossRef]
- Li, Y.; Kan, W.; Zhang, Y.; Li, M.; Liang, X.; Yu, Y.; Lin, F. Microstructure, mechanical properties and strengthening mechanisms of IN738LC alloy produced by Electron Beam Selective Melting. Addit. Manuf. 2021, 47, 102371. [Google Scholar] [CrossRef]
- Song, H.; Lam, M.; Chen, Y.; Wu, S.; Hodgson, P.; Wu, X.; Zhu, Y.; Huang, A. Towards creep property improvement of selective laser melted Ni-based superalloy IN738LC. J. Mater. Sci. Technol. 2022, 112, 301–314. [Google Scholar] [CrossRef]
Disclaimer/Publisher’s Note: The statements, opinions and data contained in all publications are solely those of the individual author(s) and contributor(s) and not of MDPI and/or the editor(s). MDPI and/or the editor(s) disclaim responsibility for any injury to people or property resulting from any ideas, methods, instructions or products referred to in the content. |
© 2025 by the authors. Licensee MDPI, Basel, Switzerland. This article is an open access article distributed under the terms and conditions of the Creative Commons Attribution (CC BY) license (https://creativecommons.org/licenses/by/4.0/).
