Abstract
Orbital flybys have been extensively studied for spacecraft missions, resulting in effective mathematical and physical models. However, these models’ applicability to natural encounters involving asteroids has not been explored. This paper examines the applicability of two such theories, patched conics (PC) and the Keplerian map (KM), to asteroid encounters. A review of the two methods will be provided, highlighting their assumptions and range of applicability. Simulations of asteroid–asteroid encounters will then be performed to evaluate their effectiveness in these scenarios. The simulation parameters are set by collecting data on actual asteroid–asteroid encounters, hereby presented, generally characterised by high close approach distances and small masses of the perturbing bodies, if compared to those used to build the flyby theories. Results show that the PC theory’s effectiveness diminishes with increasing approach distances, aligning with its assumptions. Moreover, the prediction of the model is better in the geometric configurations where the flyby has major effects on the orbital energy change. The KM theory has shown good effectiveness for encounters occurring outside the sphere of influence of the perturbing body, even for very high distances. This research investigates flyby models’ strengths and weaknesses in asteroid encounters, offering practical insights and future directions.
1. Introduction
As of July 2024, more than million asteroids have been discovered in the Solar System (www.minorplanetcenter.net/mpc/summary), with approximately in the main belt. The presence of these asteroids is not only known to influence the motion of other planets and asteroids [1,2,3] but it also justifies the possibility of flybys among asteroids. Flybys are also confirmed by the presence of asteroid families generated by impacts among minor planets, and by the theories that prove these to be responsible for the dynamical evolution of the asteroids in the solar system [4,5,6]. A flyby occurs when the trajectories of two bodies, orbiting around a common centre of mass, come close enough that the Keplerian trajectory of at least one of the two bodies is modified by the gravitational perturbation of the other.
Close approaches (CA) between solar system objects occur regularly, such as the near misses of near earth objects (NEOs) with Earth. CAs between minor bodies and planets are also recognised as significant contributors to the mechanisms of solar system formation [7,8] and already in the 19th century, Laplace and Tisserand began observing and studying encounters between comets and Jupiter [9]. The 1976 work by Opik [10] was aimed at studying collisions and close encounters among planetesimals in the solar system, highlighting that the rare events of collisions and spontaneous near misses provide a unique opportunity to investigate the mechanisms of solar system formation.
The outcome of flybys can be studied with numerical simulations of n-body gravitational systems, a method that tends to be complex and computationally heavy, since it involves direct numerical propagations.
Over the course of space exploration, orbital flybys have emerged as a technique for spacecraft trajectory design, enabling missions to navigate through the solar system, reaching paths otherwise unfeasible with the current engine allowances. These manoeuvres, also known as gravity assists, leverage the gravitational pull of celestial bodies to alter a spacecraft’s trajectory and achieve desired destinations. Mathematical models have been developed to describe and optimise flybys applied to space mission design, with proper assumptions and simplifications, to reduce the number of parameters involved and chase analytic and more immediate solutions to the flyby problems.
The first foundations of a gravity assist manoeuvre for interplanetary travel were laid back in 1918 by the Soviet author Yuri Vasilievich Kondratyuk [11]. However, in this document, only the suggestion of a close approach as a potential manoeuvre to gain or lose velocity was proposed without providing any mathematical or physical interpretation of the problem. Nevertheless, this can be considered the first work that recognised the significance of a third body in orbital motion, following the pioneering works on the restricted three-body problem by Poincaré in the late 19th century [12].
The first mathematical models can be dated to 1924–1925 when another soviet engineer, Friedrich A. Tsander [13], presented equations to evaluate the energy and velocity change following a planar flyby. These formulas used parameters still employed today: velocity of approach of the small body, heliocentric velocity of the perturbing body, and deflection angle of the small body’s planetocentric trajectory resulting from the encounter. Furthermore, he was among the first to assume the deflection to occur in a single point [13], a concept still used in the PC theory. A more comprehensive historical account on the first studies on the gravity assist performed before the advent of the actual interplanetary missions can be found in a previous review [14].
Eventually, the PC theory was presented in 1961 by Micheal Minovitch [15], with the purpose of solving the issues encountered by Battin [16] in describing the three-dimensional hyperbolic trajectory for flybys around Mars. The set of parameters employed for trajectory determination, namely the six orbital elements, was too intricate to include the gravitational fields of both the Sun and the target planet. Minovitch used instead the dynamical quantities, position and velocity vectors, as parameters, which proved to be more useful in a three-dimensional frame and allowed him to have equations for analytical solution of the three-body problem [17].
The key idea was to break the trajectory into three legs, each dominated by a different centre of gravity and characterised by a conic section, that can be jointed together to obtain the overall trajectory. Upon this concept, this approach took the name of patched conics. In this way, Minovitch provided a description of the physical mechanism of energy exchange during a close encounter, and was also able to present a formula for the computation of the energy change.
The theory has been expanded over the years, mainly to account for the complex encounter geometries [18] and to provide a more rigorous geometrical description of the flyby trajectory and its outcomes [10]. Graphical and analytical techniques that simplify the search for feasible and effective transfer trajectories, such as the Tisserand Map [19], have also been successfully proposed. However, as the understanding of celestial mechanics deepened, researchers recognised the limitations of the two-body approximation and sought more accurate mathematical models.
The limitations of the PC theory primarily stem from its fundamental assumptions. The flyby is assumed to follow a hyperbolic trajectory, but in many cases, such as in distant and slow flybys, the assumptions break down [20] and the combined influence of both the Sun and the secondary body must be taken into account.
In this context, the restricted three-body problem (RTBP) represented a step forward in the description of the physics involved in the scenario where a small body is subject to the gravitational action of two massive bodies [21]. A popular application is the circular restricted three-body problem (CRTBP) [22], where the two primaries are in a circular orbit around their centre of mass. In the context of the elliptical restricted three-body problem (ERTBP) [22], an additional level of complexity is introduced by considering the primaries in an elliptical orbit.
These methods require numerical integration of a simplified set of equations of motion for the general solution. However, efforts have been dedicated to achieving even greater levels of simplification, striving to shift from numerical to more analytically driven approaches. Among these, methods that integrate the PC theory in the CRTBP to refine the problem’s parameters have been proposed [23,24,25]. Others have expanded the Tisserand maps to the patched-CRTBP, resulting in what is known as the Tisserand–Poincaré (T–P) Map [23]. In 2007, Ross and Scheers proposed the KM method [26,27,28], a semi-analytical tool that describes encounter outcomes occurring far from the secondary body. Another semi-analytical tool is the Flyby map [29], derived from the KM and the T–P map.
The developed models have proven to work well in spacecraft mission design, or for describing the outcomes of encounters involving solar system planets or the Moon, but their range of applicability in close encounters involving asteroids has not been investigated in depth. These are characterised by masses smaller than the planets, and orbits with inclinations and eccentricities different from the typical planetary ones.
In this paper, the PC and KM theories will be reviewed and tested on flybys among asteroids, to evaluate their range of applicability and outcomes. The selection of these two theories is motivated by the fact that they allow for the solution of a flyby, without recurring to the explicit propagation of the equations of motion. PC and KM also allow for analytical and semi-analytical solutions of the direct flyby problem. Another advantage of the revised methods is that they reduce the parameters used for the description of CEs and explain the mechanism of energy exchange with the geometrical and physical features involved.
Their performance in the test cases will be assessed in two ways: considering an inverse flyby solution scenario, where the PC theory is used to obtain the perturbing mass over approach distance ratio given the pre and post flyby orbital states, and the relative error in the prediction of the orbital energy change following a CE for both PC and KM.
2. Dynamical Characterisation of Asteroid Encounters
Dynamical data of asteroid encounters serve as a basis for understanding their physical and geometrical characteristics, and for realistic simulation setup. The scope of this section is to provide an overview of the physical conditions in which asteroid flybys typically occur. Statistical analyses on these data are hereby presented, to link the dynamic outcomes of flybys with their geometrical features. Ultimately the collected data will be used as a baseline for the simulations presented in Section 4.
The selected database consists of CAs identified on the basis of the difference in the residuals of the orbit determination (OD) performed, with the software Find_Orb (www.projectpluto.com/find_orb.htm (accessed on 1 July 2024)), with and without considering these 300 asteroids, as described in a previous work [30]. The observations for the OD are taken from the ESA Neo Coordination Centre (NEOCC) database (https://neo.ssa.esa.int/ (accessed on 1 July 2024)) for all the asteroids, both numbered and unnumbered. This enables the identification of asteroids that have experienced a flyby with one of the 300 most massive asteroids, and the signature used to assess the strength of the CA is the between the perturbed and unperturbed solutions of the OD. This methodology allows the identification of the flyby epoch, the perturbing body and, through the Horizon-JPL ephemerides, the state vectors of the bodies at encounter.
In this section, the encounter parameters will be collected and analysed in terms of relative distances and velocities and approach geometries. In total, over 11,500 close encounters have been found.
2.1. Role of the Encounter Distance
As a metric to compare the encounter distances, we use the Hill’s radius, , as a representation of the size of a body’s sphere of influence (SOI), i.e., the region where the perturbing asteroid’s gravitational influence is assumed to be stronger than that of the Sun.
The absolute frequency distribution of the recorded CA distances, relative to , is shown in Figure 1. The graph represents only the encounters within a distance of 200 Hill’s radii. These are approximately 5500 out of the total events recorded. The plot shows that encounters take place at every distance, with most of them being within the range between 10 and 40 . The long distances observed from these data allow us to exclude the effect of the asphericity of the perturbing asteroid on the overall perturbation of the flyby. This effect diminishes as , with [31], and the distances we deal with in these cases are long enough to neglect this effect. Moreover, we are considering dimensions much greater than the radii of the asteroids, which is the typical distance at which asphericity becomes prominent over other major perturbations [32].
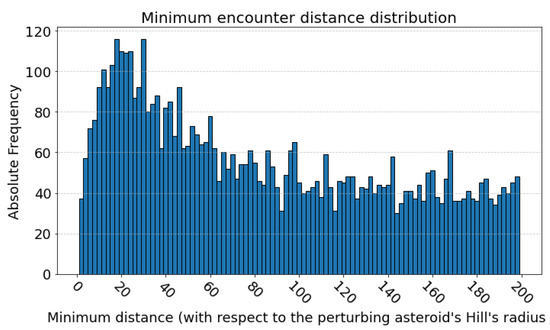
Figure 1.
Bar chart of the absolute frequency of the encounter distances with respect to the perturbing body’s Hill’s radius. The plot includes only the encounters between 1 and 200 . The bins for the bar chart have a uniform span of 2 .
Only 19 encounters where located inside the SOI of the perturbing asteroid, suggesting that very close encounters in a natural and random scenario are rather rare.
Data show that, even for high encounter distances, the flyby has a measurable effect on the RMS residuals, even if, as per Figure 2, distance has an effect on this parameter. The scatter plot shows that the is higher for encounters closer to the perturbing body. Indeed, the encounter distance, as will be shown later, is an important parameter for assessing the effect of a flyby.
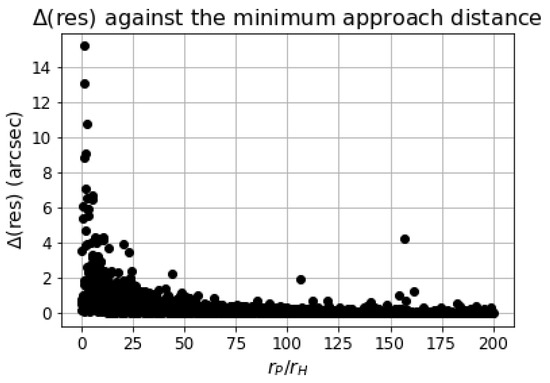
Figure 2.
Relationship between the of the detected single encounters and the encounter distance, relative to the Hill’s radius, .
The plot in Figure 2 contemplates only single encounters, i.e., cases where an asteroid has one and only one close approach with one of the 300 perturbing asteroids in the model. Only 1700 resulted to be single encounters. In these cases, the effect of the flyby on the residuals is direct while, on the contrary, when multiple encounters occur, the impact of each flyby is challenging to disentangle.
For a similar reason, in cases where the is very high, exceeding , it is possible that the cause of the residual change is not solely due to the encounter, but rather a continuous gravitational influence from one of the more massive asteroids such as Ceres or Vesta.
2.2. Role of the Relative Inclination
The relative inclination, in the context of a flyby, is the angle between the perifocal planes of the perturbed and perturbing bodies, as shown in Figure 3. This transformation gains importance in asteroids, as they in general do have an inclination with respect to the ecliptic. Especially for the 300 most massive asteroids, the average inclination is with a standard deviation , so the inclination of the perturbing body and the orientation of its perifocal plane have to be accounted for when evaluating the relative inclination.
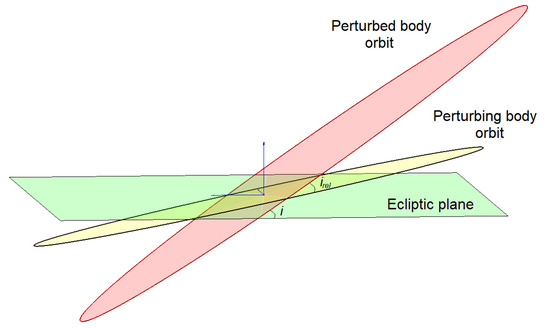
Figure 3.
Representation of the relative inclination between two different orbits. is the inclination that one orbit has with respect to the perifocal plane of the other object, so this was taken as the new reference frame instead of the ecliptic.
This can be calculated analytically from the osculating Keplerian orbital elements of the two bodies using geometric relations and transformation between the two orbits as:
where i and are, respectively, the inclination and the right ascension of the ascending node (RAAN), and the subscripts 1 and 2 indicate the two different bodies.
In the particular cases when the inclination of the secondary is small, the trigonometric expression inside the square brackets can be simplified:
A geometrical formula derived by Opik [10] relates with the relative velocities at encounter, in the context of two intersecting orbits, for analysing flybys or collisions. This relationship is valid for the special case where the perturbing body is circular with a unit semimajor axis, i.e., in the Jacobi normalised units. Under these assumptions, according to Opik’s geometrical formulation, the relative velocity, U, normalised with respect to the perturbing body’s circular velocity, reads:
where T is the Tisserand parameter [33] and is the normalised semimajor axis of the perturbed body.
In Figure 4, the values for relative inclination and normalised relative velocity, U, for the detected cases are shown. It should be noted that a normalisation has to be performed for the values collected in the real-case scenario involved in Equation (3). Semimajor axes are reported as , with being the distance between the Sun and the perturbing body at the moment of the encounter. The relative velocity at encounter, , is normalised to obtain , with pseudo-circular velocity at encounter. is the Sun’s gravitational parameter.
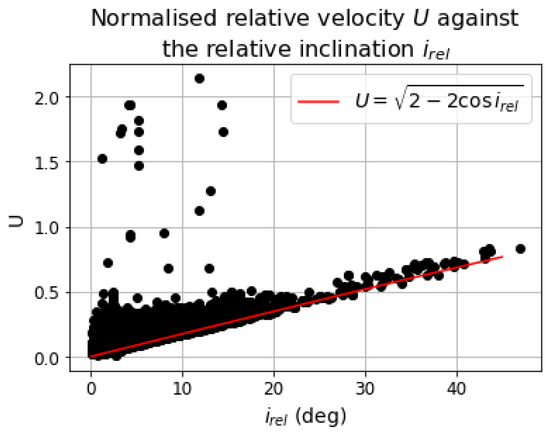
Figure 4.
Relationship between the relative inclination, , and the normalised relative velocity, U.
The region for high inclinations and low U is void, as per the natural domain of Equation (3). An example of limiting curve has been superimposed to the plot, representing the relationship for the encounter with a circular orbit with . Although this only represents a very particular case, the majority of the points are above the red line. For those below the line, the reason has to be found in values of eccentricities of both the perturbing and perturbed body different from zero.
This trend can be explained by considering the velocity vectors of the two bodies. When the magnitudes are equal, a greater inclination usually implies a larger angle between the two vectors, resulting in a greater difference vector. Similarly, eccentricity also contributes to an increase in relative velocity.
2.3. Relative Velocity
Another factor known to play a role in the outcome of a flyby is the relative velocity encounter between the perturbed and the perturbing bodies. In general, this has an effect on the time spent close to the SOI of the perturbing body. A slower flyby allows for more time for the gravitational perturbation to act on the perturbed body and get a major deflection. A faster flyby, on the other hand, will lower the time spent close to the perturbing body, reducing the effect of the flyby itself.
The relative velocity has an upper limit, due to the relative inclinations and differences in eccentricity. From the perspective of a simulation, the relative velocity should be limited in order to avoid, especially at low relative inclinations, the generation of unfeasible orbits, either too eccentric or even with hyperbolic heliocentric trajectories.
A lower limit should stand in order to ensure the escape from the perturbing body. The escape velocity from a body depends on its mass, , and the distance from its centre of mass, and can be expressed as [34]:
The relative velocity, at the moment of the minimum approach distance, should be greater than . This is expected from the analysis of real cases.
Considering the big encounter distances and the low masses involved in the cases of interest, Equation (4) will likely provide a very low threshold, easy to satisfy. This is shown in Figure 5, where the relative velocity and the approach distances are plotted compared to the curve of the escape velocity as a function of the distance. In order to represent in the same graph encounters with objects with different masses and semimajor axes, the quantities have been normalised accordingly, having on the x-axis and on the y-axis , with being the mass parameter of the perturbing body.
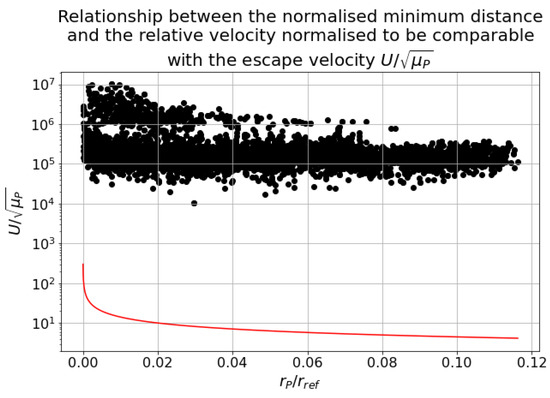
Figure 5.
Relationship between the relative velocity and the encounter distance, compared with the escape velocity, (red line). The y-axis is in logarithmic scale.
The escape condition is always satisfied, as expected. Moreover, in this normalisation the velocity has a downwards trend with the encounter distance.
2.4. Geometrical Parameters in the Planetocentric Frame
In this section, the geometrical encounter parameters are collected and investigated, to see if a correlation between the intensity of the flyby and the directions of approach can be found. These values can also be used as a dataset for simulation setups. The reference frame used is a planetocentric frame (), centred in the perturbing body, the X-axis in the Sun-body direction, with the Sun on the negative axis, the Y-axis in the direction of motion that the perturbing body would have if it moved on a circular trajectory, and the Z-axis parallel to the momentum vector, in order to complete the right-handed frame. The radius of the minimum approach point, , and the relative velocity vector in that point of the trajectory, , can be referred to this reference frame through proper geometric transformations. Once the quantities in the heliocentric-ecliptic () frame and the orbital elements of the perturbing body, indicated with the subscript P, are know, one can apply the proper rotation matrices to find the vectors in the frame:
where and are rotation matrices about the local z and x axes, respectively. and are the right ascension of the ascending node and the argument of periapsis of the perturbing body’s orbit, and is its true anomaly at the moment of encounter.
These vectors can be represented in a tridimensional set of polar coordinates [18,35], as shown in Figure 6. The three angles used in the representation are defined as:
where and represent the direction of the respective vectors in the indicated () directions.
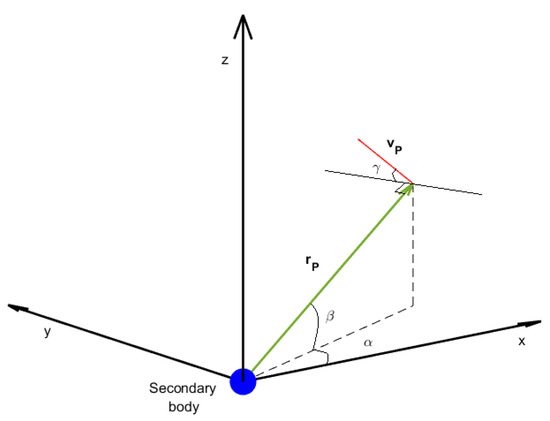
Figure 6.
Geometric representation of the planetocentric frame.
The angles used for representing , , , and , derived from the detected cases, and their relationships are illustrated in Figure 7 and Figure 8. Upon analysing the scatter plot in Figure 7, one can observe fewer occurrences where , indicating encounters happening directly above or below the perturbing body. Similarly, the same pattern is observed when or , signifying cases of encounters parallel to the perturbing body’s direction of motion.
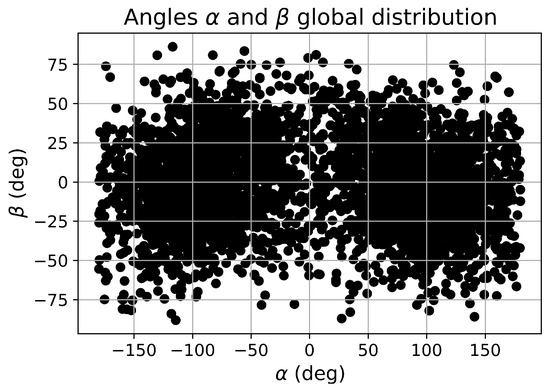
Figure 7.
and angles for the analysed encounters.
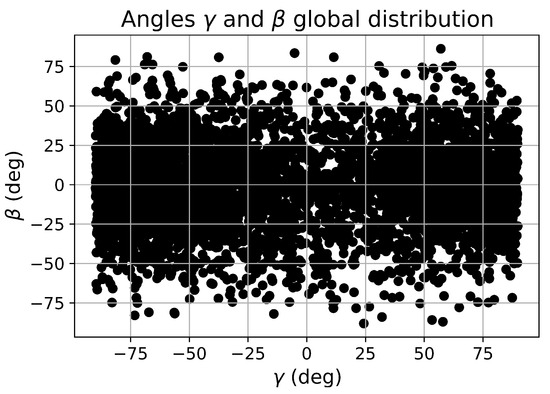
Figure 8.
and angles for the analysed encounters.
This plot encompasses all the encounters identified through the method. Considering the stochastic nature of the analyses, one would anticipate a random distribution of encounters across various parameter ranges. However, the observed distribution deviates from this expectation, revealing regions with notably fewer occurrences. This anomaly suggests that encounters characterized by these specific geometrical parameters may indeed exist in our real-case dataset. The rarity of recorded instances in these regions implies that encounters with such parameters tend to be too faint to be reliably detected with the signature method.
The same can be seen, even if less evidently, in Figure 8 for .
The angle is the parameter that defines how much the relative velocity is tilted with respect to the plane of the perturber. This links to the relative inclination. The latter is confirmed by Figure 9, where the values of are plotted against the respective values of angle. Their relationship is easily readable, with higher corresponding to higher values in . Hence, eventually in the context of simulations, relative inclinations and angles have to be tuned accordingly.
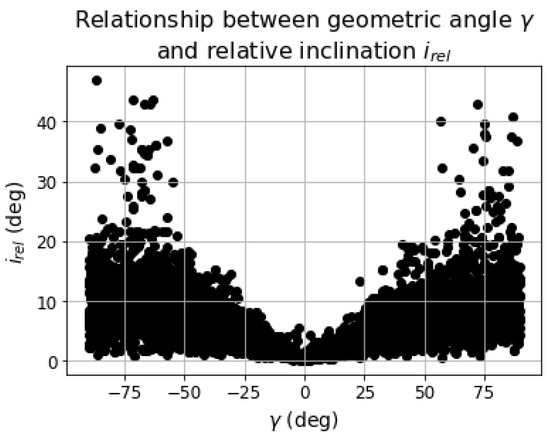
Figure 9.
Relationship between and .
However, from the analysis of Figure 4 it was said that the relative inclination should be related to the normalised relative velocity, U, so that one would expect the same relationship between and to be valid also for and U. The latter is shown in Figure 10.
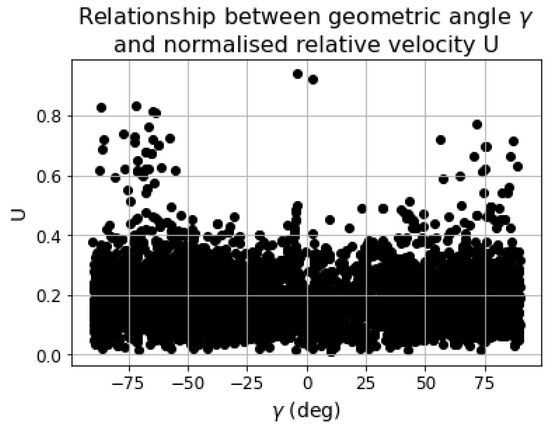
Figure 10.
Relationship between and U.
From this plot, one can say that higher values of U can take place only in the presence of high values of . The points are more uniformly distributed than in the previous plot, especially in the region around . Indeed, and U are not physically related, while the drivers for are both and U. For low values, no matter how much the velocity is, the relative inclination will always be low, while, on the contrary, it is possible to lower down U to get low for high s.
Furthermore, from the values in Figure 10 we can assume U ranging typically between and .
3. Flyby Theories
In the following paragraphs, the technical contents of PC and KM will be revised, together with their assumptions, limitations, mathematical foundations, and relevant reference systems.
3.1. Patched Conics
The PC theory, also known as the linked conics approach [34], is an analytical method used to model flyby trajectories. It simplifies the three-body problem, breaking it down into a series of two body problems modelled by conics of simpler mathematical interpretation. It involves three bodies: a small massless particle, that experiences the flyby, a perturbing or secondary body, and a primary; the first two bodies orbit around the primary. A planetary flyby can be decomposed into three distinct trajectories: two elliptic arcs about the primary body, namely the Sun, before and after the encounter, and a two-body Rutherford-like scattering hyperbole about the secondary body, which connects the two heliocentric arcs and represents the flyby itself. The fundamental idea at the basis of this method is that every arc is influenced only by the gravitational attraction of one body, and the presence of the two massive bodies is never considered simultaneously. The elliptic arcs are influenced by the Sun and the hyperbole only by the planet, and the concept of SOI [36] is used to determine when to switch from one body to another. Within the SOI of the secondary, its gravitational effect dominates that of the Sun, allowing the PC theory to neglect the influence of the Sun. Outside the SOI, instead, the primary has the strongest influence and is considered as the only centre of attraction. A flyby, in this context, takes place when the small body enters the SOI of the secondary.
The SOI can be mathematically represented by the Hill’s sphere, which is the sphere around the secondary where its gravitational influence dominates over the larger primary body. Its physical interpretation comes from the solution of the Lagrangian three-body problem, since its dimension is almost the distance between the first and second Lagrangian points. A possible formula to compute the radius of the Hill’s sphere is [34]:
where is the mass of the perturbing body, M the mass of the primary, and is the distance between the secondary and the primary.
Inside the SOI, the massless particle moves in a hyperbolic trajectory around the secondary, as in Figure 11. This trajectory is relative to the secondary, which is also in motion around the Sun. At the edges of the sphere of influence, the massless particle has a relative velocity, which takes the name of hyperbolic excess velocity, of , where is the heliocentric velocity of the massless particle before the encounter and is the heliocentric velocity of the perturbing body. Throughout the following pages, heliocentric velocities will be denoted in capital letters, while relative velocities with respect to the perturbing body will be represented in lowercase letters.
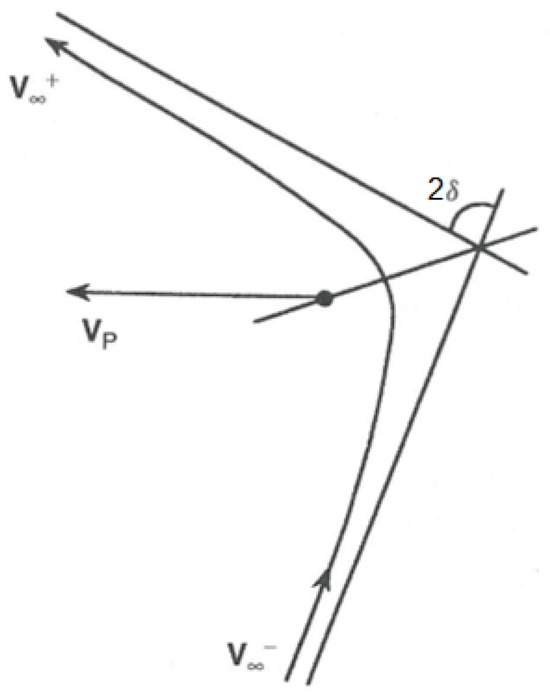
Figure 11.
Hyperbolic trajectory of the massless particle around the secondary during a flyby. represents the velocity vector of the secondary, and are, respectively, the velocities at the entry and exit points of the hyperbolic trajectory, and is the deflection angle between the two asymptotes of the hyperbola, caused by the flyby.
The direction of also indicates the direction of the incoming asymptote of the hyperbola. Due to the gravitational interaction between the two bodies, the asymptote is rotated by an angle, , that depends on the mass of the secondary, the hyperbolic excess velocity, and the minimum distance of the approach trajectory [35]:
where is half of the rotation of the asymptotes, is the minimum distance between the two bodies during the encounter, and is the gravitational parameter of the secondary. This rotation represents the deflection of the flyby itself.
After the encounter, the relative velocity, at the exit of the SOI, is rotated with respect to by an angle, , and has the same magnitude as . The post-encounter heliocentric velocity is obtained by the vector sum .
In this model, the rotation of the velocity, which represents the effect of the encounter in the PC approach, is assumed to occur at a single point: the point of minimum distance between the unperturbed heliocentric trajectory and the perturbing body.
In this way, the rotation of the hyperbola and the after the encounter can be calculated [34]:
where is the magnitude of the velocity at the minimum distance. From the previous assumptions, the related to the planetocentric trajectory is equal to the related to the heliocentric trajectory.
As showed by Minovitch [15], the use of the vectors allows for the evaluation of the energy change due to the flyby, which can be computed as:
The formula of is also important to understand the mechanism of energy exchange during a flyby. In this process, the smaller body undergoes a change in momentum relative to the secondary body. The rotation of the relative velocity, followed by its vector summation with the perturbing body’s velocity, not only alters the magnitude of the velocity but also modifies the flight path angle. In non-coplanar flybys, the inclination can undergo changes as well. It is important to note that this manoeuvre affects the secondary body, subjecting it to mutual gravitational perturbations from the smaller body. However, due to the substantial difference in masses, with the secondary having significantly greater mass, the impact on the secondary from the flyby becomes practically negligible.
The can also be evaluated analytically once the geometric encounter parameters are defined. Broucke [18] proposed a set of parameters that enabled him to derive an analytical formula for the energy change in the co-planar flyby involving just three parameters. This set was later expanded by Prado [35] to account for the three-dimensionality of a generic flyby, and this approach will be considered in the following pages, to better describe the real cases encountered. The three-dimensional set of parameters is shown in Figure 6, and the can be computed [35]:
Opik’s Theory
Opik’s theory of close approaches is a formalism based on a two-body scenario to study and predict encounters [7,10]. Opik’s theory models the flyby, similarly to the PC theory, as a two-body problem and can describe, through the use of the Opik variables, the pre- and post-encounter parameters of a flyby and systematically study its outcome. Originally it was thought and widely used as a tool to analyse planetary encounters, especially in the context of comet capture and planetary formation, collisions of planetesimals, and resonant encounters. However, with the advent of numerical computation, it has progressively transformed from a predictive tool to a tool for understanding the dynamic and geometric features of close approaches. The formalism was developed for intersecting orbits, and although it was originally valid only at collision, in 2003 [37] an extension of the theory was proposed to account for non-collision cases, using a first-order approximation of the particles hyperbolic motion.
In the Opik’s formulation, the massless particle and the secondary body move in their heliocentric trajectories around the Sun. They are placed in a Jacobi frame. In this non-dimensional frame, the components of the relative velocity, , at encounter can be derived geometrically from the orbital elements of the massless particle [10]:
where are the heliocentric orbital elements of the perturbed body. The ± symbol depends on if the encounter takes place at the ascending or descending node defined upon the perifocal plane of the perturbing body. U is the direction of the incoming asymptote of the pre-encounter unperturbed trajectory, and the magnitude of is as in Equation (3).
This vector can also be expressed in the XYZ local planetocentric reference frame, making use of angular coordinates in the form of , as shown in Figure 12. With such a definition, the vector can be rewritten:
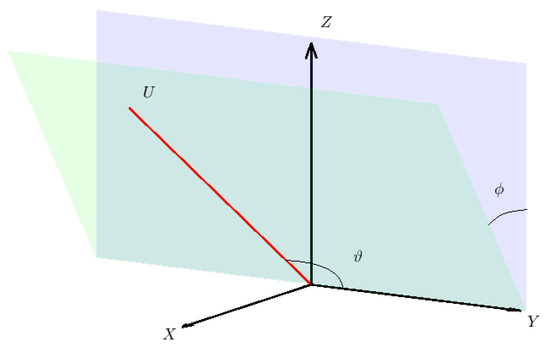
Figure 12.
Representation of the relative velocity vector, , in the planetocentric frame. is the angle between the Y-axis and , while is the angle between the plane and the plane.
The orientation of determines the b-plane or impact plane [38], a plane centred at the planet and orthogonal to . This plane encompasses vector , extending from the planet to the point of intersection with the incoming asymptote. The magnitude of corresponds to the impact parameter b.
As a consequence of the encounter, the relative velocity is rotated according to the two-body scattering scenario with the angle , such that:
As this is the rotation of the asymptotes of the flyby hyperbola, Opik’s theory enables the computation of post-encounter Opik parameters , , , determining the direction of the outgoing asymptote and, consequently, the post-encounter heliocentric trajectory.
Opik’s theory has been developed over the years and used to analytically study the energy distribution in CAs [39], to analytically solve the direct flyby problem, allowing one to find the pre-encounter trajectory given the desired post-encounter condition and the perturbing body [40].
Other studies have highlighted the constraints of this approach, typically sharing the limitations inherent in the PC theory. Challenges become prominent, especially in cases where encounters unfold slowly and cannot be accurately approximated as occurring at a single point. Additionally, complications arise when the secondary body influences the particle, even outside the context of an ongoing flyby [20]. Encounters between co-planar bodies are critical for Opik’s theory [41], where the heliocentric velocities approach tangency, and the Tisserand parameter tends towards 3 [39].
3.2. Keplerian Map
The KM serves as a semi-analytical tool for assessing the consequences of a flyby within the framework of the CRTBP. Specifically, it enables the computation of changes in the orbital elements of a small body influenced by the third-body effect over one period of revolution. The KM has also demonstrated effectiveness beyond the SOI of the perturbing body [27,28], and this hypothesis will be discussed in the results section. In the upcoming paragraph, the focus will be on examining the change in the semimajor axis, denoted as , crucial for the energy variation [27].
The KM method facilitates the mapping of the six orbital elements of the small body, illustrating their alterations after one revolution while considering the perturbation from the secondary. The chosen reference system is the synodic frame, shown in Figure 13, characterised by an x-axis fixed along the line connecting the primary and secondary, and rotating in accordance with the two bodies with the angular velocity , where R is the distance between the primaries. The y-axis is orthogonal to the x-axis, in the direction of the velocity of the secondary. Finally, the z-axis completes the right-handed frame. Additionally, the same Jacobi units described in the previous paragraph are used to simplify the equations and non-dimensionalise the problem. This reference frame, used in the mathematical definition of the CRTBP and in the context of the KM, allows for the immediate definition of the positions of the two primaries, with the small body’s position determined from its orbital elements.
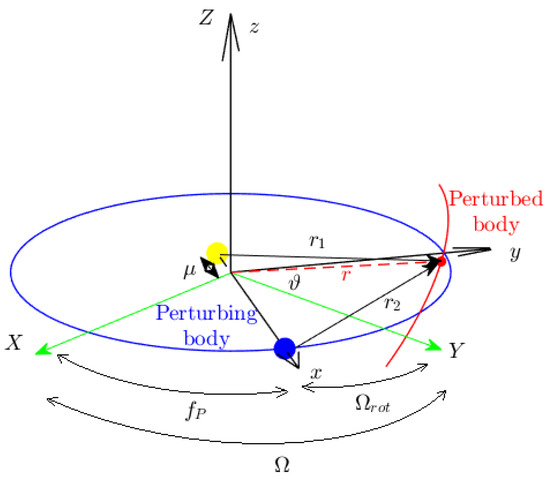
Figure 13.
Representation of the synodic reference frame.
A first Picard iteration of the Lagrange planetary equations (LPE), numerically integrated over one period of revolution of the small body, provides the estimate of the change of the orbital parameters. Assuming and , with the radius connecting the small body to the centre of the synodic frame, the Hamiltonian for the motion of the massless particle can be written as per [27]:
where is the Keplerian term of the nominal trajectory and is the disturbing potential. The variation of the orbital elements can be retrieved with the LPE [31] applied to the disturbing function [28]:
Here, r is, under the approximations, comparable to , distance between the small body and the primary. is the angle between the lines connecting the two primaries and the centre of the reference frame to the small body. Hence, the distance between the small and the perturbing body is .
The variation of the semimajor axis can be obtained by applying a first Picard iteration on the LPE over a period of time [28]:
in which is the mean motion of the small body and is its mean anomaly. and are two arbitrary values of time.
However, from the analytical point of view, it is more convenient to express the integrals with respect to the true anomaly, f, taking as a reference point the orbital elements at the periapsis of the Keplerian orbit of the small body. The derivatives can then be evaluated with respect to the true anomaly and the integration can be done over one period of revolution from to , allowing the method to inevitably consider the effect of the close encounter. The formula for the semimajor axis change over an orbital period then becomes [28]:
The values with subscript ”0” are intended to be those evaluated at the periapsis of the orbit, as it has been taken as the centre of integration. The integral has to be evaluated numerically, although an analytical expression for the derivative of the disturbing function in Equation (18) can be provided [28]:
All the quantities in this equation can be evaluated from the orbital elements of the small body, given the geometry of the CRTBP. is defined as the angle between the RAAN of the small body and the true anomaly of the secondary in its circular motion: . Since the secondary is in circular motion in the synodic normalised frame, where its period is exactly , it can be written as a function of the orbital elements of the small body, in particular its true anomaly, f, to account for its variation in time, as in [27]:
Since can be directly connected to the time of integration, is the time at which the small body passes through its periapsis, so that and at encounter. For a successful numerical integration, it is crucial that the value of remains within the bounds of and . Furthermore, with these definitions, the angle between the secondary and the small body can also be analytically defined [27]:
Finally, the numerical evaluation of the integral in Equation (20) can be calculated. The method has proven to be reliable for encounters outside the SOI and is faster than the numerical integration of the CRTBP equations of motion [27,28].
4. Applicability of the Theories on Asteroid Encounters
In Section 2, it was shown that the majority of asteroid encounters take place far from the SOI of the perturbing body, a condition that goes against the assumption for the PC theory and that instead is beneficial for the KM theory. However, previous studies have shown that Opik’s theory, and hence the two-body approach, can work well, in certain cases, even where the encounters are slow and distant [20], even those several times the Hill’s radius of the perturbing body [41].
The applicability of the PC theory is hereafter verified through numerical simulations of close encounters among asteroids. The flybys are modelled in the planetocentric frame at the moment of closest approach using the three-dimensional Broucke parametrisation illustrated in Figure 6 and normalising the physical quantities according to the Jacobi units.
The physical parameters at encounter used for the simulations have been retrieved from the data presented in Section 2 and properly set within the following ranges:
- The angles , , are set in order to obtain all the possible combinations of geometric positions for the minimum distance radius and velocity; the ranges are: , , ;
- The mass parameters of the perturbing body span from the mass of the fourth most massive asteroid, Hygiea (), to the 299th in the list (Ganymed with );
- The velocity at the moment of the closest encounter, , ranges between and ;
- The minimum approach distance, , spans from 2 to 100 times the of the perturbing body. To analyse the differences with a flyby inside the SOI, the values and are also included in a simulation.
These quantities define the encounter configuration, and for getting the pre- and post-encounter conditions, the trajectory of the massless particle is propagated backward and forward, respectively, for half a period of the perturbing body, i.e., , considering the use of the normalised frame. This is implemented to ensure that the massless particle does not experience the gravitational influence of the perturbing body at the initial and final moments of the propagation, and to avoid multiple encounters. The simulation setup comprises only the Sun with unit mass, the perturbing body, and the massless particle, allowing the neglect of the disturbing effects of other bodies. The propagation is performed with the integration of the Gauss variational equations (GVE) [31,42]. The disturbing, or perturbing, acceleration is represented by the gravitational acceleration of the secondary body [43], and the integration is performed with the DOP853 routine in Python, which implements an explicit Runge–Kutta method of order 8 with time step control.
4.1. Inverse Flyby Solution
Let us consider a scenario where the epoch of the flyby, along with the Runge–Kutta and post-encounter trajectories, is known, but no information is available regarding the mass and orbit of the perturbing body. The PC theory was initially developed to address the direct flyby problem, where all characteristics of the perturbing body are known, and the design focuses on achieving a specific geometry for the encounter based on the desired pre or post trajectory. We can reverse Equation (9) to extract information about the perturbing body when given the pre- and post-encounter arcs. In fact, encounter distance-to-perturbing mass ratio is:
Its validity extends to all cases where the PC theory is applicable. The deflection angle, , and the value of the relative velocity at minimum approach, , can be evaluated, even without information on the perturbing body. Its orbit can be assumed as circular, with a radius equal to the radius at which the encounter, i.e., the deflection, takes place. If we assume the secondary is moving in a circular orbit, the problem is simplified (with the assumption of a fixed eccentricity, ) and its velocity at encounter, , corresponds to the circular velocity for the given radius. The angle is instead obtained as the angle between the pre and post unperturbed relative velocities, obtained through a two-body heliocentric propagation of the pre- and post-encounter trajectories.
The results of this inverse PC can give only information on the ratio , and these two quantities cannot be decoupled through only using the two-body theory. However, this tool is powerful also because it does not require any assumption on the approach direction. In fact, if one also knew the approach distance and direction, the mass of the perturbing body could be retrieved with a reverse KM approach.
The applicability of this reversed formula in the context of asteroid encounters can be verified both by considering the real data presented in Section 2 and numerical simulations, comparing the actual value of the distance over mass ratio and the result of Equation (24). For the real cases, the formula can predict the ratio with a relative error smaller than for of the cases. However, it is with the results of the numerical simulations that one can obtain a better idea of how this formula, hence the PC approach, is working for asteroid flybys, given a higher level control on the encounter parameters.
The findings emphasize that the accuracy of predictions, as per the assumptions of the PC theory, is influenced by the control parameters. An increase in leads to a corresponding increase in error, whereas an increase in the mass of the perturbing body or the relative velocity at encounter results in a reduction of the relative error. Despite aligning with the limitations of the PC theory, the predicted values remain accurate, even for encounter distances significantly beyond the Hill’s radius.
4.2. Errors in the Energy Variations Estimations
From Equation (12), one can calculate the energy change resulting from the flyby using the PC theory, while for KM:
where is the semimajor axis of the pre-encounter trajectory and is given by Equation (20).
Multiple encounters are simulated to compare the variation in energy differences () described by both the PC and KM theories, with the actual values between the pre- and post-encounter arcs.
A previous study [44] conducted a similar analysis to evaluate the applicability scope of the PC theory when varying parameters in the 3D Broucke parametrisation. That publication analysed the absolute difference in between the PC theory and CRTBP propagation, concluding that larger masses of the perturbing body, lower , and lower were leading to higher absolute errors. These findings were justified by asserting that, with that combination of parameters, the duration of the small particle’s influence by the secondary is extended, and it is inappropriate to consider the flyby as instantaneous. While these results may appear to contradict the assumptions of the PC theory, especially concerning the approach distance and the mass of the perturbing body, they are accurate because the absolute error served as the control parameter. This absolute error is computed as the difference between and . Indeed, with an increase in distance or a decrease in the mass parameter, the overall becomes smaller, resulting in smaller differences between the values obtained through the two different methods.
A more accurate way to assess the performance of methods like PC or KM in predicting the energy change is using the relative error, calculated as:
In the following paragraphs, the relative errors for the two revised theories will be analysed and compared. The results for the PC theory will be used to see if the conclusions of the previous work [44] can stand also in the relative error, even if, in this case, the simulation parameters will be based on the asteroid encounters data, so larger distances and smaller mass parameters than in the benchmark paper.
4.2.1. Relative Errors for the PC Theory
The plots in Figure 14 show the relative error in for an asteroid flyby at different distances from the perturbing body. To reduce the complexity of the problem and simplify the readability of the results, some of the parameters have been fixed, and only , and vary over the respective ranges. The other variables are , , and .
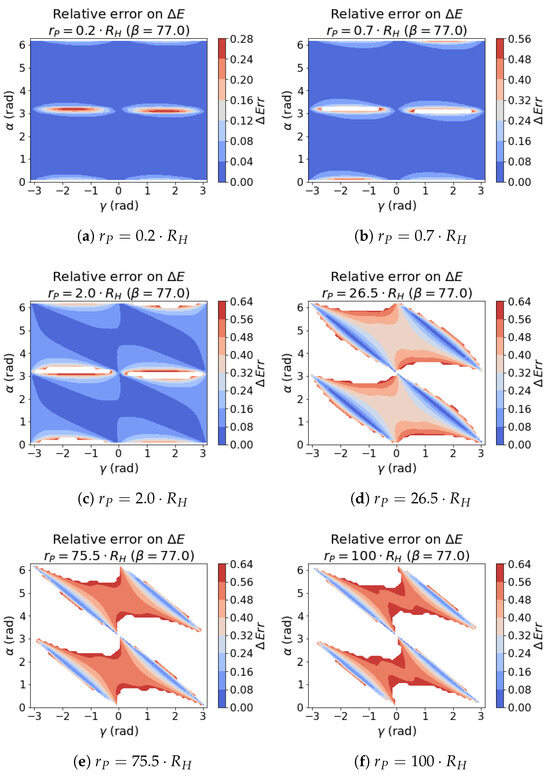
Figure 14.
Relative error of the with respect to at different and . The values above are blanked out in the heatmap for a better visualisation.
The sequence of plots show a degradation of the performance of the PC theory to predict the actual flyby outcome as the distance increases. The trend is also sensitive to the approach geometry, with higher values around the encounters taking place at , which is incidentally also where , according to Equation (12), and in general where is lower, as also shown later. Getting much further from the SOI, the relative errors become too high to consider the PC prediction as a reliable one, with errors greater than that have been blanked out from the plots for an easier visualisation.
In general, what is represented in the graph can be explained by noting that the lower relative errors take place where the is higher, and vice-versa. The reason can be twofold. Specifically, when is low but not zero, i.e., when , Equation (12) yields zero, failing to capture even a minor that might exist in reality. This deficiency results in a substantial relative error, potentially reaching . This occurs because the PC model, when confronted with minimal , inaccurately approximates the encounter outcome as having zero energy change. The second aspect contributing to this phenomenon is the presence of a low denominator value in Equation (26), amplifying the relative error. This dual effect is more pronounced for scenarios with lower values. In contrast, higher values tend to alleviate this issue, although a discernible increase in absolute error may persist, as indicated in [44].
The same assumption on high –low error can be verified when looking at the planar case, as per in Figure 15. When , Equation (12) is maximised in and indeed the results show a lower error if compared to the previous one, with .
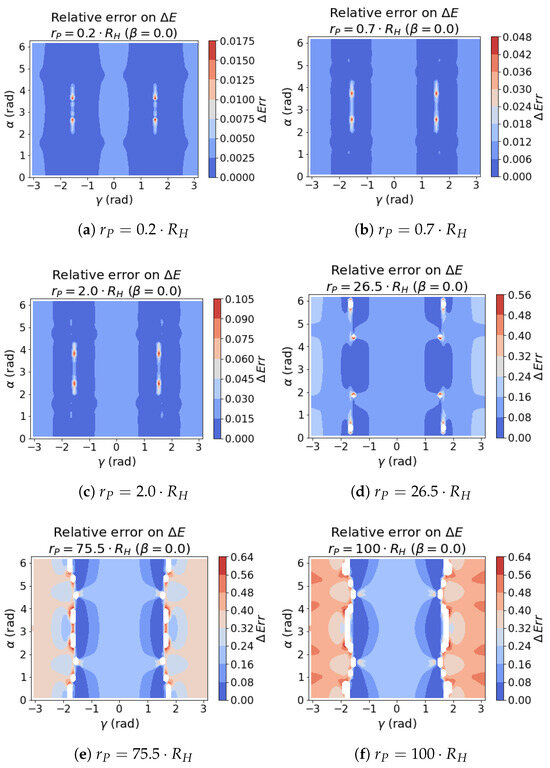
Figure 15.
Relative error of the with respect to at different and . The values above are blanked out in the heatmap for a better visualisation.
In this scenario, the errors are more steadily below the threshold, even for larger distances. This confirms a dependency of the relative error in that goes accordingly to that in , following the trend of the respective sinusoidal functions present in Equation (12).
However, the impact of the parameter on the results is different. This parameter is not incorporated into Equation (12) and does not play any role in . This absence of influence is also evident in Figure 16, where is plotted for two values of , and no effect of is observable. Nonetheless, in Figure 14 and Figure 15, the relative errors are impacted by , indicating that its effect is significant in real cases. This suggests that the real case scenario, unlike the PC formulation, is influenced by and that its absence in the PC equation may lead to discrepancies in relative errors.
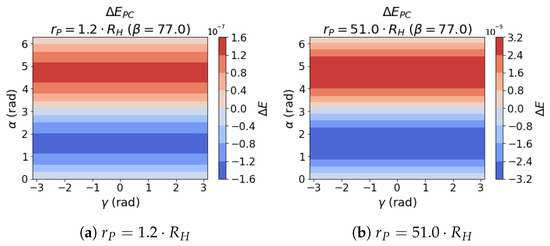
Figure 16.
for . According to Equation (12), there is no effect of parameter .
The latter is confirmed by Figure 17, where the is plotted for the same distance ratios, and here the role of becomes more clear, especially when the distance from the perturbing body increases. This suggests that, once again, equations related to the PC theory tend to be a valid representation of the reality only when close to the SOI of the perturbing bodies.
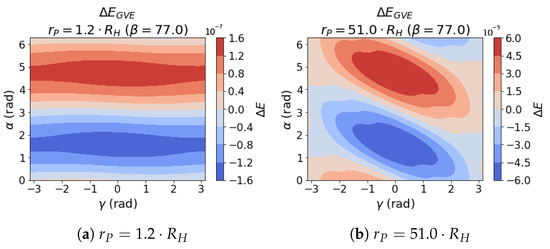
Figure 17.
for .
4.2.2. Relative Errors for the KM Theory
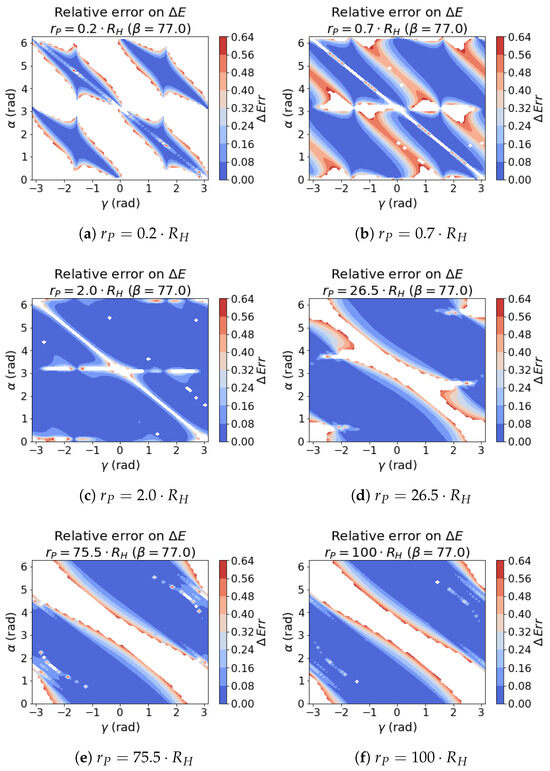
Figure 18.
Relative error of the with respect to at different and . The values above are blanked out in the heatmap for a better visualisation.
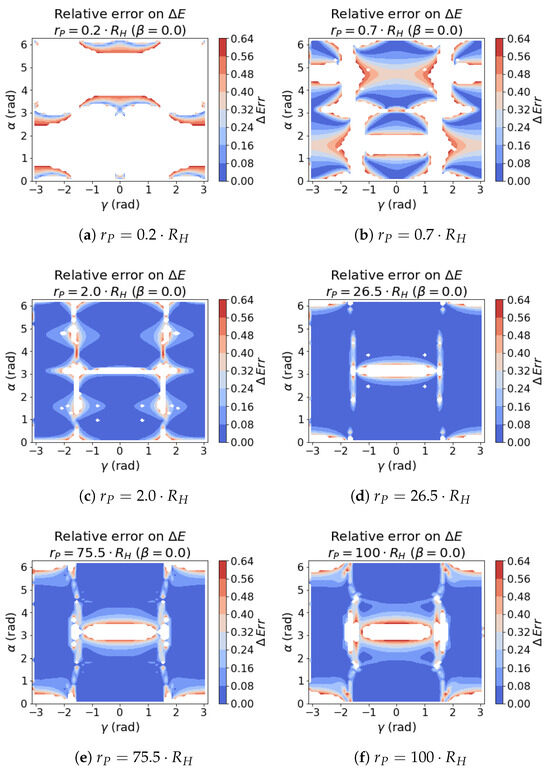
Figure 19.
Relative error of the with respect to at different and . The values above are blanked out in the heatmap for a better visualisation.
In the first case, the outcome is much more positive than the PC theory for the areas far from the SOI. The differences in the performance of the method between and 100 times the Hill’s radius is almost inappreciable. The behaviour inside the SOI is instead much worse than the PC results, confirming what was stated in Section 3.2 on the effectiveness of KM outside the SOI.
The plots at highlight a similar response, but with a wide area around , where the method is not able to give a reliable prediction at any distance.
5. Conclusions
A total of 11,500 close encounters among asteroids have been identified from the OD of all the objects present in the ESA’s NEOCC database. The data highlight the distant nature of typical asteroid encounters, with only 5500 events happening within a distance from the perturbing body of 200 Hill’s radius and only 19 inside the SOI of the perturbing body. This is attributed to the chaotic distribution of asteroids in the solar system, which is mirrored in their encounter patterns. Additionally, the small masses of asteroids result in smaller SOI, further reducing the geometric probability of encounters occurring within the SOI. The collected data can also help in statistically evaluating the geometric parameters that characterise a typical asteroid–asteroid encounter. Furthermore, the survey can assist in setting up numerical simulations of asteroid flybys. Particularly, the parameters of the 3D-Broucke parametrisation of the actual encounters have been shown, emphasising the typical range of normalised relative velocity, which spans between and .
Theories for describing flyby outcomes have been developed and are widely available in the literature. A focus has been placed on methods capable of analytically or semi-analytically solving the flyby problem using a limited set of parameters, which are constrained either to encounter geometry or the orbital elements of the involved bodies. The PC and Opik’s theory have been outlined, along with their respective assumptions and limitations, emphasising that these theories are not designed for describing encounters that are too distant from the perturbing body. Particularly significant in the context of asteroid dynamics is Opik’s theory, explicitly developed for planetary flybys and collisions, providing geometric descriptions of encounter parameters. Another theory tailored for planetary encounters is the KM theory, which can semi-analytically solve flybys and predict changes in post-encounter orbital elements. The fact that these theories are implemented for planetary encounters means that the eccentricity and inclination of the perturbing bodies are considered as zero. This assumption, though acceptable for planets, becomes no more valid for generic asteroid encounters, characterised by higher eccentricities and inclinations.
The applicability of these theories to asteroid encounters challenges their fundamental assumptions. By testing the analytical formulations of the PC theory against data on asteroid encounters through simulations, this aspect has been investigated. The results indicate a degradation in the ability of the PC theory to predict the actual outcome of a flyby as the distance from the central body increases, as expected. However, it is also demonstrated that the PC theory exhibits the capability to describe encounters outside the SOI, contrary to the assumptions of the PC theory.
A dependency on the geometry approach is evident. Indeed, the relative errors are smaller when Equation (12) tends to higher values, i.e., when the flyby has a stronger effect. Also, a dependency on the geometric parameter in the energy change, , has been observed in the numerical simulations. This dependency is absent in the PC formulations. However, the results indicate that this dependency becomes significant when approaching the edge of the SOI and is important when very far from the perturbing body. This aligns with the limits of validity of the PC theory, suggesting a co-influence of the distance and .
The KM theory has similarly shown a dependency on the geometry but has proven to work better than the PC theory for the cases outside the SOI, even at very high distances. This is due to the fact that it is a semi-analytical method that takes into account the equations of motion more than the PC theory. However, the performances inside the SOI have demonstrated to be non sufficient for flyby analyses.
Future works should focus on better understanding the mechanism governing very distant encounters. The physical explanation for why has a significant effect only outside the SOI remains unclear. One potential explanation could be that contributes to the out-of-plane component of velocity, leading to a higher relative inclination (Figure 9). However, investigations in this direction have not yielded conclusive results.
Furthermore, studying distant encounters could now lead to a new, general definition of the boundaries of application for the PC-two-body theory, following recent works on enhanced dynamical definitions of planetary SOIs [45]. As demonstrated, the boundary of the SOI can be surpassed.
Author Contributions
Conceptualization, N.S. and M.C.; Methodology, N.S. and M.C.; Formal analysis, N.S.; Writing—original draft, N.S.; Writing—review & editing, M.F., M.M. and M.C.; Supervision, M.F., M.M. and M.C. All authors have read and agreed to the published version of the manuscript.
Funding
This research was funded by the European Space Agency (ESA) Open Space Innovation Platform (OSIP) campaign and by Cranfield University (ESA Contract no. 4000134762/21/NL/MH/hm-Asteroid Collisions).
Data Availability Statement
The data underlying this study were accessed from the publicly available ESA NEOCC asteroids observations database (https://neo.ssa.esa.int/ (accessed on 1 July 2024)).
Conflicts of Interest
The authors declare no conflicts of interest.
References
- Somenzi, L.; Fienga, A.; Laskar, J.; Kuchynka, P. Determination of asteroid masses from their close encounters with Mars. Planet. Space Sci. 2010, 58, 858–863. [Google Scholar] [CrossRef]
- Fienga, A.; Simon, J.L. Analytical and numerical studies of asteroid perturbations on solar system planet dynamics. Astron. Astrophys. 2005, 429, 361–367. [Google Scholar] [CrossRef]
- Standish, E. Dynamical Reference Frame—Current Relevance and Future Prospects. Int. Astron. Union Colloq. 2000, 180, 120–126. [Google Scholar] [CrossRef][Green Version]
- Milani, A.; Knežević, Z.; Spoto, F.; Paolicchi, P. Asteroid cratering families: Recognition and collisional interpretation. Astron. Astrophys. 2019, 622, A47. [Google Scholar] [CrossRef]
- Bottke, W.F.; Brož, M.; O’Brien, D.P.; Bagatin, A.C.; Morbidelli, A.; Marchi, S. The collisional evolution of the main asteroid belt. Asteroids IV 2015, 1, 701–724. [Google Scholar] [CrossRef]
- Bottke, W.F., Jr.; Cellino, A.; Paolicchi, P.; Binzel, R.P. An overview of the asteroids: The asteroids III perspective. Asteroids III 2002, 1, 3–15. [Google Scholar]
- Carusi, A.; Valsecchi, G.B.; Greenberg, R. Planetary close encounters: Geometry of approach and post-encounter orbital parameters. Celest. Mech. Dyn. Astron. 1990, 49, 111–131. [Google Scholar] [CrossRef]
- Kankiewicz, P. Orbit inversion scenarios of minor bodies in retrograde orbit. Planet. Space Sci. 2020, 191, 105031. [Google Scholar] [CrossRef]
- Everhart, E. Close Encounters of Comets and Planets. Astron. J. 1969, 74, 735. [Google Scholar] [CrossRef]
- Opik, E. Interplanetary Encounters; Elsevier: New York, NY, USA, 1976. [Google Scholar]
- Kondratyuk, Y.V. Pioneers of Rocket Technology. In: To Whomsoever Will Read in Order to Build. National Aeronautics and Space Administration. English Translation of Pionery Raketnoy Tekhniki—Kibal’chich, Tsiolkovskiy, Tsander, Kondratyuk—Izbrannyye Trudy. Available online: https://ntrs.nasa.gov/citations/19660002877 (accessed on 9 July 2024).
- Koon, W.; Lo, M.; Marsden, J.; Ross, S. Dynamical Systems, the Three-Body Problem and Space Mission Design; Available online: https://ross.aoe.vt.edu/books/ (accessed on 9 July 2024).
- Tsander, F.A.; Korneev, L. Problems of Flight by Jet Propulsion: Interplanetary Flights: Collection of Articles; Israel Program for Scientific Translations: Jerusalem, Israel, 1964. [Google Scholar]
- Negri, R.B.; de Alme Prado, A.F.B. A historical review of the theory of gravity-assists in the pre-spaceflight era. J. Braz. Soc. Mech. Sci. Eng. 2020, 42, 406. [Google Scholar] [CrossRef]
- Minovitch, M. Alternative Method for Determination of Elliptic and Hyperbolic Trajectories; Jet Propulsion Laboratory, Techincal Memo: Pasadena, CA, USA, 1961; pp. 118–312. [Google Scholar]
- Battin, R.H. The determination of round-trip planetary reconnaissance trajectories. J. Aerosp. Sci. 1959, 26, 545–567. [Google Scholar] [CrossRef]
- Minovitch, M.A. The invention that opened the solar system to exploration. Planet. Space Sci. 2010, 58, 885–892. [Google Scholar] [CrossRef]
- Broucke, R.A. The celestial mechanics of gravity assist. In Proceedings of the Astrodynamics Conference, Minneapolis, MN, USA, 15–17 August 1988; American Institute of Aeronautics and Astronautics Inc., AIAA: Reston, VA, USA, 1988; pp. 69–78. [Google Scholar] [CrossRef]
- Strange, N.J.; Longuski, J.M. Graphical method for gravity-assist trajectory design. J. Spacecr. Rocket. 2002, 39, 9–16. [Google Scholar] [CrossRef]
- Greenberg, R.; Carusi, A.; Valsecchi, G.B. Outcomes of Planetary Close Encounters: A Systematic Comparison of Methodologies. ICARUS 1988, 75, 1–29. [Google Scholar] [CrossRef]
- Ferreira, A.; de Moraes, R.; Prado, A.F.B.d.A.; Winter, O.; Gomes, V. A survey on extensions of the pure gravity swing-by maneuver. Rev. Mex. De Astron. Y Astrofísica 2021, 57, 445–457. [Google Scholar] [CrossRef]
- Szebehely, V. Theory of Orbits. The Restricted Problem of Three Bodies; Academic Press: New York, NY, USA, 1967. [Google Scholar]
- Campagnola, S.; Russell, R.P. Endgame problem part 2: Multibody technique and the Tisserand-Poincare graph. J. Guid. Control. Dyn. 2010, 33, 476–486. [Google Scholar] [CrossRef]
- Qi, Y.; de Ruiter, A. Energy analysis in the elliptic restricted three-body problem. Mon. Not. R. Astron. Soc. 2018, 478, 1392–1402. [Google Scholar] [CrossRef]
- Ferreira, A.F.; Prado, A.F.; Winter, O.C.; Santos, D.P. Analytical study of the swing-by maneuver in an elliptical system. Astrophys. Space Sci. 2018, 363, 24. [Google Scholar] [CrossRef]
- Ross, S.; Scheeres, D. Multiple Gravity Assists, Capture, and Escape in the Restricted Three-Body Problem. SIAM J. Appl. Dyn. Syst. 2007, 6, 576–596. [Google Scholar] [CrossRef]
- Alessi, E.M.; Sánchez, J.P. Semi-analytical approach for distant encounters in the spatial circular restricted three-body problem. J. Guid. Control. Dyn. 2016, 39, 351–359. [Google Scholar] [CrossRef]
- Neves, R.; Sánchez, J.; Colombo, C.; Alessi, E. Analytical and Semi-Analytical Approaches to the Third-Body Perturbation in Nearly Co-Orbital Regimes. In Proceedings of the 69th International Astronautical Congress, Bremen, Germany, 1–5 October 2018; pp. 1–10. [Google Scholar]
- Campagnola, S.; Skerritt, P.; Russell, R.P. Flybys in the planar, circular, restricted, three-body problem. Celest. Mech. Dyn. Astron. 2012, 113, 343–368. [Google Scholar] [CrossRef]
- Stronati, N.; Ceccaroni, M. A novel algorithm for autonomous astrometric mass determination of asteroids. In Proceedings of the IAC 2023 Congress Proceedings, 74th International Astronautical Congress (IAC), Baku, Azerbaijan, 2 October 2023. [Google Scholar]
- Cornelisse, J.; Scoyer, H.; Wakker, K. Rocket Propulsion and Spaceflight Dynamics; Pitman: London, UK, 1979. [Google Scholar]
- Ivashkin, V.; Lang, A. Analysis of spacecraft orbital motion around the asteroid Apophis. Dokl. Phys. 2016, 61, 288–292. [Google Scholar] [CrossRef]
- Tisserand, F. Traite de Mechanique Celeste, Tome IV (Gauthier-Villars, Paris, 1896). Available online: https://books.google.co.uk/books?id=hNjinQAACAAJ&pg=PA198&source=gbs_toc_r&cad=2#v=onepage&q&f=false (accessed on 9 July 2024).
- Bate, R.; Mueller, D.; White, J. Fundamentals of Astrodynamics; Dover Publications: Mineola, NY, USA, 2020. [Google Scholar]
- de Almeida Prado, A.F.B. An analytical description of the close approach maneuver in three dimensions. In Proceedings of the IAF, 51st International Astronautical Congress, Rio de Janeiro, Brazil, 2–6 October 2000. [Google Scholar]
- Tisserand, F. Traité de Mécanique Céleste: Exposé de L’ensemble des Théories Relatives au Mouvement de la Lune; Generic Publications: Sydney, Australia, 1894; Volume 3. [Google Scholar]
- Valsecchi, G.B.; Milani, A.; Gronchi, G.F.; Chesley, S.R. Resonant returns to close approaches: Analytical theory. Astron. Astrophys. 2003, 408, 1179–1196. [Google Scholar] [CrossRef]
- Valsecchi, A.; Manara, G. Dynamics of comets in the outer planetary region. II. Enhanced planetary masses and orbital evolutionary paths. Astron. Astrophys. 1997, 323, 986–998. [Google Scholar]
- Valsecchi, G.B.; Milani, A.; Gronchi, G.F.; Chesley, S.R. The distribution of energy perturbations at planetary close encounters. In New Developments in the Dynamics of Planetary Systems: Proceedings of the Fifth Alexander von Humboldt Colloquium on Celestial Mechanics Held in Badhofgastein (Austria), 19–25 March 2000; Springer: Dordrecht, The Netherlands, 2001; pp. 83–91. [Google Scholar]
- Valsecchi, G.; Alessi, E.; Rossi, A. An analytical solution for the swing-by problem. Celest. Mech. Dyn. Astron. 2015, 123, 151–166. [Google Scholar] [CrossRef]
- Valsecchi, G.; Froeschlé, C.; Gonczi, R. Modelling close encounters with Öpik’s theory. Planet. Space Sci. 1997, 45, 1561–1574. [Google Scholar] [CrossRef]
- Roth, E. The gaussian form of the variation-of-parameter equations formulated in equinoctial elements—Applications: Airdrag and radiation pressure. Acta Astronaut. 1985, 12, 719–730. [Google Scholar] [CrossRef]
- Battin, R.H. An Introduction to the Mathematics and Methods of Astrodynamics; Aiaa: Las Vegas, NV, USA, 1999. [Google Scholar]
- Batista Negri, R.; Prado, A.; Sukhanov, A. Studying the errors in the estimation of the variation of energy by the “patched-conics” model in the three-dimensional swing-by. Celest. Mech. Dyn. Astron. 2017, 129, 269–284. [Google Scholar] [CrossRef]
- Cavallari, I.; Grassi, C.; Gronchi, G.F.; Baù, G.; Valsecchi, G.B. A dynamical definition of the sphere of influence of the Earth. Commun. Nonlinear Sci. Numer. Simul. 2023, 119, 107091. [Google Scholar] [CrossRef]
Disclaimer/Publisher’s Note: The statements, opinions and data contained in all publications are solely those of the individual author(s) and contributor(s) and not of MDPI and/or the editor(s). MDPI and/or the editor(s) disclaim responsibility for any injury to people or property resulting from any ideas, methods, instructions or products referred to in the content. |
© 2024 by the authors. Licensee MDPI, Basel, Switzerland. This article is an open access article distributed under the terms and conditions of the Creative Commons Attribution (CC BY) license (https://creativecommons.org/licenses/by/4.0/).