Abstract
Developing wind tunnel models is time consuming, labor intensive, and expensive. Rapid prototyping for wind tunnel tests is an effective, faster, and cheaper method to obtain aerodynamic performance results while considerably reducing acquisition time and cost for the models. Generally, the rapid prototyping models suffer from insufficient stiffness or strength to withstand the loads generated during a wind tunnel test. In the present study, a rapid prototype model reinforced with metallic inserts was produced to experimentally investigate the aerodynamic characteristics of an uncrewed aerial vehicle with various wingtip deflections. The fused deposition modeling process was used to make the outer mold, whereas the metallic parts were produced using laser cutting and the computer numerical control machining process. Then, the model was evaluated both experimentally and numerically. The test campaign presented in this work was conducted in the de Havilland low-speed wind tunnel facility at the University of Glasgow. For better characterization of flow patterns dominated by leading edge vortices, numerical simulations were run using OpenFOAM 8.0 and validated with experimental data. The experimental data obtained from the hybrid rapid-prototyped model agreed well with the numerical results. This demonstrates the efficacy of hybrid rapid-prototyped models in providing reliable results for initial baseline aerodynamic database development within a short period and at a reduced cost for wind tunnel tests.
1. Introduction
Rapid prototyping (RP) technologies permit faster manufacturing of a test model using a computer-aided design (CAD) geometry with robust, accurate, and reasonable cost to support the wind tunnel testing of aircraft models. They can be applied to manufacture components with complex geometries by curing liquid material or bonding solid powder by methods such as cementation, sintering, polymerization, chemical reaction, etc. [1]. The RP model can be made of different materials, such as polymers, metals, and paper, utilizing various techniques. An overview of RP technology and its ability to shorten the product design and development process has been provided in many references [2,3]. Table 1 provides a comparison of the commonly used RP fabrication methods, which are fused deposition modeling (FDM), selective laser sintering (SLS), and stereolithography (SLA) [3]. Generally, the selection of appropriate methods for model fabrication is a complex process and requires user expertise. A systematic method for the selection of suitable RP technology using the analytic hierarchic process by considering different parameters such as environmental, product, and process requirements was provided by Lokesh and Jain [4]. They concluded that the FDM procedure received the highest grand rating point based on their evaluation.

Table 1.
Comparison of typical RP processes.
For a better understanding of the increasing applications of RP methods in aerospace engineering, Figure 1 displays the Scopus search results for the keywords “fused deposition modelling”, “stereolithography”, and “selective laser sintering” (accessed on 5 November 2022). As shown in the figure, research in all three methods has gained momentum in the last decade owing to the increased application of the RP process in various areas. It is worth mentioning that recently the FDM method has shown a relatively higher number of publications than the other two methods.
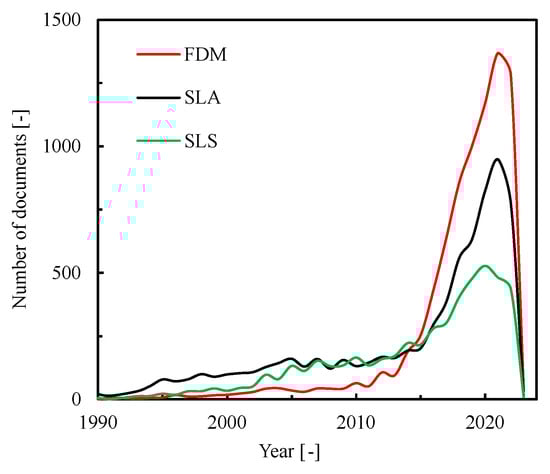
Figure 1.
The Scopus search results for the keywords FDM, SLA, and SLS.
In the FDM process, the filament is heated and passed through a nozzle to be deposited layer by layer on the build plate based on the G-code instructions. It is suitable for parts with low-volume production and finds application in various industrial uses. The FDM method involves generating a CAD model (STL file) of the physical part and the STL file is then transferred to a slicer software to slice the part into layers. Later, the sliced part is fed to the FDM machine that generates the actual part using a layer-by-layer deposition process. The FDM method is easily available, flexible, and cheaper than SLS and SLA; these advantages make it suitable for various applications such as pharmaceutical, electronic industry, automobile, aerospace, wind tunnel models, uncrewed aerial vehicles (UAVs), etc. However, the parts generated from FDM modeling suffer from a poor surface finish, which requires post-processing to improve the surface finish.
The RP method acts as a bridge between computational fluid dynamics (CFD) simulation results and experimental data for validation. It reduces the cost and time if there is any need for design changes in the model as the rectification can be performed in the earlier stages. Because of these advantages, the RP method saves production time, reduces cost, and provides acceptable model fidelity for predicting the aerodynamic results. Springer [5] evaluated the static stability aerodynamic characteristics of wing–body–tail launch vehicle models using wind tunnel testing at various Mach numbers (M = 0.3–0.5) for one model manufactured of aluminum and three other models manufactured by RP methods: FDM, SLA, and SLS. However, the RP models exhibit deformation when subjected to higher loading and they concluded that they could only be utilized for initial design analyses. Chuk and Thomson [6] explored the effectiveness of RP models used in wind tunnel studies. They classified the models based on the loading they experienced during wind tunnel tests, such as high, light, and non-structural loads. They reported that RP models are suitable for producing parts that experience non-structural loads, whereas computer numerical control (CNC) methods are suitable for parts experiencing higher structural loads. Landrum et al. [7] experimentally investigated two photopolymer airfoil models fabricated by SLA and one cast polyurethane airfoil model in a low-speed wind tunnel. The cast and RP models had equal manufacturing timelines and dimensional tolerances. In contrast, the drag of the RP models was roughly half of what was reported for the conventional cast form, as the rough surface of RP eliminated the laminar separation bubbles.
In hybrid RP models, reinforced internal metallic structures can be used to strengthen the model to withstand wind tunnel structural loads [8,9,10]. Heyes and Smith [10] proposed models with honeycomb internal structures to reduce the weight while preserving the structural strength. Also, they recommended aerosol paint and hand-finishing to improve the surface finish of the FDM model, which is relatively coarser than when using the SLA method. Tyler et al. [11] reported various considerations that must be taken care of while adapting the hybrid model, such as reducing wing deflection, using the appropriate RP method for the model, placement of measuring instruments, etc. Zhou et al. [12] electrochemically deposited nickel on an SLA airfoil model to improve its structural properties. Although the hybrid model improved its overall strength, their model required additional treatments to strengthen the interface adhesion between the metal and the SLA parts. Daneshmand et al. [13] experimentally investigated the wing–body–tail model developed using the FDM process with and without chromium coating for subsonic wind tunnel testing. They compared these two models with a traditional steel model and reported that the FDM model without coating produced unsatisfactory results due to increased surface roughness. In contrast, the FDM model with chromium coating had accurate results comparable to the conventional steel model. Yang et al. [14] reinforced the photopolymer resin material with an internal metallic structure to reduce the weight and avoid the resonance phenomenon. They reported that the RP models suffered from deformation at a higher speed, particularly the thin regions such as the wing tip, which resulted in variations in the wind tunnel results. Wang et al. [15] investigated a hybrid SLA aeroelastic model reinforced with a metal frame to improve its stiffness, at M ranging from 0.4 to 0.65. They reported that the hybrid model offered various advantages compared to the conventional model, such as improved structural rigidity, and reduced cost and timings. Panayotov et al. [16] successfully performed wind tunnel experiments for a canard fixed-wing UAV manufactured using an FDM 3D printer and studied its aircraft performance. Klippstein et al. [17] summarized that the FDM process was suitable for the development of high-performance UAV models and they could be employed to generate compact, high-strength structures with reduced weight. The geometric and structural quality of a generic delta wing model fabricated using the FDM method with polylactide (PLA) material was studied by Moioli et al. [18]. They reported a better match between the experiment and CFD results and established the fidelity of the FDM technique. Furthermore, they reported that the FDM models were suitable for the wind tunnel testing of low-speed fully turbulent flow problems and proposed a hybrid RP model as future work [18]. Ramirez et al. [19] experimentally investigated the aerodynamic performance of two wing models, made by the FDM method and conventional milling. They used the FDM process to produce riblets and studied their effect on drag reduction. They concluded that the FDM process offered both structural and aerodynamic advantages for the manufacturing and testing of small UAV models. Szwedziak et al. [20] experimentally investigated the M-346 aircraft in a wind tunnel using a model produced with the FDM process and they reported that the FDM model produced acceptable results.
From the above literature review, it can be concluded that the RP-based wind tunnel models offer various advantages compared to the conventional models, such as manufacturability of complex structures, lower weight, and reduced fabrication time and cost. Apart from the above-mentioned advantages, the RP models are highly versatile. They have been successfully used to generate test models for various applications, such as launch vehicles, fixed-wing aircraft, and UAVs. In the present work, the FDM method with PLA material is used to produce the aerodynamic shape of a UAV model. The metal core is used to improve the structural integrity while retaining the benefits of the RP wind tunnel model.
This work investigates the low-subsonic aerodynamic characteristics of a cranked lambda wing UAV planform, which is less seen in the literature, particularly for weaponized flying wing versions such as the X-47B planform [21], which is designed to perform in the complex flow conditions of aircraft carrier-based operations [22,23]. It offers various advantages such as lower observability, higher lift-to-drag ratio, and ability to sustain higher g-loads than piloted fighter aircraft. The selected planform incorporates a wing-body concept and a swept constant chord section for the inboard and outboard sections, respectively. This combines the aerodynamic advantages of a non-slender leading edge (LE) (sweep angle ≤ 55°) and slender LE ( > 55°) wing models [24]. The wings with different LE sweeps produce multiple LE vortices that interact with each other and enhance the aerodynamic performance compared to single LE vortices [25]. However, this configuration exhibits challenging aerodynamic behavior due to a complex nonlinear flowfield, such as mixed attached/separated flow, multiple interacting vortices, and vortex breakdown, which affects the aerodynamic stability and control significantly [25,26]. Hence, an elaborate aerodynamic performance investigation of this configuration is required to understand the generated complex vortical flow structures. On the other hand, low-speed aerodynamic characteristics of the swept wings are critical for take-off and landing regimes where tip separation occurs. The tip separation adversely affects the pitching moment, thereby reducing the aircraft’s stability and control [27]. To overcome this issue, various passive and active flow control methods are used [27]. In the present study, the planar and nonplanar concept (wingtip deflections) with smooth wingtip deflections, to avoid surface gaps on the present cranked lambda UAV model, was investigated within the framework of the NATO AVT-SP-002 project titled “Turbulence and the Aerodynamic Optimization of Nonplanar Lifting Systems” in collaboration with the University of Glasgow and Istanbul Technical University. The wingtip deflections indicate a planar configuration for 0° deflection and nonplanar configurations for downward and upward deflections of −30° and +30°, respectively (Figure 2). Low-speed wind tunnel tests of the models are conducted to evaluate aerodynamic loads, and the tuft flow visualization method is used to capture the instantaneous flow pattern. Furthermore, aerodynamic characteristics and flow features are also obtained numerically from OpenFOAM 8.0 to provide a comparison with experimental data and aid in detailed flow visualization.
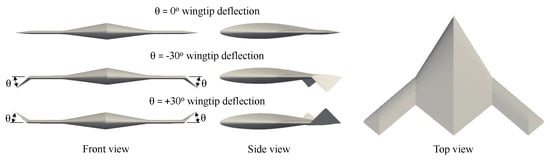
Figure 2.
UAV model with various wingtip deflections.
2. Model Description
The hybrid UAV model comprises two main parts, the outer mold line made from PLA and a steel core to strengthen the model for wind tunnel testing, as seen in Figure 3. The geometrical specifications of the UAV model are provided in Table 2 [28]. The wind tunnel model should be strong enough to withstand the aerodynamic loads generated due to the incoming airflow. The resultant lift and drag forces act normal to and along the airflow, respectively. They depend on the pressure distribution of the model corresponding to the angle of attack (AOA). The drag forces increase significantly after the critical AOA due to the stall condition. The common types of stresses experienced by the wind tunnel model are tension, compression, shear, bending, and torsion. Moreover, the model must be structurally rigid to retain its aerodynamic shape, even under extreme loading, to obtain satisfactory results.
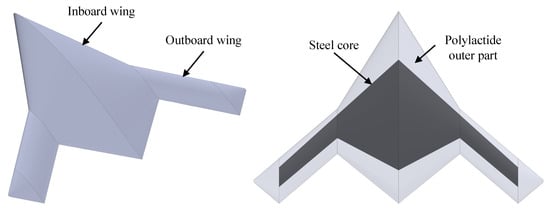
Figure 3.
CAD model (left) and hybrid RP design of UAV wind tunnel model (right).
Table 2.
Geometrical specifications.
3. Production Methodology
Various factors such as model dimension, structural rigidity, attachment provisions, and part design need to be considered when designing and manufacturing an RP model for wind tunnel testing. The RP method is suitable for the generation of complex geometries, such as aircraft models that are expensive and difficult to produce with conventional machining. Moreover, the lower density of RP materials makes the model much lighter than comparable metallic models. As a result, more sensitive force balances are used to enhance the data fidelity and reduce model vibrations during testing. Although the hollow RP model reduces the overall weight, it exhibits relatively lower strength to withstand the wind tunnel forces compared to the metallic models. The strength of RP materials depends on the build direction, and it is significantly lower along the normal direction of the layer (z-axis) compared to the build plane (x–y plane). Consequently, the RP model may be deflected and distorted due to higher aerodynamic loads at an increased AOA, which adversely affects the fidelity of the experimental measurements. Hence, the RP model is reinforced with 5 mm thick steel (ASTM 4340) flat plate inserts to enhance its structural rigidity. The steel plate inserts are easy to produce and less expensive. They are secured to the RP model using small screws. The common materials used in the FDM technique are solid thermoplastic polymer filaments such as acrylonitrile butadiene styrene (ABS), and PLA, which are fed from a spool towards the working head. The PLA material is perfect for 3D printing because it has relatively less shrinkage, a glass transition temperature of 60 °C, and a Young’s modulus higher than ABS. However, not every designed 3D model prints equally well. The parts ideal for 3D printing should have a flat bottom to adhere well to the printing bed; they should not have overhangs greater than 70°, and ideally should have solid or closed loop cross-sections at every layer height. The characteristics of the materials used for the model are shown in Table 3.
Table 3.
Mechanical characteristics of PLA and ASTM 4340.
The conventional manufacturing methods laser cutting and CNC machining were used to produce the steel plate and the adapter and its connection to the model, respectively. In contrast, the FDM method produced the outer mold (Figure 4).
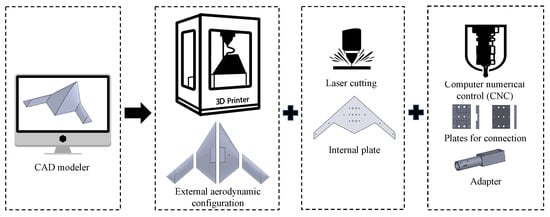
Figure 4.
Various processes used for the model production.
Figure 5 shows the various steps involved in the FDM process. Firstly, the CAD model to be 3D printed was generated using a CAD modeler and then exported as STL files. The STL files represent the CAD model as a triangulated surface and they require higher resolution (increased number of triangles) for accurate surface approximation. However, increasing the resolution of STL files increases the file size and processing time. The STL files were sliced with an open-source slicing software (PrusaSlicer 2.4.2 [30]), which was used to manipulate the 3D model and produce 2D horizontal slices with a thickness of 0.6 mm, as shown in Figure 6. The slicing step transforms the geometric information of the 3D model into the machine language G-code (PrusaSlicer G-code [30]) that contains instructions for the printer. The G-code loaded into the printer allows the printer head movement to be encoded in the X, Y, and Z directions to position the printhead during printing. The machine parameters affecting the printing quality are the nozzle temperature, diameter, bed temperature, filament type, size, and the build printed volume shape. The slicing software parameters such as model position, support structure, raster angle, width, layer height, and build orientations affect the built part quality. The build orientation dictates the tensile strength and time to make the 3D-printed model. Moreover, the support structures are the expendable parts created to enhance the performance and build quality of the printed model. During printing, they help to overcome difficulties such as overhang, internal cavities, thin-wall sections, etc.
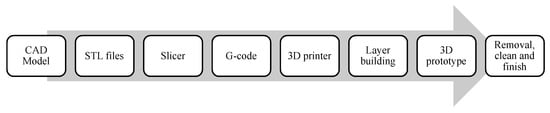
Figure 5.
Workflow of the FDM process.
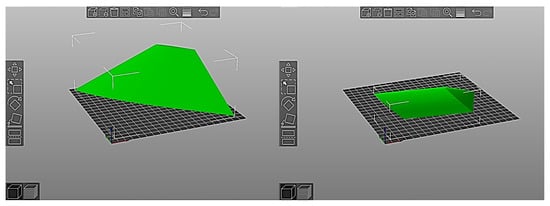
Figure 6.
3D model manipulation using PrusaSlicer.
An Anycubic Chiron 3D printer with a Cartesian coordinate system was used, with a maximum part size of 400 mm × 400 mm × 350 mm, and the printing was performed with a 0.6 mm diameter nozzle (Figure 7). The machine drive wheel pulls the PLA filament roll (solid thin-filament raw material–thermoplastic polymers), extrudes it through a heat-controlled nozzle head to reach a semi-liquid state, and deposits it on the heat bed or a layer that is previously printed, where it solidifies at room temperature after printing. After the layer is built, the platform on which the component is mounted drops as the working head continues to deposit material to create the next layer. The next extruded layer will fuse with the bottom layer and continue to fuse until the required dimensions of the design model are obtained. The thermoplasticity influences the ability of the filament to bond layers during the printing and solidification processes. The equipment deposits semi-melted thermoplastic in a directional way that results in parts with anisotropic behavior. The advantage of using the FDM process is that it is clean, environmentally friendly, and simple to use.
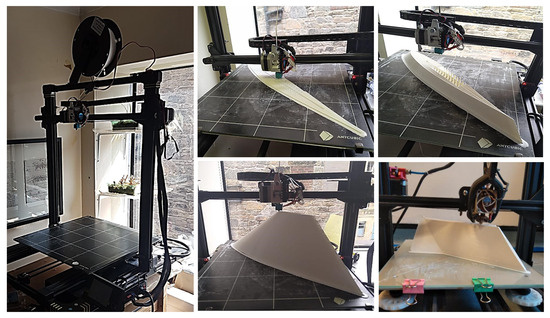
Figure 7.
Model parts production using 3D printing.
Lastly, the printed 3D parts are completed, and the bed temperature is decreased. Later, the support structures and the printed 3D parts are removed from the bed of the 3D printer. The printed model parts undergo post-processing, such as sanding, sealing, gap filling, polishing, and painting (Figure 8). Epoxy resin is used to seal and fill the gaps created in the printed parts after dissolving supports or sanding process. Sanding is performed to smooth the part and remove visible layer lines and any noticeable blemishes, such as blobs or bumpy areas resulting from support marks. The print quality and layer height determine the suitable sandpaper grit grade and generally, the sanding process starts with a coarser sandpaper and finishes with a finer one to achieve a better surface finish. For the present model, sanding began with a low grade from 100 to 300 grit sandpaper to smooth out striations and support structure remnants, large bumps, and blemishes. Once layering and striations were less prevalent, sanding was performed with a finer grit of 400 to 600 to achieve a smooth surface ready for painting. After applying all the paint layers, the model was polished with polishing paper.
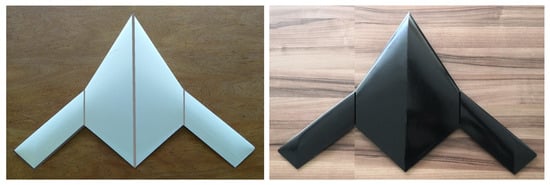
Figure 8.
3D-printed model (left) and surface finished and painted model (right).
4. Experimental Methodology
4.1. Wind Tunnel Facility
The present experimental investigation was performed to obtain the aerodynamic characteristics of a UAV model. The aerodynamic load measurements and the tuft flow visualization tests were conducted in the de Havilland low-speed wind tunnel facility at the University of Glasgow (Figure 9) [31]. It is a closed -return atmospheric low-speed wind tunnel with a maximum speed and Reynolds number (Re) of 70 m/s and 4 × , respectively. The inlet turbulence intensity of the wind tunnel is less than 1%. The full test model can be mounted on a sting that adjusts the incidence and roll angle, whereas the turntable adjusts the yaw angle (Figure 10). Moreover, for the half model, the turntable yaw controls the incidence angle. The wind tunnel can be operated and remotely controlled from the control room. It has a filleted octagonal cross-section with a contraction ratio of 5:1, which increases from inlet to outlet. The octagonal cross-section offers various advantages such as a thinner boundary layer, reduced pressure loss across the contraction, and more uniform axial velocity distribution compared to other shapes, such as circular and square cross-sections [32,33]. The dimensions of the tunnel test section are 2.65 m × 2.1 m × 5.4 m and a platform of 6-axes load cells is located underneath the test section. Figure 11 shows the model installation in the wind tunnel test section.
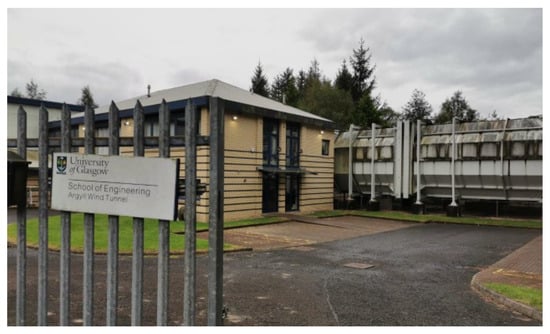
Figure 9.
The de Havilland low-speed wind tunnel.
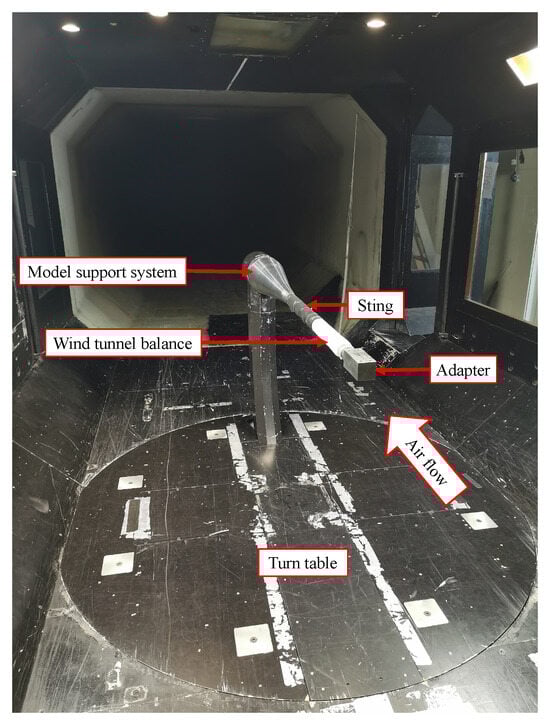
Figure 10.
Sting support system.
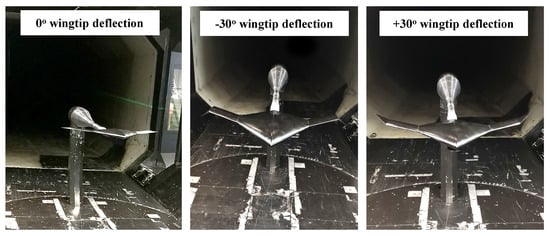
Figure 11.
UAV model with various wingtip configurations installed in wind tunnel test section.
4.2. Test Conditions
The experimental test was conducted on the UAV model for the flow range of 0–40° AOA with data being recorded every 5°. The tunnel speed was set at 30 m/s for the balance measurements with an Re of 5.78 × 10⁵ based on the model mean aerodynamic chord. The average air temperature and atmospheric pressure were 20 °C and 1.125 × 10⁵ N/m2, respectively.
4.3. Data Acquisition and Corrections
The aerodynamic forces and moments were used to evaluate the aerodynamic performance of the UAV model. During testing, airspeed and AOA were manually provided as inputs. Later, the data acquisition software was operated, and the airspeed, AOA, and model in the tunnel were monitored. The blockage ratio of the test model frontal area to the wind tunnel’s cross-sectional area should lie between 1 and to reduce the effect of the model blockage [34]. In the present work, the maximum blockage ratio of the model was 9.3% at a 40° AOA.
In the present test, the model’s center of gravity was not located on the balance moment center, and the model weight affected the internal force balance components during the model rotation; hence, weight tare correction was required to improve the final accuracy of the obtained experimental results. The weight tare measurements were taken using corresponding wind-off data with closed doors for the entire AOA range. Then, the forces and moments were collected using corresponding wind-on data. The weight tare values were subtracted from the balance data, and the balance forces and moments were transferred to the required center of gravity location on the model. The forces measured by the six-component force balance were in the body-axis frame of reference and converted into the stability-axis frame of reference. Furthermore, the aerodynamic loads were nondimensionalized to obtain the lift, drag, and pitching moment coefficients.
4.4. Tuft Flow Visualization
The procedure outlined above was duplicated for the flow visualization experiments, except that the data acquisition system operator served as the camera operator rather than recording balance data. The tufts were placed at certain spanwise positions on the suction surface (SS) of the wing [35,36,37], using adhesives such as clear glue and tape, and firmly secured so as not to be blown off the model (Figure 12). It should be noted that the tape attained a balance between adhesive strength and thickness. It was strong enough to stay on during wind tunnel tests and thin enough not to change the wing’s surface drastically. The material used for the tufts was neon orange sewing thread and the tufts were cut to an appropriate length so as not to affect the flow.
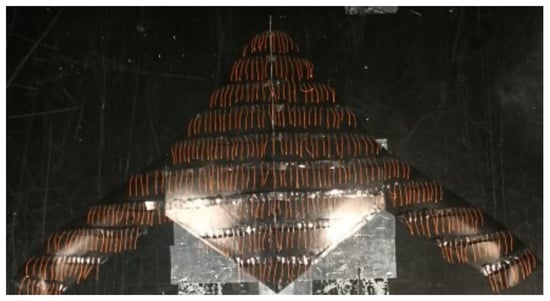
Figure 12.
Tufts stuck onto the model surface.
5. Computational Methodology
5.1. Flow Domain and Grid
The flow domain to investigate the aerodynamic characteristics of the UAV wing models was developed identically to the wind tunnel test section (Figure 13). The water-tight geometry of the full flow domain was developed using a 3D CAD modeler and exported to Salome for pre-processing. The splitting and grouping of surfaces were performed using Salome, and the STL files were exported as input for the . The generates body-fitted Cartesian mesh that is cut off from a background mesh generated from [38]. Additional edge and surface refinements were provided to capture the wing model’s curvature. A box refinement was also specified to resolve the wake behind the wing model.
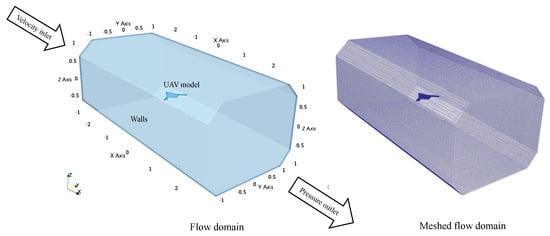
Figure 13.
3D view of the computational flow domain and the meshed flow domain.
Resolving near-wall physics is essential to predict the lift and drag values accurately. Hence, ten prism layers were grown on the wing surface with a layer growth ratio of 1.05. Lastly, checks were completed to ensure that the wall y+ value was maintained at less than one (Figure 14) and that critical parameters such as skewness, aspect ratio, non-orthogonality, etc., were within acceptable limits.
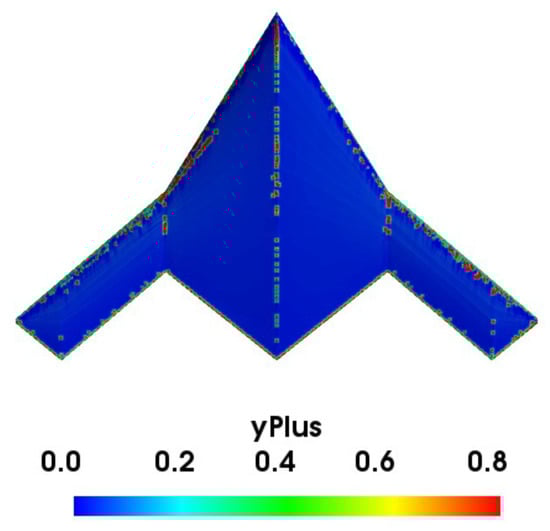
Figure 14.
SS y+ distribution of the model.
5.2. Solver, Turbulence Model Selection, and Boundary Conditions
OpenFOAM 8.0 [38] was used to perform numerical simulations to determine the aerodynamic characteristics of the UAV models. OpenFOAM provides various solvers, and due to the assumption of steady and incompressible flow in the present problem, the SimpleFoam solver was chosen. For the turbulence closure, the two-equation k– shear stress transport (SST) model was selected. Second-order accurate schemes were applied for the spatial discretization. The residual convergence criteria were set to 10−6. The pressure was under-relaxed by a value of 0.3, whereas all other variables were under-relaxed by a value of 0.7 to improve the convergence of the simulation.
Regarding the boundary conditions, the wing model was kept as a no-slip wall, while the farfield walls were placed away from the wing model and provided with a slip wall condition. The flow was analyzed around the model by providing a uniform axial velocity of 30 m/s at the inlet, and a zero-pressure gradient at the outlet. Additionally, the AOA was varied from 0 to 40° with a step of 5°.
6. Results and Discussion
6.1. Aerodynamic Performance from Experiments
The effect of nonplanar wingtip deflection on the aerodynamic characteristics of the UAV model was analyzed using various parameters such as coefficients of lift (), drag (), reduced drag (), pitching moment (), and the lift–drag ratio (/) (Figure 15). As evident in the plot, the lift increases nonlinearly with the AOA, and then stall occurs at a critical AOA (Figure 15a). The () slope decreases with the AOA due to the occurrence of flow separation for an AOA ≥ 10°. However, the total lift increases due to the contribution of the inboard lift in the attached flow area till the stall point. It was found that the nonplanar-wingtip-deflected cases exhibited advanced stall (AOA = 30°) compared to the planar model (AOA = 35°). Moreover, the relative peak ’s for the −30° and +30° nonplanar models were reduced by 4.96 and 2.81 %, respectively.
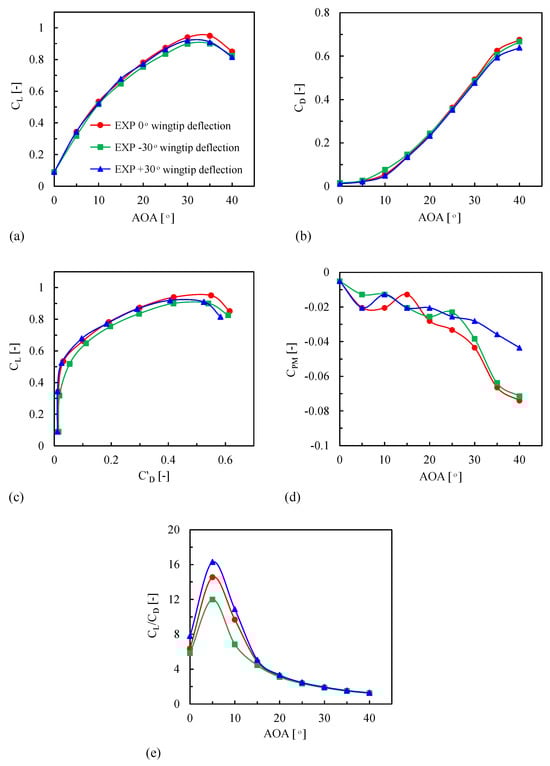
Figure 15.
Aerodynamic characteristics of the UAV model from wind tunnel test.
Figure 15b displays the variation in against AOA for the three models. The drag increases with the AOA for all models. The −30°-wingtip-deflection model exhibits higher drag at a 10° AOA due to flow separation. Moreover, the −30°- and +30°-wingtip-deflection models reduced the relative average by 0.16 and 4.27%, respectively, compared to the planar model.
Figure 15c illustrates the variations in with for the three configurations. The provides the drag obtained by eliminating a common contribution of the vortex drag from the curves. It is given by the expression below [39].
The increase in is more prominent for the −30°-wingtip-deflection model compared to other cases, where values greater than 0.3 are associated with increased flow separation. Furthermore, all models show increased for greater than 0.51 due to flow separation. It is noteworthy to mention that the −30°-wingtip-deflection model shows higher averaged compared to other models.
The variation in the forces with an increase in AOA affects the , which influences the stability of the UAV model (Figure 15d). The is very sensitive to minor changes in the forces and can be used to infer the tip-stall inception. A negative and a positive slope signify stable and unstable regions, respectively. The unstable phenomenon is also known as a pitch-up or -break condition. As shown in the figure, the pitch break occurs at a 5° AOA for all cases due to the onset of tip stall. For the planar configuration, the increases up to a 15° AOA and then decreases with an increase in AOA. The of the −30°-wingtip-deflection model exhibits an oscillatory behavior till a 25° AOA and then drops rapidly. A similar behavior is seen for the +30°-wingtip-deflection model. Moreover, after a 20° AOA, the decreases as the AOA increases.
Lastly, the / comparison for different models is shown in (Figure 15e). The overall trend remains the same for all cases; however, the peak value of / shows significant change. The −30°-wingtip-deflection model shows reduced / for AOA < 20° compared to the planar model. In contrast, the +30°-wingtip-deflection model enhanced the / for AOA < 15°. Moreover, the peak / is reduced by 17.5% and improved by 12.1% for the −30°- and +30°-wingtip-deflection models, respectively, compared to the planar model.
6.2. Tuft Flow Visualization
The recorded view of tufts motion during wind tunnel testing provides information regarding boundary layer separation and reattachment over the wing model with +30° wingtip deflection. However, the tufts flow visualization has its own limitations. It cannot give flow information far away from the wall, and its constant motion during the test makes it difficult to obtain detailed flow characteristics. In the present work, the tufts were observed at selected moderate-to-high AOAs (10°, 15°, and 20°). When the wind is turned on, the tufts over the model point towards the flow direction. The orientation of tufts with respect to the freestream flow indicates flow characteristics such as flow attachment and separation regions.
Photos and videos recorded during the wind tunnel tests were also taken for analysis and comparison, as shown in Figure 16. At AOA = 10°, the tufts are uniform and oriented along the flow direction as there is no separation over the inboard and outboard wings. However, an unsteady and erratic motion of the tufts indicates regions of flow separation over the trailing edge (TE) of the outboard wing. Conversely, at AOA = 15°, the tufts experience higher fluctuations due to flow separation over the outboard wing, whereas the flow is still attached over the inboard wing. Furthermore, for a higher AOA (=20°), the tufts located in the outboard wing experience severe fluctuation due to flow separation, and this extends toward the inboard wing, which is shown by tuft oscillation near the kink region. The green and yellow dashed lines overlaying the images indicate the areas of the attached and separated flow, respectively.
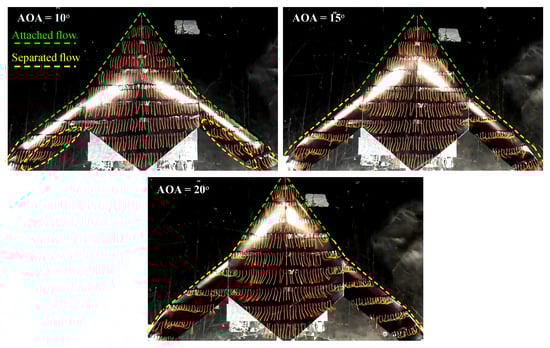
Figure 16.
Tuft flow pattern on model with +30° wingtip deflection at various AOAs.
6.3. Grid Refinement Study and Validation
An assessment based on the grid convergence index (GCI) was provided to quantify the error due to numerical discretization. The GCI provides the deviation between the current and the asymptotic solution. A lower GCI value indicates that the numerical solution lies within the asymptotic range, and the results will not change significantly with further refinement of the grid resolution. To determine the GCI, three grids with different resolutions, such as fine (16.78 million), medium (7.11 million), and coarse (2.98 million) were considered at a 20° AOA and the was chosen as the performance parameter of interest. As suggested in the literature [40], a grid refinement factor greater than 1.3 was used in this study. As shown in Table 4, the GCI value reduces with increased grid resolution. Since the GCI value for the coarse and medium grid is less than 1%, we can conclude that spatial convergence has been achieved. Hence, the medium grid with 7.11 million cells was retained for all the simulations in the present study to minimize the computational cost.
Table 4.
Numerical uncertainty assessment.
A comparison of the experiment and numerical results of the planar configuration is shown in Figure 17. The versus plots for the three different models were chosen for the validation. As shown in the figure, the experimental data show a significant match with the numerical results for all three models. This demonstrates the capability of the hybrid RP wind tunnel model to predict the UAV aerodynamic performance with satisfactory accuracy.
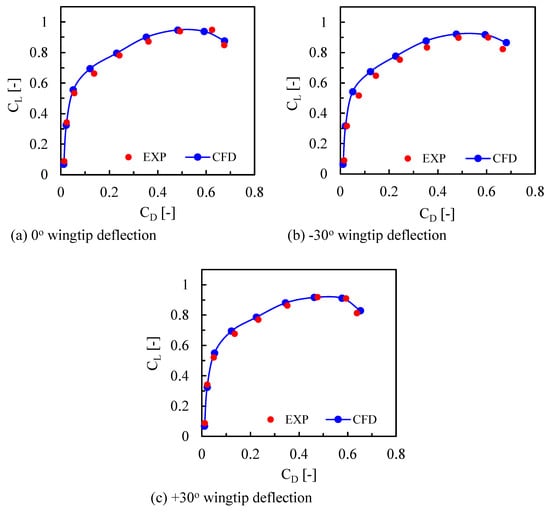
Figure 17.
Validation of CFD with experimental data.
6.4. Flowfield Analyses
Surface pressure distributions were computed at different spanwise locations along the non-dimensional chordwise distance. Comparisons of the wing model pressure coefficient () distribution of planar (0° wingtip deflection) and nonplanar (−30° and +30° wingtip deflections) configurations at three spanwise stations (Figure 18) for selected moderate-to-high AOA values (10°, 15°, and 20°) are presented in Figure 19. A similar pressure distribution is observed for both planar and nonplanar UAV wing configurations at station Y = 0.50b for various AOAs. Furthermore, a small increase in the suction pressure occurs with an increase in the AOA for all models. At station Y = 0.686b, for a 10° AOA, a higher suction is visible, and with an increase in AOA (=15°), the curve area that signifies the lift force increases for all cases. However, with a further rise in AOA (=20°), a reduction in suction pressure is visible for all cases due to flow separation. The distribution for station Y = 0.877b provides the flow behavior near the tip region. The pressure on the LE of the pressure surface (PS) is higher for the −30°-wingtip-deflection model than the 0°- and the +30°-wingtip-deflection cases. Furthermore, an increased AOA reduces the LE suction due to increased flow separation for all cases. It is found that the 0° and −30°-wingtip-deflection models exhibit higher and lower LE suction pressure, respectively, for all AOAs. Moreover, the curve area of the +30°-wingtip-deflection model is less than that of the other configurations. Further comparisons of streamlines colored by velocity magnitude are shown in Figure 20, Figure 21, Figure 22, Figure 23, Figure 24 and Figure 25.
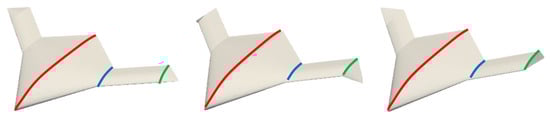
Figure 18.
Location of spanwise slices for the model with various wingtip deflections.
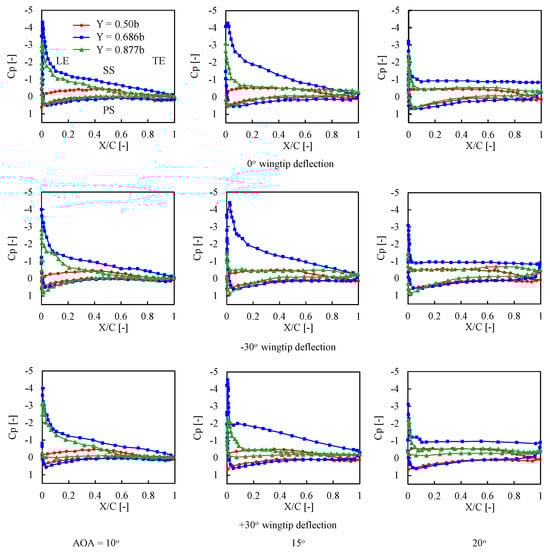
Figure 19.
distribution at different spanwise locations for various wingtip deflections and AOAs.
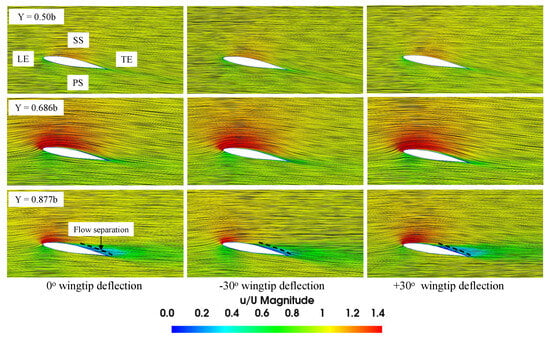
Figure 20.
Streamlines colored by velocity magnitude at different spanwise locations for 10° AOA.
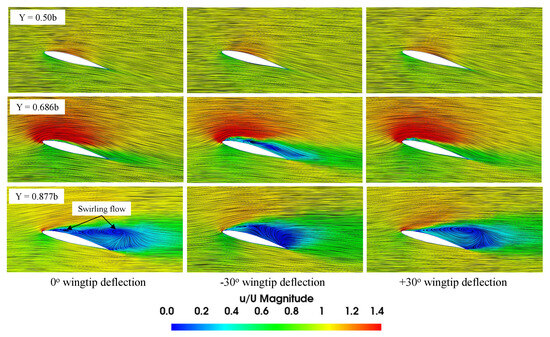
Figure 21.
Streamlines colored by velocity magnitude at different spanwise locations for 15° AOA.
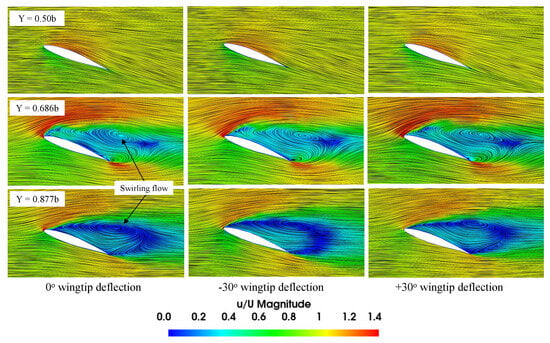
Figure 22.
Streamlines colored by velocity magnitude at different spanwise locations for 20° AOA.
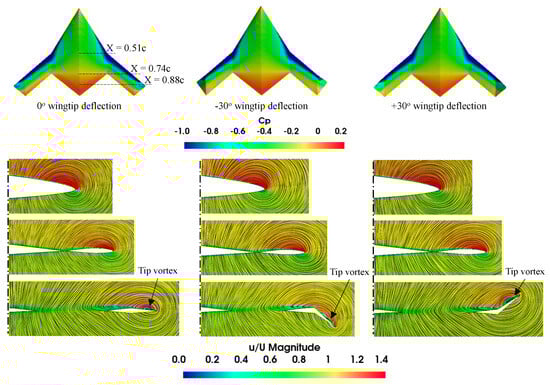
Figure 23.
Streamlines colored by velocity magnitude at different chordwise locations for 10° AOA.
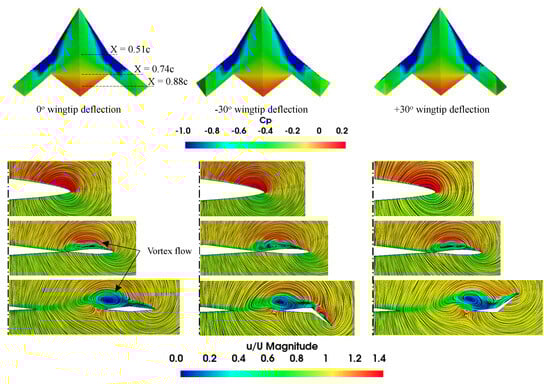
Figure 24.
Streamlines colored by velocity magnitude at different chordwise locations for 15° AOA.
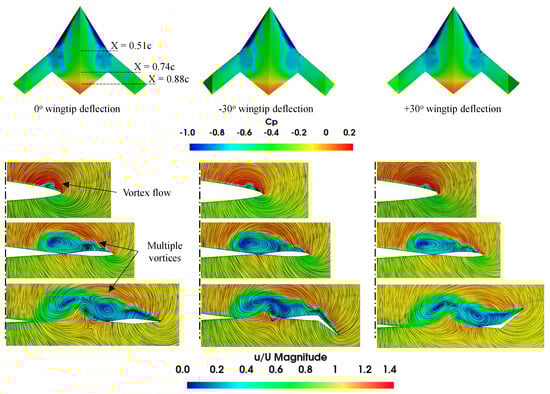
Figure 25.
Streamlines colored by velocity magnitude at different chordwise locations for 20° AOA.
Figure 20, Figure 21 and Figure 22 illustrate streamlines colored by velocity magnitude at different spanwise stations for all models. At a 10° AOA and spanwise sections 0.5b and 0.686b, streamlines show attached flow with a minimum disturbance at the TE for all cases. However, flow separation is visible on the wingtip section (0.877b) for all models. At a 15° AOA, the streamlines illustrate smooth and regular flow patterns at the symmetry plane (0.5b) for the three configurations. However, streamlines demonstrate disturbed flow patterns at the 0.686b section, which is more apparent with the −30°-wingtip-deflection case. Moreover, the flow separation from the wingtip results in swirling formations at 0.877b for all cases. With a further increase in AOA (=20°), the flow separation region expands, and a large part of the separation vortex moves away from the model’s chord to the wake at the 0.686b and 0.877b sections for all models.
Figure 23, Figure 24 and Figure 25 show streamlines colored by velocity magnitude at different chordwise stations for various wingtip-deflection models at different AOAs. Multiple vortices are visible from the lower velocity pockets located on the SS of the model. At a 10° AOA, the results at chordwise stations show attached flow; however, a small tip vortex that is associated with wingtip separation is visible for all cases. At a 15° AOA, attached flow is observed near the LE at 0.51. Multiple vortices can be noticed on wingtip and further outboard sections. The flow separates from the LE, generating expanding vortices as they move downstream. As the AOA increases (=20°), a small vortex further inboard is observed at 0.51, and larger vortices are seen at 0.74 and 0.88 sections.
In the flying wing UAV models, it is critical to understand the phenomena of vortex generation on the SS. The center of the rolled-up vortex, the vortex core, exhibits low pressure and contributes to the lifting force on the UAV wing model. Higher lift force occurs due to the stronger formation of the vortex core. However, under specific circumstances, the vortex core deteriorates until it breaks down; at this point, the lift force starts to reduce and eventually vanishes. The vortex core condition was analyzed and characterized according to the pressure distribution and velocity throughout the vortex core. The vortex flow was visualized using with wall-shear streamlines and iso-surface of the Q-criterion to describe the vortex flow characteristics such as vortex evolution, attachment, separation, and vortex breakdown over the SS of the wing model.
Figure 26, Figure 27 and Figure 28 show the flow topology change using the distribution and wall-shear streamlines on the upper surface of the model at various moderate-to-high AOAs. At a 10° AOA, there are higher suction regions on the LE, with a moderate degree of suction at the mid-outboard and the central part of the wing. Also, the wing TE exhibits higher pressure. At a 15° AOA, the suction pressure region shifts to the inboard section while most outboard sections experience stall. The outboard vortex moves inward, whereas the inboard vortex shifts outward, and their interaction increases with the increase in AOA due to the growth in their sizes and strengths. The vortices lose intensity as they move downstream towards the TE, and as a result, the suction is higher at the apex region and decreases along the chordwise direction. The suction pressure and the outboard vortex strength reduce, and the vortex breaks down for AOAs higher than 15°. In contrast, the suction and inboard vortex strength increase, breaking down at AOAs greater than 25°.
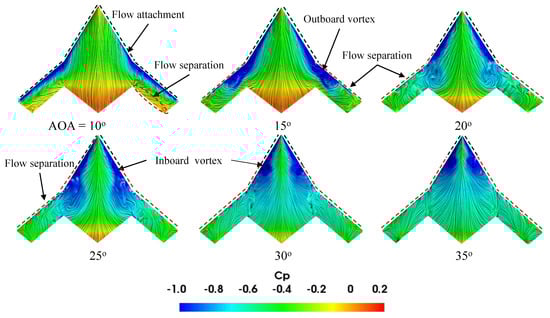
Figure 26.
distribution with wall-shear streamlines for 0° wingtip deflection at various AOAs.
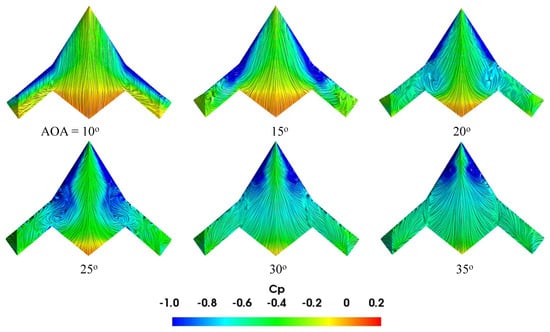
Figure 27.
distribution with wall-shear streamlines for −30° wingtip deflection at various AOAs.
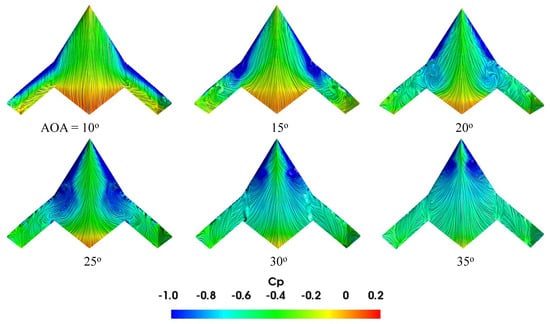
Figure 28.
distribution with wall-shear streamlines for +30° wingtip deflection at various AOAs.
Since complex vortex flow structures form over the model SS, it is necessary to visualize the three-dimensional flow field to provide a better understanding of the flowfield and the vortical flow behavior. The Q-criterion iso-surface was used to visualize the vortical flow structures. Figure 29, Figure 30 and Figure 31 present the Q-criterion colored by non-dimensionalized velocity, showing the vortex body, regions, and separating from a shear layer over the wing model. At a 10° AOA, the iso-surface reveals a higher velocity magnitude near the LE. With a rise in the AOA, the outboard LE vortices separate from the LE and shift downstream. The outboard vortex formation is visible at 15° along the outboard wing. As the AOA increases, the vortex breakdown location moves toward the wing front, and this phenomenon is visible up to 35°.
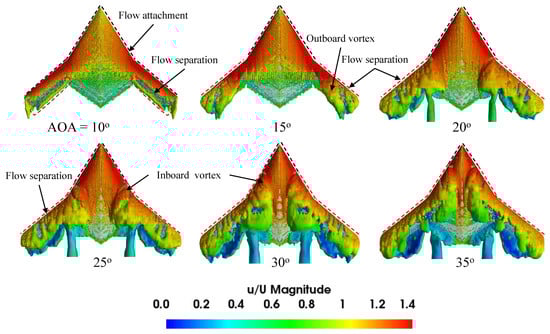
Figure 29.
The iso-surface of Q-criterion (=35,000 s−2) colored by velocity magnitude for 0° wingtip deflection at various AOAs.
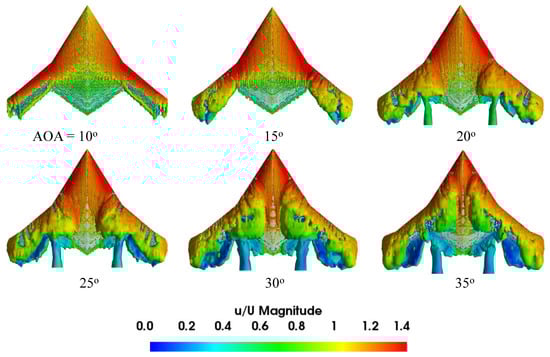
Figure 30.
The iso-surface of Q-criterion (=35,000 s−2) colored by velocity magnitude for −30° wingtip deflection at various AOAs.
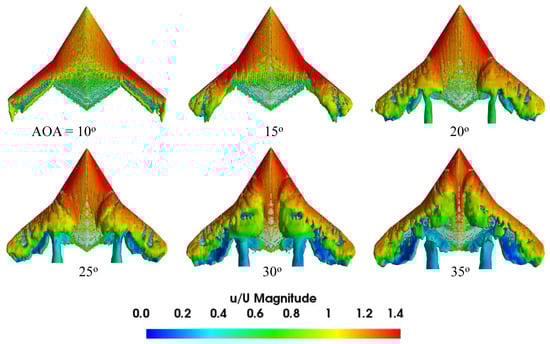
Figure 31.
The iso-surface of Q-criterion (=35,000 s−2) colored by velocity magnitude for +30° wingtip deflection at various AOAs.
7. Conclusions
The objective of this paper was to demonstrate the usage of a hybrid rapid-prototyped UAV wind tunnel model without compromising performance accuracy. The hybrid RP model with various wingtip deflections was produced using an inexpensive fused deposition modeling method and reinforced with a metallic insert to improve its structural strength. The metallic inserts are cheaper to make and support the FDM model, which lacks part strength and undergoes component deformation under aerodynamic loads during wind tunnel testing. Later, a subsonic wind tunnel study was conducted to investigate the performance of the hybrid rapid prototype model, and the results were compared to CFD performance predictions. It was found that the experimental and CFD results were in satisfactory agreement. The testing results indicated that the data obtained from the hybrid RP model was of acceptable quality regarding aerodynamic performance. Also, the model was able to withstand the aerodynamic loads and retained its structural integrity. The hybrid RP model was fabricated with reduced time and cost compared to conventionally produced wind tunnel models. Moreover, this study substantiated the usage of hybrid RP models for the preliminary UAV design in a timely and cost-effective manner.
In our future studies, the present work will serve as a foundation for more advanced optimization studies, followed by computational and experimental investigations to develop the nonplanar UAV concept.
Author Contributions
Conceptualization, H.A., K.K. and M.N.; methodology, H.A., K.K. and M.N.; software, H.A., K.K. and M.N.; validation, H.A., K.K. and M.N.; formal analysis, H.A., K.K. and M.N.; investigation, H.A., K.K. and M.N.; resources, H.A., K.K. and M.N.; data curation, H.A., K.K. and M.N.; writing—original draft preparation, H.A., K.K. and M.N.; writing—review and editing, H.A., K.K. and M.N.; visualization, H.A., K.K. and M.N.; supervision, K.K. and M.N.; project administration, K.K. and M.N.; funding acquisition, K.K. and M.N. All authors have read and agreed to the published version of the manuscript.
Funding
This research was performed under the AVT-SP-002 NATO STO Support Project Turbulence and the Aerodynamic Optimization of Nonplanar Lifting Systems.
Data Availability Statement
The data presented in this study are available on request from the corresponding author.
Acknowledgments
The authors would like to acknowledge NATO STO Support Project AVT-SP-002 Turbulence and the Aerodynamic Optimization of Nonplanar Lifting Systems. Also, the third author would like to acknowledge Istanbul Technical University Scientific Research Projects Unit for research funding with grant numbers PMA-2023-44884 and MGA-2022-43602.
Conflicts of Interest
The authors declare no conflicts of interest.
Abbreviations
The following abbreviations are used in this manuscript:
| AOA | Angle of attack, ° |
| AR | Wing aspect ratio |
| b | Wingspan, m |
| c | Wing chord, m |
| P | Pressure, N/m2 |
| Q | Q-criterion, s−2 |
| S | Wing area, m2 |
| u | Local velocity, m/s |
| U | Freestream velocity, m/s |
| X, Y, Z | Coordinate axes |
| Sweep angle, ° | |
| k | Turbulence kinetic energy, m2/s2 |
| Specific turbulence dissipation rate, 1/s |
References
- Hague, R.; Mansour, S.; Saleh, N. Material and Design Considerations for Rapid Manufacturing. Int. J. Prod. Res. 2004, 42, 142–149. [Google Scholar] [CrossRef]
- Pham, D.T.; Dimov, S.S. Rapid Prototyping and Rapid Tooling—The Key Enablers for Rapid Manufacturing. Proc. Inst. Mech. Eng. Part C J. Mech. Eng. Sci. 2003, 217, 1–23. [Google Scholar] [CrossRef]
- Gao, W.; Zhang, Y.; Ramanujan, D.; Ramani, K.; Chen, Y.; Williams, C.B.; Wang, C.C.L.; Shin, Y.C.; Zhang, S.; Zavattieri, P.D. The Status, Challenges, and Future of Additive Manufacturing in Engineering. Comput.-Aided Des. 2015, 69, 65–89. [Google Scholar] [CrossRef]
- Lokesh, K.; Jain, P.K. Selection of Rapid Prototyping Technology. Adv. Prod. Eng. Manag. 2010, 5, 75–84. [Google Scholar]
- Springer, A.M. Application of Rapid Prototyping Methods to High-Speed Wind Tunnel Testing. Report No. NASA TP–1998–208396. National Aeronautics and Space Administration: Huntsville, AL, USA. Available online: https://ntrs.nasa.gov/citations/19980201248 (accessed on 1 January 2024).
- Chuk, R.N.; Thomson, V.J. A Comparison of Rapid Prototyping Techniques Used for Wind Tunnel Model Fabrication. Rapid Prototyp. J. 1998, 4, 185–196. [Google Scholar] [CrossRef]
- Landrum, D.B.; Beard, R.M.; LaSarge, P.A.; vo Sprecken, N. Evaluation of Stereolithography Rapid Prototyping for Low Speed Airfoil Design. In Proceedings of the 35th Aerospace Sciences Meeting and Exhibit, Reno, NV, USA, 6–9 January 1997. [Google Scholar] [CrossRef]
- Heisier, R.R.; Ratliff, C.L. Wind Tunnel Model Design and Test Using Rapid Prototype Materials and Processes. In Proceedings of the 10th Annual AIAA/BMDO Technology Conference, AIAA, Williamsburg, VA, USA, 23–26 July 2001. [Google Scholar]
- Hildebrand, R.J.; Eidson, R.C.; Tyler, C. Development of a Low Cost, Rapid Prototype, Lambda Wing-Body Wind Tunnel Model. In Proceedings of the 21st AIAA Applied Aerodynamics Conference, Orlando, FL, USA, 23–26 June 2003. [Google Scholar] [CrossRef]
- Heyes, A.; Smith, D. Rapid Technique for Wind-Tunnel Model Manufacture. J. Aircr. 2004, 41.2, 413–415. [Google Scholar] [CrossRef]
- Tyler, C.; Braisted, W.; Higgins, J. Evaluation of Rapid Prototyping Technologies for Use in Wind Tunnel Model Fabrication. In Proceedings of the 43rd AIAA Aerospace Sciences Meeting and Exhibit, Reno, NV, USA, 10–13 January 2005. [Google Scholar] [CrossRef]
- Zhou, Z.; Li, D.; Zhang, Z.; Zeng, J. Design and Fabrication of a Hybrid Surface-Pressure Airfoil Model Based on Rapid Prototyping. Rapid Prototyp. J. 2008, 14, 57–66. [Google Scholar] [CrossRef]
- Daneshmand, S.; Aghanajafi, C.; Ahmadi Nadooshan, A. The Effect of Chromium Coating in RP Technology for Airfoil Manufacturing. Sadhana 2010, 35, 569–584. [Google Scholar] [CrossRef]
- Yang, D.-g.; Zhang, Z.-y.; Sun, Y.; Zhu, W.-j. A Preliminary Design and Manufacturing Study of Hybrid Lightweight High-Speed Wind-Tunnel Models. Rapid Prototyp. J. 2011, 17, 45–54. [Google Scholar] [CrossRef]
- Wang, C.; Yin, G.; Zhang, Z.; Wang, S.; Zhao, T.; Sun, Y.; Yang, D. Design and Fabrication of an Aircraft Static Aeroelastic Model Based on Rapid Prototyping. Rapid Prototyp. J. 2015, 21, 34–42. [Google Scholar] [CrossRef]
- Panayotov, H.; Penchev, S.; Kolibarov, D. Experimental Study of Canard UAV Aerodynamics. Matec Web Conf. 2017, 133, 01002. [Google Scholar] [CrossRef]
- Klippstein, H.; Diaz De Cerio Sanchez, A.; Hassanin, H.; Zweiri, Y.; Seneviratne, L. Fused Deposition Modeling for Unmanned Aerial Vehicles (UAVs): A Review. Adv. Eng. Mater. 2018, 20, 1700552. [Google Scholar] [CrossRef]
- Moioli, M.; Reinbold, C.; Sørensen, K.; Breitsamter, C. Investigation of Additively Manufactured Wind Tunnel Models with Integrated Pressure Taps for Vortex Flow Analysis. Aerospace 2019, 6, 113. [Google Scholar] [CrossRef]
- Ramirez, A.; Marcos, M.; Haro, F.; D’Amato, R.; Sant, R.; Porras, J. Application of FDM Technology to Reduce Aerodynamic Drag. Rapid Prototyp. J. 2019, 25, 781–791. [Google Scholar] [CrossRef]
- Szwedziak, K.; Łusiak, T.; Bąbel, R.; Winiarski, P.; Podsędek, S.; Doležal, P.; Niedbała, G. Wind Tunnel Experiments on an Aircraft Model Fabricated Using a 3D Printing Technique. J. Manuf. Mater. Process. 2022, 6, 12. [Google Scholar] [CrossRef]
- Aleisa, H.; Kontis, K.; Nikbay, M. Numerical Investigations on Low-Speed Aerodynamic Characteristics of Generic Unmanned Combat Aerial Vehicle Configurations. J. Aircr. 2023, 60, 1965–1975. [Google Scholar] [CrossRef]
- Luckring, J.M.; Boelens, O.J. A Reduced-Complexity Investigation of Blunt Leading-Edge Separation Motivated by UCAV Aerodynamics. In Proceedings of the 53rd AIAA Aerospace Sciences Meeting, Kissimmee, FL, USA, 5–9 January 2015. [Google Scholar] [CrossRef]
- Hirschel, E.H.; Rizzi, A.; Breitsamter, C.; Staudacher, W. Separated and Vortical Flow in Aircraft Wing Aerodynamics: Basic Principles and Unit Problems; Springer Nature: Berlin/Heidelberg, Germany, 2020; pp. 8–9. [Google Scholar] [CrossRef]
- Gursul, I.; Gordnier, R.; Visbal, M. Unsteady Aerodynamics of Nonslender Delta Wings. Prog. Aerosp. Sci. 2005, 41, 515–557. [Google Scholar] [CrossRef]
- Pfnür, S.; Breitsamter, C. Leading-Edge Vortex Interactions at a Generic Multiple Swept-Wing Aircraft Configuration. J. Aircr. 2019, 56, 2093–2107. [Google Scholar] [CrossRef]
- Lynn, R.J.; Gursul, I. Vortex Dynamics on a Generic UCAV. In Proceedings of the 44th AIAA Aerospace Sciences Meeting and Exhibit, Reno, NV, USA, 9–12 January 2006; pp. 1–18. [Google Scholar] [CrossRef]
- McFadden, E.J.; Brandt, P.J.; Bons, J.P. Swept Wing Active Flow Control Using a Streamwise Row of Vortex Generating Jets. In Proceedings of the AIAA SciTech 2022 Forum, San Diego, CA, USA & Virtual, 3–7 January 2022. [Google Scholar] [CrossRef]
- Aleisa, H.; Kontis, K.; Pirlepeli, B.; Nikbay, M. Conceptual Design of a Nonconstant Swept Flying Wing Unmanned Combat Aerial Vehicle. J. Aircr. 2023, 60, 1872–1888. [Google Scholar] [CrossRef]
- Farah, S.; Anderson, D.; Langer, R. Physical and Mechanical Properties of PLA, and Their Functions in Widespread Applications—A Comprehensive Review. Adv. Drug Deliv. Rev. 2016, 107, 367–392. [Google Scholar] [CrossRef]
- PrusaSlicer/Original Prusa 3D Printers Directly From Josef Prusa. Available online: https://www.prusa3d.com/ (accessed on 13 May 2023).
- National Wind Tunnel Facility/deHavilland Low Speed Wind Tunnel. Available online: https://www.nwtf.ac.uk/facility/dehavilland-low-speed-wind-tunnel/ (accessed on 13 May 2023).
- Skinner, S.N.; Zare-Behtash, H. Semi-Span Wind Tunnel Testing without Conventional Peniche. Exp. Fluids 2017, 58, 163. [Google Scholar] [CrossRef]
- Kao, Y.H.; Jiang, Z.W.; Fang, S.C. A Computational Simulation Study of Fluid Mechanics of Low-Speed Wind Tunnel Contractions. Fluids 2017, 2, 23. [Google Scholar] [CrossRef]
- Barlow, J.B.; Rae, W.H.; Pope, A. Low-Speed Wind Tunnel Testing, 3rd ed.; John Wiley & Sons: Hoboken, NJ, USA, 1999; pp. 353–356. [Google Scholar]
- Abbott, I.; Sherman, A. Flow Observations with Tufts and Lampblack of the Stalling of Four Typical Airfoil Sections in the N.A.C.A. Variable-Density Tunnel. Technical Note No. 672; National Advisory Committee for Aeronautics: Washington, DC, USA, 1938. Available online: https://ntrs.nasa.gov/citations/19930081486 (accessed on 1 January 2024).
- Lee, J.; Lee, B.; Kim, M.; Kim, C. Active Flow Control on a UCAV Planform Using Synthetic Jets. Int. J. Aeronaut. Space Sci. 2016, 17, 315–323. [Google Scholar] [CrossRef]
- Karpovich, E.; Gueraiche, D.; Sergeeva, N.; Kuznetsov, A. Investigation of a Light Boxplane Model Using Tuft Flow Visualization and CFD. Fluids. Fluids 2021, 6, 415. [Google Scholar] [CrossRef]
- Greenshields, C.J. OpenFOAM Version 8 User Guide; The OpenFOAM Foundation: London, UK, 2020. [Google Scholar]
- McParlin, S.; Bruce, R.; Hepworth, A.; Rae, A. Low Speed Wind Tunnel Tests on the 1303 UCAV Concept. In Proceedings of the 24th AIAA Applied Aerodynamics Conference, San Francisco, CA, USA, 5–8 June 2006. [Google Scholar] [CrossRef]
- Celik, I.B.; Ghia, U.; Roache, P.J.; McParlin, S.; Bruce, R.; Hepworth, A.; Rae, A. Procedure for Estimation and Reporting of Uncertainty Due to Discretization in CFD Applications. J. Fluids Eng. 2008, 130, 078001. [Google Scholar] [CrossRef]
Disclaimer/Publisher’s Note: The statements, opinions and data contained in all publications are solely those of the individual author(s) and contributor(s) and not of MDPI and/or the editor(s). MDPI and/or the editor(s) disclaim responsibility for any injury to people or property resulting from any ideas, methods, instructions or products referred to in the content. |
© 2024 by the authors. Licensee MDPI, Basel, Switzerland. This article is an open access article distributed under the terms and conditions of the Creative Commons Attribution (CC BY) license (https://creativecommons.org/licenses/by/4.0/).