Abstract
Based on the performance and acoustic data files of reduced-size open-rotor engines in low-speed wind tunnels, the static sound pressure level was derived by converting the 1-foot lossless spectral density into sound-pressure-level data, the background noise was removed, and the results were corrected according to the environmental parameters of the low-speed wind tunnels. In accordance with the requirements of Annex 16 of the Convention on International Civil Aviation Organization and Part 36 of the Civil Aviation Regulations of China on noise measurement procedures, the takeoff trajectory was physically modeled; the static noise source was mapped onto the takeoff trajectory to simulate the propagation process of the noise during takeoff; and the 24 one-third-octave center frequencies that corresponded to the SPL data were corrected for geometrical dispersion, atmospheric absorption, and Doppler effects, so that the takeoff noise could be corrected to represent a real environment. In addition, the audible processing of noise data with a 110° source pointing angle was achieved, which can be useful for enabling practical observers to analyze the noise characteristics.
1. Introduction
The open-rotor engine (CFM international, West Chester, OH, USA) was designed to use the latest aerodynamic theories to reduce fuel consumption and carbon emissions by 20% or more per unit of energy consumption compared with the LEAP engine while producing more thrust [1]. The open-rotor engine allows for high propulsive efficiency to be maintained at high flight Mach numbers and has the advantages of both the low-speed, high-propulsion efficiency and the low-fuel-consumption design of the traditional turboprop engine, and the high-speed flight advantages of the turbofan-like engine [2]. Due to the design of an open-rotor engine with a nacelle-less structure and specialized thrust reversal structure, it can have a high connotation ratio, which significantly improves the propulsion efficiency at low speeds and correspondingly reduces the engine’s fuel consumption. Compared with turbofan engines and geared turbofan engines, open-rotor engines improve the system reliability and reduce the pollutant emissions [3].
The early research phase of the open-rotor engine can be traced back to 1980, and by the end of 1990, the General Electric Company had successfully developed the GE36 engine. The Pratt and Whitney (East Hartford, CT, USA) and Allison Engine (Indianapolis, IN, USA) companies in the USA worked together to develop and produce the 578DX engine. Both open-rotor engines were subjected to numerous ground simulations and flight tests. The results show that the fuel efficiency of the open-rotor engine was 20–30% higher than that of the conventional turbofan engine over the same period, demonstrating that the open-rotor engine has huge market potential as an energy-saving design [4].
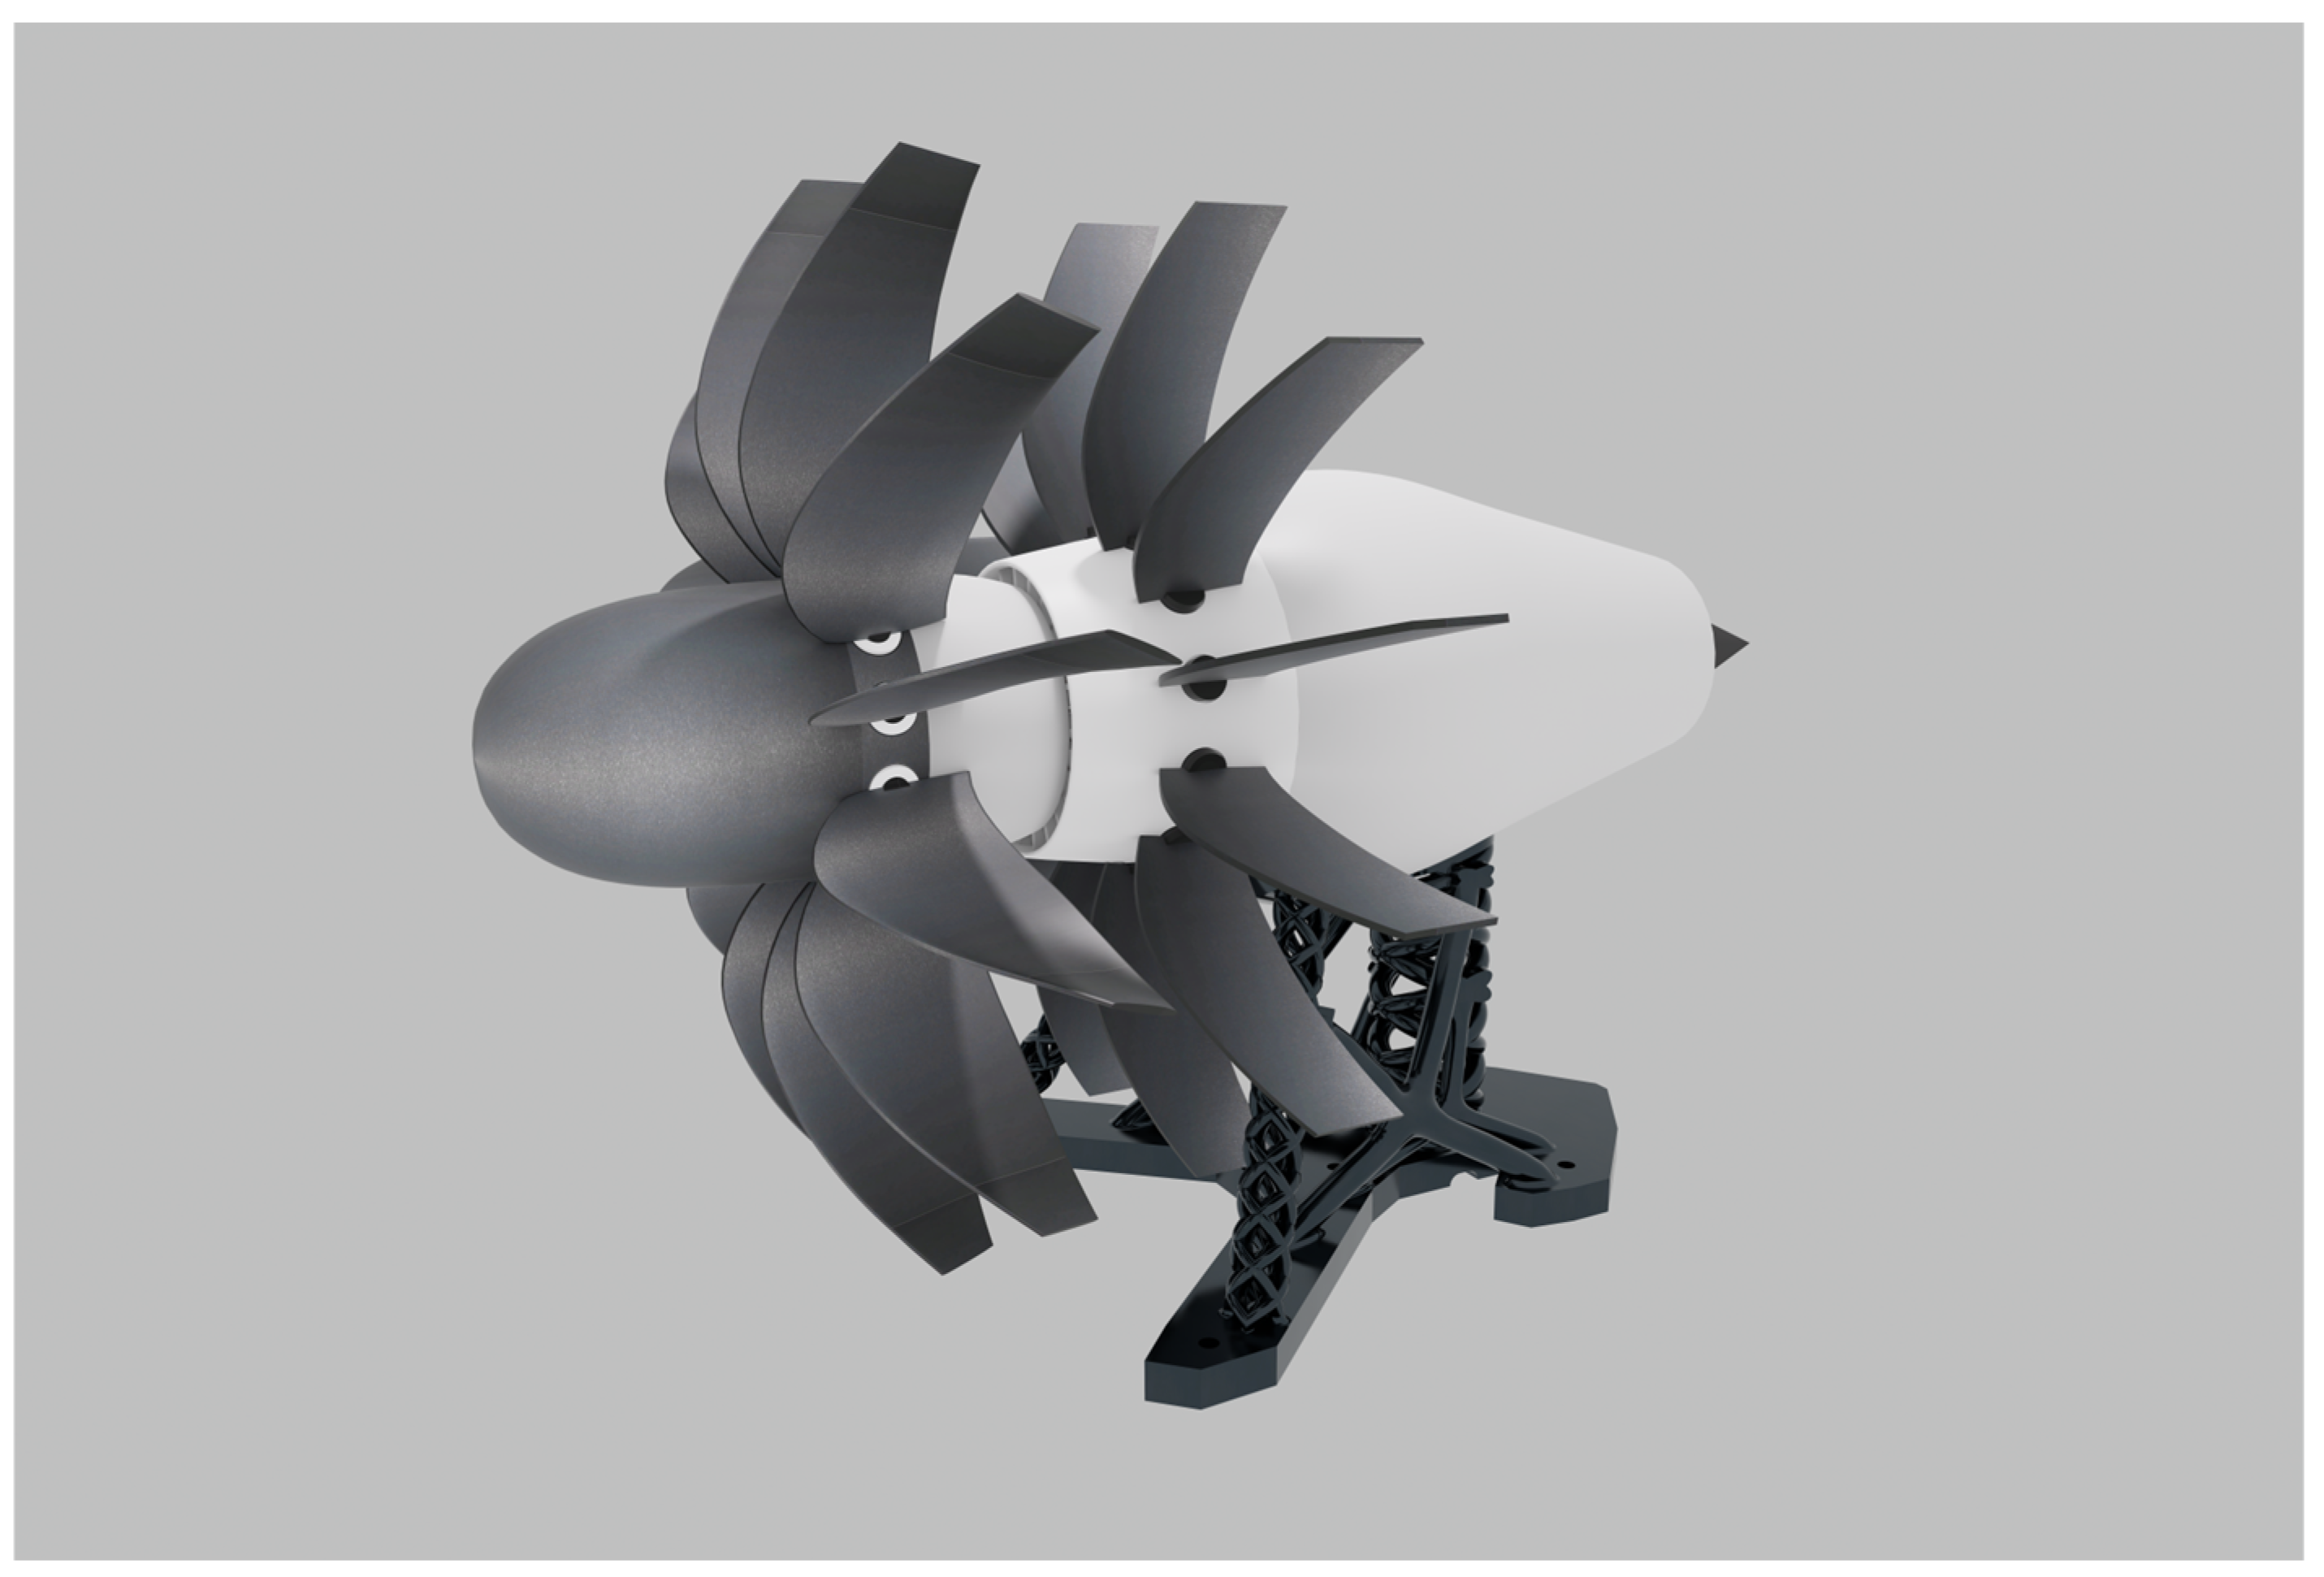
The recent rise in oil prices motivated the restart of open-rotor engine research and development work in the United States, Britain, France, Germany, Sweden, and other countries. NASA, General Electric, and Boeing, as well as Europe’s Rollo, Snecma, Airbus, and other companies, began open-rotor engine research [5]. The new generation of open-rotor engines not only excels at reducing energy consumption and emissions but also achieves significant results in reducing aviation noise levels. Initial wind tunnel tests conducted by Safran showed that the noise level of the open-rotor engine prototype is within manageable targets [6]. The new-generation open-rotor engine configuration is shown in Figure 1.
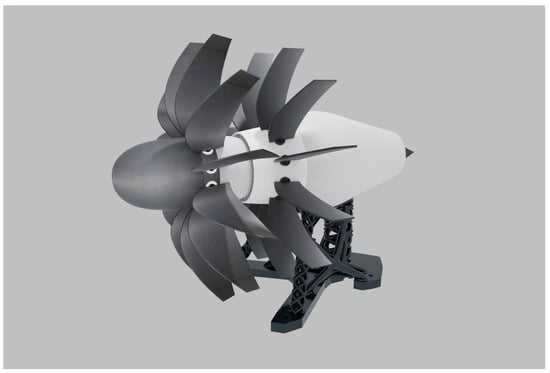
Figure 1.
The new-generation open-rotor engine configuration.
In [7], the authors explored the optimization of noise emissions from contra-rotating open rotors (CRORs) through advanced computational techniques, including a non-linear harmonic flow solver and an acoustic model based on the Ffowcs Williams–Hawkings approach. A comprehensive analysis of 102 simulation cases led to the development of a surface response model that effectively assesses various parameters’ impacts on noise emissions, facilitating its application in optimization platforms.
In [8], the authors analyzed the gas dynamics characteristics of an open rotor in a non-uniform flow field by using the Spalart–Allmaras turbulence model; numerically simulated the noise and noise propagation processes of the open rotor using the aerodynamic acoustic infinite element computation method; and analyzed the characteristic points in the noise field, specifically in the frequency domain [8].
In [9], the authors explored broadband noise predictions for contra-rotating open rotors (CRORs) used in aircraft, where they focused on the significant noise reduction they offer compared with traditional engines, and highlighted the need for noise prediction and mitigation strategies. They investigated broadband noise sources, such as the rotor trailing edge and rotor–rotor interaction noise, under various loading conditions, and studied the influence of different rotor configurations in terms of the rotor gap, speed, and number of blades on the noise levels. [9].
In this study, based on the performance and acoustic data of a downsized open-rotor engine in a low-speed wind tunnel, the 1-foot lossless spectral density was converted into sound-pressure-level data, the static sound pressure level was derived, and the takeoff trajectory was physically modeled to simulate the propagation process of noise during takeoff by mapping the static noise source onto the takeoff trajectory. Then, the sound-pressure-level data were corrected by the geometric dispersion effect, the atmospheric absorption effect, and the Doppler effect, and the takeoff noise was corrected to represent a real environment. At the same time, the audio processing of the noise data with a 110°noise-source pointing angle was realized, which can help an observer to analyze the noise characteristics. Then, we explored the visualization of open-rotor engine noise data in a mixed-reality environment and took advantage of the intuitive and easy-to-understand, portable, and controllable advantages of the interactive 3D spatial data visualization technology in the mixed-reality environment.
2. Processing of Noise Data
To obtain full-size flight sound pressure levels, the 1-foot lossless spectral density data measured in a low-speed wind tunnel needed to be processed. These data were obtained from a microphone detector moving along a track parallel to the propeller axis at a distance of 60 inches and at 18 cross-sectional positions that ranged from 17.8 to 140.6 ° at 7.5° intervals in a plane perpendicular to the axis of the change in distance from the rear propeller, with upstream defined as the zero-° reference point [10].
The full-size flight sound pressure levels were obtained according to the following steps.
First, at each measurement point, the 1-foot lossless spectral density was first converted to a wind tunnel test sound pressure level and the background spectral density was converted to a background sound pressure level:
where is the wind tunnel test data, is the 1-foot lossless spectral density, is the background spectral density, and the frequency segment width is constant at 12.2 Hz.
The background spectral density was then removed from the wind tunnel test data to obtain the corrected wind tunnel test data, where the low-frequency noise data below 700 Hz were removed from the results, either by replacing the low-frequency noise data with a quadratic function value with a 10 dB drop point at 100 Hz or by introducing a standard second-order filter model, such as a second-order Butterworth filter. A Butterworth filter is a filter type commonly used in signal processing and audio processing with a smooth frequency-response curve. The negative sound-pressure-level data present after removing the wind tunnel background sound pressure level were set to zero as follows:
The corrected wind tunnel test SPL data were converted to a static SPL using the wind tunnel Mach number and the international standard atmospheric pressure
where the second term in Equation (5) eliminates the convective amplification effect included in the wind tunnel test sound-pressure-level data, and the third term corrects the wind tunnel conditions to the source intensity amplitude for international standard atmospheric conditions. There was no associated Doppler shift due to the zero relative velocity between the noise source and the microphone. The source motion index was taken to be 2 for the dipole source, and the emission angle was calculated from the geometric angle .
3. Takeoff Trajectory Calculation
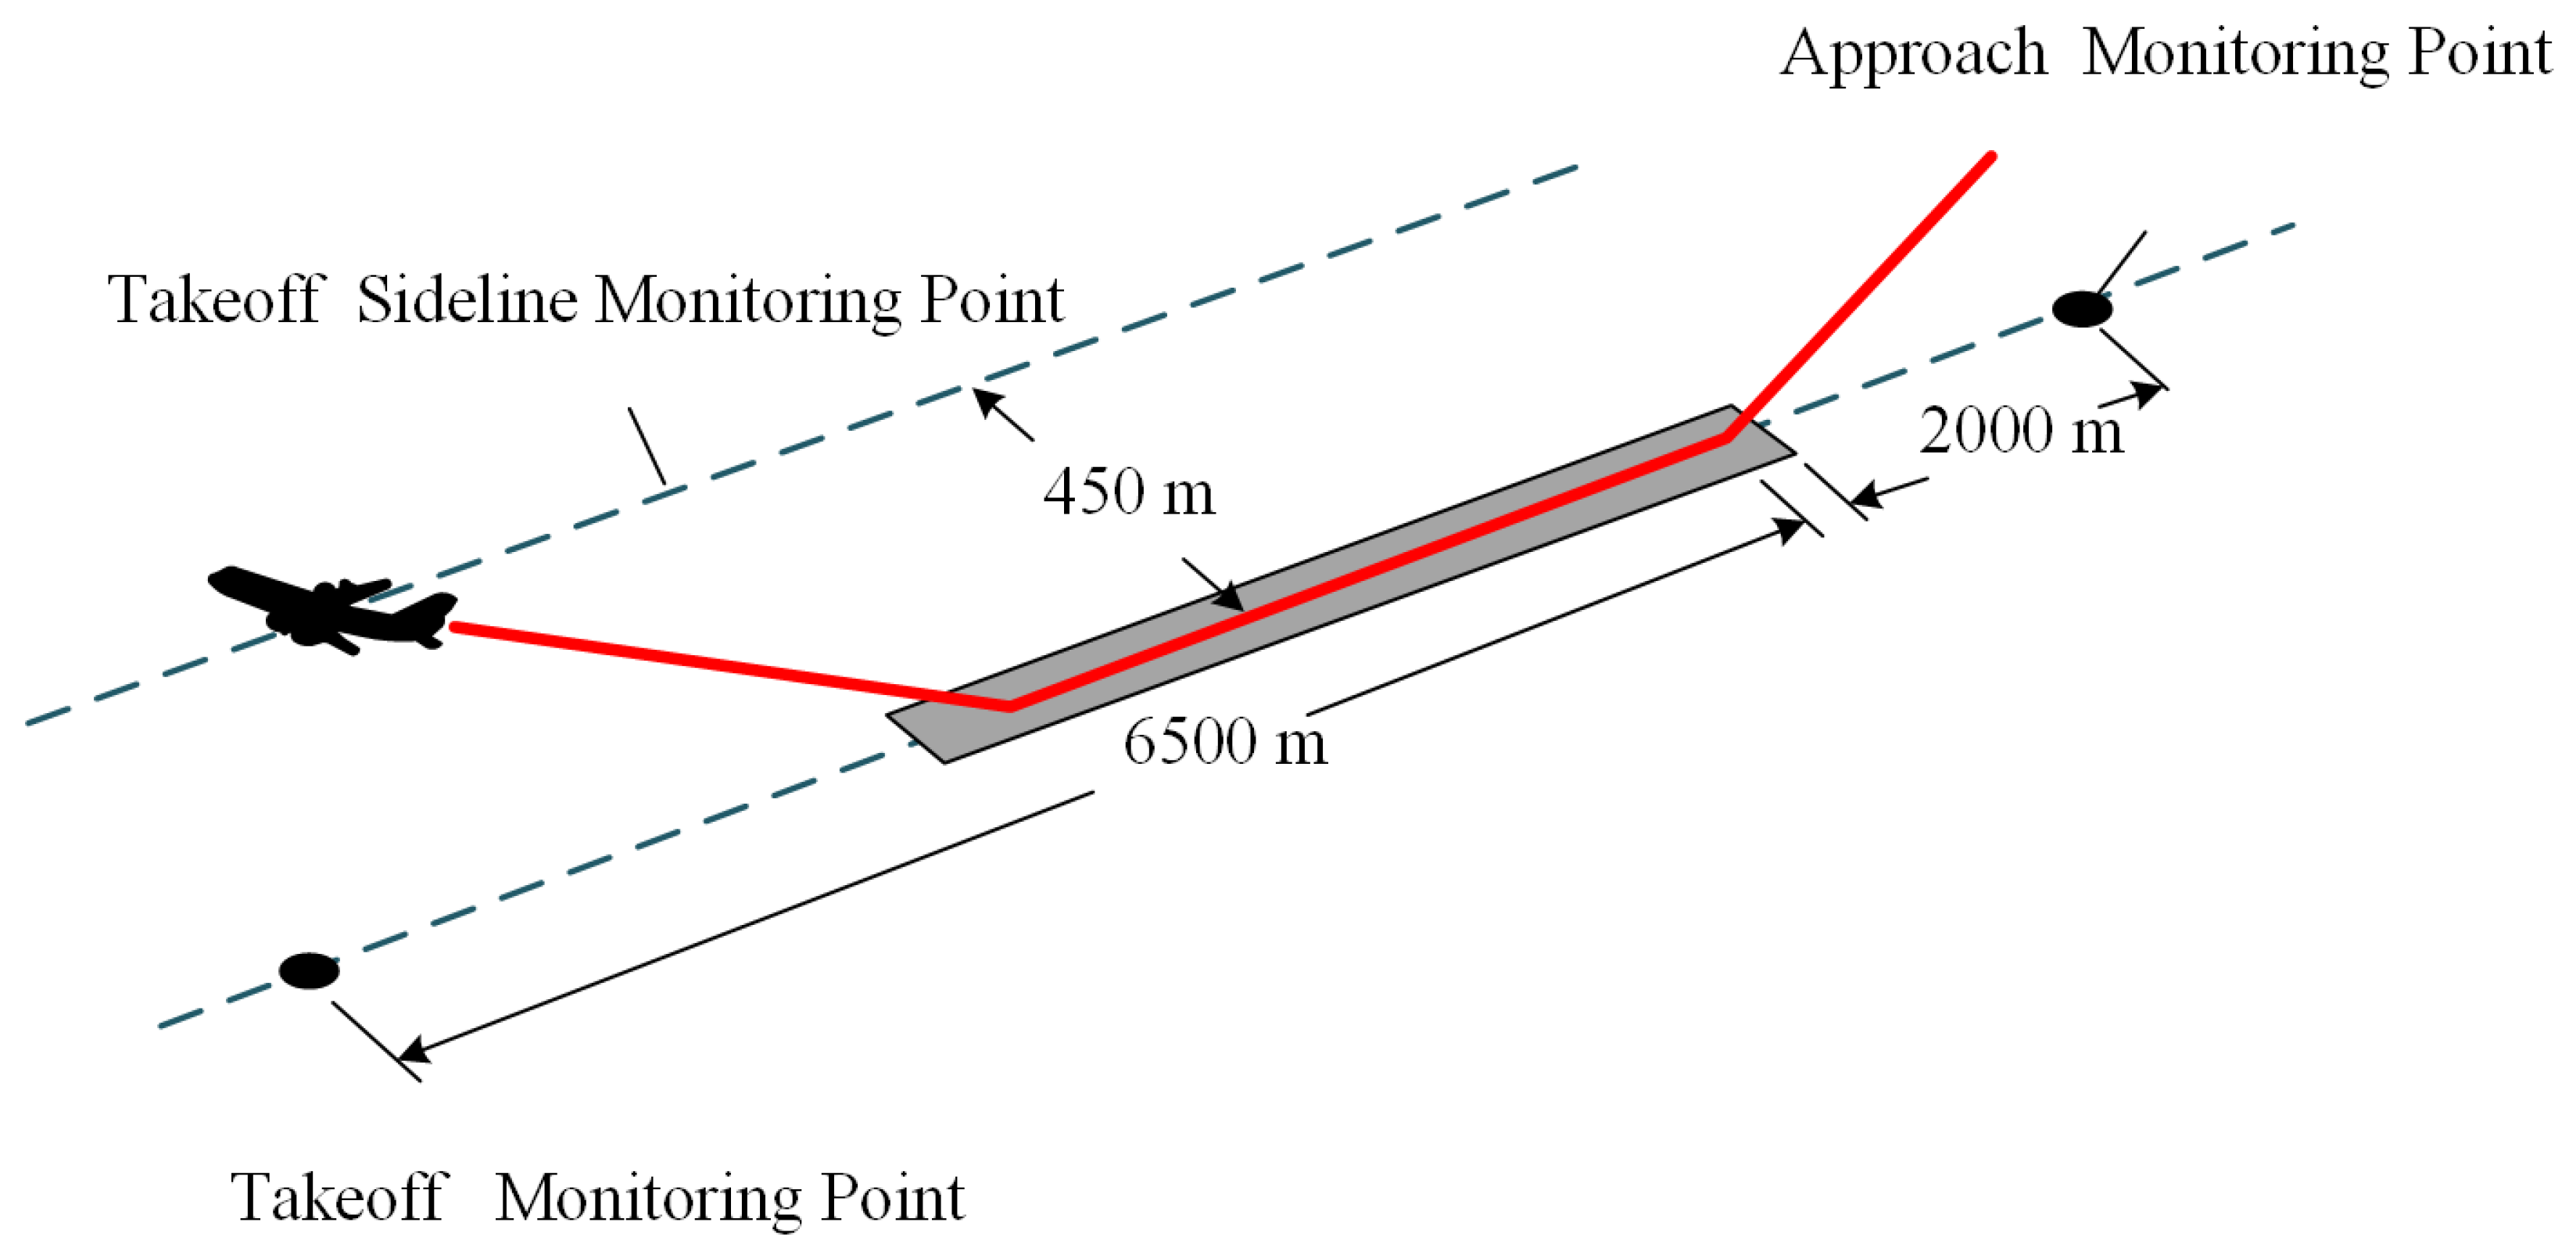
In accordance with the requirements of [11], the takeoff trajectory was physically modeled, and the mapped noise-source coordinates were determined for the takeoff trajectory according to the relative position between the microphone and the engine in the engine ground static test. The noise airworthiness regulations for civil passenger aircraft have specific definitions for the noise measurement points at different flight stages (Figure 2). The noise measurement point is required to be 2000 m from the runway start in the approach procedure, the takeoff noise measurement point is 6500 m from the takeoff taxiing point in the departure procedure, and the transverse sidings noise measurement point is along the side and parallel to the runway centerline. Different aircraft should have different transverse sideline noise measurement points, though in general, they are 450 m away from the runway centerline [11].
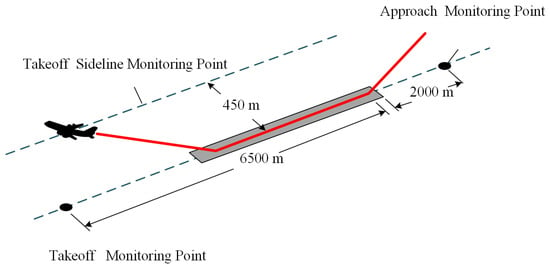
Figure 2.
Aircraft-noise-monitoring points for noise airworthiness requirements.
3.1. Takeoff Trajectory
Takeoff procedures can be categorized into full- and reduced-thrust takeoffs, which have significant differences in terms of usage scenarios and impacts on the aircraft performance [12].
A full-thrust takeoff is when the aircraft uses the maximum thrust of the engine during takeoff. The main advantage of this approach is that it provides maximum takeoff performance, allowing the aircraft to leave the ground and climb rapidly over the shortest distance. This is particularly important in situations where the takeoff distance is limited or a rapid climb is required, such as takeoffs at short-runway airports or airports with nearby obstacles [13]. However, a full-thrust takeoff presents some drawbacks, such as increased engine wear and fuel consumption, as well as the generation of greater noise during takeoff.
A reduced-thrust takeoff is when the aircraft uses less than the maximum thrust during takeoff. The main advantage of this method is that it reduces the engine wear and fuel consumption, thereby extending the engine life and reducing the operating costs. In addition, a reduced-thrust takeoff can effectively reduce the noise during takeoff and has less impact on the environment around the airport [14]. Therefore, reduced-thrust takeoffs are widely used in noise-sensitive areas or for flights that do not require maximum takeoff performance. However, reduced-thrust takeoffs have limitations, such as relatively long takeoff distances and low climb rates, and may not be able to meet the takeoff performance requirements in some specific cases.
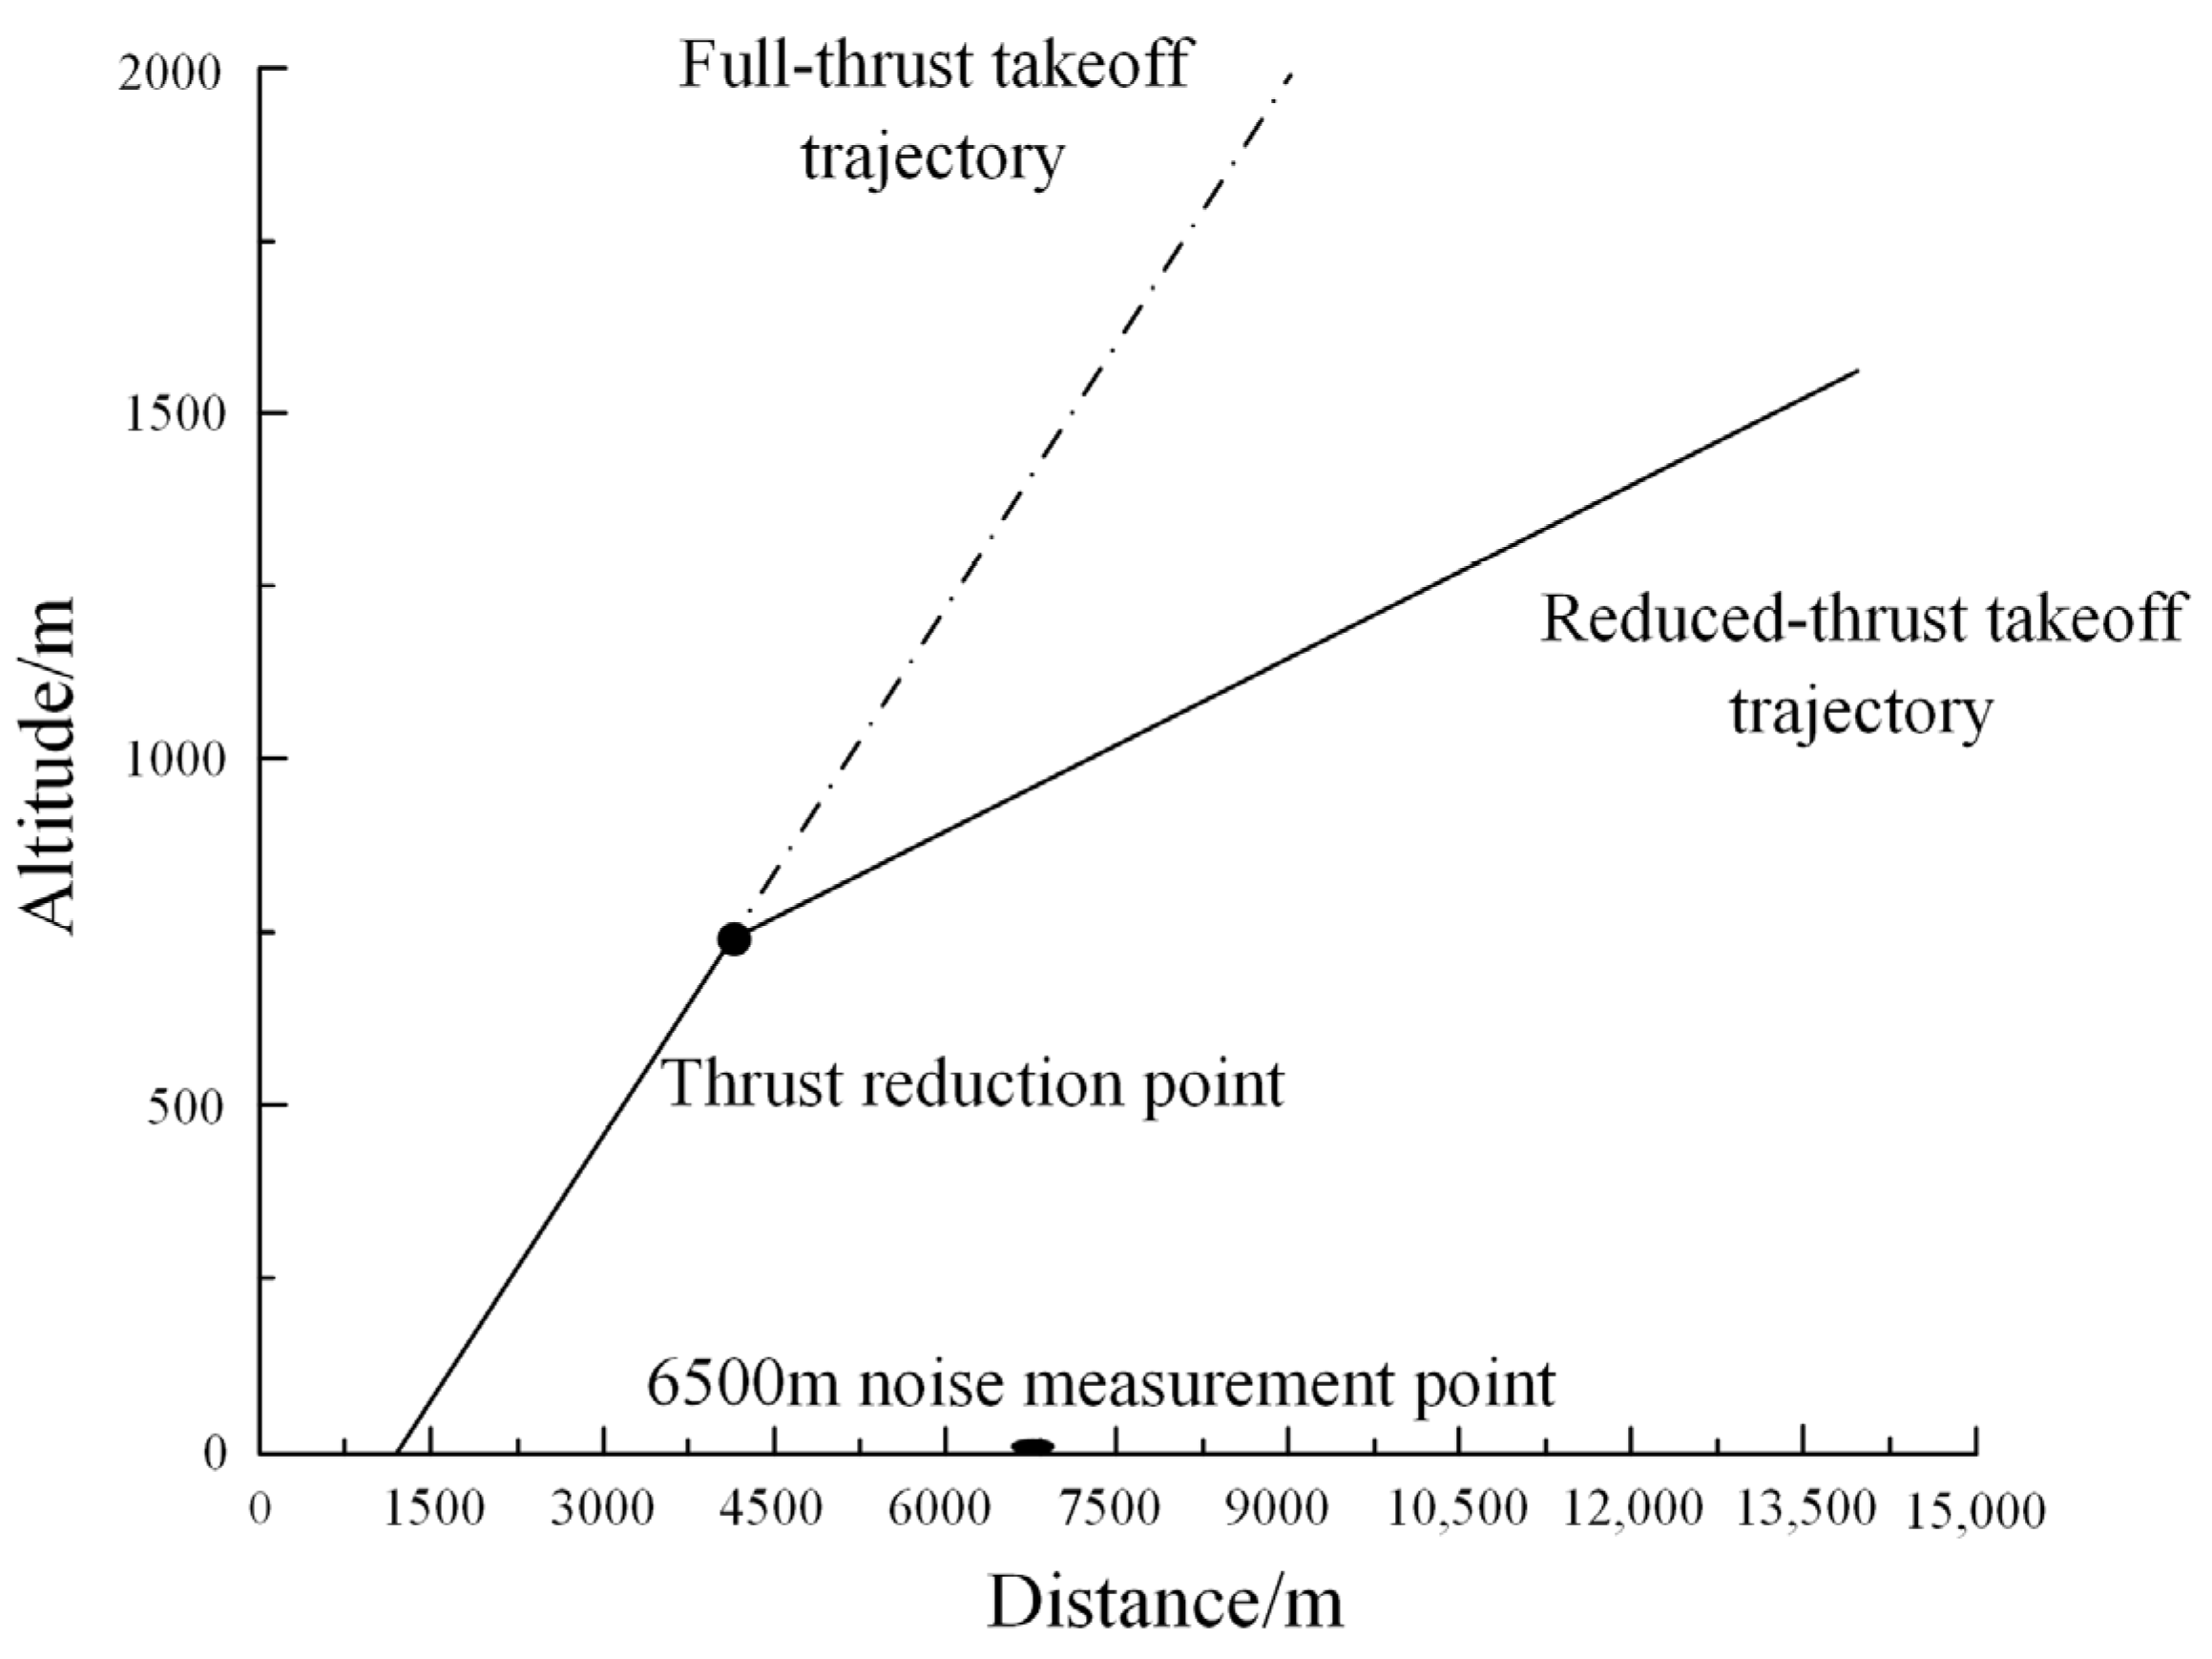
In the noise validation process, it is necessary to determine the maximum noise generated by the maximum takeoff thrust, which determines the maximum range of the noise pollution. During takeoff, either a full- or reduced-thrust takeoff can be selected, but to reduce the noise impact of the sound source on the surrounding environment so that the noise level meets the airworthiness standards, a reduced-thrust takeoff is usually used, since it significantly reduces the noise generated during takeoff. The trajectories of full- and reduced-thrust takeoffs are shown in Figure 3.
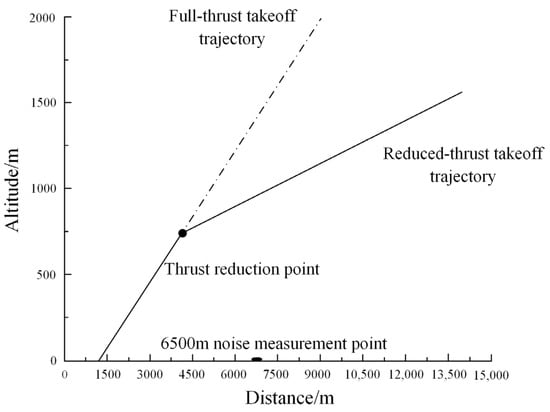
Figure 3.
Full- and reduced-thrust takeoff trajectories.
3.2. Source Localization
According to the noise airworthiness validation regulations and environmental engineering manual requirements for ground-based static engine noise testing, the engine position was fixed during the static noise test, and the noise measurement receivers were arranged along a semicircular domain from 20 to 160° at 5° intervals so that the engine noise levels at different angles could be measured. Unlike static engine test conditions on the ground, the position of the sound source is constantly changing under actual takeoff conditions, which means that the data measured under static conditions cannot be directly used to predict the engine noise during takeoff. To solve this problem, the static noise data can be mapped onto the takeoff trajectory. This algorithm determines the specific location of each measurement point during takeoff and transforms the static noise data to these locations.
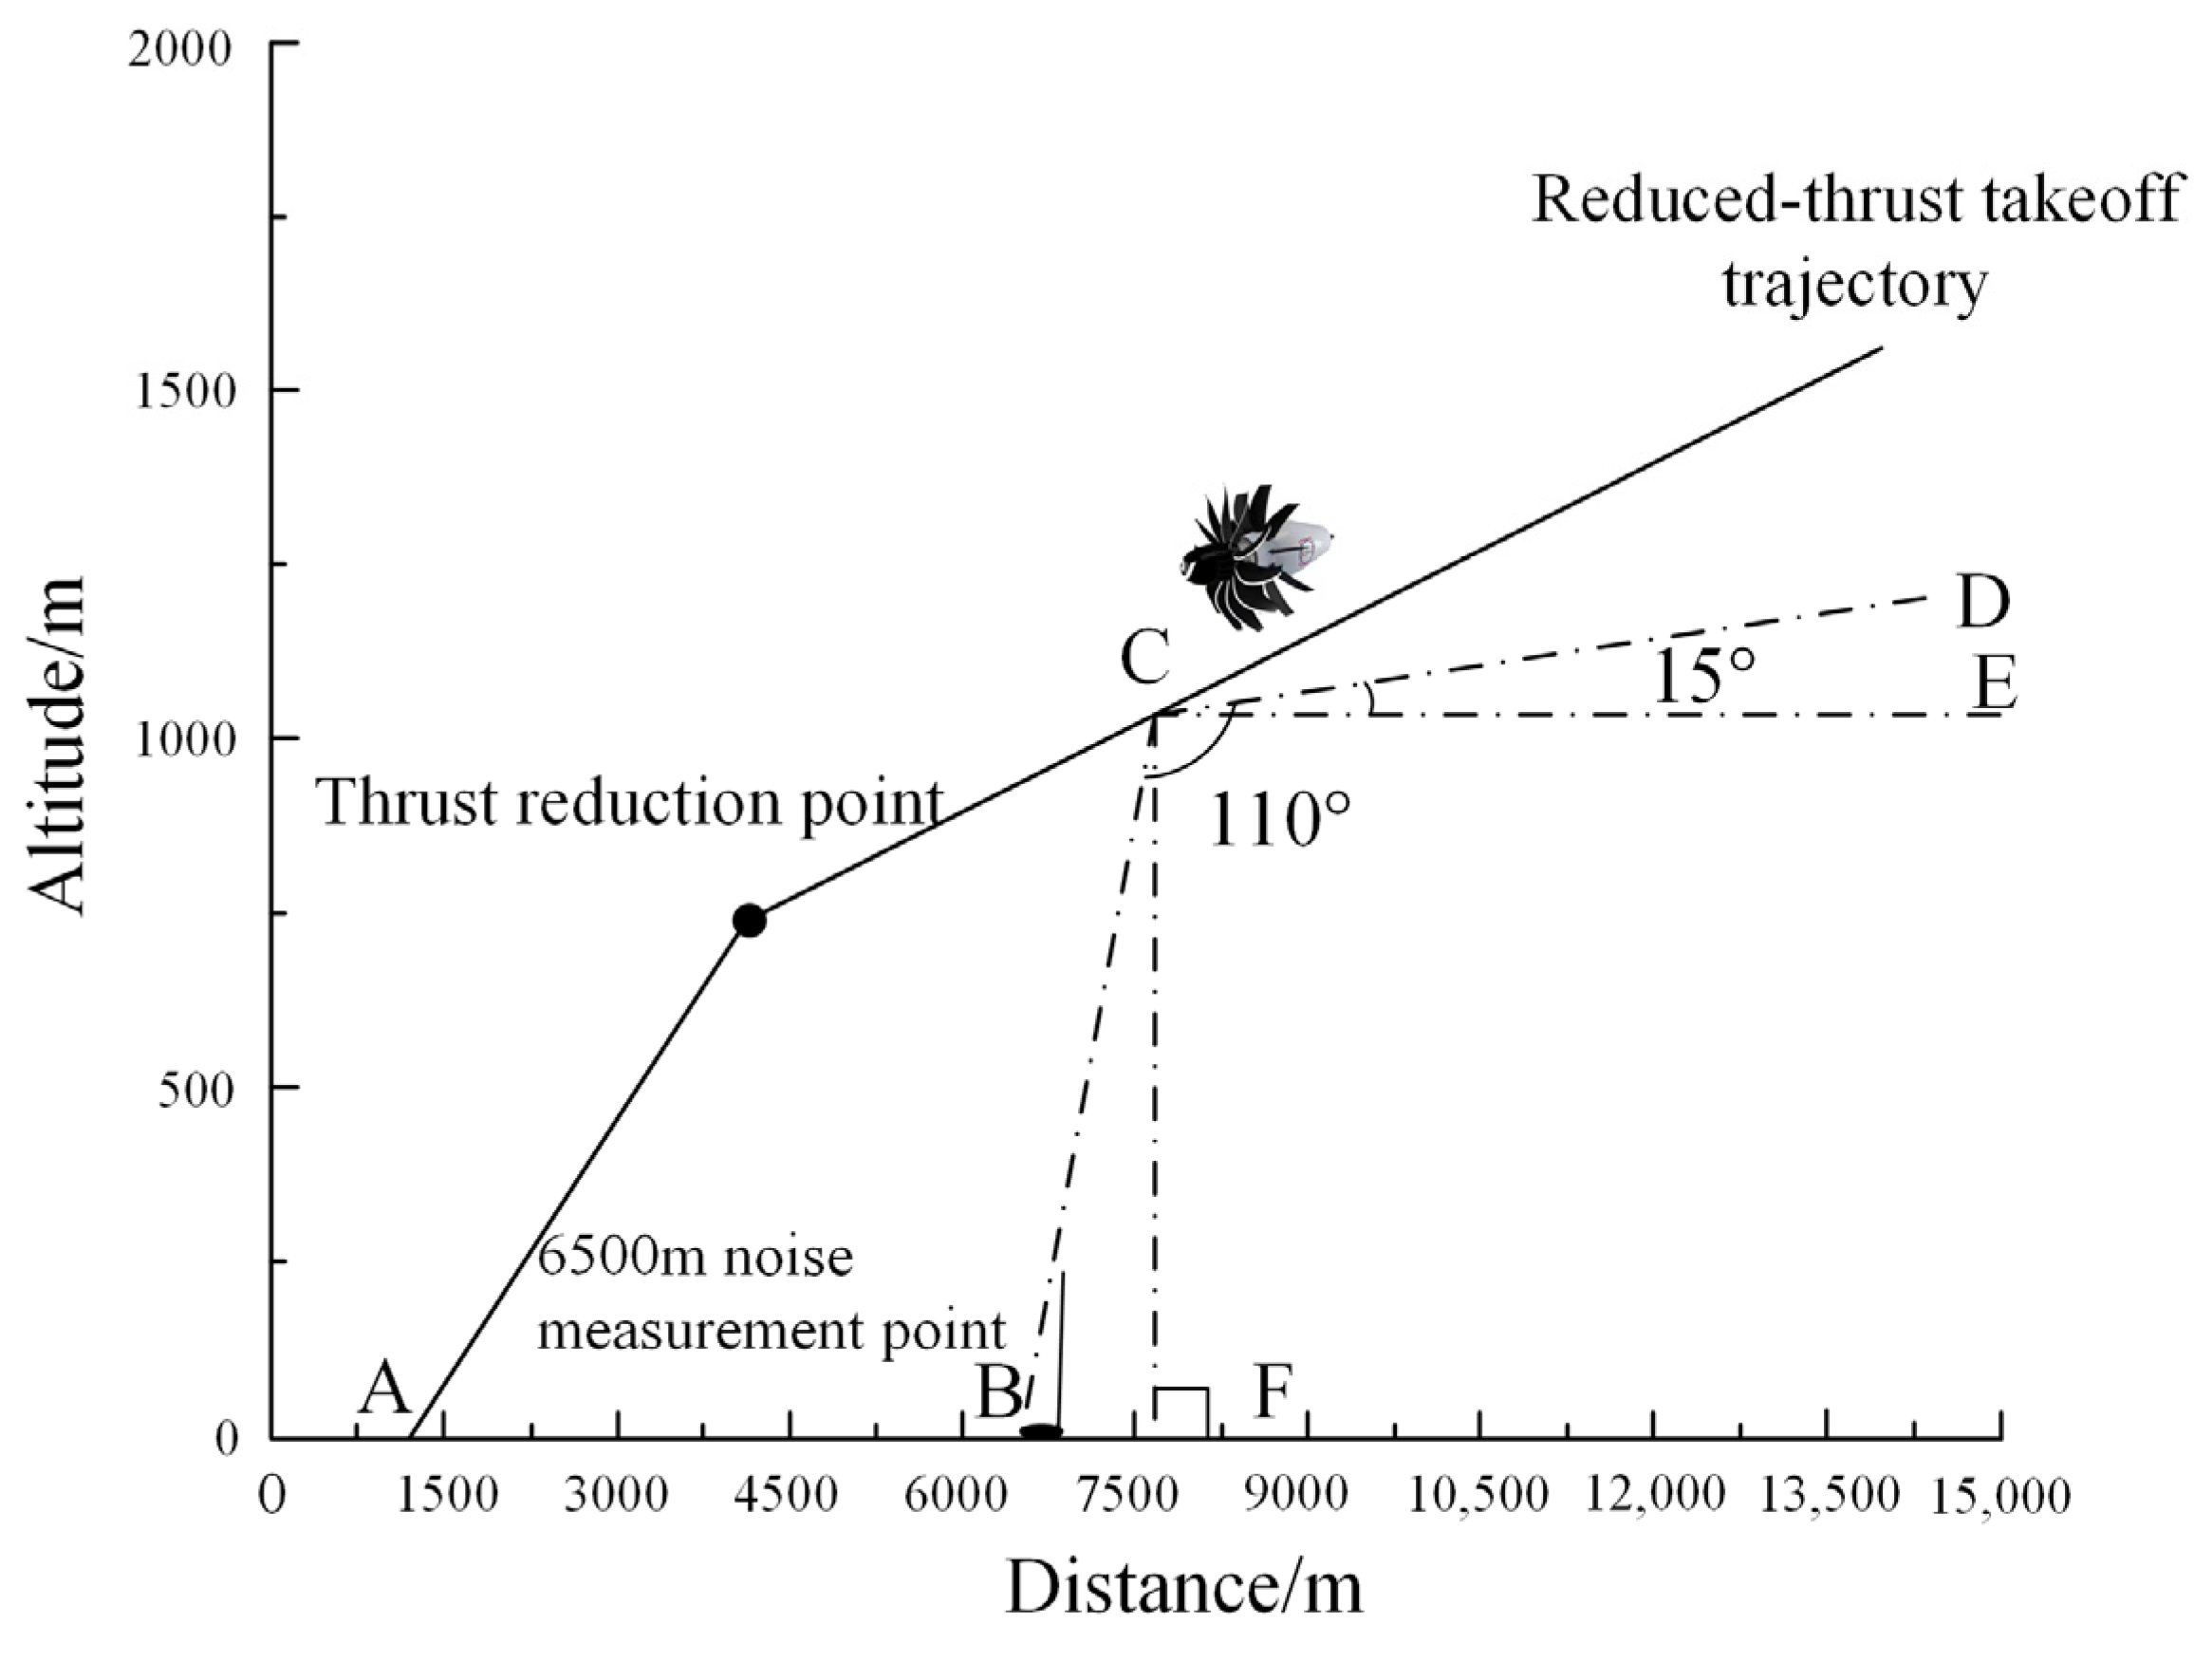
Take the static sound-pressure-level data with a 110° noise-source pointing angle as an example for the takeoff trajectory noise-source localization (Figure 4). Point A is the takeoff climb starting point, point B is the 6500 m takeoff noise measurement point, point C is the position mapped on the trajectory when the noise-source pointing angle is 110° during the static engine test on the ground, CD is the engine axis, BC is the straight line noise propagation path, and the angle between BC and CD is 110°.
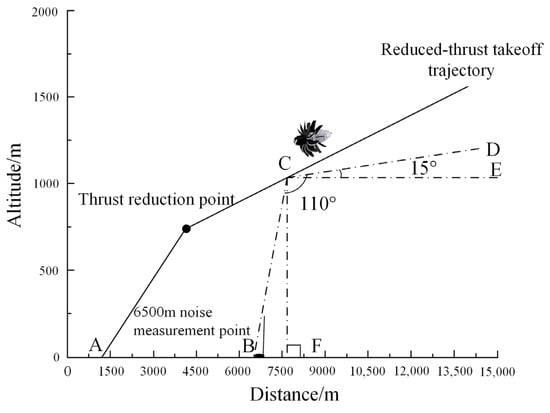
Figure 4.
Example of reduced-thrust takeoff trajectory noise source localization.
In the calculation, the thrust reduction point coordinates are set as (x, y), and the point C coordinates are set as (xc, yc). To facilitate the calculation, CE is drawn through point C and parallel to the horizontal ground. This auxiliary line CE divides ∠BCD into ∠BCE and ∠DCE. It should be noted that ∠DCE is exactly the angle between the engine axis and the ground, where ∠DCE = 15° according to the requirements of the airworthiness certification regulations. In addition, projecting point C vertically to the ground gives point F. Since CE is parallel to the ground, according to the property of parallel lines, the interior angles of the same side are complementary.
Therefore, ∠CBF is calculated as ∠CBF = 180° − (∠BCE). Furthermore, ∠BCE = ∠BCD − ∠DCE, so ∠CBF = 180° − (110° − 15°), which gives ∠CBF = 85°. When plotting the takeoff trajectory, the slope of the reduced-thrust trajectory line is already known to be k. Therefore, the system of equations relating the point C coordinates to the noise propagation distance lBC is
By solving this system of equations, the coordinates of each noise source with pointing angles ranging from 20 to 160°, which were sequentially distributed on the trajectory at 5° intervals, could be obtained, and the static noise sources could be accurately mapped onto the flight trajectory. The variation in the distance from the noise source to the 6500 m takeoff noise measurement point showed an increasing and then decreasing pattern.
3.3. Correction Methods
Based on the noise-source localization results, the Doppler effect, the geometric dispersion effect of the atmosphere, and atmospheric absorption effect on the static noise were comprehensively considered. The sound-pressure-level data that corresponded to 24 one-third-octave center frequencies were corrected for the geometric dispersion, atmospheric absorption, and Doppler effects, and the takeoff noise data were corrected to the real environment data. In this study, the atmospheric temperature was set to 25 °C (77 °F) and the relative humidity was 70%.
First, the sound pressure level was converted to the flight-state sound pressure level according to the flight Mach number, wind tunnel Mach number, international standard atmospheric pressure, and the corresponding pressure at the flight altitude
where the second term in Equation (8) adds a specific convective amplification effect, the third term adjusts the source strength amplitude to correct the static conditions to the flight state of the International Standard Atmosphere (ISA + 18 °F), and the fourth term is an additional correction to account for the increase in the flight-state sound pressure level as the free-stream Mach number varies.
Based on the extracted frequencies and test piece downsizing ratios, the conversion from the downsized model to the full-size model affected the amplitude and frequency, and the flight SPL data and frequency were adjusted to the full-size flight SPL data and full-size frequency using the test-piece downsizing ratios:
where is the full-size flight sound pressure level, is the flight-state sound pressure level, is the test-piece size reduction ratio, f is the extracted frequency, and is the full-size frequency.
For the full-size flight-state sound pressure level calculated using Equation (9), the emission angle was processed using spline interpolation, and 29 groups of frequency and sound-pressure-level data were extracted based on the pointing angle and flight altitude values obtained from the measurement point position angle and the corresponding emission angle at Mach 0.2. Then, the noise data correction process was carried out according to the influence of the atmospheric and Doppler effects on the sound pressure level.
3.3.1. Atmospheric Influences on Noise Propagation
The geometric dispersion effect is commonly referred to as the phenomenon whereby the area of a wave front increases with distance during the propagation of a fluctuation (such as a sound, light, or radio wave), resulting in a weaker wave intensity (or power density) with distance. Simply put, when a wave is emitted from a point source, its energy spreads outward in three-dimensional space. Because the energy is distributed over a spherical wavefront, the area of the wavefront grows proportionally with the square of the radius [15].
Geometric divergence is the main factor that determines the wave intensity decrease with distance, without considering absorption or scattering losses in the medium itself. For example, when sound waves propagate in free space, the sound intensity decreases inversely proportional to the square of the distance as the distance increases. This is the reason why sounds are quieter further from the source.
The sound attenuation due to geometric dispersion was calculated as follows:
where r2 is the distance from the mapping point to the 6500 m takeoff noise measurement point; r1 is the distance from the microphone to the engine in the ground-based static engine noise test, where r1 was set to 30 m in this study.
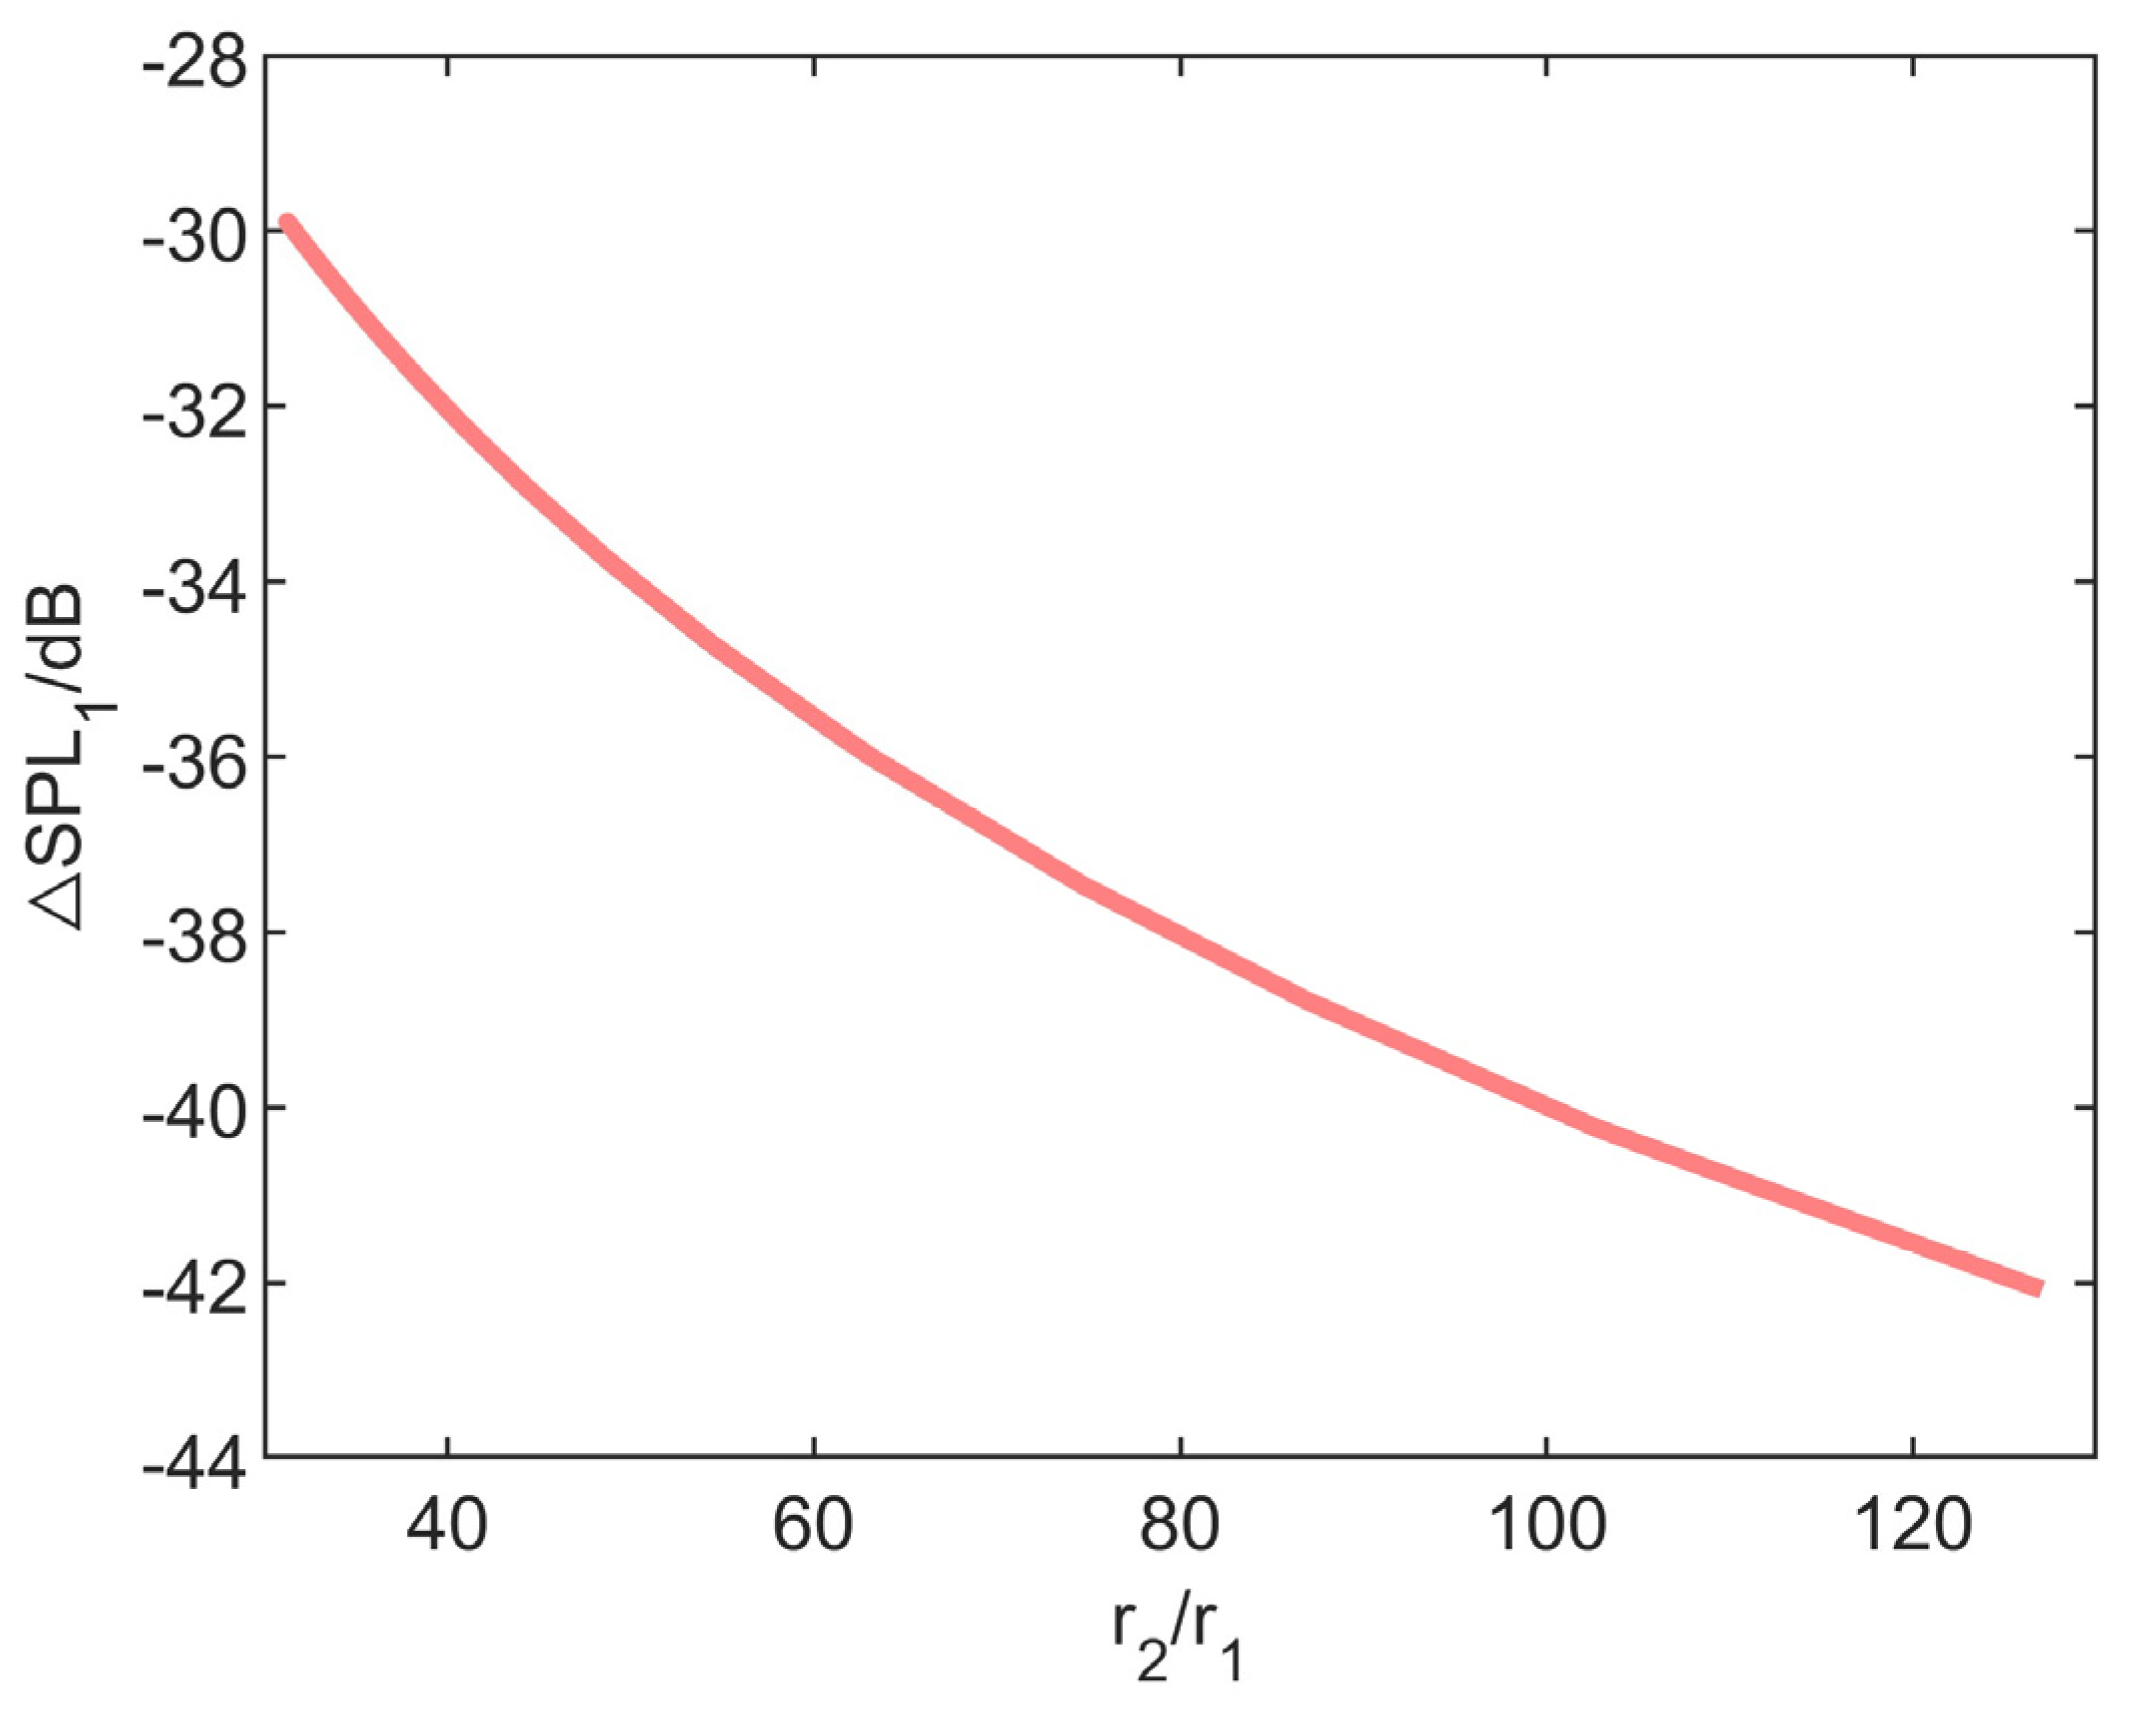
Figure 5 shows that the attenuation of the sound pressure level increased with the increase in the ratio, which is helpful for noise sound-pressure-level control. From the localization of the noise source in Section 3, the range of the noise source was 300~4000 m, so the sound-pressure-level attenuation was calculated to be about −42.08~−35.84 dB.
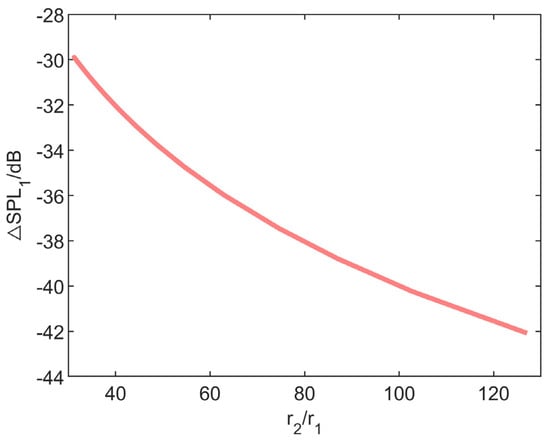
Figure 5.
Attenuation curve of the geometric dispersion effect.
SAE ARP 866B [16] is a standard method for calculating atmospheric sound absorption attenuation that is commonly used in aviation and aerospace engineering. Atmospheric sound absorption attenuation refers to the phenomenon where sound waves propagating in the atmosphere are attenuated due to the motion of air molecules and the conversion of acoustic energy into thermal energy. The SAE ARP 866B method considers the effects of temperature, humidity, atmospheric pressure, and frequency on the sound absorption and provides a method for accurately calculating the attenuation of a sound wave under specific conditions.
To calculate the noise data in a specific environment, the atmospheric attenuation coefficient is introduced as the following environmental correction factor:
where is the atmospheric attenuation coefficient (unit: dB); H is the relative humidity, set to 70%; T is the temperature, set to 25 °C; f is the noise frequency; and the correction factor can be obtained according to a value query.
The atmospheric absorption sound-pressure-level attenuation was calculated as follows:
where represents the one-third-octave center frequency for the atmospheric attenuation coefficient; r2 is the distance from the mapping point to the 6500 m takeoff noise measurement point; and r1 is the distance from the microphone to the engine in the static engine noise test on the ground, where r1 was set to be 30 m in this study.
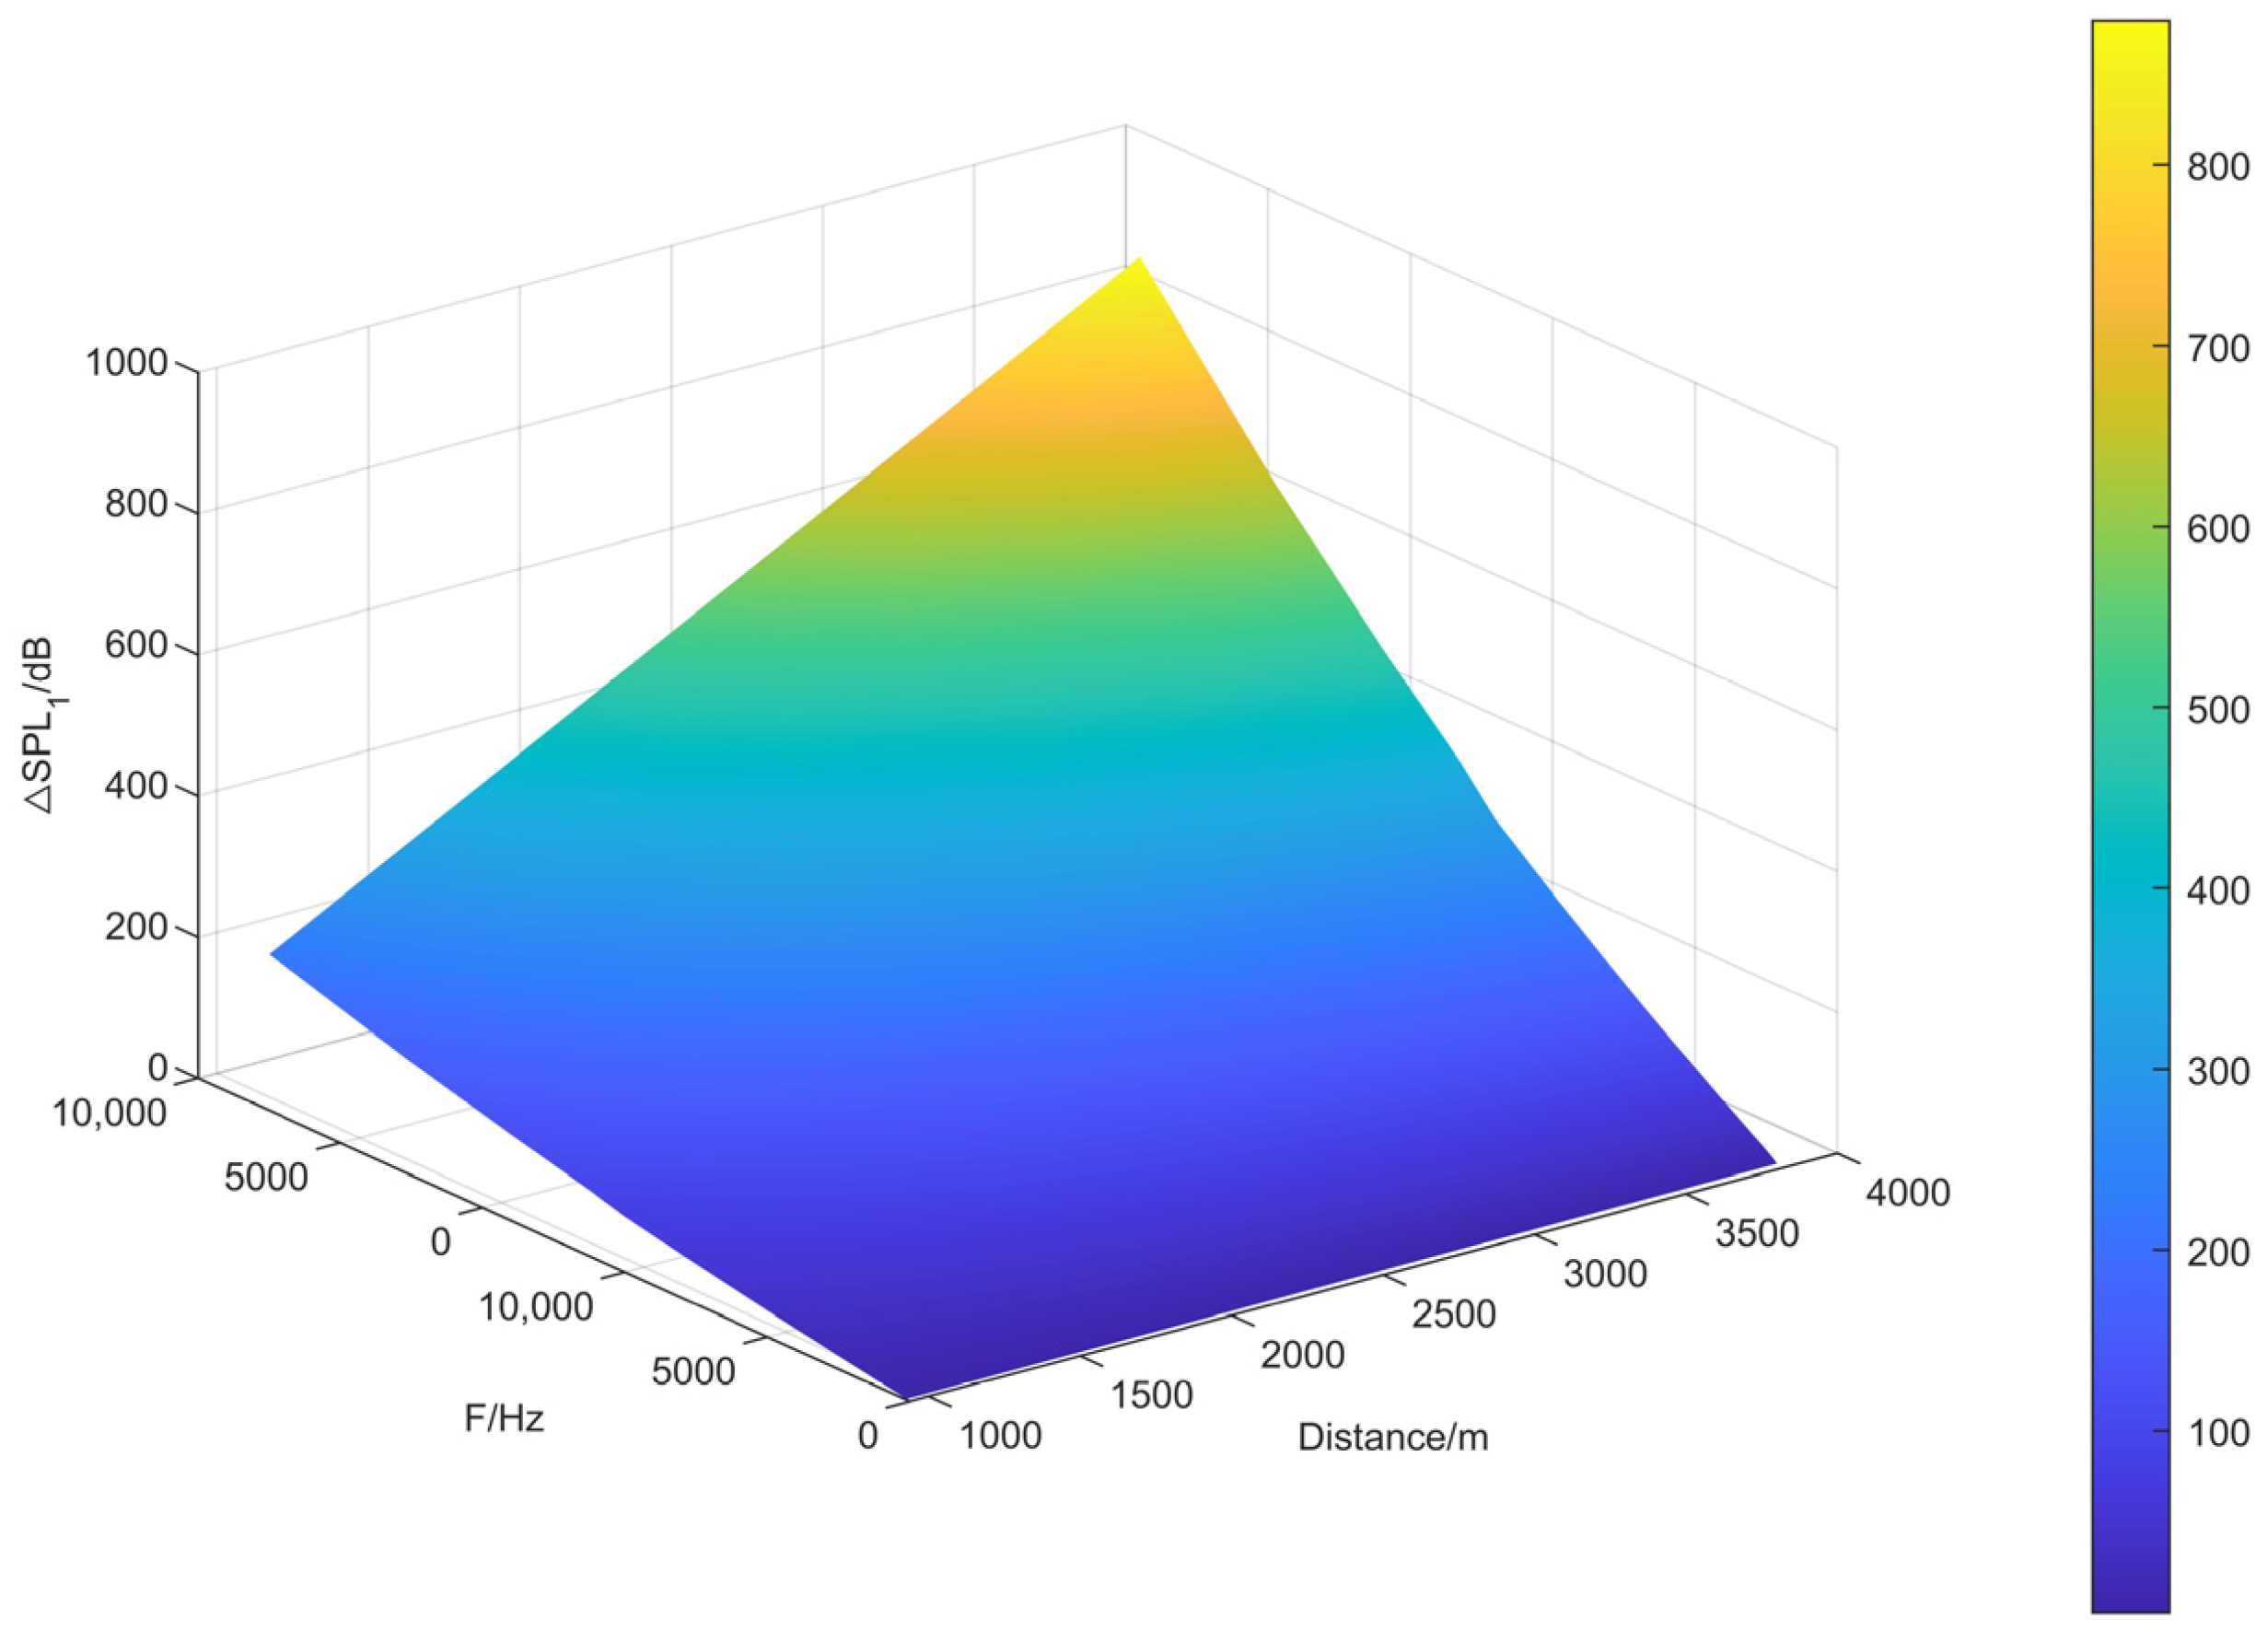
At this point, the main factors affecting the atmospheric absorption effect are the noise frequency and the linear noise propagation distance. According to the noise airworthiness certification regulations, the noise frequency range is 50~10,000 Hz. From the positioning of the noise source in Section 3, Figure 6 shows the range of the atmospheric absorption during the sound-pressure-level attenuation.
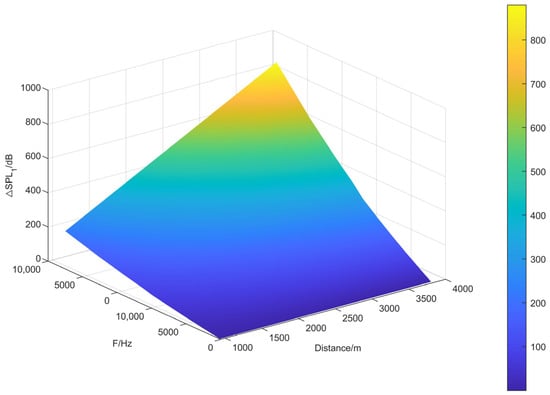
Figure 6.
Atmospheric absorption sound attenuation curve.
In this surface plot, the color changes show the sound-pressure-level attenuation changes for different noise frequencies and propagation distances. The surface had a pyramid-like shape with the top at the center, indicating that the sound attenuation reached a maximum value at a particular frequency and source directivity. At the low- and high-frequency ends, the attenuation values were lower, which indicates that the frequency-dependent properties of sound waves propagating in the atmosphere were relevant.
3.3.2. Doppler Effect Correction
The Doppler effect is a phenomenon where the received sound wave frequency increases or decreases when there is relative motion between the sound source and the receiver [17]. When the source moves toward the receiver, after each wave crest, the source moves closer to the receiver, causing the distance between two adjacent wave crests to decrease, resulting in an increase in the frequency of the received wave (shortening of the wavelength), which is called the “positive Doppler effect”. In contrast, if the source moves away from the receiver, after each wave peak, the source moves further away from the receiver, causing the distance between neighboring wave peaks to increase and the frequency of the received wave to decrease (wavelength increase), which is called the “negative Doppler effect”. Therefore, the changes in frequency and sound pressure level due to the movement of the noise source relative to the microphone can be calculated as follows:
where the flight Mach number was set to 0.3, is the pointing angle of the noise source, and the theoretical coefficient of the Doppler effect was = 40.
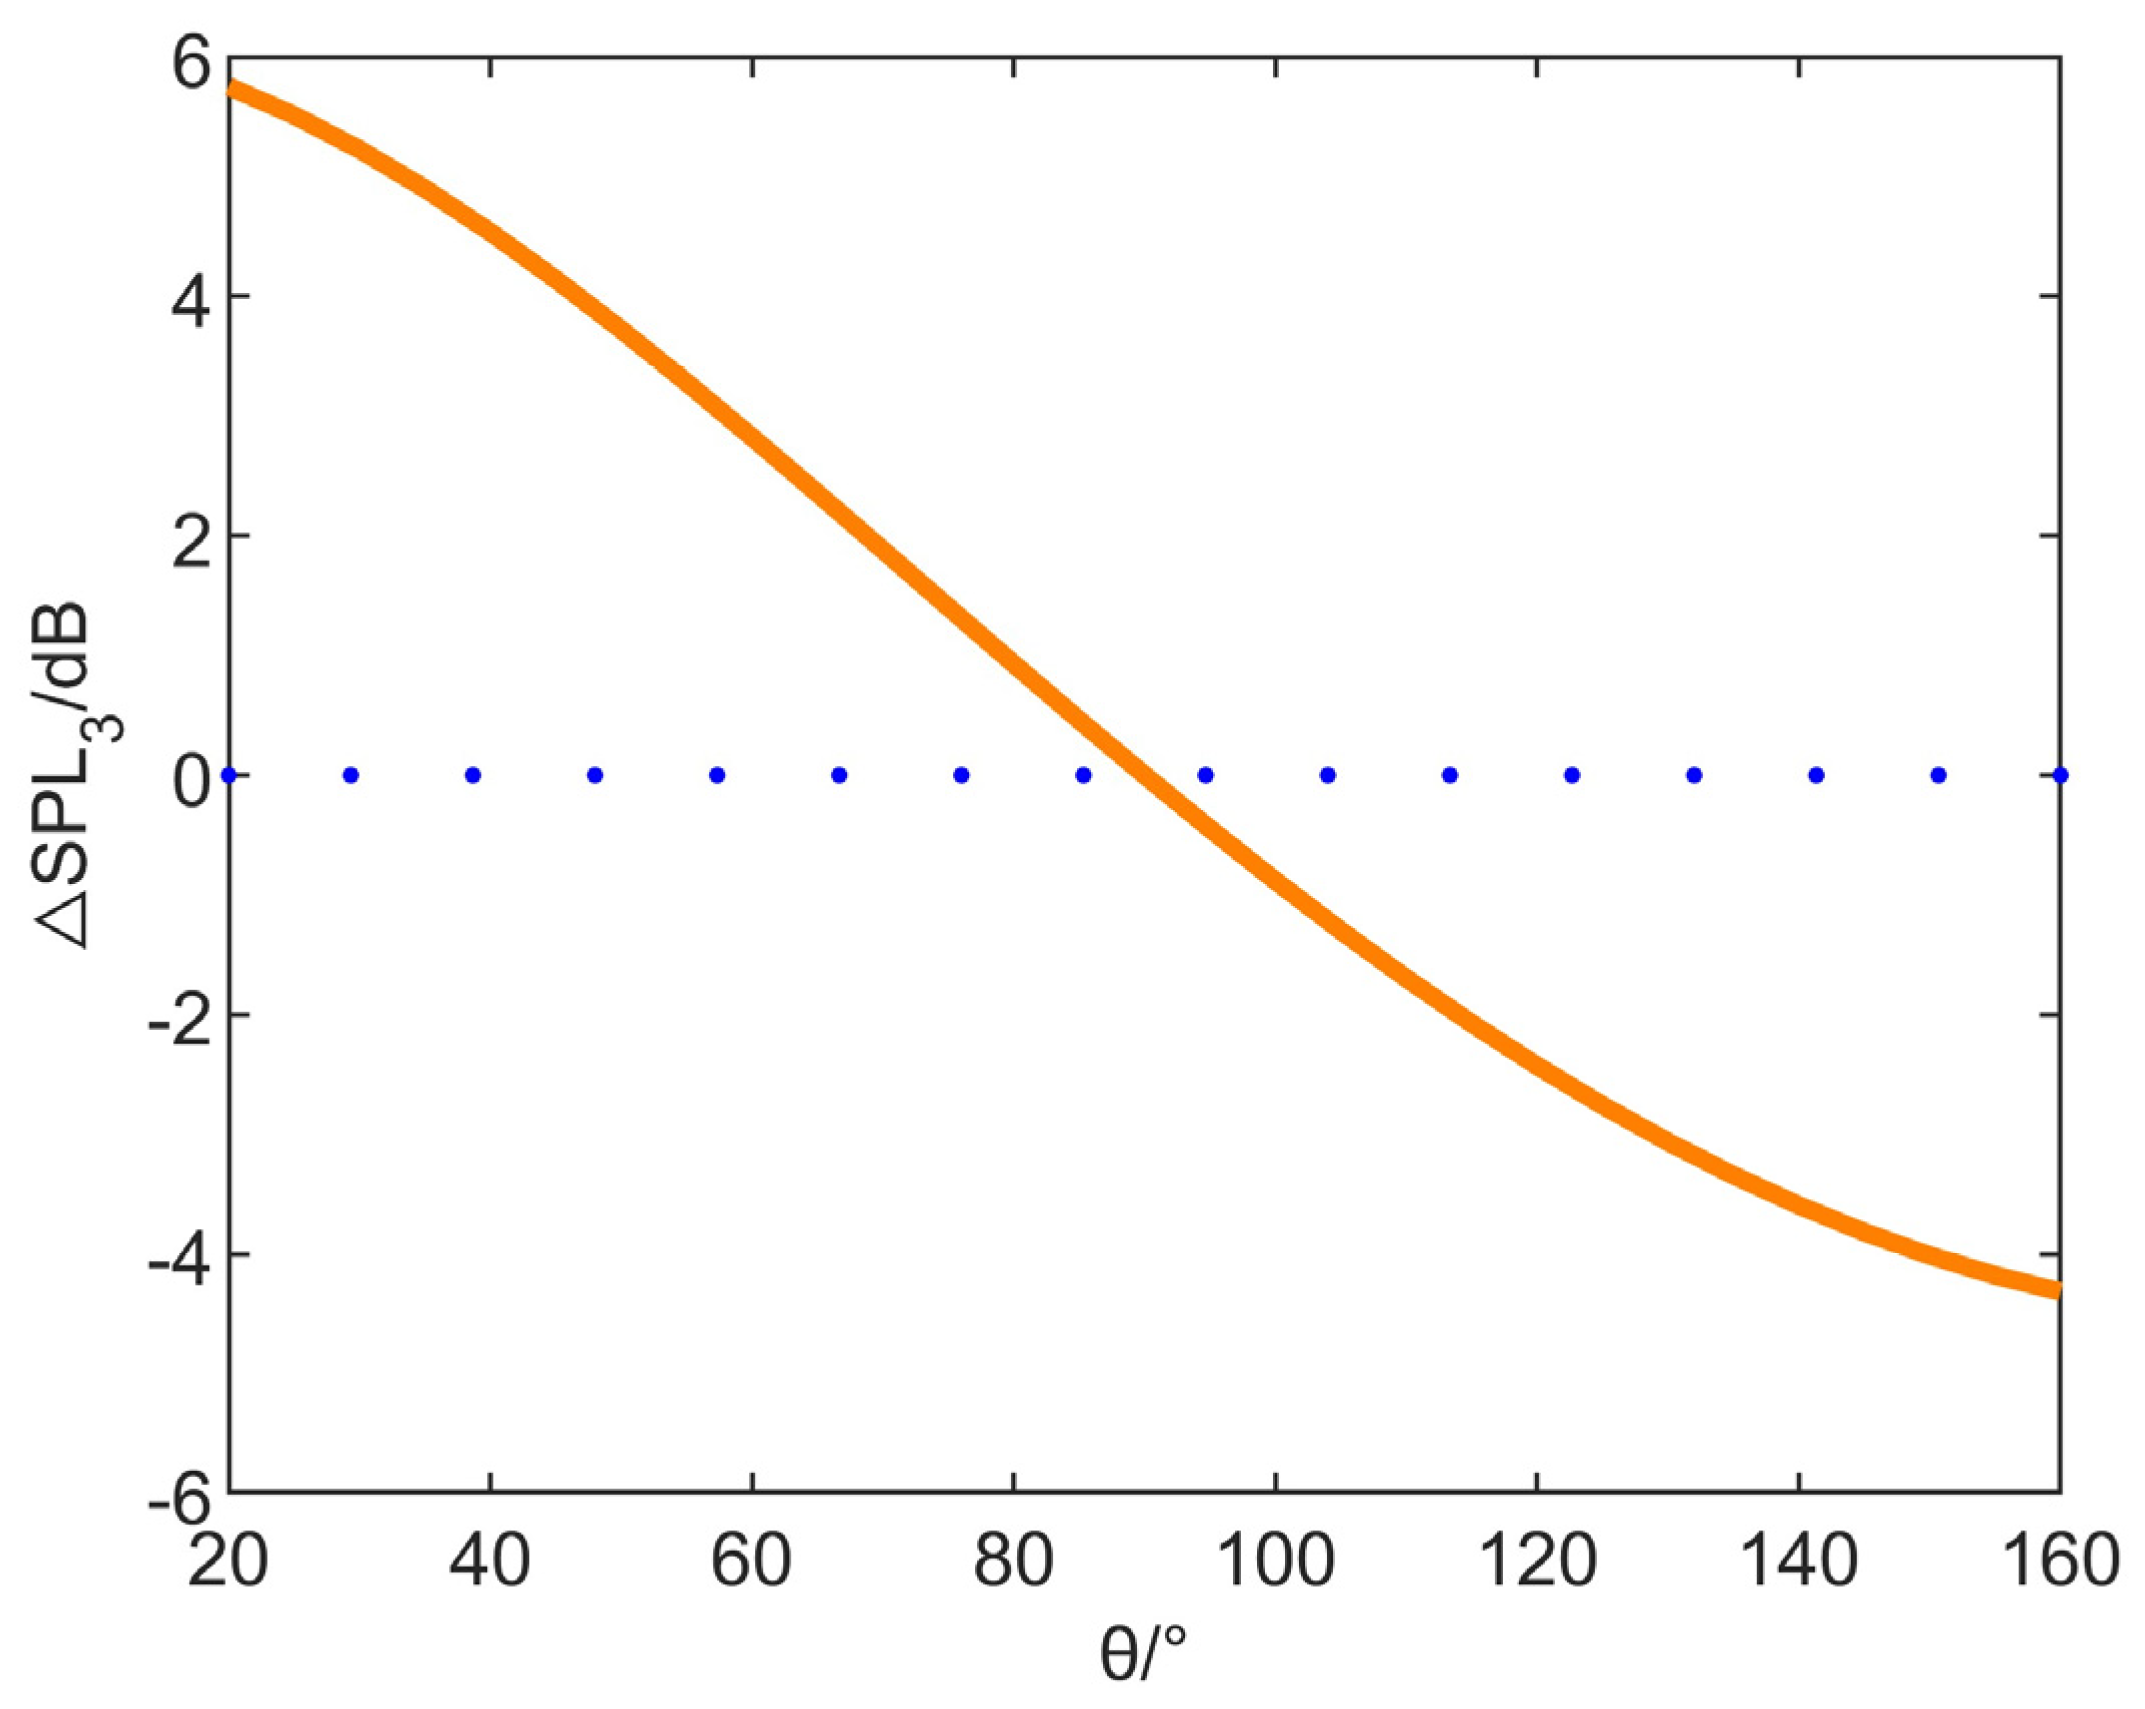
Figure 7 demonstrates that the core reason for the Doppler effect was the change in frequency caused by the change in relative position between the source and receiver. The pointing angle of the noise source relative to the 6500 m noise measurement point during takeoff was the main factor that affected the Doppler effect. Furthermore, according to Equation (16), since the pointing angle of the noise source was calculated to be 90°, the attenuation of the sound pressure level was 0. Figure 7 also shows that when the pointing angle of the source was in the range of (90°, 160°), the attenuation of the sound pressure level was negative, which is helpful for controlling the noise’s sound pressure level.
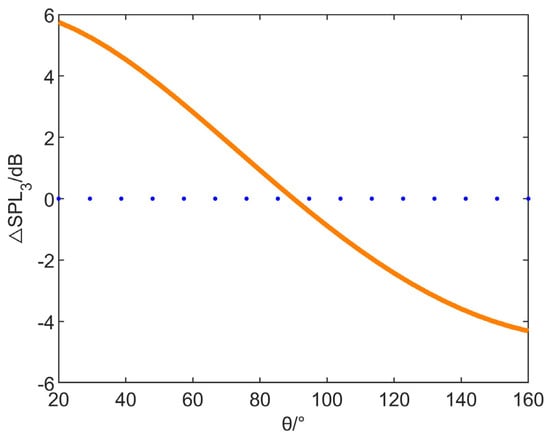
Figure 7.
Doppler effect curve (The intersection of the blue dotted line and the Doppler effect curve is the angle at which the sound pressure level attenuation is 0).
Through correcting the static data from 0 to 10,000 Hz using the one-third-octave analyzer alongside the geometric dispersion effect analysis, atmospheric absorption effect analysis, and Doppler effect analysis, the noise data of the flight state were obtained, and the negative data values were set to 0.
The flight noise data were obtained by adjusting the calibrated power spectral density to a 1-foot lossless spectral density after a unit conversion, background noise removal, static noise correction, size correction, noise-source mapping, and environmental correction. A moving median filter was applied to the full-size flight SPL spectrum in Section 4 so that the broadband and monotone noise components could be extracted and broadband and monotone syntheses could be performed, respectively.
The noise data for a 110° noise-source pointing angle is shown in Table 1.

Table 1.
Noise data for a 110° noise-source pointing angle.
4. Auralization
When sound is evaluated, it is usually analyzed at three levels: physical, perceptual, and cognitive. Comprehensive acoustic metrics, such as the effective perceived noise level (EPNL), quantify the noise level at the physical level, providing a numerical assessment of the noise, but do not reflect the listener’s intuitive perception [18]. For example, two noise events at the same EPNL may give completely different auditory perceptions. Typically, the analyses of dimensions such as the frequency, sound pressure, and time course, which are performed only at the physical level, provide objective, complete, and neutral assessment methods that do not provide a ground-level listener’s perception. However, the ultimate purpose of research on sound is to serve people. Audible technology transforms acoustic predictions into audible sounds and can analyze the noise at the cognitive level, making up for the shortcomings at the level of an exclusively numerical analysis and increasing the subjective evaluation.
The human ear has different sensitivities to different frequencies, where the one-third-octave frequency band is more reflective of the perceptual characteristics of the human ear than the octave frequency band; therefore, the International Organization for Standardization has adopted the one-third octave as the recommended standard. To better evaluate the impact of noise on human beings and ensure the comparability and consistency of noise data calculated using different methods, this study used the one-third octave to analyze the noise data.
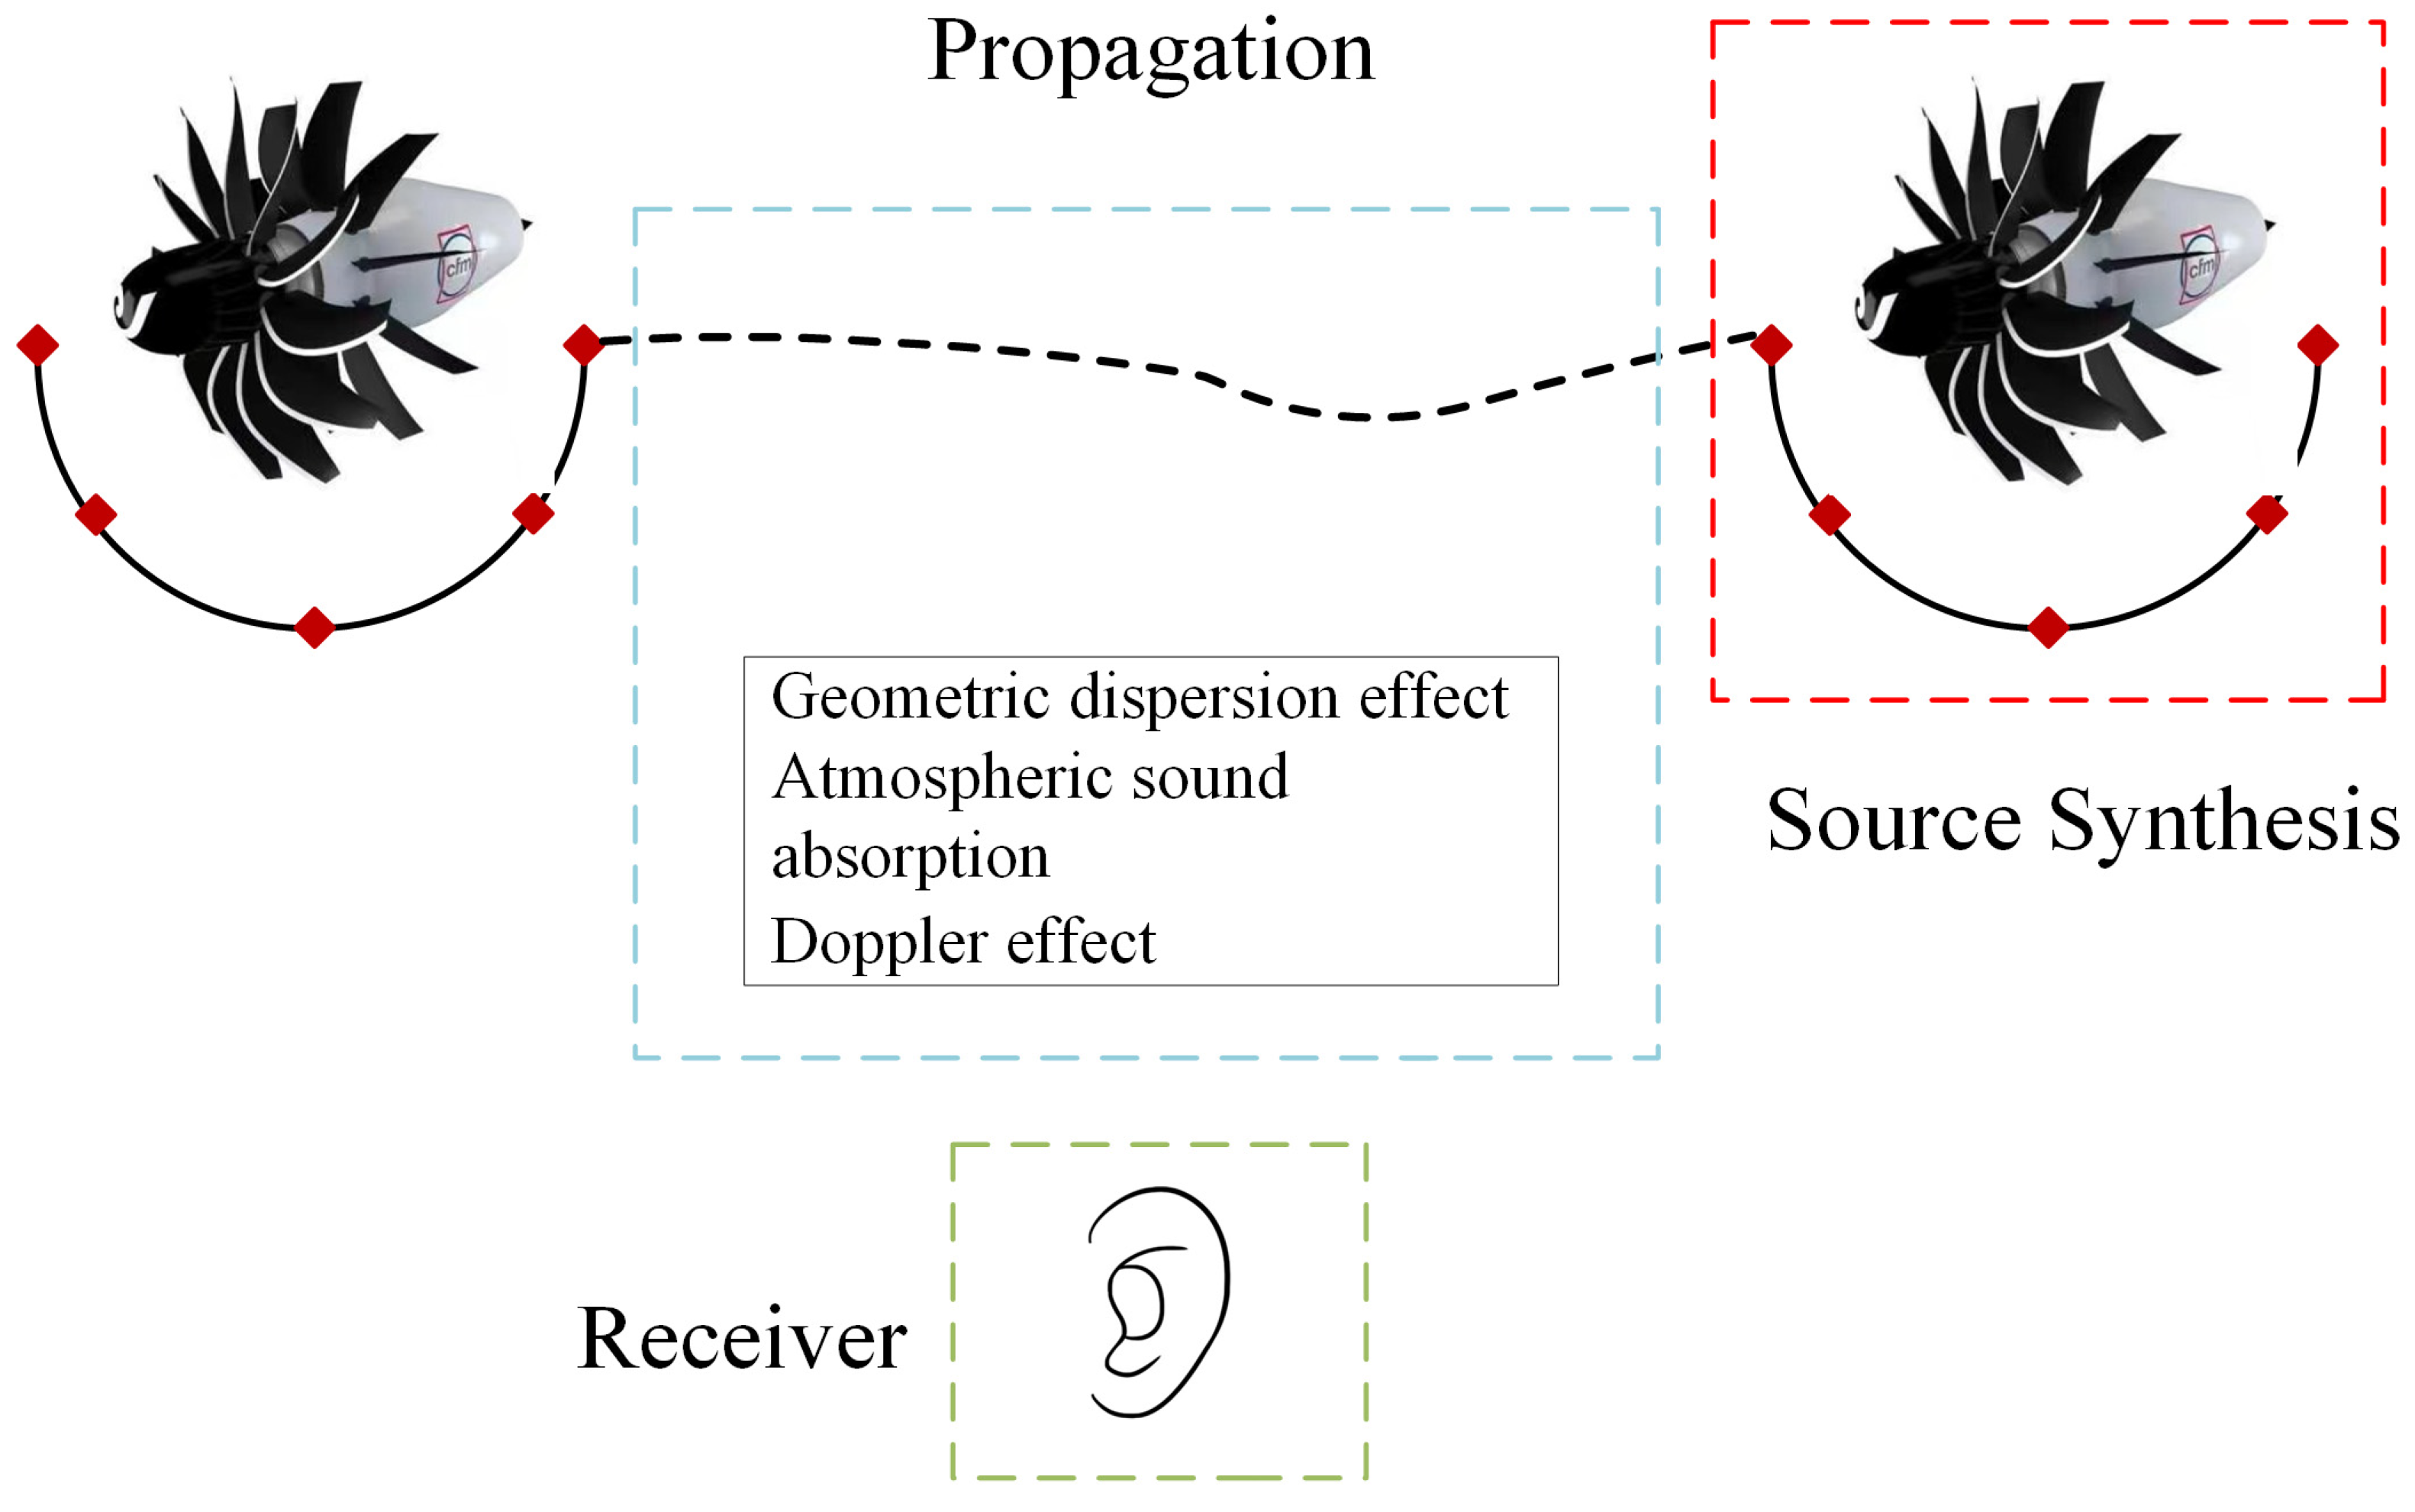
Auralization refers to the reproduction of a specified acoustic environment via digital sound simulation using headphones or loudspeakers. It centers on simulating the propagation and reflection properties of sound to reproduce the auditory experience in an environment. This study considered the noise along each directivity angle propagation path and corrected for Doppler, atmospheric absorption, geometric dispersion effects, and the receiver was a human ear or microphone (Figure 8). The red square area represents the noise source synthesis part, the blue square area represents the noise propagation correction method, and the green square area represents the receiver form.
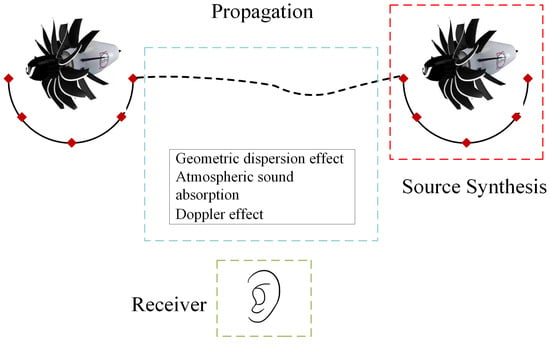
Figure 8.
Source synthesis, propagation path and receiver setting.
In the case of open-rotor engine noise, if only the physical properties of the noise are analyzed, it is impossible to convey the subjective feeling of the sound. Through auralization, the noise can be reproduced intuitively so that the listener can directly feel the characteristics of the noise, and thus, gain a more comprehensive understanding.
4.1. Extraction of Broadband, Monotone Noise
The noise from an open-rotor engine in flight is complex, with a variety of monophonic and broadband components. If an entire broadband spectrum is treated as incoherent noise, even if the synthesized sound power spectrum is the same as that of the original sound, the synthesized sound quality may not be good enough to accurately reproduce the details and characteristics of the sound. Therefore, monophonic noise should be regarded as coherent noise, i.e., the harmonics maintain a certain relationship in time and frequency, and broadband noise as incoherent noise, i.e., there is no fixed phase relationship between the sound components.
A shifting median filter smooths data by shifting through a set of data points and applying a median calculation. In sound signal processing, this method can be used to identify and filter out outliers or peaks to extract broadband noise components.
For each sample point, the filter output is :
where is the original signal, n is the signal sampling point, the size of the moving window is 2k + 1, k is the number of sampling points contained on both sides of the moving window, the total number of windows is 2k + 1, and median represents the median of all the data points in the calculation window.
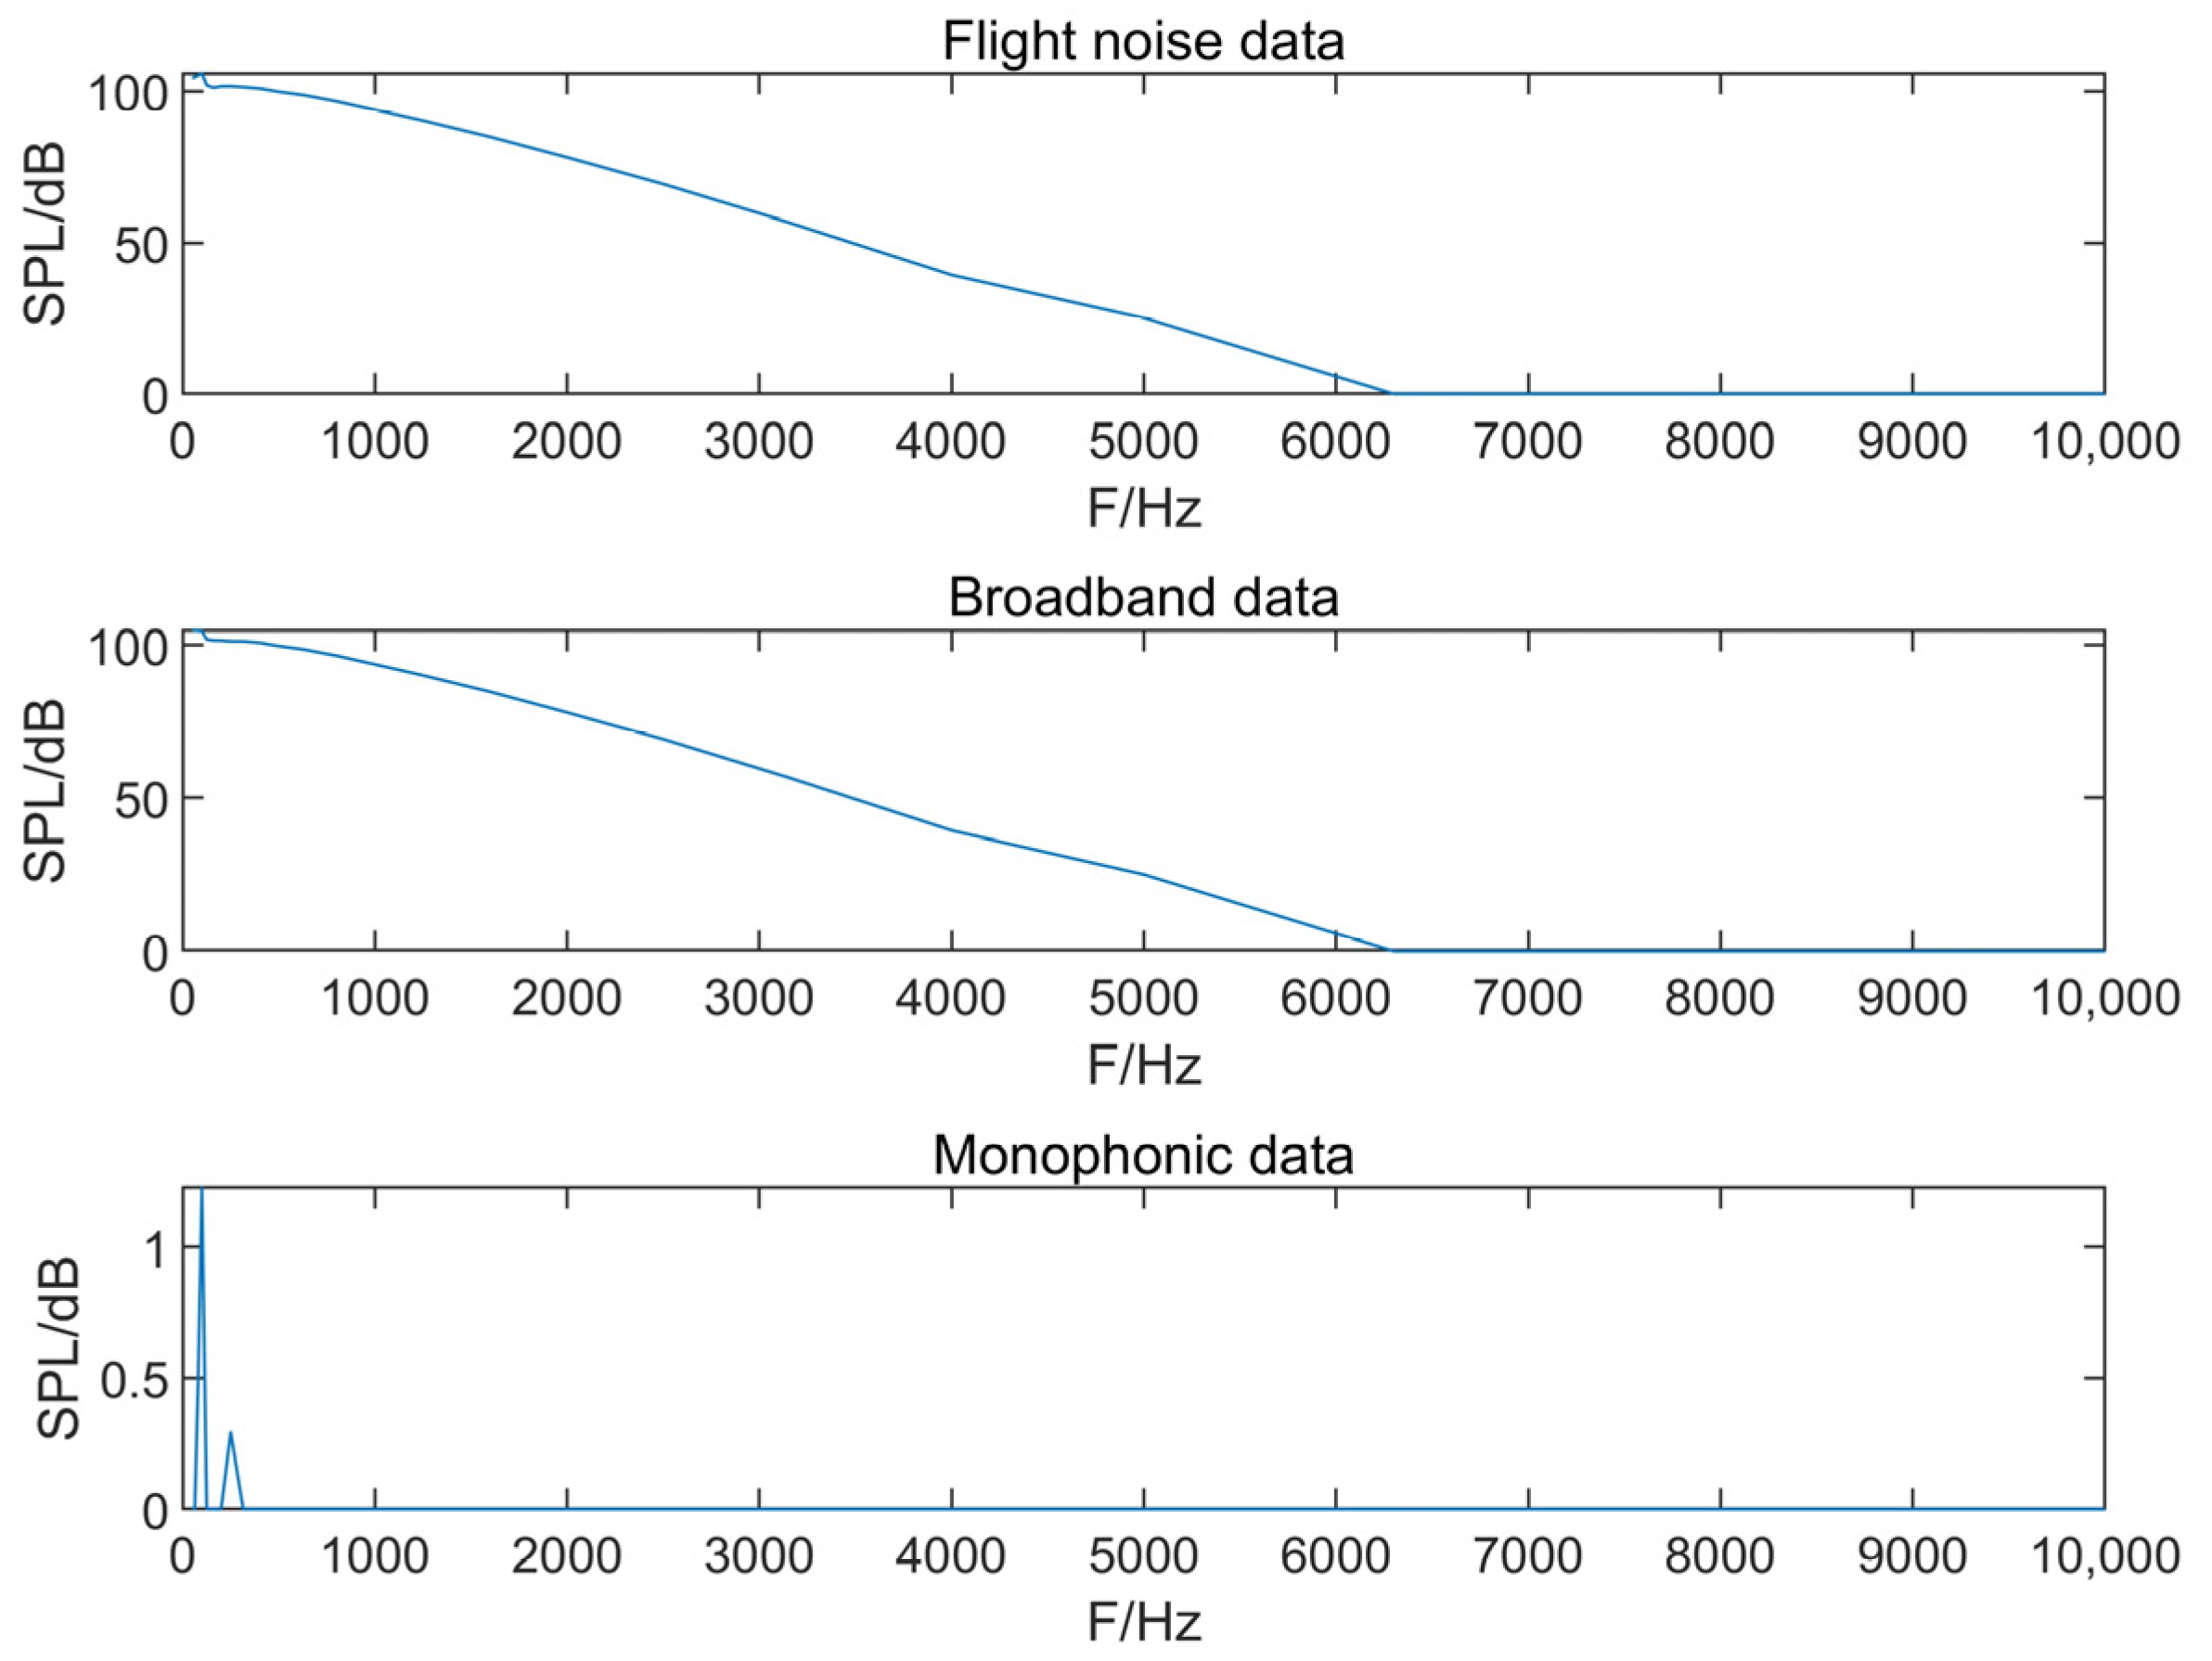
The filter was applied to the full-size flight sound-pressure-level spectrum; spectral lines that exceeded the median value were replaced with the median value so that the broadband component spectrum was obtained after processing, and the monophonic component spectrum was obtained by subtracting the broadband component spectrum from the full-size flight sound-pressure-level spectrum. The broadband and tone noises were synthesized as separate components, where this separation of the synthesis helped to precisely control the constituent components.
The broadband and monophonic components were extracted from the complex noise data of the flight state using a moving median filter, and then the broadband and monophonic syntheses of the flight state noise data were separately performed.
Figure 9 shows the noise characteristics of the wide-frequency and monotone components of the complex noise in the flight state, where the wide-frequency component was more prominent in the frequency range of (0, 60,000) Hz when the noise-source pointing angle was 110°, while the monotone component was more significant in the frequency range of (0, 2000) Hz.
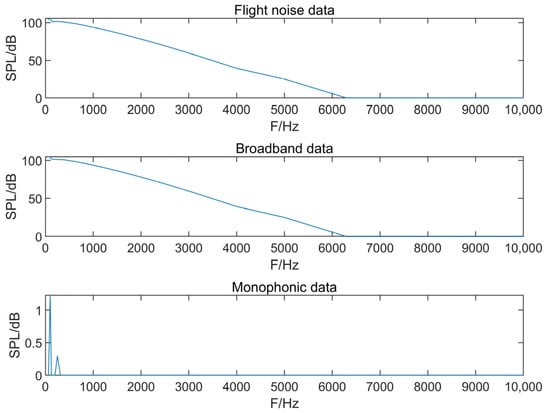
Figure 9.
Broadband and monophonic filtering results.
4.2. Broadband Synthesis
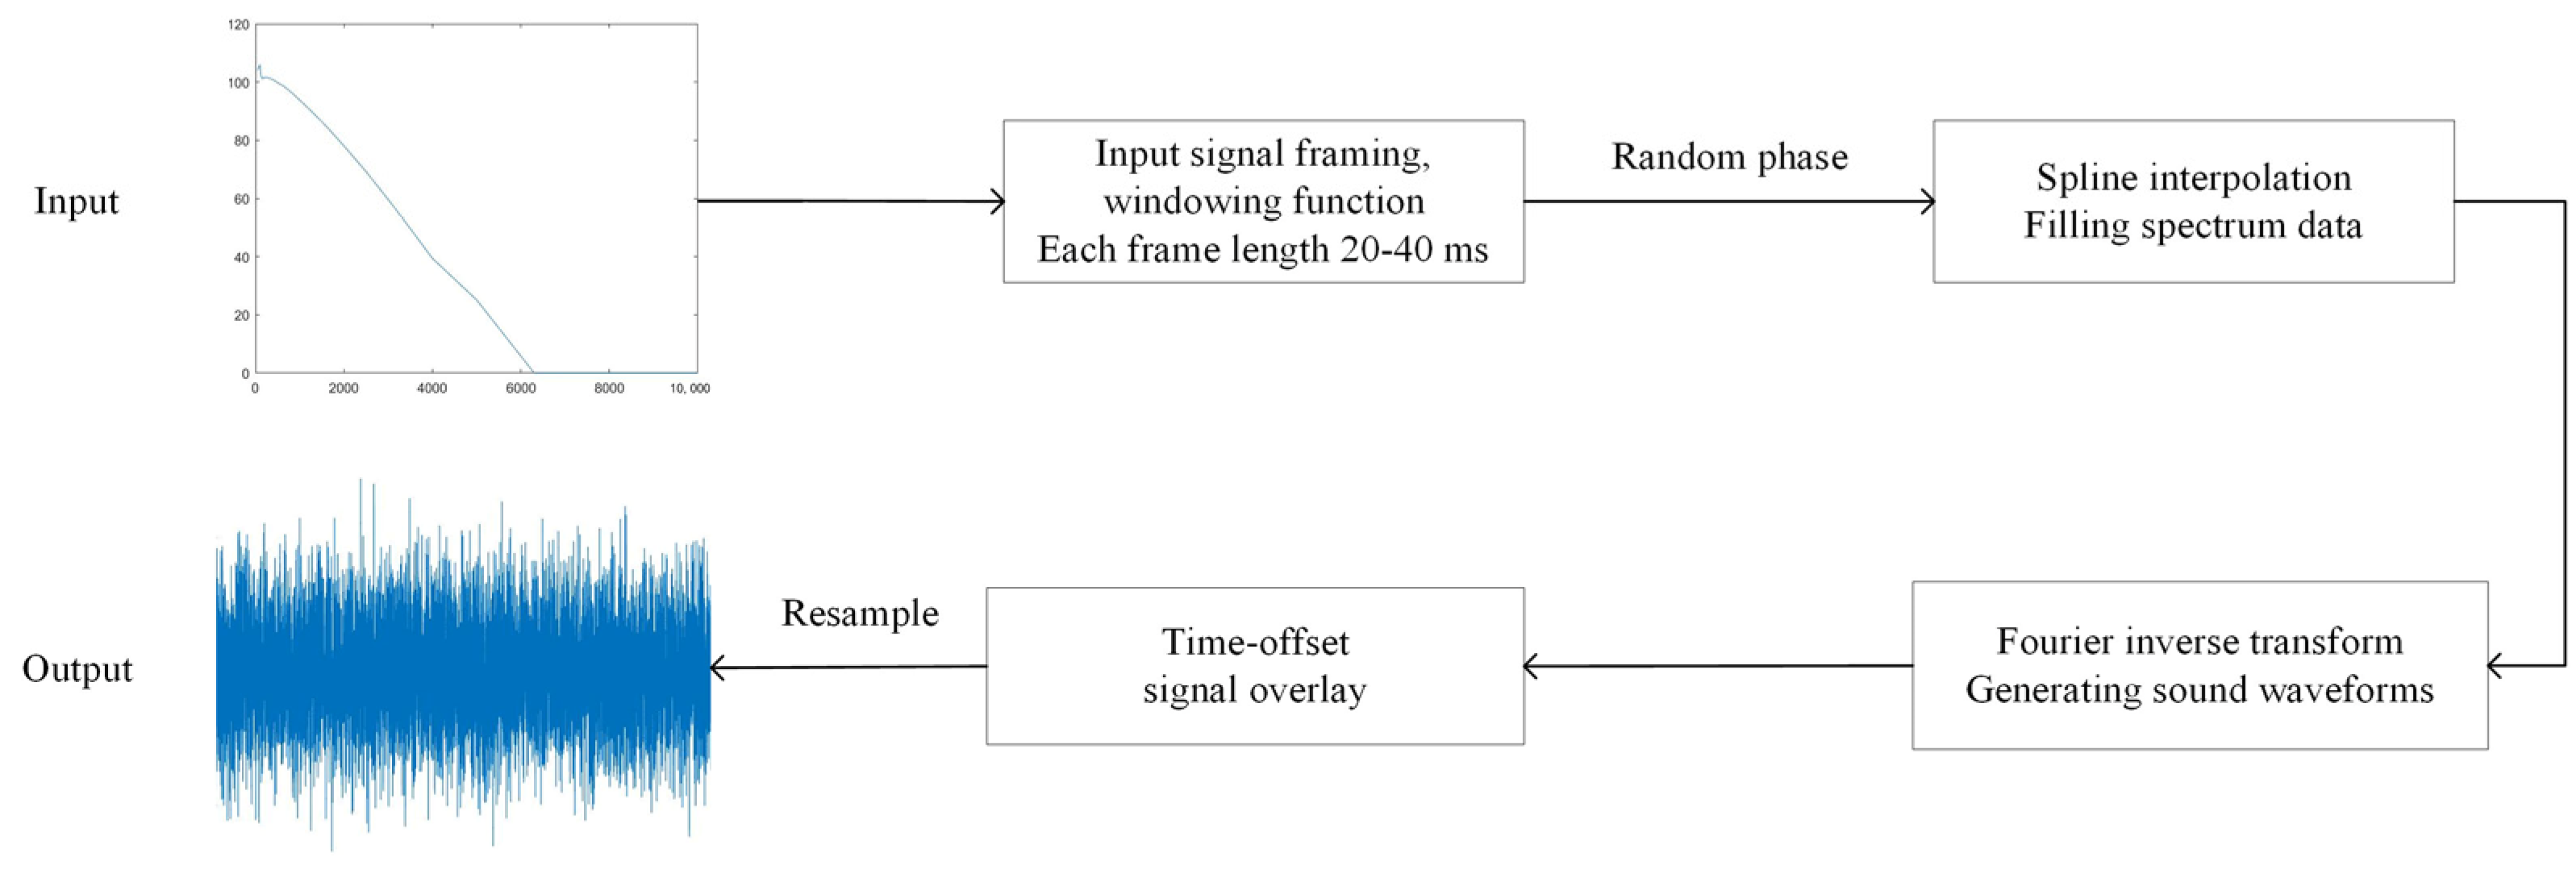
Broadband synthesis is a sound synthesis technique used to generate broadband sound signals. Unlike narrowband signals, which contain only a single frequency component, broadband signals contain multiple frequency components and, therefore, more realistically simulate environmental sounds. The broadband synthesis used in this study is a derivative technique that was developed based on a source spectrum specified by a one-third-octave bandwidth. This synthesis method employs a subtractive synthesis operation via an overlapping procedure. The synthesis process is shown in Figure 10.
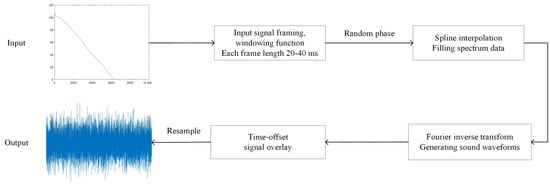
Figure 10.
Broadband synthesis.
- A. Signal Framing and Windowing
The input broadband signal was processed in frames, each of which was between 20 and 40 milliseconds long, which is a short period of time that can usually be considered smooth and conducive to analysis. Each frame was independently processed and then reorganized to form the final broadband signal. Before the Fourier transform was applied to each frame, it needed to be windowed to minimize the leakage effect. Commonly used window functions include the Hanning window, Hamming window, and rectangular window.
The expression of the window function is as follows:
where N is the window length and n is the sample index in the time frame.
- 2.
- B. Signal Interpolation
For each processing block, the instantaneous narrowband source spectrum was first obtained using interpolation methods, such as linear interpolation or spline interpolation; this could fill the gap in the spectral data to generate higher-resolution spectral data. The interpolation formula is
where is the interpolated data, is the sampling frequency, and is the interpolated frequency.
- 3.
- C. Random Phase Assignment
After obtaining the instantaneous narrowband source spectrum of each processing block, a random phase was assigned to each narrowband frequency component. A random phase can be realized by generating uniformly distributed random numbers. This step was undertaken to simulate the randomness and complexity of real-world sound; in natural sound, different frequency components often have different phase relationships.
Combining the amplitude and random phase of each frequency component generates spectral data in a complex form expressed as follows:
where is the amplitude of the frequency components and is the random phase generated by the random number.
- 4.
- D. Fourier Inverse Transform
The obtained complex function was Fourier-inverse-transformed (ifft) to obtain the pressure time course by converting the frequency-domain signal back to the time-domain signal. Using the Fourier inverse transform, the sound waveform corresponding to the period was generated, denoted as
where is the time-domain signal, is the frequency-domain signal, N is the signal length, and n is the time index.
Each processing block represented a period in the sound signal. These blocks were not completely continuous and were designed to partially overlap with the previous block to ensure a smooth transition between blocks and avoid discontinuities or abrupt changes in the processing. In the overlapping region, the smoothness of the transition is ensured by weighted averaging, where the commonly used weighting functions are triangle weighting and Hanning weighting, and the weighted signal segment is superimposed with the output period of the previous processing block to form a continuous sound signal.
- 5.
- E. Time Offset and Signal Superposition
The processed output timings were added to the output timings of the previous block with a time offset corresponding to the amount of overlap. The continuity and smoothness in the synthesized signal were ensured by the precise time offset and overlap. While the signal superposition involved the superposition processing of the newly generated signal with the previous block, this step directly affected the quality and naturalness of the final signal. The formula for signal superposition is
where is the new signal after the superposition, is the new signal, is the old signal, and is the weighting factor.
- 6.
- F. Resampling
After synthesizing in the above steps, the final broadband signal was resampled by performing resampling, which converts an audio signal to a target sampling rate to make the synthesized audio compatible with standard audio playback devices. This process uses high-precision interpolation, such as band-pass filtering and polynomial interpolation, to minimize potential quality loss and ensure the high fidelity of the final output signal. The resampling is given by Equation (23):
where is the resampled signal, is the new sampling rate, and is the old sampling rate.
4.3. Monophonic Synthesis
Monotone synthesis is performed in the time domain using an additive technique, where the basic idea is to synthesize multiple simple sinusoids by adding them together. In general, each monophonic signal is represented as a cosine wave with an amplitude and frequency representation. The initial phase of each harmonic is randomized to avoid generating mechanical, repetitive sounds.
In monophonic synthesis, the sound signal is segmented into several contiguous blocks, or frames, and a jump size, i.e., the duration of each block, is assigned to each block. Synthesizing the pressure time course in this way makes it easier to manage and process the sound data. In each block, the frequency and amplitude change over time.
Let the monophonic signal to be synthesized be given as
where is the amplitude of the harmonic, is its frequency, is the initial phase, and N is the total number of harmonics.
To achieve a continuous waveform, phase continuity between subsequent blocks is required. This means that the end phase of one block and the start phase of the next block must be aligned to avoid abrupt changes in the sound due to a phase discontinuity between the blocks.
Assuming that the length of each block is T, the phase of the nth harmonic at the end of the kth block is
where is the initial phase of the nth harmonic.
In practical applications, such as synthesizing noise from an engine, the frequency and amplitude usually remain constant under a single operating condition (e.g., the engine is running in a steady state). However, when the operating conditions change (e.g., the engine accelerates or decelerates), the frequency and amplitude may change, and it is then necessary to adjust the frequency and amplitude in each block in real time.
The total noise is obtained by summing all the individual tones. This step involves superimposing the waveforms of each synthesized monotone to form the final sound signal, which reflects the overall contribution of all the components. Although monophonic synthesis can be performed at any sample rate, regardless of frequency, the broadband synthesis sample rate is usually used for consistency. After the synthesis is complete, the sound signal needs to be resampled to an audio sample rate of 44.1 kHz to ensure that it is adapted to most audio players.
In addition, to better simulate real complex sound environments, other factors are introduced into the monophonic synthesis, such as small frequency and amplitude fluctuations due to jitter and tremor. By introducing these small random variations in each block, an overly monotonous sound signal is avoided. Random variations are realized by different random functions or noise models.
When frequency and amplitude jitters are introduced, the signal can be expressed as
4.4. Noise Simulation
Three-dimensional audio technology can capture and reproduce sound in three-dimensional space, allowing the listener to feel the exact location and sense of depth of the sound source, as if they were in the real environment [10]. This experience is achieved by simulating the reception of sound by the human ear, considering the direction and distance of the sound, as well as the effect of the environment on the sound.
Furthermore, 3D audio technology plays a crucial role in extended reality, as it enhances immersion and realism, providing a spatialized auditory experience where sounds appear as if they are emanating from a specific location in the real world [19]. By accurately modeling the direction and distance of the sound, it is possible to accurately locate the source of the sound in the virtual environment, enhancing the sense of reality.
The 3D audio technology foundation is spatial audio, which focuses not only on the frequency and temporal properties of sound but also pays particular attention to its spatial properties. This includes its directionality, the sense of distance, and the acoustic effects caused by environmental reflections and absorption. Through sophisticated algorithms and modeling techniques, 3D audio can accurately simulate these factors. For example, the head-related transfer function (HRTF), an important component of 3D audio technology, describes the frequency variations and time delays experienced by sound as it reaches the ear from different directions. This information is used to create realistic spatial sound effects, enabling the listener to distinguish where the sound is coming from [20]. Modern 3D audio technology is not limited to static sound localization, but also involves the concept of audio objects and scenes. Although in traditional audio systems, the sound signal is simply waveform data, in 3D audio systems, the audio signal also contains metadata about the location and movement of the sound source. This allows the system to dynamically render the sound during playback, adapting the audio to the position and orientation of the listener, further enhancing the realism of the spatial sound effects.
The measurement of noise airworthiness certification requires flight animation and the visualization of noise data as objects of the scene production and construction process, where the main content is composed of two parts: an open-rotor-engine-equipped A32X aircraft reduced-thrust trajectory flight animation and a noise data analysis 3D chart.
The noise-measurement flight test animation was produced by the animation system that comes with the Unity 3D platform, which provides abundant functions and tools to meet various animation needs in project development, from simple moving and rotating animations to complex character and special effect animations. The animation of this project was based on animation clips, which comprise animation data that contain a series of key frames that define the motion and transformation of an object in time. The animator component allows one to play, pause, and stop the animation, as well as set the speed, blend, and other properties of the animation.
A head-mounted unit, used to display the visual effects design, is a key technological tool in virtual scenarios that simulates a takeoff. This advanced virtual reality device, with its high resolution and wide viewing angle, can provide a realistic visual experience. In the virtual scene, a takeoff often contains a large amount of visual information, such as the acceleration of the airplane and the ground away from the clouds. These visual effects can be thoroughly reproduced through the device, and the observer can experience the details of the takeoff from a human perspective, which further enhances the flight environment experience. The audio sound design is also an important part of the enhanced experience. In this process, binaural playback technology is used to reproduce the spatial and directional sense of sound by simulating the way the human ear receives sound. This technology can not only accurately simulate the environmental noise in flight but also realistically reproduces the sound of the aircraft engine and other types of sound effects.
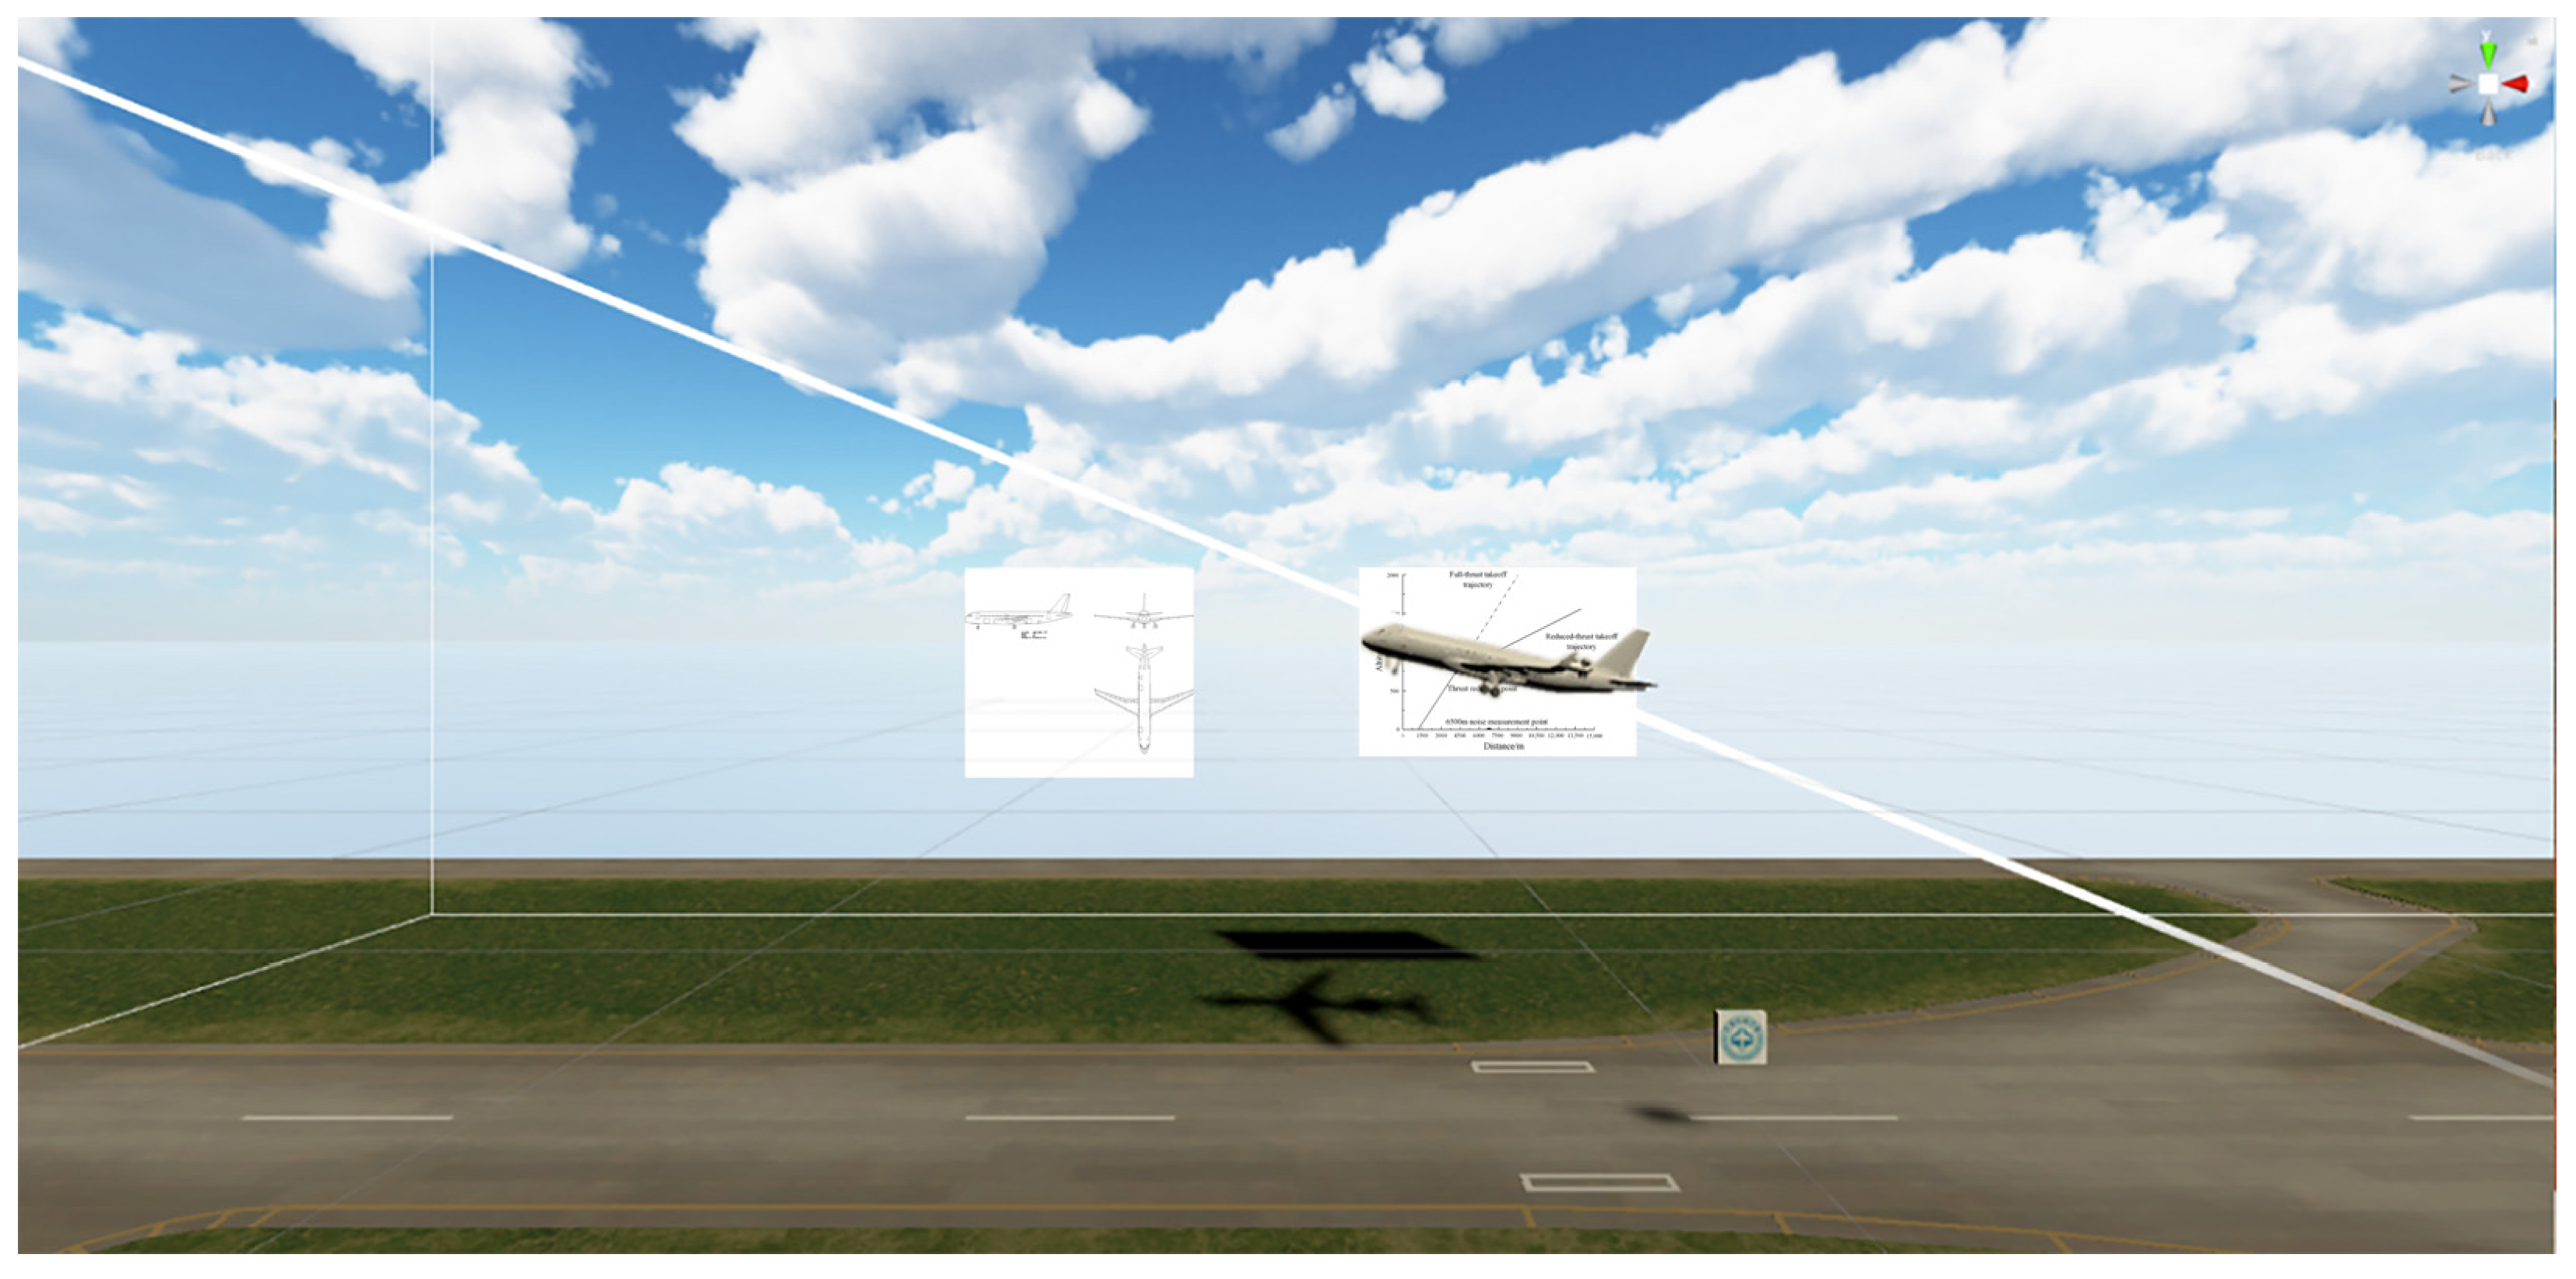
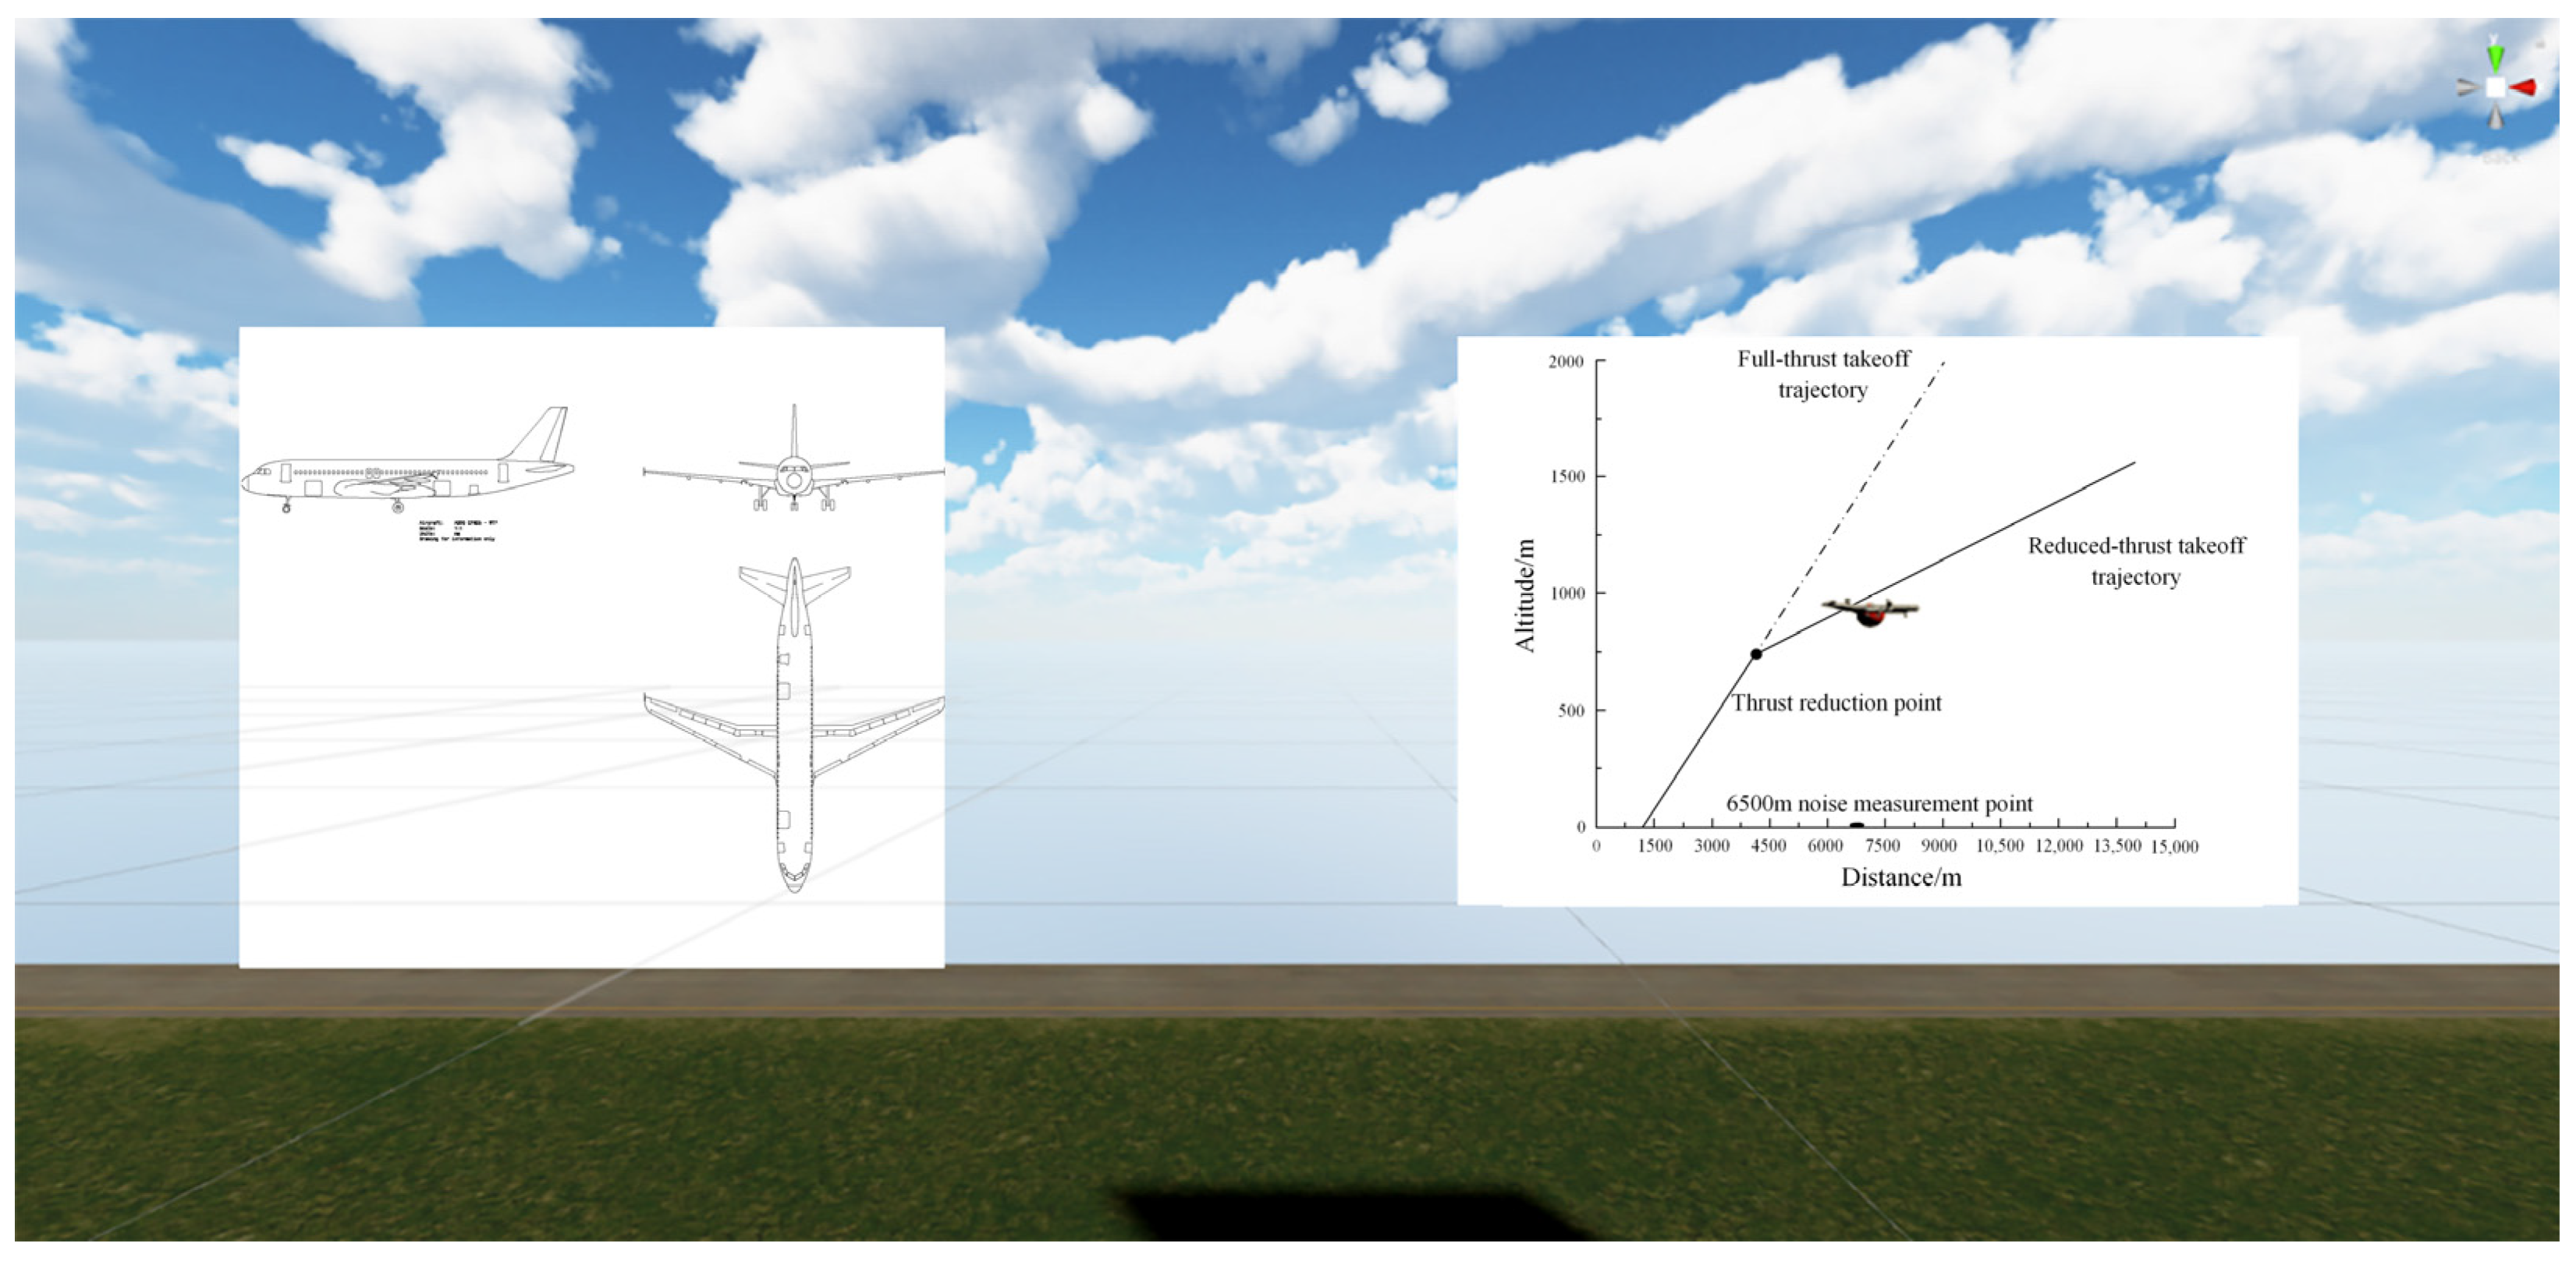
The use of the audio–visual combination can enhance the observer’s experience of the sound and environment through the use of a head-mounted display to demonstrate the visual effect design in the simulated takeoff and the binaural playback in the noise audio design. The flight environment simulation is shown in Figure 11 and Figure 12.
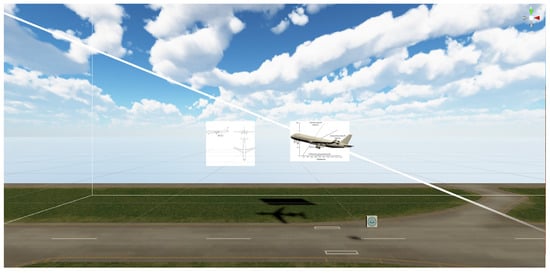
Figure 11.
Flight path simulated in a 3D virtual environment.
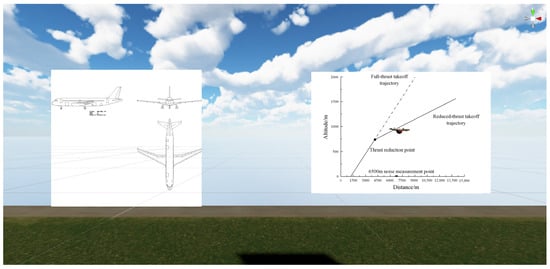
Figure 12.
The 110° angle noise-data audio realization point (at the red dot).
5. Visualization
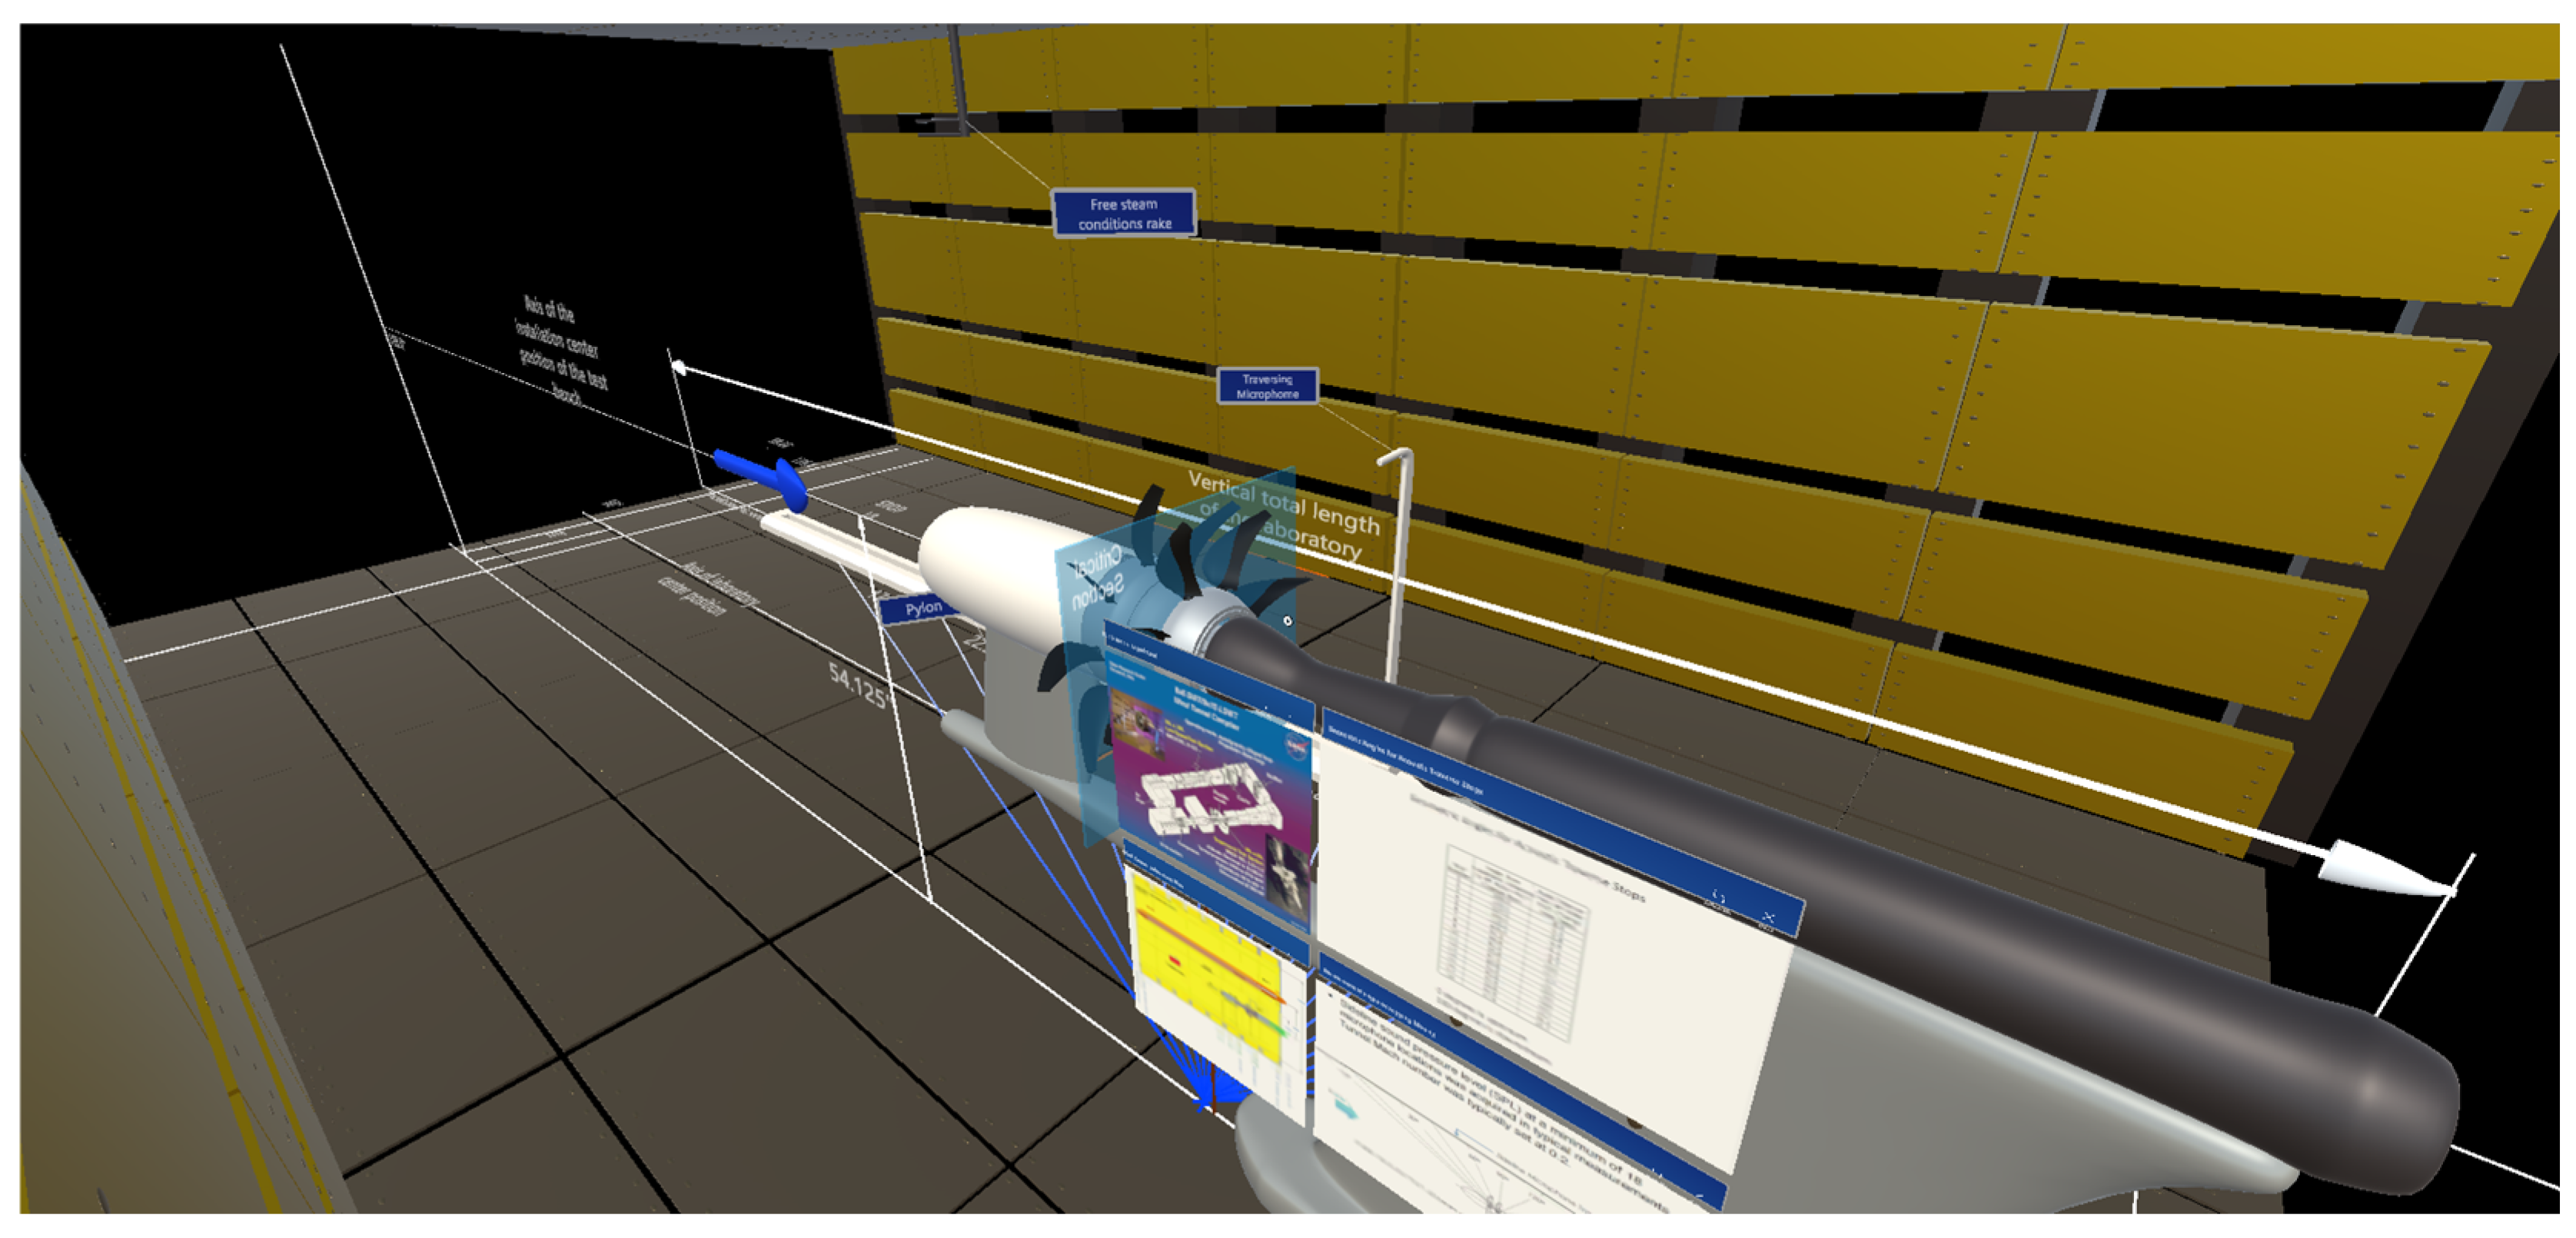
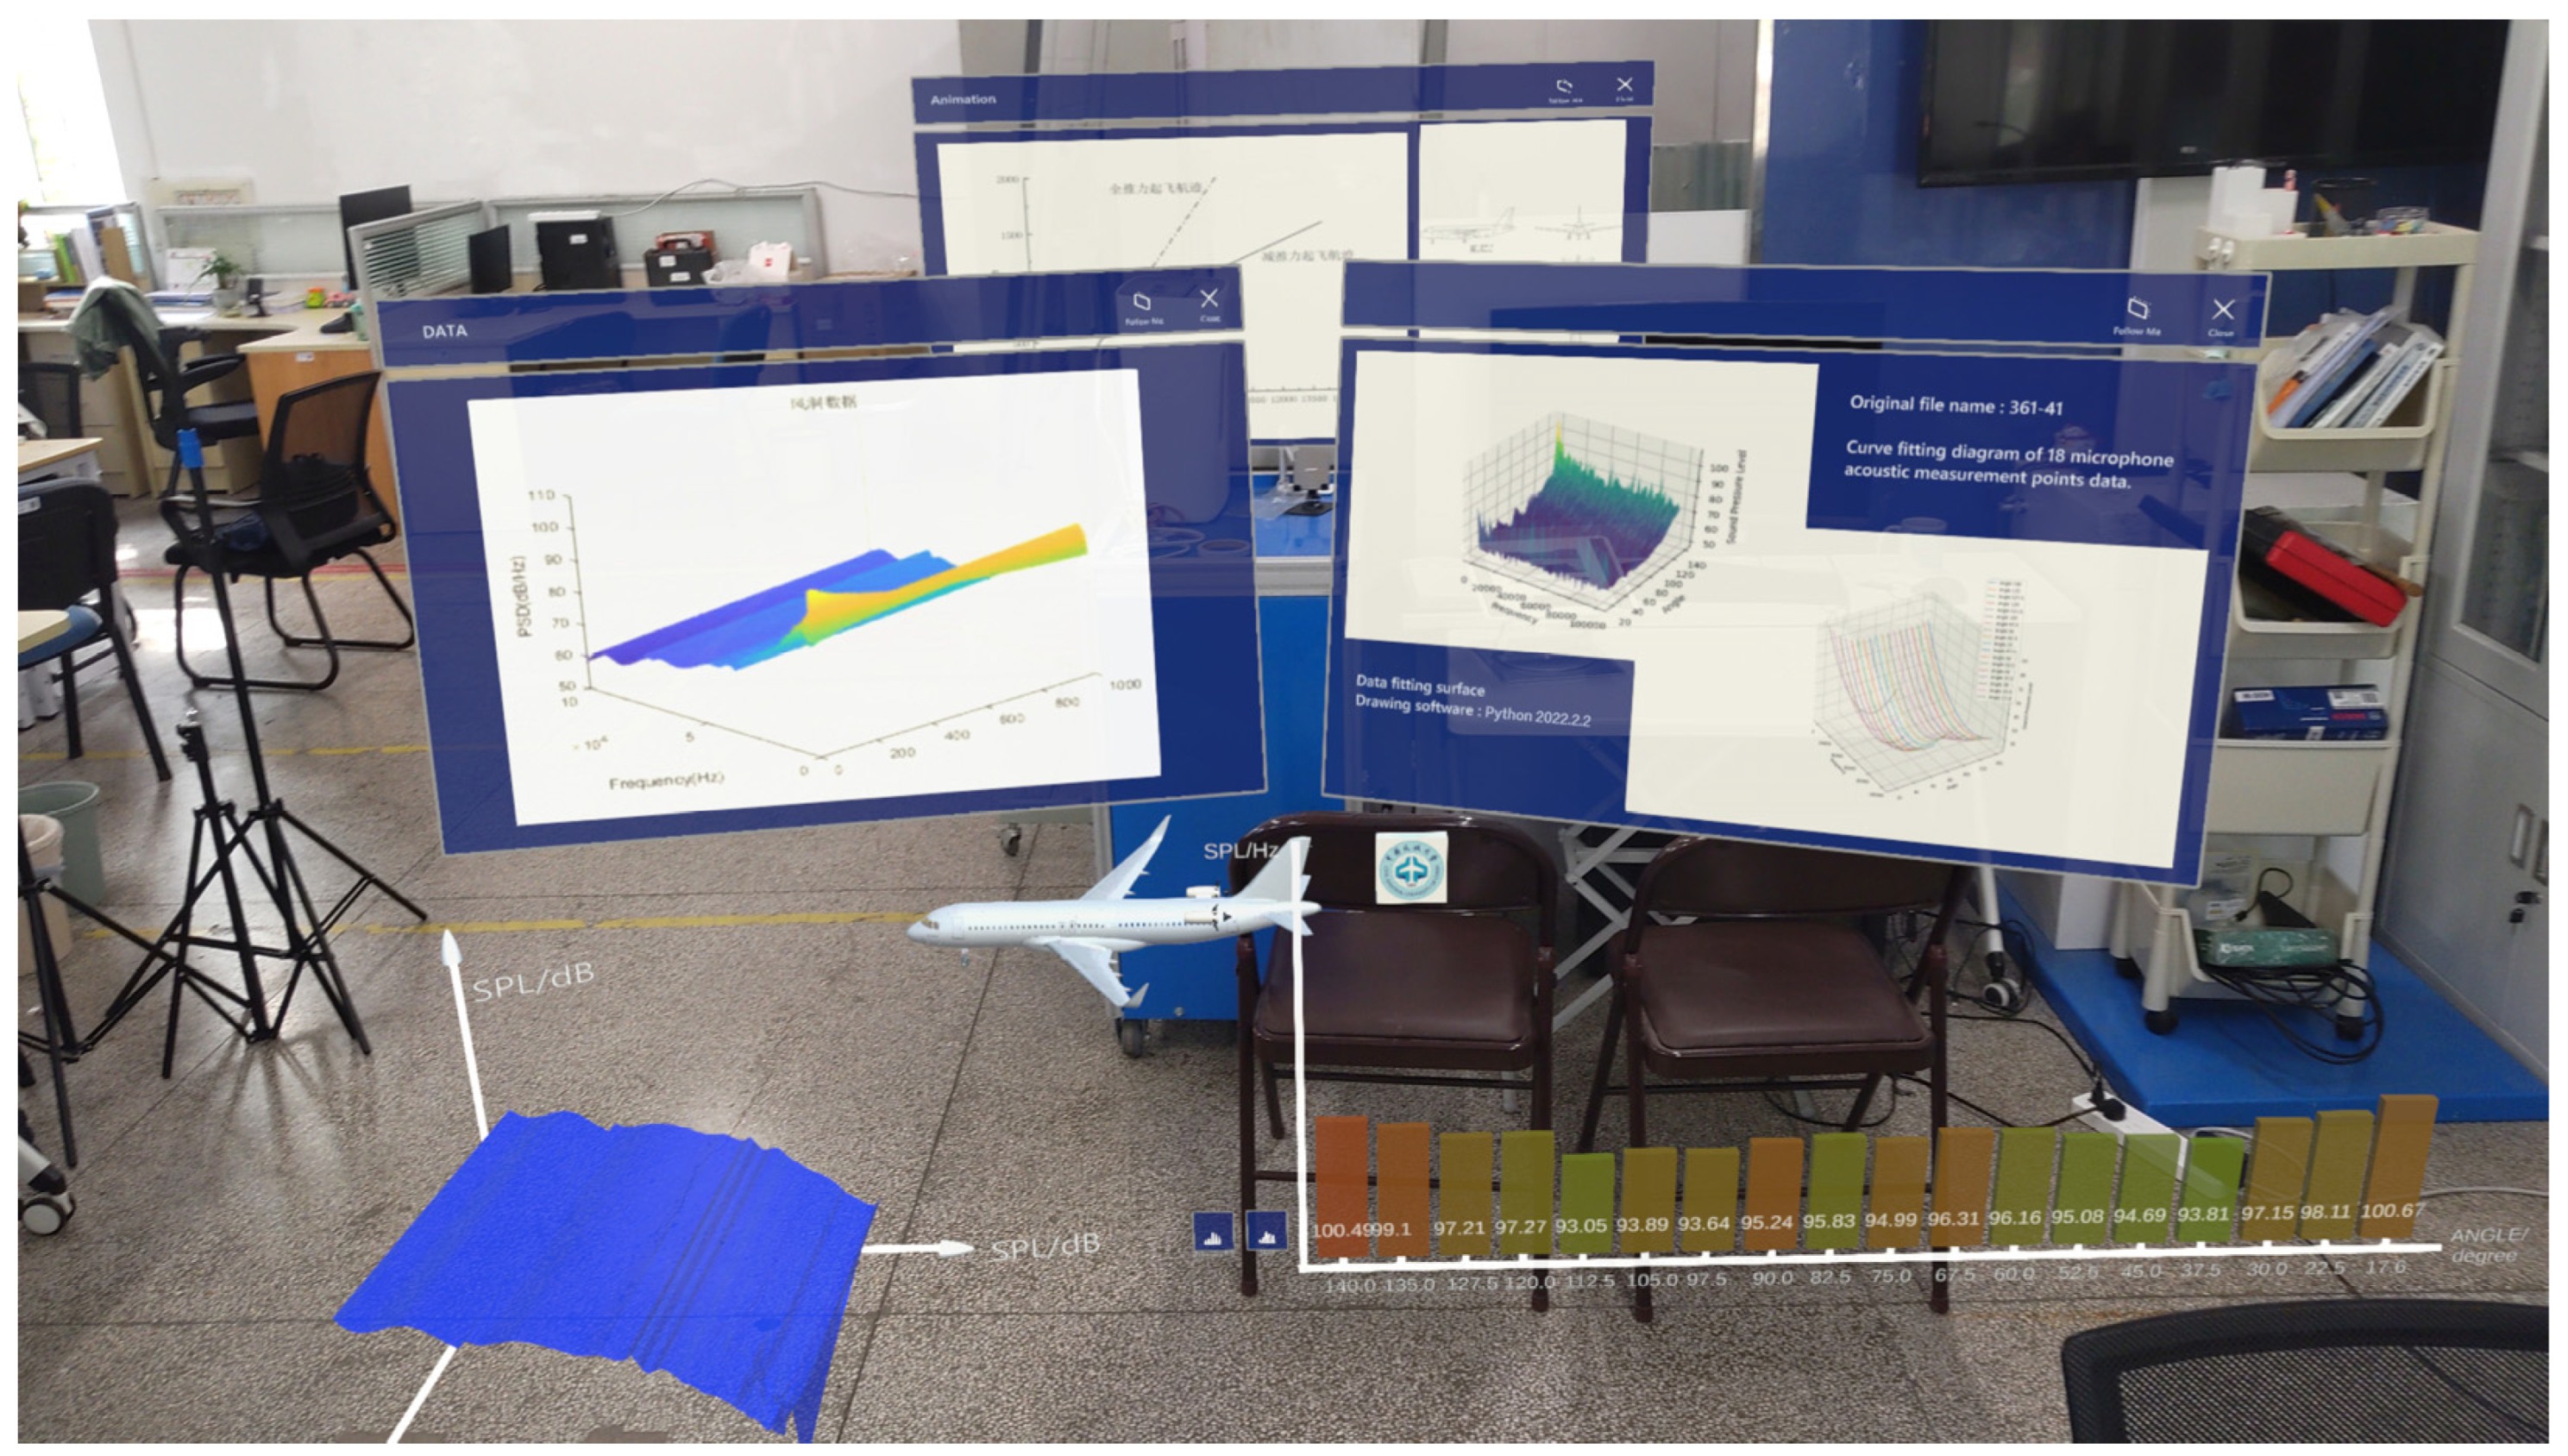
A Unity 3D scenario was created to simulate the wind tunnel experimental environment for acoustic research under standard environmental conditions, with the aim of providing the user with an intuitive and vivid understanding of the engine wind tunnel testing. The scenario mainly contained virtual holographic models of the wind tunnel test bench, microphone and microphone slide, dimensioning lines, open-rotor engine, and explanatory panels.
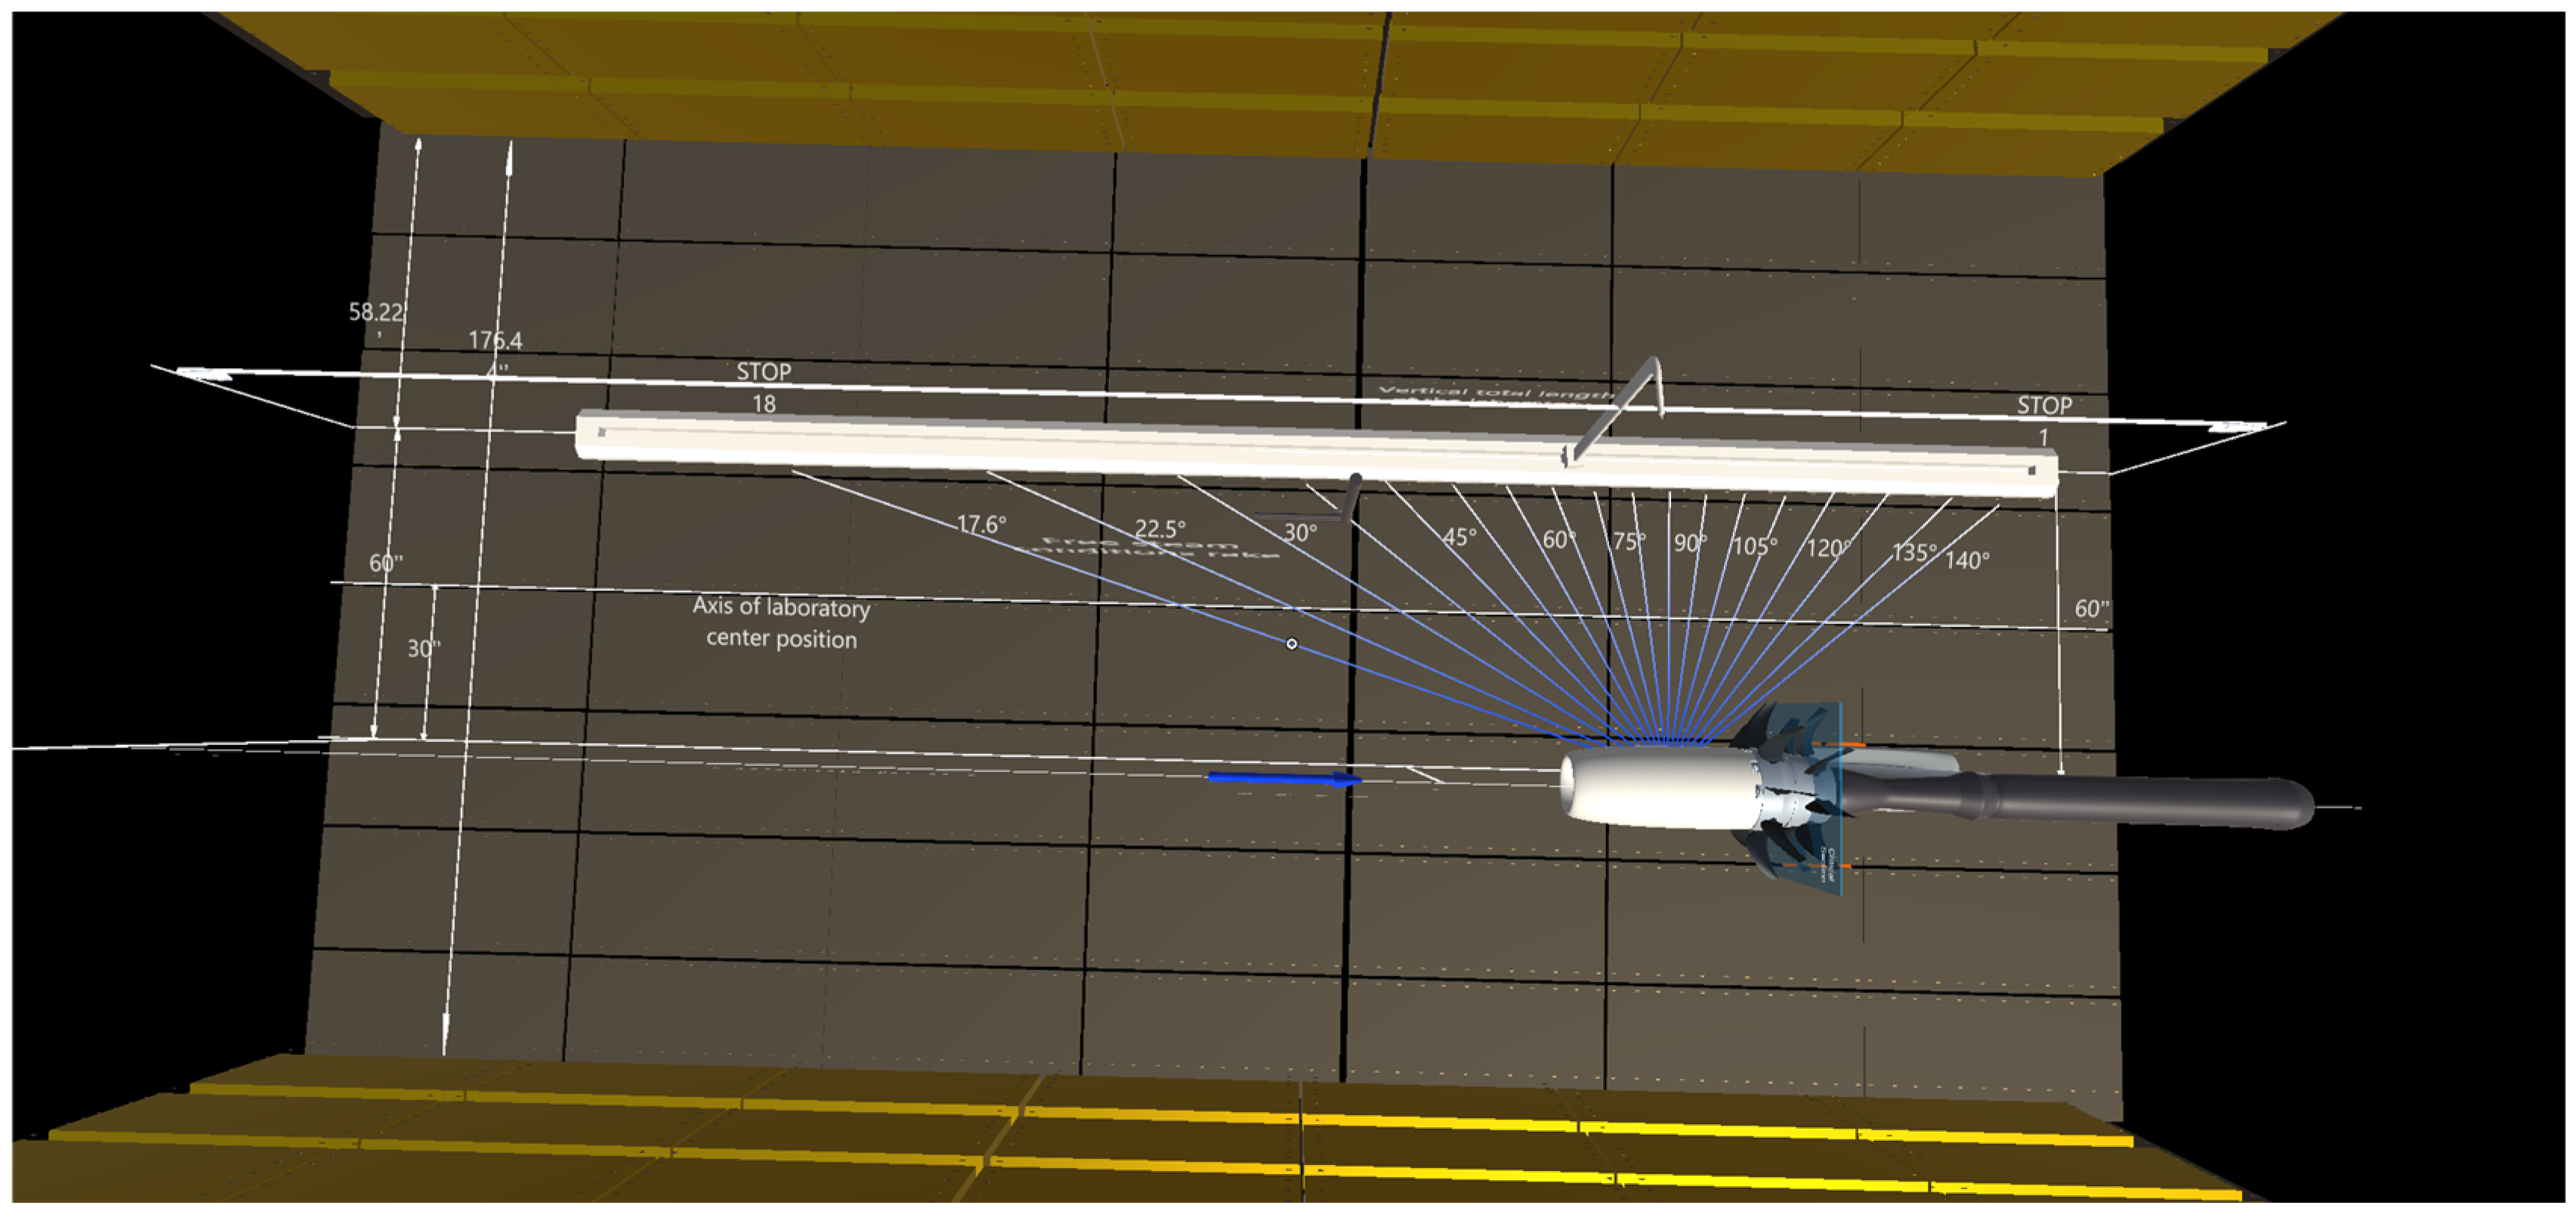
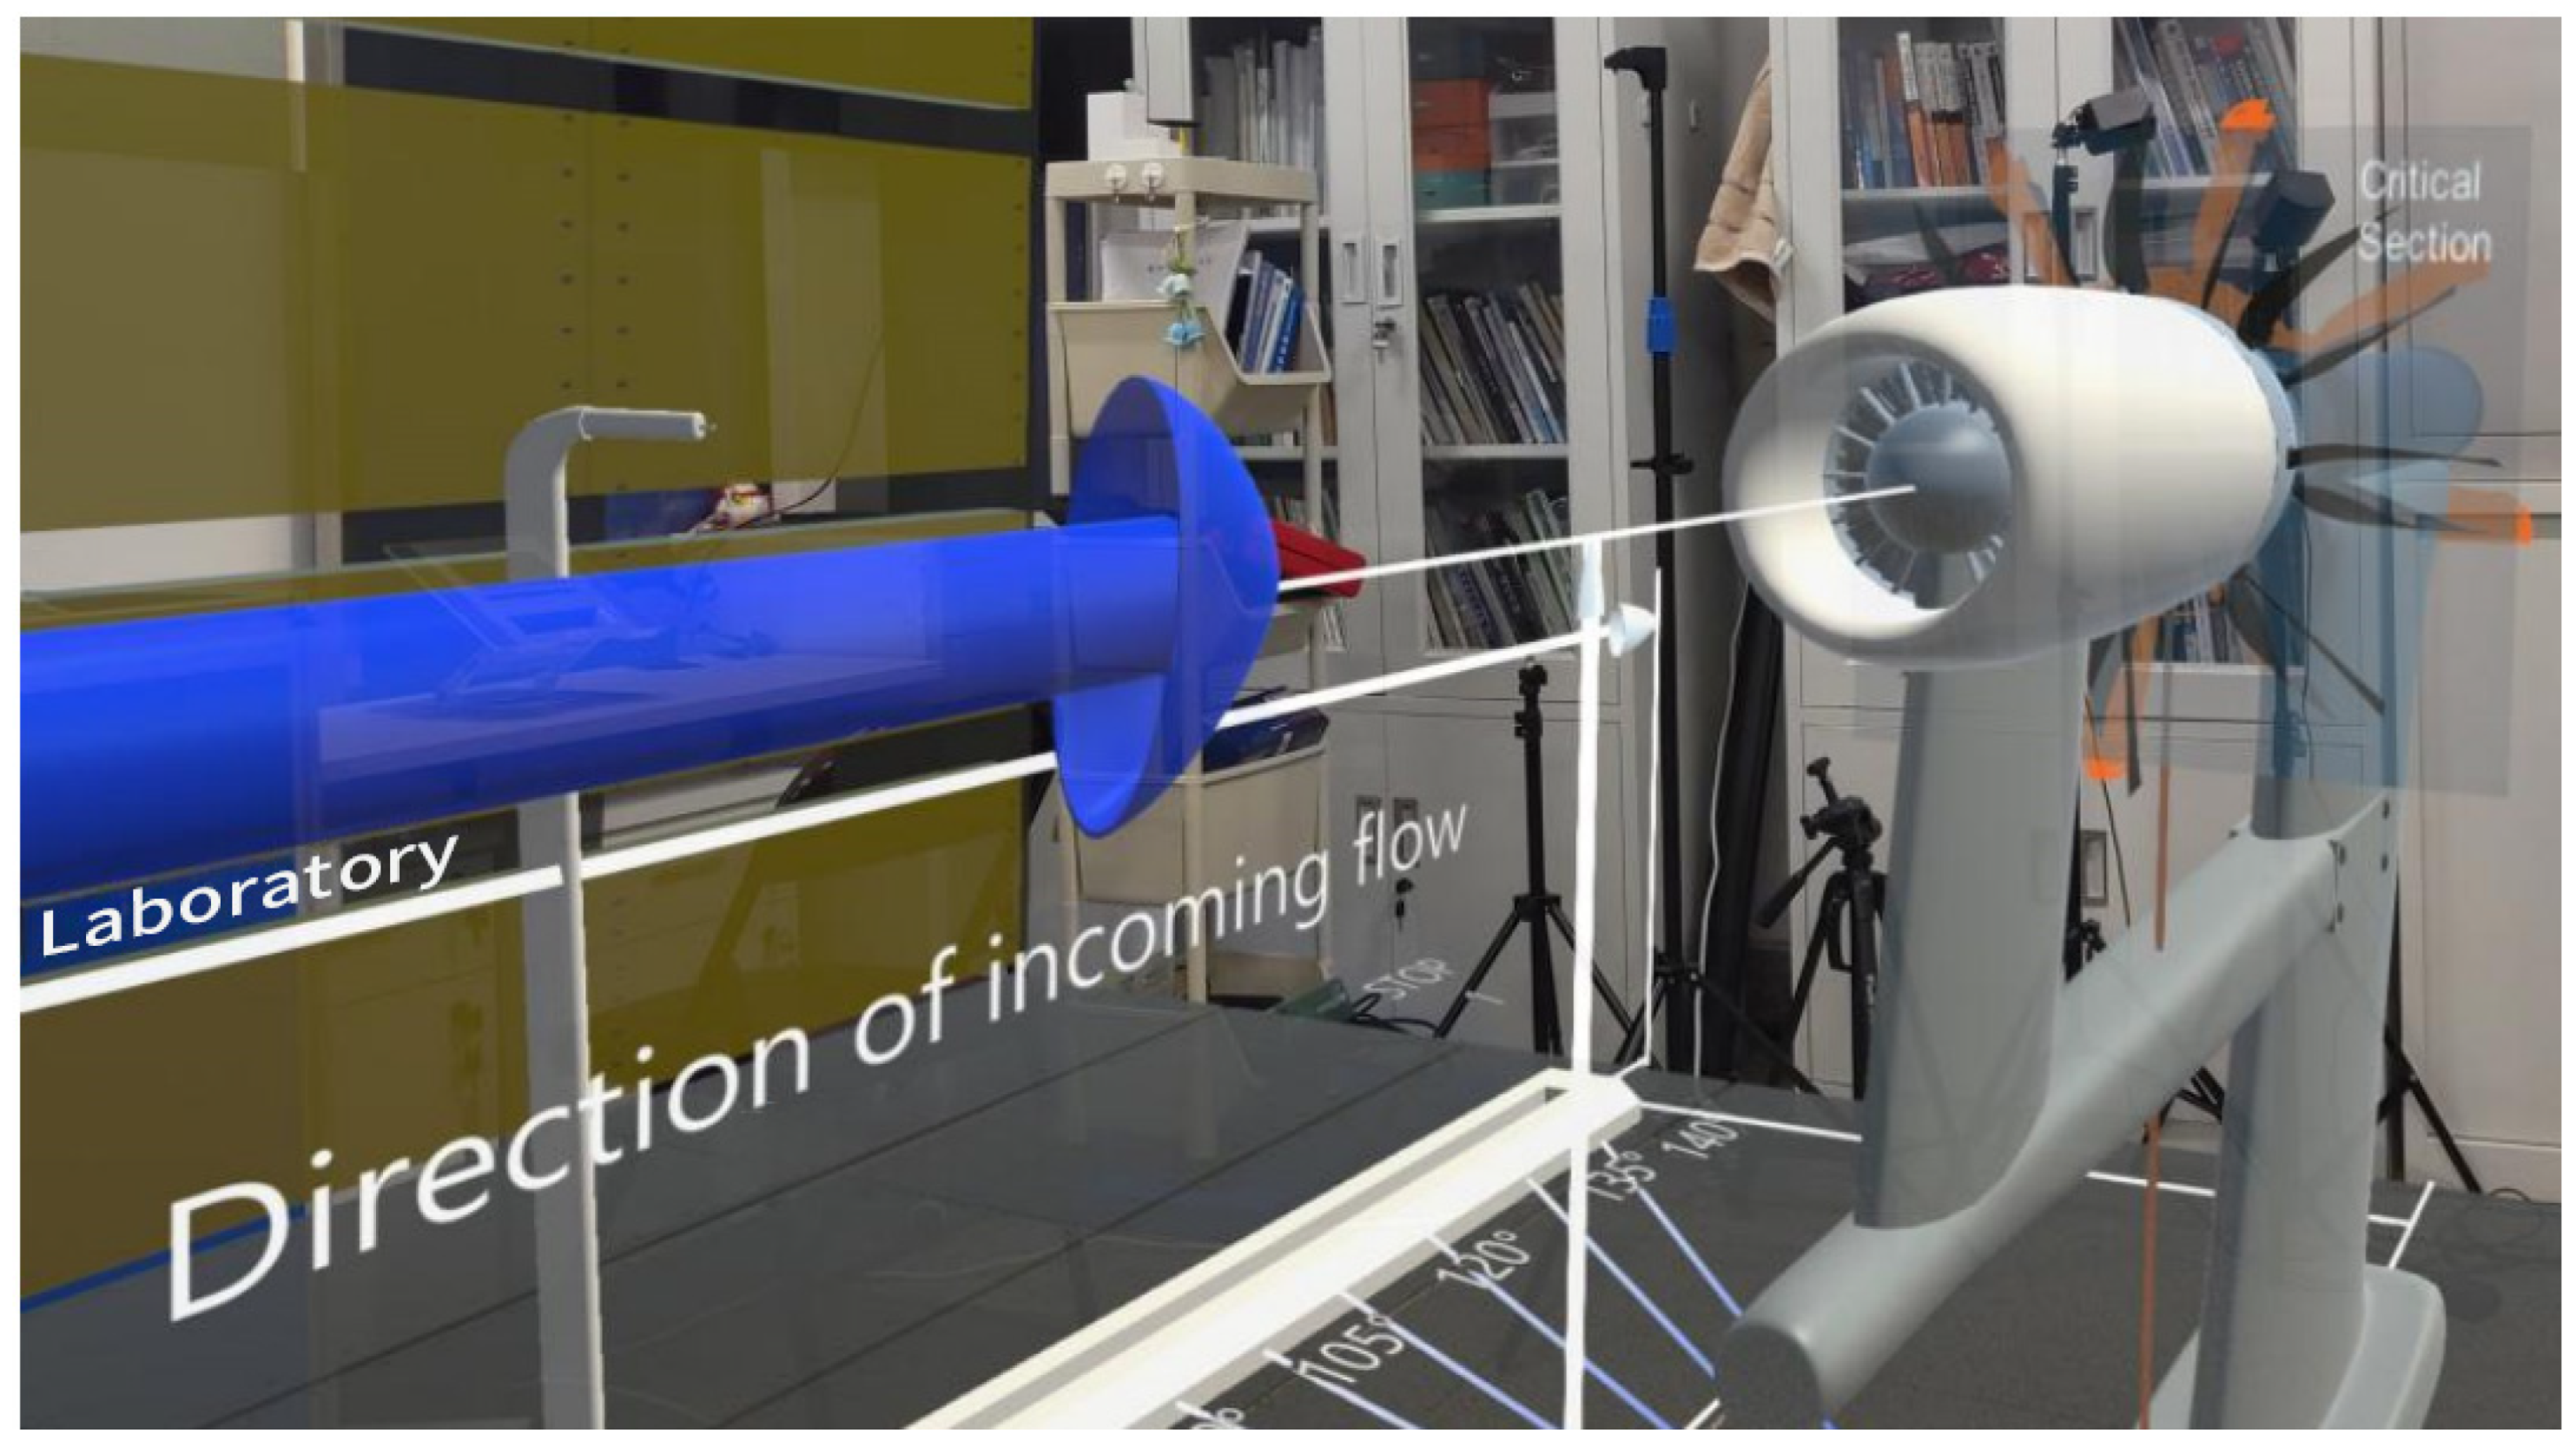
The total size of the test chamber was 344.00 × 176.44 × 108.00 ft. The placement of each component strictly followed the relevant documents in the 9 × 15 ft wind tunnel test report of NASA’s Green Experiment Center [19] and is presented in accordance with the design requirements of the mixed-reality application at an iso-scale of 1:0.6. The dimensional labeling lines indicate the direction of the incoming airflow when the test stand was in operation; the positional dimensional relationships between the test stand and the skid, the ground, and the central axis of the wind tunnel; and the angles between the 18 acoustic data measurement points and the center point of the cross-section of the engine’s aft paddle-fan pivot axis are clearly indicated in Figure 13 and Figure 14.
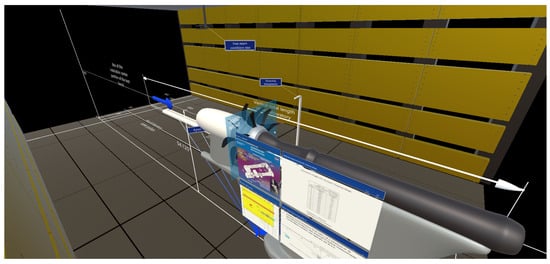
Figure 13.
Wind tunnel environment simulation.
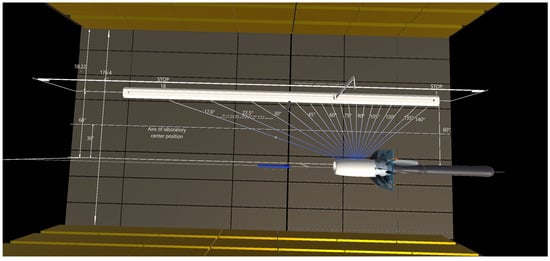
Figure 14.
Acoustic measurement position.
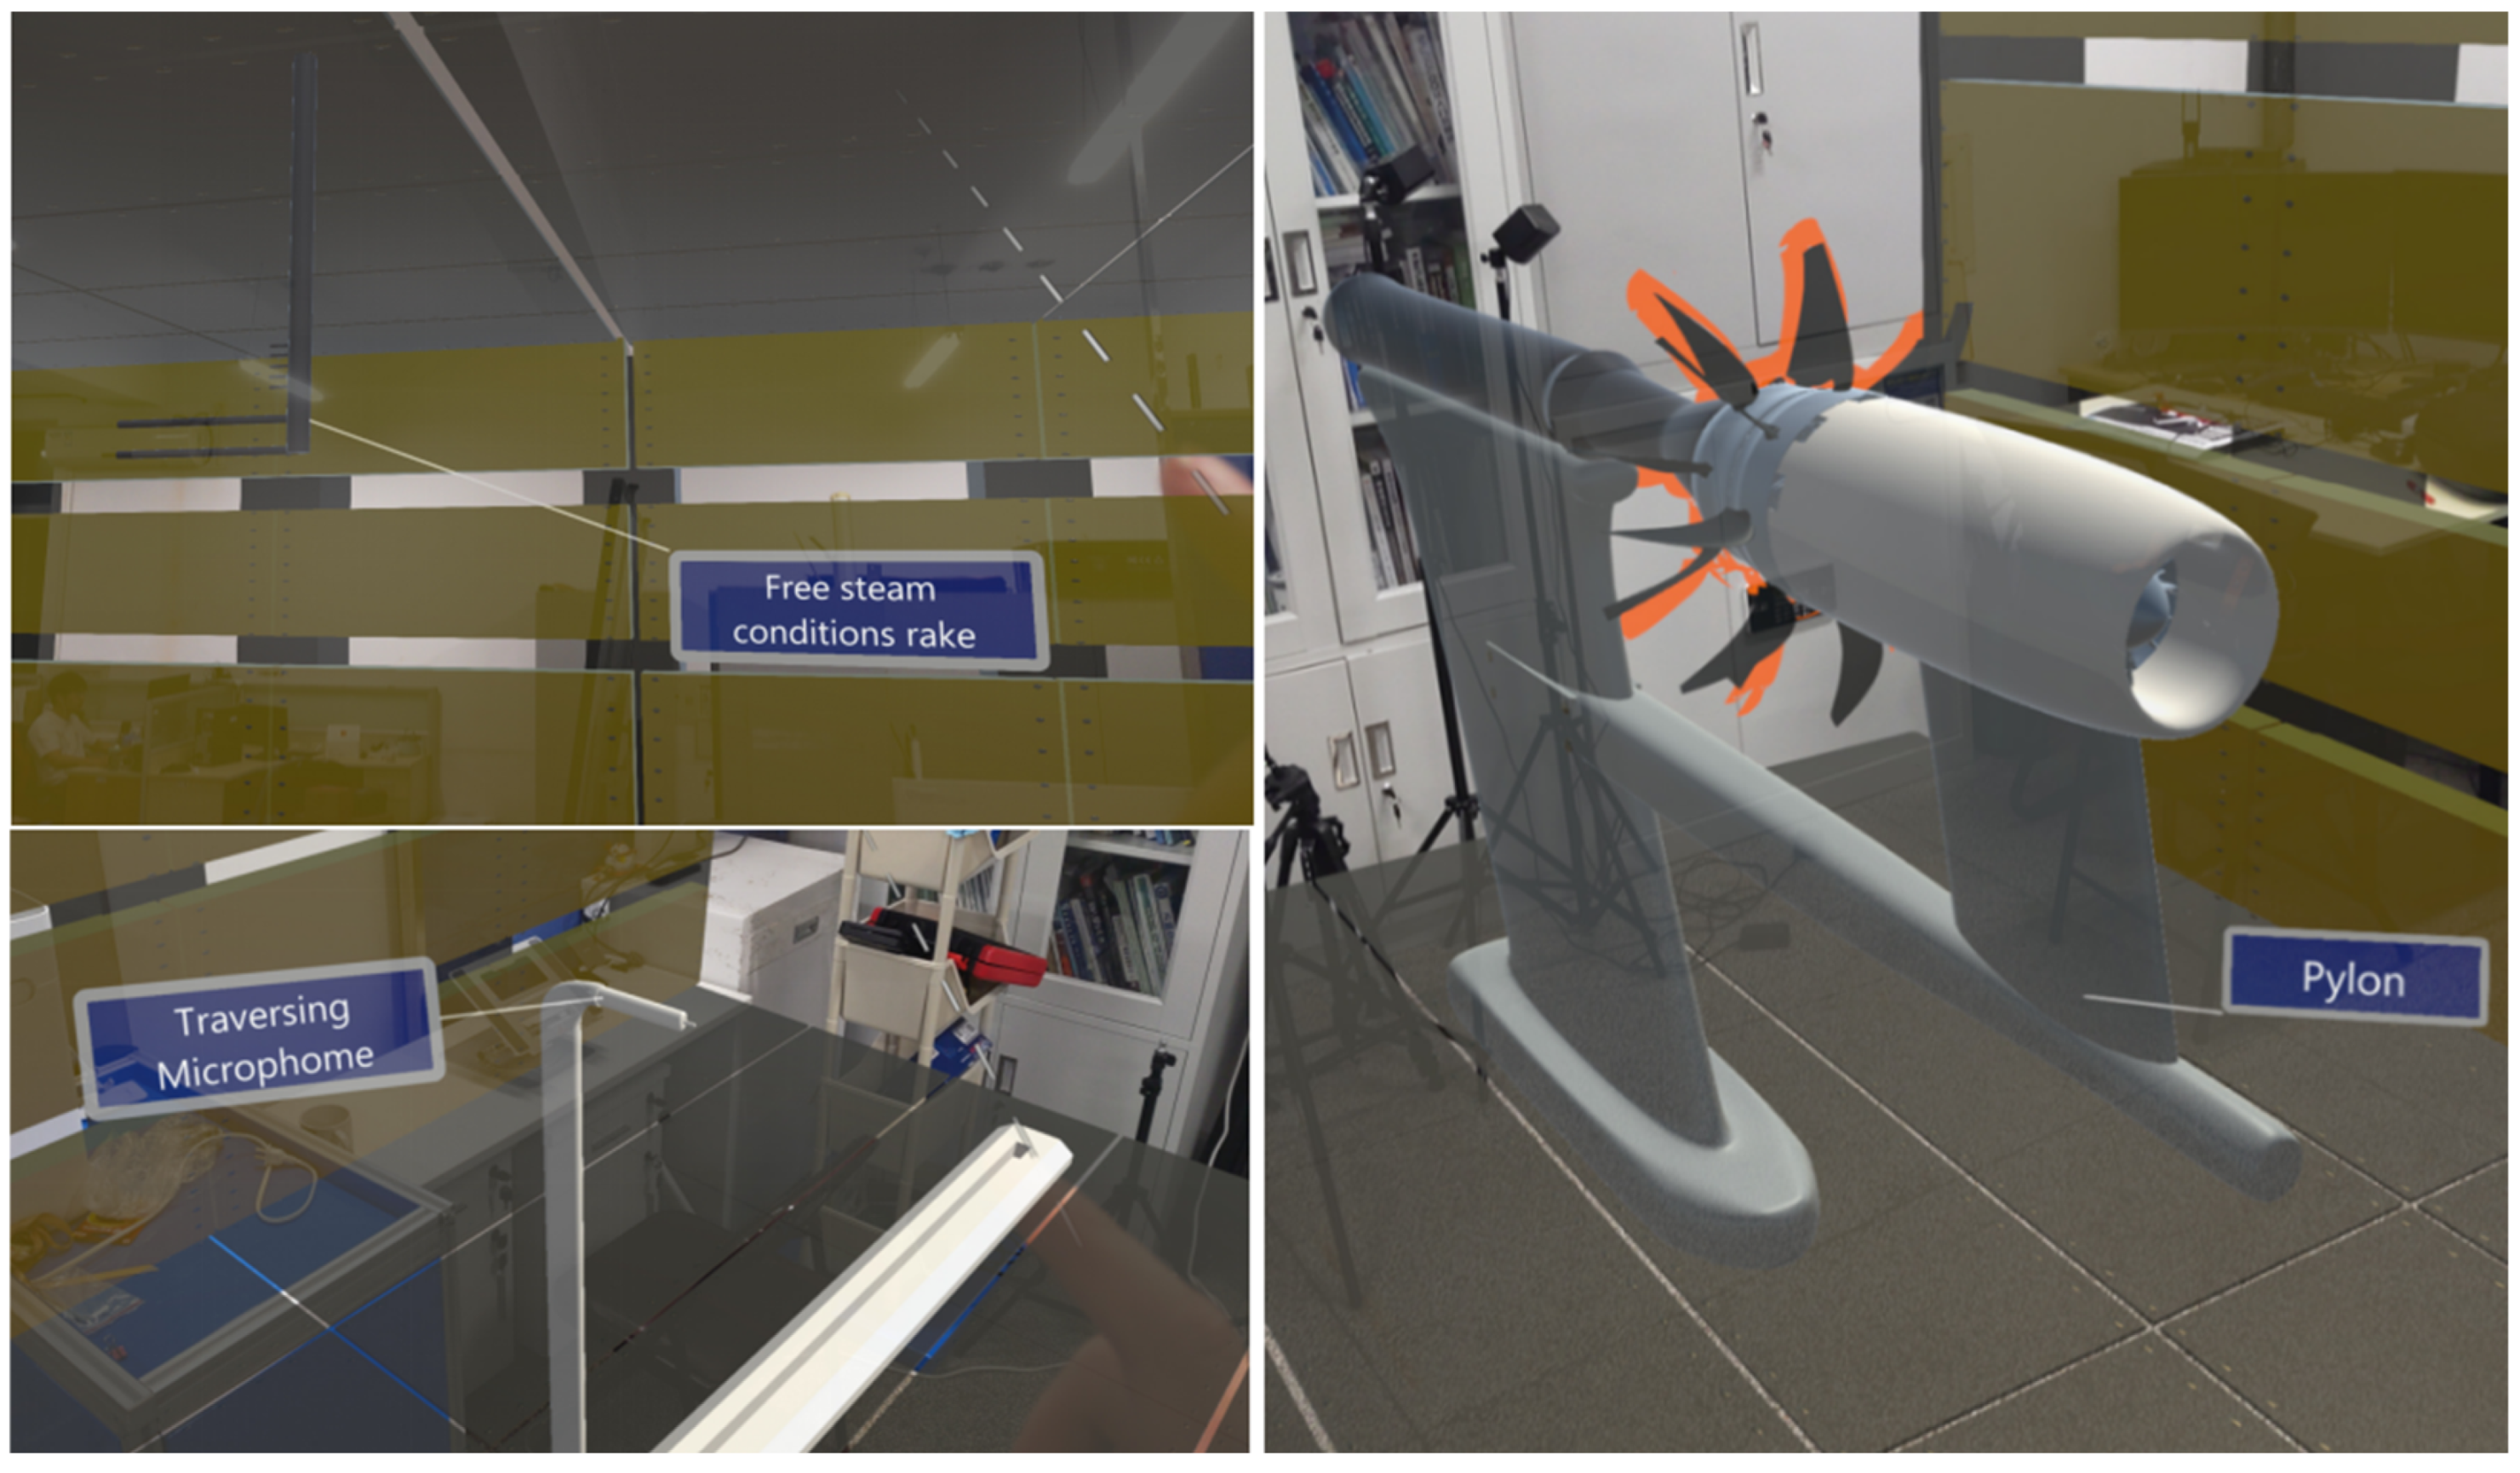
The Simple Line ToolTip was used to introduce the various types of devices in the wind tunnel acoustic test environment, such as the pylon, test bench, pitot tube, and microphone slide (Figure 15 and Figure 16).
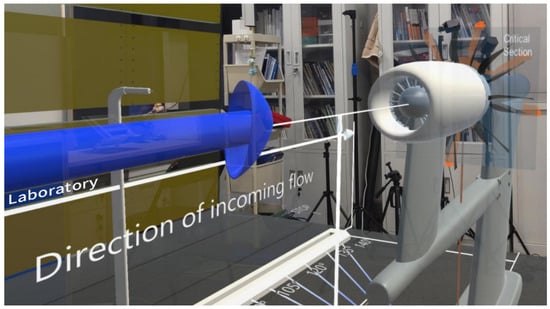
Figure 15.
Mixed-reality environment visualization.
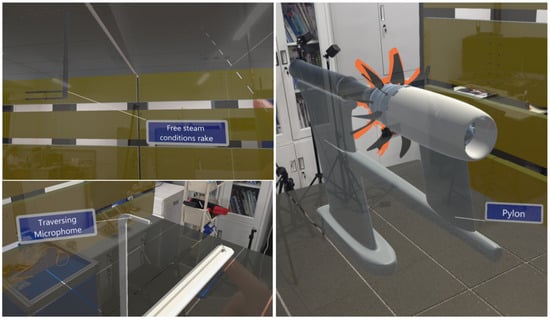
Figure 16.
Labeling of the test.
Noise data visualization and analysis were added to this scenario, and a 3D bar chart that consisted of 18 rectangles was created to show the relationships between the sound-pressure-level data of the 18 acoustic data measurement points in terms of time and frequency. A set of standard click-triggered buttons was configured to control the start and pause of the dynamic drawing of the bar chart.
A text component was placed under each bar graph to show the realistic sound-pressure-level values at the current moment. The illustrative panel, which can be moved, zoomed, and deleted by the user, displays key information, such as the measurement angle occupancy map, the wind tunnel laboratory plan, and the geometric angle values of the acoustic lateral stops (Figure 17).
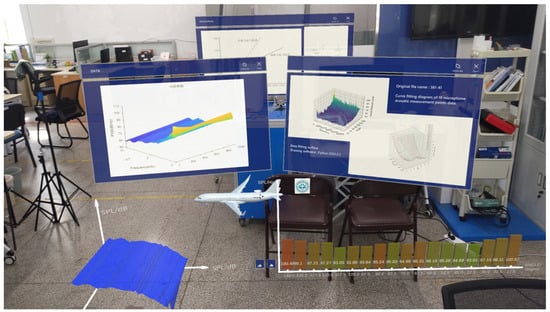
Figure 17.
Dynamic bar graph of the mixed-reality environment.
6. Conclusions
This study took the open-rotor engine as the research object, and the main research ideas were as follows: First, the low-speed wind tunnel acoustic experimental data were processed into static noise data, and based on the ground static engine noise test and reduced-thrust takeoff trajectory, the static noise data were mapped onto the reduced-thrust takeoff trajectory, and the coordinates of the noise source in the takeoff stage, as well as the linear propagation path of the noise, were obtained via calculations. Then, the sound-pressure-level data were corrected using the geometric dispersion, atmospheric absorption, and Doppler effects to correct the simulated takeoff noise to the real environment data. Finally, we realized the audible processing of the noise data with a 110° noise source pointing angle, extracted the broadband and monophonic components in the complex noise, synthesized the audio using a Fourier inverse transform, reproduced the sound in three-dimensional space using three-dimensional audio technology to simulate the noise of the open-rotor engine during takeoff, and explored the visualization scheme of the noise data of the open-rotor engine to visualize the data of the three-dimensional space in a mixed-reality environment. The visualization of the open-rotor engine noise data in a mixed-reality environment was explored again to take advantage of the easy-to-understand, portable, and controllable advantages of the interactive technology of 3D spatial data visualization in a mixed-reality environment.
In the design stage of new aircraft engines, it is necessary to consider the impact of noise. As such, new technology that displays the actual noise impact of the auditory assessment can be used to help research and development personnel to assess the noise characteristics of different design options to select the optimal program. Furthermore, research and development departments can also combine actual test flight noise data for data comparison to further improve the auralization method.
The future noise audio method can be combined with the hybrid calculation method for noise. The hybrid method decouples the flow equations and fluctuation equations, uses the CFD flow field results as the initial value, and then utilizes the sound source flow field information to obtain the far-field noise results via acoustic analogy, which reduces the computational cost and is widely used. The noise data from the hybrid computational method and the noise audio from the programmed processing can effectively realize the audio noise and a series of subsequent visualization operations, which are helpful for design modifications during research and development in accordance with the airworthiness regulations, and it can reduce costs and improve efficiency.
Author Contributions
Conceptualization, Q.Z. and S.J.; methodology, Q.Z.; software, S.J.; validation, Q.Z., S.J. and X.Y.; formal analysis, X.Y.; investigation, M.Z.; resources, X.Y.; data curation, Y.X.; writing—original draft preparation, S.J.; writing—review and editing, S.J.; visualization, Y.X.; supervision, X.Y.; project administration, X.Y.; funding acquisition, Q.Z. All authors have read and agreed to the published version of the manuscript.
Funding
This research was supported by provincial- and ministerial-level scientific research projects: Research on the Mechanism of Domestic and International Cooperation in the Formulation and Certification of International Civil Aviation Organization Environmental Requirements (no. KJZ49420220091), and the Open Project Program of Tianjin Aerospace Equipment Safety and Airworthiness Technology Innovation Center: Research on Noise Prediction and Certification Compliance Technology for hybrid wing body aircraft (no. JCZX-2022-KF-06).
Data Availability Statement
Data is contained within the article.
Conflicts of Interest
The authors declare no conflicts of interest.
References
- Farokhi, S. Future Propulsion Systems and Energy Sources in Sustainable Aviation; John Wiley & Sons, Inc.: Hoboken, NJ, USA, 2020; Available online: https://onlinelibrary.wiley.com/doi/book/10.1002/9781119415077 (accessed on 1 September 2023).
- Van Zante, D.E. Progress in Open Rotor Research. 2015. Available online: https://books.google.co.jp/books?hl=ja&lr=lang_ja%7Clang_en&id=0E8eDQAAQBAJ&oi=fnd&pg=PA127&dq=%3DVan+Zante+D+E.+Progress+in+open+rotor+research%5BJ%5D.+2015.&ots=PAV3U1TQrw&sig=hF-ac1NVEd9jBDLTmUKt8-fqaVw&redir_esc=y (accessed on 25 June 2023).
- Giannakakis, P. Design Space Exploration and Performance Modelling of Advanced Turbofan and Open-Rotor Engines. 2013. Available online: https://dspace.lib.cranfield.ac.uk/items/34a83765-cfe4-4617-8d55-0d30cee1d00e (accessed on 1 July 2023).
- Barbosa, F.C. Open Rotor Engine Technology Review–A Tool for Efficiency. 2021. Available online: https://www.sae.org/publications/technical-papers/content/2020-36-0108/ (accessed on 10 October 2023).
- Van Zante, D.E.; Collier, F.; Orton, A.; Khalid, S.A.; Wojno, J.P.; Wood, T.H. Progress in open rotor propulsors: The FAA/GE/NASA Open Rotor Test Campaign. Aeronaut. J. 2014, 118, 1181–1213. [Google Scholar] [CrossRef]
- Perullo, C.A.; Tai, J.C.; Mavris, D.N. Effects of advanced engine technology on open rotor cycle selection and performance. J. Eng. Gas Turbines Power 2013, 135, 071204. [Google Scholar] [CrossRef]
- Kritikos, K.; Giordano, E.; Kalfas, A.I.; Tantot, N. Prediction of certification noise levels generated by contra-rotating open rotor engines. In Proceedings of the ASME Turbo Expo 2012: Turbine Technical Conference and Exposition, Copenhagen, Denmark, 11–15 June 2012; American Society of Mechanical Engineers: New York, NY, USA, 2012; Volume 44694, pp. 239–247. [Google Scholar]
- Jin, H.; Chen, X.; Qin, X. Open-rotor engine noise analysis based on Mohring acoustic analogy. J. Aerosp. Power 2018, 33, 785–791. [Google Scholar] [CrossRef]
- Blandeau, V.P.; Joseph, P.F.; Kingan, M.J.; Parry, A.B. Broadband noise predictions from uninstalled contra-rotating open rotors. Int. J. Aeroacoustics 2013, 12, 245–281. [Google Scholar] [CrossRef]
- Elliott, D. Initial investigation of the acoustics of a counter rotating open rotor model with historical baseline blades in a low speed wind tunnel. In Proceedings of the 17th AIAA/CEAS Aeroacoustics Conference (32nd AIAA Aeroacoustics Conference), Portland, OR, USA, 5–8 June 2011; p. 2760. [Google Scholar]
- Bergesen, H.O.; Parmann, G.; Thommessen, Ø.B. Annex 16, vol. II (Environmental Protection: Aircraft Engine Emissions) to the 1944 Chicago Convention on International Civil Aviation. In Year Book of International Co-Operation on Environment and Development; Routledge: London, UK, 2018; pp. 66–67. [Google Scholar]
- Yin, H.; Li, Y. Reduced thrust take-off control law design for large commercial aircraft. In Proceedings of the 6th International Conference on Mechatronics, Materials, Biotechnology and Environment (ICMMBE 2016), Yinchuan, China, 13–14 August 2016; Atlantis Press: Paris, France, 2016; pp. 404–409. [Google Scholar]
- Nirbito, R.F.I.W. Derated Thrust: Method Analysis for Optimizing Turbofan Engine Takeoff Performances (SFC, EGT) Due to Lower Maximum Takeoff Weight (MTOW) Requirement. IOP Conf. Ser. Mater. Sci. Eng. 2019, 685, 012007. [Google Scholar]
- Zhao, Y.; Chen, M.; Li, D. Design of reduced thrust for civil aircraft takeoff based on performance simulation. In Proceedings of the Fifth International Conference on Traffic Engineering and Transportation System (ICTETS 2021), Chongqing, China, 24–26 September 2021; SPIE: Bellingham, WA, USA, 2021; Volume 1205, pp. 1089–1099. [Google Scholar]
- Dorothea, L.; Timo, S.; Reto, P. Synthesizing coherence loss by atmospheric turbulence in virtual microphone array signals. J. Acoust. Soc. Am. 2023, 153, 456–466. [Google Scholar]
- Sementili-Cardoso, G.; Donatelli, J.R. Anthropogenic noise and atmospheric absorption of sound induce amplitude shifts in the songs of Southern House Wren (Troglodytes aedon musculus). Urban Ecosyst. 2021, 24, 1001–1009. [Google Scholar] [CrossRef]
- Katzberg, F.; Maass, M.; Mertins, A. Doppler frequency analysis for sound-field sampling with moving microphones. Front. Signal Process. 2024, 4, 1304069. [Google Scholar] [CrossRef]
- Kleiner, M.; Dalenbäck, B.I.; Svensson, P. Auralization-an overview. J. Audio Eng. Soc. 1993, 41, 861–875. [Google Scholar]
- Cengarle, G. 3D Audio Technologies: Applications to Sound Capture, Post-Production and Listener Perception. 2013. Available online: https://www.tdx.cat/handle/10803/101415#page=1 (accessed on 12 December 2023).
- Herre, J.; Hilpert, J.; Kuntz, A.; Plogsties, J. MPEG-H 3D audio—The new standard for coding of immersive spatial audio. IEEE J. Sel. Top. Signal Process. 2015, 9, 770–779. [Google Scholar] [CrossRef]
Disclaimer/Publisher’s Note: The statements, opinions and data contained in all publications are solely those of the individual author(s) and contributor(s) and not of MDPI and/or the editor(s). MDPI and/or the editor(s) disclaim responsibility for any injury to people or property resulting from any ideas, methods, instructions or products referred to in the content. |
© 2024 by the authors. Licensee MDPI, Basel, Switzerland. This article is an open access article distributed under the terms and conditions of the Creative Commons Attribution (CC BY) license (https://creativecommons.org/licenses/by/4.0/).

