Article

An Online Data-Driven Method for Accurate Detection of Thermal Updrafts Using SINDy

1
School of Aeronautics and Astronautics, Zhejiang University, Hangzhou 310027, China
2
School of Aeronautics and Astronautics, Shanghai Jiao Tong University, Shanghai 200240, China
3
School of Mathematical Sciences, Zhejiang University, Hangzhou 310058, China
*
Author to whom correspondence should be addressed.
Aerospace 2024, 11(10), 858; https://doi.org/10.3390/aerospace11100858
Submission received: 26 August 2024 / Revised: 5 October 2024 / Accepted: 11 October 2024 / Published: 18 October 2024
(This article belongs to the Section Aeronautics)

Abstract

:
Utilizing thermal updrafts shows potential for enabling long-endurance cruising of fixed-wing unmanned aerial vehicles without energy consumption. This article presents a novel online method based on sparse identification of nonlinear dynamics (SINDy) approach to achievement identification of thermal sources in the atmosphere. Initially, the algorithm is incorporated into the upper-level planning system, interacting with the lower-level controller. Then, experiments are conducted through software-in-the-loop simulations (SITL) to validate the implementation of the proposed algorithm. It is found that direct observation of thermal sources through measurements using SINDy is unfeasible during straight and circular flight modes. Nevertheless, simulation analysis of the proposed approach indicates that under unobservable conditions, a portion of the parameters can still be identified. By comparing results obtained using the particle filter algorithm, this method is shown to accurately estimate the parameters with negligible errors under observability conditions. The novelty of this approach lies in its significant improvement of the localization accuracy of the thermal source, without the need for parameter adjustments in the algorithm. Finally, the proposed methods are integrated into commonly used hardware platforms, and their online feasibility is verified through hardware-in-the-loop simulations.

1. Introduction

Unmanned aerial vehicles (UAVs) have long been indispensable in industries such as geographical mapping, surveillance missions, and urban air mobility (UAM) [1,2,3]. Extending the range of UAVs is crucial for mission execution. Several primary approaches have been proposed to address the issue of short flight durations, including reducing aircraft drag, optimizing mission routes, and utilizing fuels with high energy densities [4,5,6,7]. When these methods have reached their limitations, harnessing energy from nature emerges as an innovative approach [8,9,10]. Unlike the previous methods, this approach searches for and utilizes updrafts to maintain glider flight without power, thereby further extending the flight endurance [11].
Updrafts mainly originate from two sources, with one of them being terrain. They are principally formed around stationary ridges or tall structures and shift position based on the direction of the incoming airflow. Fisher et al. [12] conducted flight tests in the airflow in front of hills and buildings, providing evidence for the potential utilization of terrain updrafts. Another source of updrafts arises from the uneven temperature of the ground caused by cloud cover blocking the sun [13,14]. The lighter-density air masses above the heated surface ascend, causing the surrounding air to converge toward the center and generate an updraft. Birds, including falcons and frigatebirds, have been observed actively tracking this type of updraft for aerial surveillance and hunting [15].
Prior to emulating the unpowered flight of birds, a crucial technological challenge that must be tackled is the localization of thermal cells. To estimate the center and parameters of a thermal updraft, Allen [16] devised an algorithm based on the centroid method. This algorithm employs measured airflow velocities to determine the positions of the thermal updraft. Edwards [17] achieved convergence of the updraft’s amplitude and radius by iteratively minimizing the least squares error of batch data. Furthermore, the shape of the thermal updraft was generalized from a Gaussian distribution to an elliptical cross-section. This generalization enables the estimation of the center position and other parameters [18]. However, these methods require the storage of batch data for solving and iteration, which consumes memory space on the aircraft’s computer. To overcome this issue, Kahn [19] proposed two extended Kalman filters, which are commonly employed on flight controllers, for estimating the localization of thermal updrafts, as well as the azimuth and distance relative to the glider. In this algorithm, only the state vector and covariance matrix of the filter need to be stored for long-term use. Bird [20] utilized spline curves to construct a more complete thermal model, and similarly employed the Kalman filter to estimate model coefficients. Another innovative approach involves utilizing an onboard camera for remote measurement and estimation of thermal updrafts beneath cumulus clouds [21]. The author developed an unscented Kalman filter to estimate the lifespan and intensity of the airflow.
Currently, the most advanced model estimation algorithm for multiple updrafts was proposed in [22,23], where authors demonstrated the feasibility of using the particle filter (PF) to simultaneously estimate the parameters of multiple nonlinear thermal updrafts through flight experiments. In that paper, the observability of estimating thermal model parameters using updrafts was deeply analyzed. Straight or circling flights may lead to inaccurate parameter estimation. In the recent work [24], Long Short-Term Memory (LSTM) networks and reinforcement learning methods were successfully combined to conduct flight tests on low-cost flight control hardware, integrating the exploration and exploitation of updrafts. The experimental results demonstrated that even in the presence of non-stationary and stochastic thermal updrafts, this kind of model-free approach is still applicable in real-world environments. It is foreseeable that with sufficient data, the collected resources can be used to train models to support various real-world applications.
Previous studies have demonstrated the ability to identify heat sources. Nevertheless, there is still a need to improve the accuracy of the estimation, particularly in determining the location of the thermal. Therefore, our objective is to substantially enhance the accuracy of identification to provide a positioning reference for gliders in the strategies of collecting updrafts. Thermal updrafts are generally regarded as nonlinear models. Deriving the estimation of thermal updraft model parameters from first principles may pose difficulties. The novelty of this paper lies in the first application of Sparse Identification of Nonlinear Dynamics (SINDy) to address the challenge of estimating unknown parameters of thermal sources. Despite the thermal being characterized as a strongly nonlinear system, SINDy can markedly improve the accuracy of location compared to traditional methods. Unlike the traditional algorithm, our approach does not require adjustment of algorithm parameters.
The contribution of this paper is the significant enhancement of the capability to identify thermals under observable conditions. This is achieved through the proposed SINDy-based method and its characteristic of accurately identifying canonical models of mathematical physics. The parameter estimation process exhibits negligible errors, outperforming existing approaches. We validated SINDy on compact embedded hardware platforms for UAVs through hardware-in-the-loop simulations. It is demonstrated to be feasible for real-time online applications. These results may lead to promising advancements in the accurate localization of thermal sources in autonomous soaring.
The structure of this article is as follows. In Section 2, we present and elucidate prevalent models of thermal updrafts, as well as discuss the requisite measurement methods for identifying these models. Subsequently, the SINDy algorithm is introduced in Section 3, accompanied by a delineation of the specific configurations for model identification. In Section 4, the performance of the SINDy algorithm under unobservable conditions is analyzed through software-in-the-loop simulations (SITL). Then, the online feasibility of the proposed method is further validated through hardware-in-the-loop simulations (HITL). Finally, the work in this article and areas for further improvement in the future are summarized.

2. Updraft Estimation

The modeling of thermal updrafts is necessary and can be used to construct the constraints and objectives for optimization analysis, enabling more efficient utilization of thermal updrafts in flight route planning. In this work, selecting an appropriate thermal updraft model is crucial for accurately estimating parameters. The two-dimensional Gaussian function [25] is widely accepted in the field of updraft estimation. However, it lacks the representation of external downdrafts, which slightly deviates from the atmospheric phenomena observed by researchers. Gedeon’s Thermal model [26] ensures that the airflow outside the radius is downward, with the peak of the thermal updraft at the center being the maximum value of the model. These models are characterized by their ease of modeling and representation.
Associated with observations from meteorological stations, chimney thermals [27] are then proposed, using the thickness of the mixing layer and the convective velocity scale as parameters for the thermal updrafts. Subsequently, the interaction between chimney thermals and surface winds [28] is further formulated by Ricardo, capturing the influence of prevailing winds on the shape of thermal updrafts. Lawrance [29] proposed the Bubble Model, which simulates updrafts using bubble-like structures. More precisely, the Rayleigh–Bénard equation is used by Reddya to simulate convection induced by strong temperature gradients between the atmospheric boundary layer and the surface [30]. Thermal updrafts driven by constant surface heat flux are generated using the Large Eddy Simulation (LES) method, providing a more accurate description of convection in the atmosphere [31]. While complex thermal models can better represent the atmospheric environment, they pose computational challenges for subsequent system identification.
In this paper, the two-dimensional Gaussian model is adopted as the application object for parameter identification presented in Figure 1. Despite its simplicity, the model can facilitate trajectory planning when required, while also minimizing erroneous parameter estimation and striking a balance between environmental fidelity and computational costs. It is formulated [32] as follows:
w z = w · exp 1 2 · x n p n 2 + x e p e 2 R 2
where w represents the wind intensity at the thermal center, p n and p e denote the positions of the thermal cell on the two-dimensional coordinate axes. During glider flight, the real-time positions x n and x e are recorded and represented by x in Figure 1. The thermal model follows a circular bell curve, with  p n , p e , the range R of the thermal cell, and w being the parameters to be identified.
Addressing the issue of airflow perception is crucial in achieving autonomous soaring technology. Researchers have developed miniature sensors and instruments to measure and analyze physical quantities such as temperature, air pressure, and flow velocity in the atmosphere. In practical applications, netto-variometes are commonly employed for rough estimation, followed by filtering algorithms [33,34,35]. Hong extended the static optimization framework to the wind estimation scenario. Based on the optimal control principle, the three-dimensional airflow is accurately estimated in real time [36]. Accurately measuring the magnitude of updrafts encountered by the glider is a prerequisite for parameter estimation. With the significant advancements in airflow perception technology, capturing updrafts with unmanned aircraft is no longer a challenging task.
By deriving the energy conservation law of the glider, the principle of the netto-variometer can be explained. However, during the search for thermal cells, the glider relies on the engine thrust. In this paper, for ease of calculation, we estimate updrafts from a kinematic perspective using the following formula [22]:
w x w y w z = x ˙ y ˙ z ˙ G P S T IB T BW V a 0 0
The absolute motion velocities, obtained through the Global Position System (GPS), are composed of the relative air velocity and the wind velocity. Since the wind speed is required in the inertial coordinate system, we need to transform the vectors. T BW is a rotation matrix that transforms vectors from the wind coordinate system to the body coordinate system. Similarly, T IB transforms vectors from the body coordinate system to the inertial coordinate system. V a represents the velocity in the heading direction, which is directly measured by the airspeed indicator. Combining the rotation matrix T BW , which is estimated by using an extended Pitot tube, the representation of relative motion in the body coordinate system is obtained. Equation (2) is calculated in the inertial coordinate system, without considering the curvature of the Earth. Therefore, the Inertial Measurement Unit (IMU) is corrected by Extended Kalman Filter (EKF) and then utilized to rotate the body velocity vector to the inertial system, resulting in the right side of Equation (2).

3. Sparse Identification of Nonlinear Dynamics for Thermal Updrafts

SINDy has been demonstrated to successfully extract dynamic processes from data in various fields, including reaction–diffusion systems and compressible plasmas [37]. It is increasingly advancing the development of directly discovering physical models from data [38]. We also aim to reconstruct low-dimensional dynamic models with prior knowledge from high-dimensional measurement data. SINDy falls under data-driven machine learning methods, and its implementation process is illustrated in Figure 1. It collects variables that are directly or indirectly associated with the measurements. A linear or nonlinear function library is manually selected based on prior or unknown models. Subsequently, the parameter identification problem is transformed into a sparse regression problem for the solution.
To identify the parameters of the thermal model, estimated updrafts are collected at a consistent sampling rate. Data are represented by x t m . Generally, the dimension of x 1 × d depends on the problem being solved. In our thermal identification case, we are concerned with the vertical airflow, so d is equal to 1. Assuming the number of collected data is t m , the X t m × 1 matrix is defined as follows:
X = x t 1 x t 2 x t m
A library of candidate functions includes polynomials, trigonometric functions, or other basic linear or nonlinear function libraries. The selection of an appropriate candidate library is crucial in coefficient regression. Increasing the complexity of the library is highly effective in fitting strong nonlinear functions but comes at the cost of computational efficiency. An alternative approach is to combine partial mathematical models with prior knowledge to determine the library. For the circular bell model studied in our research, X and Y, along with the functions derived from them, are chosen [39].
Θ ( X ) = 1 X X P 2
where, Θ t m × 6 , as illustrated in Figure 1, is the candidate library, and the term P 2 represents all quadratic nonlinear combinations of the X sequence. Thus, the nonlinear system is expressed in the following form [40]:
X . = Ξ Θ T ( X )
where, Ξ = ξ 1 ξ 2 ξ n . ξ n is the coefficient vector of the nonlinear terms. Due to the majority of coefficients in the vectors being close to zero, solving for Ξ results in a sparse regression problem. Large values in ξ n determine the dominant terms in the candidate function library. Since the thermal we aim to identify is a scalar function, n is equal to 1.
The state derivative, such as velocity, can be measured through sensors or calculated using other numerical methods. Sparse regression is employed to activate the most influential terms in the candidate library. It minimizes the least square error between the measured and estimated values [39].
ξ = argmin ξ ^ 1 2 X . ξ ^ Θ T X 2 2 + λ ξ ^ 1
A regularization term is incorporated to promote the sparsity of the coefficients of the activated terms. Although the convergence of the equation is not always guaranteed, to prevent computational errors in the optimization process, the equation is solved using either the sequentially thresholded least squares procedure or sparse regularized relaxed regression. In fact, various versions of SINDy have been developed to incorporate additional physical constraints into the applied scenarios and even to identify time delays in dynamic processes. A more robust approach, known as Ensemble-SINDy, has also been proposed [41], which is capable of learning partial differential equations from limited data corrupted by noise, significantly enhancing the practicality of the SINDy algorithm.
In practical applications, computations are commonly conducted in discrete time. Thus, to apply SINDy to discrete dynamical systems, we consider the spatiotemporal variations resulting from the relative motion between the thermal updraft and the glider as a nonlinear dynamical system [39], represented in the following discrete form:
x k + 1 = F x k
In the original SINDy algorithm, the time derivative of X is computed using the advanced one timestep. However, in our identification model, incorporating the next time step is not considered. This is because the current measurement of the updraft is determined by the relative positions of the glider and the thermal at the current moment, with little direct connection to time. In this case, the spatiotemporal coherent structures transform into spatial coherence.
To enhance the intuitiveness and convenience of the sparse regression process, a logarithmic transformation to Equation (1) is applied initially as follows:
ln w z = p n R 2 · x n + p e R 2 · x e 1 2 R 2 · x n 2 1 2 R 2 · x e 2 + ln w p n 2 + p e 2 2 R 2
where w z is obtained through measurement. To mitigate solution complexity, we take its logarithm for subsequent calculations. The discrete dynamical form becomes the following:
Y ˙ = Ξ Θ T X
where, Y ˙ = ln w z t 1 , ln w z t 2 , ln w z t m , which is a vector composed of the time series of ln w z . We aim to solve ξ ^ to approximate measured values of Y ˙ . Then, the regression problem becomes the following:
ξ = argmin ξ ^ 1 2 Y ˙ ξ ^ Θ T X 2 2 + λ ξ ^ 1
For most application scenarios, the solution of sparse regression serves as the identified parameter. However, in our experiment, further processing of the solved parameters is necessary.
Here, for the sake of convenience in expression, the  ξ i is used to denote the i t h element of the column vector ξ n . Note that this scalar value should not be confused with the vector ξ n in Equation (5).
R = 1 2 ξ i p n = ξ 1 · 1 2 ξ i p e = ξ 2 · 1 2 ξ i i = 3 , 4
In the SINDy algorithm, a crucial step involves selecting the library functions, which is typically achieved through expert knowledge to determine the inclusion of nonlinear types. Incorrect library selection frequently leads to non-sparse models, resulting in increased complexity of the reconstructed model. When the underlying nonlinear system is unknown, the use of proper orthogonal decomposition (POD) allows for the extraction of spatiotemporal coherent structures. Additionally, by imposing constraints in SINDy, the search space for candidate function libraries can be reduced [40]. Likewise, in [42], low-rank tensor decomposition achieved a similar effect. However, in our identification case, we possess preliminary knowledge about the system, eliminating the need to consider scanning candidate function libraries. This further reduces the training execution time. It is important to note that before the sparse regression is further extended to identify the parameters of the thermal updraft, the  x e · x n term is artificially eliminated, considering the decoupling of the identified model from x e and x n .
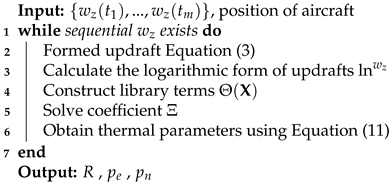
The flowchart of SINDy is comprehensively outlined in Algorithm 1. Prior to its execution, a continuous sequence of updrafts is collected. Once a sufficient number of updrafts have been amassed, the SINDy algorithm starts. The data are organized into a matrix, and the logarithmic form of this matrix is computed. The candidate function library, denoted as Θ X , is then constructed based on the position of the aircraft. We solve the coefficients of these candidate functions to minimize Equation (10). Ultimately, coefficients are transformed into thermal source parameters following Equation (11).
Algorithm 1: SINDy for themal identification.
Aerospace 11 00858 i001

4. Results

4.1. Particle-Filter-Based Method

In this paper, in order to compare the SINDy algorithm with this algorithm, we briefly introduce its implementation details. The essence of the algorithm is to optimize the estimated object based on the current observation. The idea is to utilize a large number of random particles to approximate the posterior probability density function of the value to be estimated p θ k Z k , where θ = p n , p e , w , R and Z k is the observation value at k step. The samples are then assigned weight coefficients, and the particles are reweighted based on the measurement to estimate the parameters.
The state transition function is chosen as the importance probability density function. It serves as the prior estimate for the parameters of interest in the heat source. At the k step, it is updated in the following form [22]:
p n k = p n k 1 + t k v n + ν k , v k N 0 , σ n 2 p e k = p e k 1 + t k v e + ν k , v k N 0 , σ e 2 w z k = w z k 1 + ν w , ν w N 0 , σ w 2 R k = R k 1 ( i ) + ν R , ν R N 0 , σ R 2
Here, ( i ) represents the i-th particle. σ denotes the standard deviation of the estimated parameters. At the beginning of the algorithm execution, we initialize the particles as follows:
p n k , p n e U p 350 , p + 350 w 0 N μ w , σ w 2 R 0 N μ R , σ R 2
Equation (13) indicates that the search for thermals is only conducted within a rectangular area of 700 m around the aircraft’s position. U represents particles being uniformly scattered in the designated area as shown in Figure 2.
Then, weights are updated [43]:
γ k = γ k 1 1 2 π σ r exp w ˜ z k h θ k 2 2 σ r 2
where, w ˜ z is the estimated updraft. The likelihood provides the calculation accuracy of the estimation of particles. When the value of a particle is closer to the measured value, we have more reason to believe in the parameters of this particle. These particle parameters are assigned greater weight and have a better chance of being carried over to the next round of the iteration.
Note that during the algorithm iteration process, degeneracy may occur, resulting in the difficulty of changing the weight γ . To avoid ineffective computational costs, the particles are resampled at each iteration.

4.2. Experimental Setup

4.2.1. Software-in-the-Loop Simulations

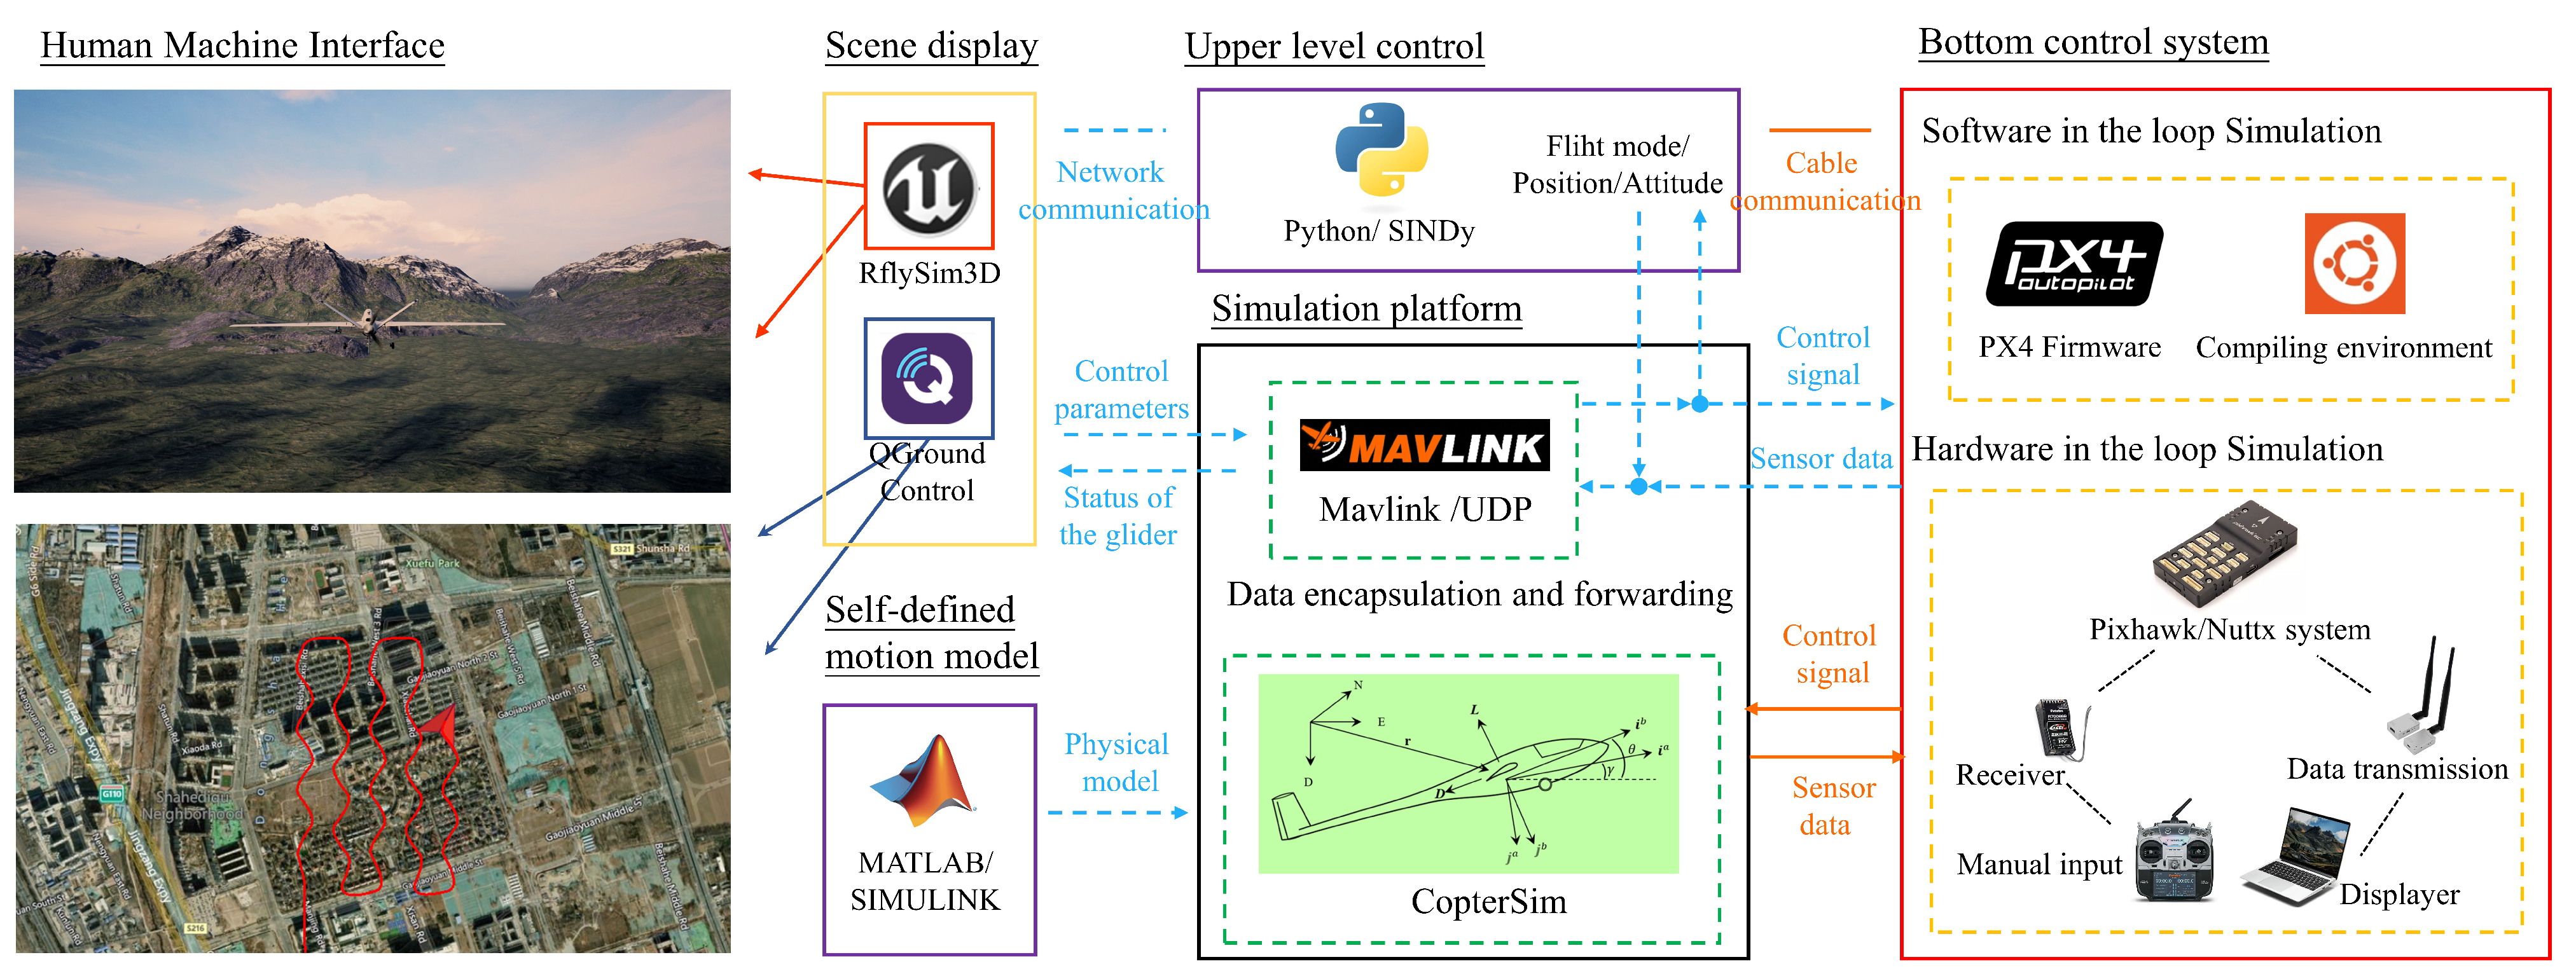
The experiments are conducted on the RflySim, an advanced platform developed by the Reliable Flight Control Group [44]. The core of RflySim lies in its support for custom high-fidelity simulation framework, achieved through specialized components such as the well-designed simulator CopterSim [45]. Through the utilization of RflySim, researchers are able to efficiently design models, develop and validate control algorithms, and verify hardware systems, thereby reducing the time required for the algorithm’s conception and deployment.
Initially, experiments are tested through SITL under observable conditions to validate the implementation of modeling, and algorithm design as illustrated in Figure 3. All the components are appropriately connected to the flight control algorithm system, ensuring the consistency of input-output signals with the actual fixed-wing aircraft. Similar to real flight environments, the fixed-wing transmits updated sensor data or state estimation information, including attitude angles, angular rates, positions, and velocity, to the flight controller. Subsequently, the algorithm sends PWM commands back to the model, establishing a closed-loop simulation. SINDy is executed online using Python 3.8.0 code to search for thermal cells, while incorporating upper-level control logic in the code to switch flight modes. The guidance and navigation algorithms are implemented based on the PX4 Firmware (PX4-1.12.3), a widely used open-source flight control software. The core communication architecture of the experiment, depicted by the solid black box in the diagram, serves as the central hub for all data. The model is reconstructed and aerodynamic parameters are computed based on the existing aircraft, with some adjustments made to the physical shape and aerodynamic coefficients to ensure smooth and controllable motion. The model file is generated in Simulink and subsequently transferred to CopterSim, as indicated in the bottom left corner of the diagram. The underlying control system is connected to CopterSim through TCP/UDP, and MAVLink is utilized to transmit actuator commands from the PX4 runtime output. CopterSim not only relays MAVLink messages and transmits the real-time status of the glider to the upper-level control system but also receives planning commands from the purple module to send to PX4. In order to streamline communication and reduce complexity, messages are packed in UDP format. Finally, the aircraft’s pose and actuator parameters are sent to the 3D engine for visualization, as indicated by the solid yellow box.

4.2.2. Hardware-in-the-Loop Simulations

Prior to actual flight tests, hardware-in-the-loop simulation is performed to assess the performance of SINDy. Unlike SITL, the fixed-wing model in HITL operates in real-time, synchronized with the actual clock, ensuring accurate results. Win10WSL serves as the cross-compilation environment for flashing the firmware onto the Pixhawk4 autopilot hardware. The algorithm is uploaded to the flight control hardware environment. Pixhawk4 integrates powerful processors, sensor technology, and the NuttX real-time operating system, enabling flexible and reliable control of the glider. In this stage, communication is established using cable signal lines instead of virtual network transmission as shown in Figure 4. CopterSim transmits sensor data, including a barometer and magnetometer readings, to Pixhawk4 via serial communication. The PX4 firmware running on the flight controller estimates the state information using filtering algorithms, such as EKF. The state is then broadcast to the information bus. The controller subscribes to messages from the information bus, calculates control commands, and sends them back to CopterSim. Additionally, the wireless data transmission module is equipped to transmit the glider’s status and flight parameters to QGC for monitoring. In case the glider deviates from the expected flight path or experiences loss of control, intervention may be performed by the operator. HITL facilitates the deployment and execution of control algorithms on real embedded systems, providing an indoor simulation environment for outdoor flight testing.

4.3. Identification of Partial Parameters in Unobservable Conditions

In practical applications, the issue of observability arises as not all parameters can be identified through observed output trajectories. A comprehensive theoretical analysis based on the Fisher information matrix is offered in [22]. The authors point out that the existence of the inverse of the Fisher information matrix is insufficient to ensure the observability of nonlinear systems in specific flight modes using the PF algorithm. This is due to the fact the same measurements are observed from different thermals symmetrically located with respect to the trajectory, making positions unidentifiable.
In this subsection, the proposed SINDy method was conducted through software-in-the-loop simulation. This test verifies two results, one being that the algorithm can be embedded in the flight experiment framework, and the other being that the thermal center is still unobservable in straight and flight modes using this method. Although these two modes are unobservable, we demonstrate that partial parameters could be estimated using SINDy.
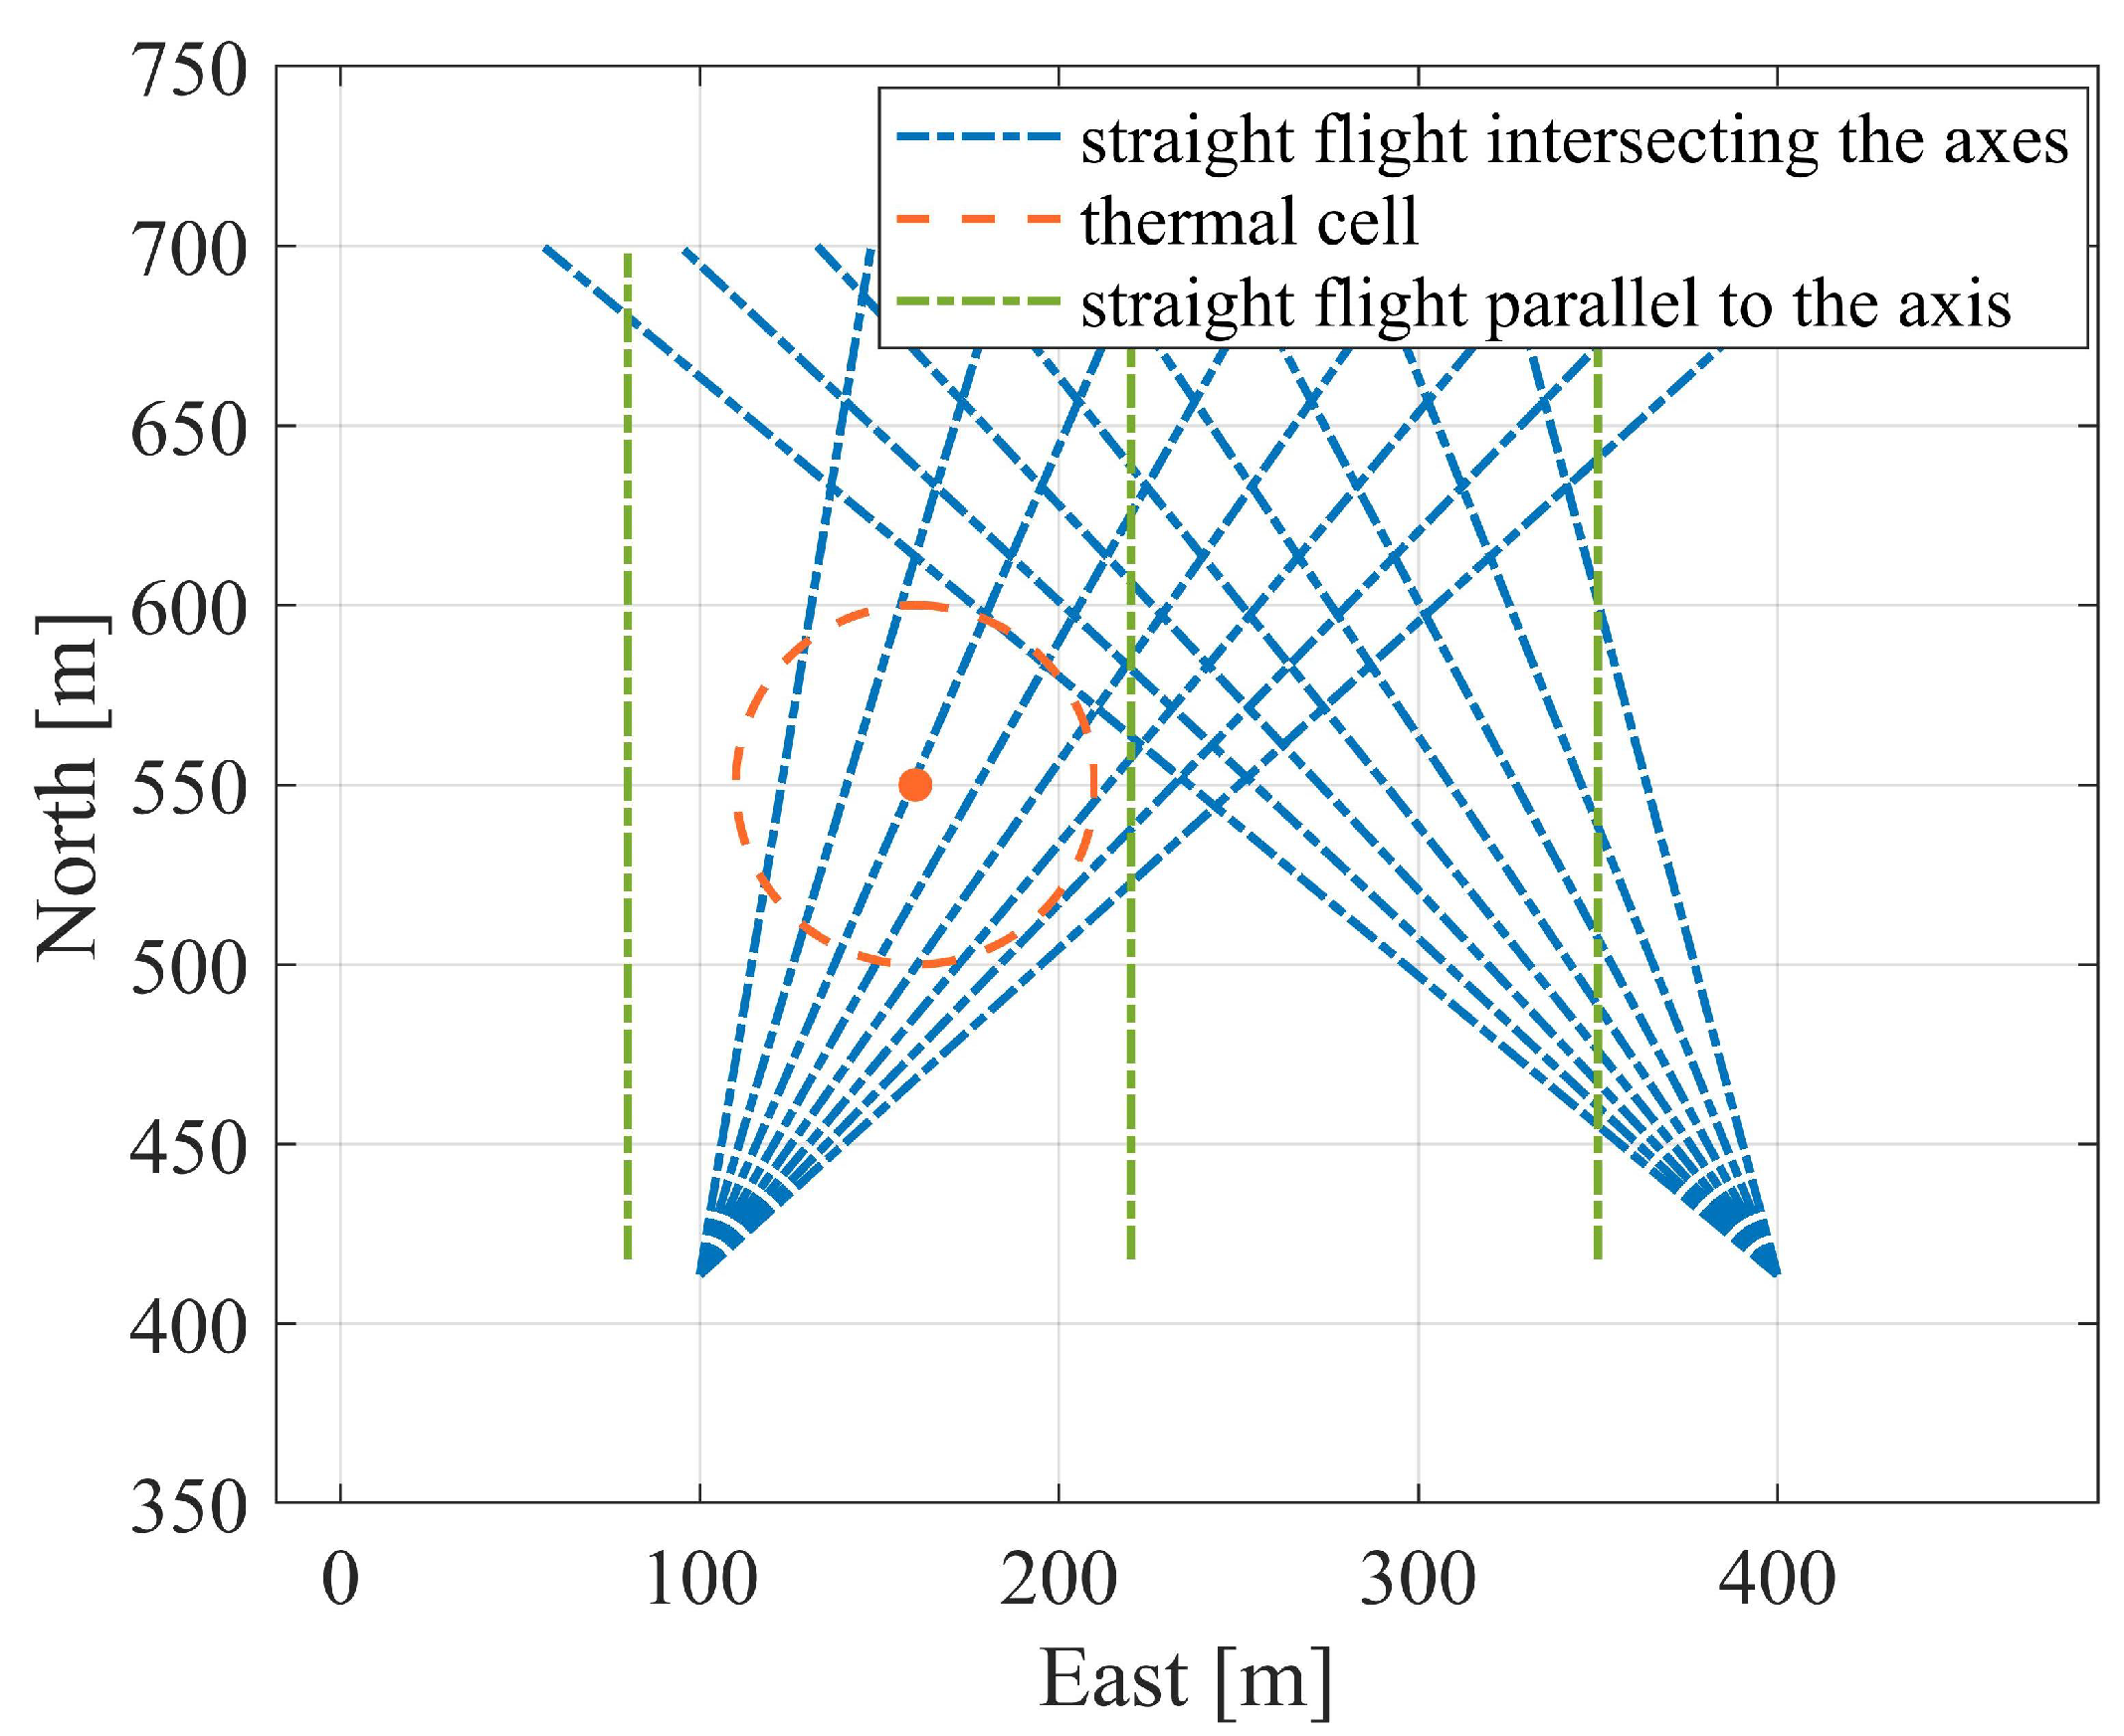
In order to demonstrate the observability of specific parameters under unobservable conditions using SINDy, the glider is forced to fly directly along the thermal, as depicted in Figure 5. To make the analysis clearer, takeoff, landing, and additional irrelevant flight trajectories are not plotted in the figure. For the purpose of theoretical analysis, random characteristics of the wind field are deactivated. This observability is illustrated through two relative motions. The green line in the figure represents the ground tracks of the glider parallel to the coordinate axis, whereas the blue lines intersect with the coordinate axis. The radii solved by SINDy are displayed in Figure 6. When combined with the blue lines, it is evident that despite changes in the x and y components of the state matrices, there are still challenges in estimating the radius. In contrast to the blue tracks, along the coordinate axis as indicated by the green trajectory, the third and fifth columns of Θ ( X ) approximate a constant. This scenario results in changes in physical information along the coordinate axis, while providing almost no information perpendicular to it. Concise and singular physical information grants SINDy a special solving property for thermal identification, enabling accurate estimation of the radius and its position parallel to the coordinate axis.
In Figure 7, symbol × signifies the case of intersecting with the coordinate axis, where a significant deviation between the estimated north position and the true value is observed. However, the green triangles demonstrate the estimated results are close to the true values. This indicates that compared to the parallel trajectory, the accuracy of estimated north positions severely decreases when the flight intersects with the coordinate axis. While we cannot mathematically prove this phenomenon, the failure of the SINDy algorithm may be related to unobservability intuitively.
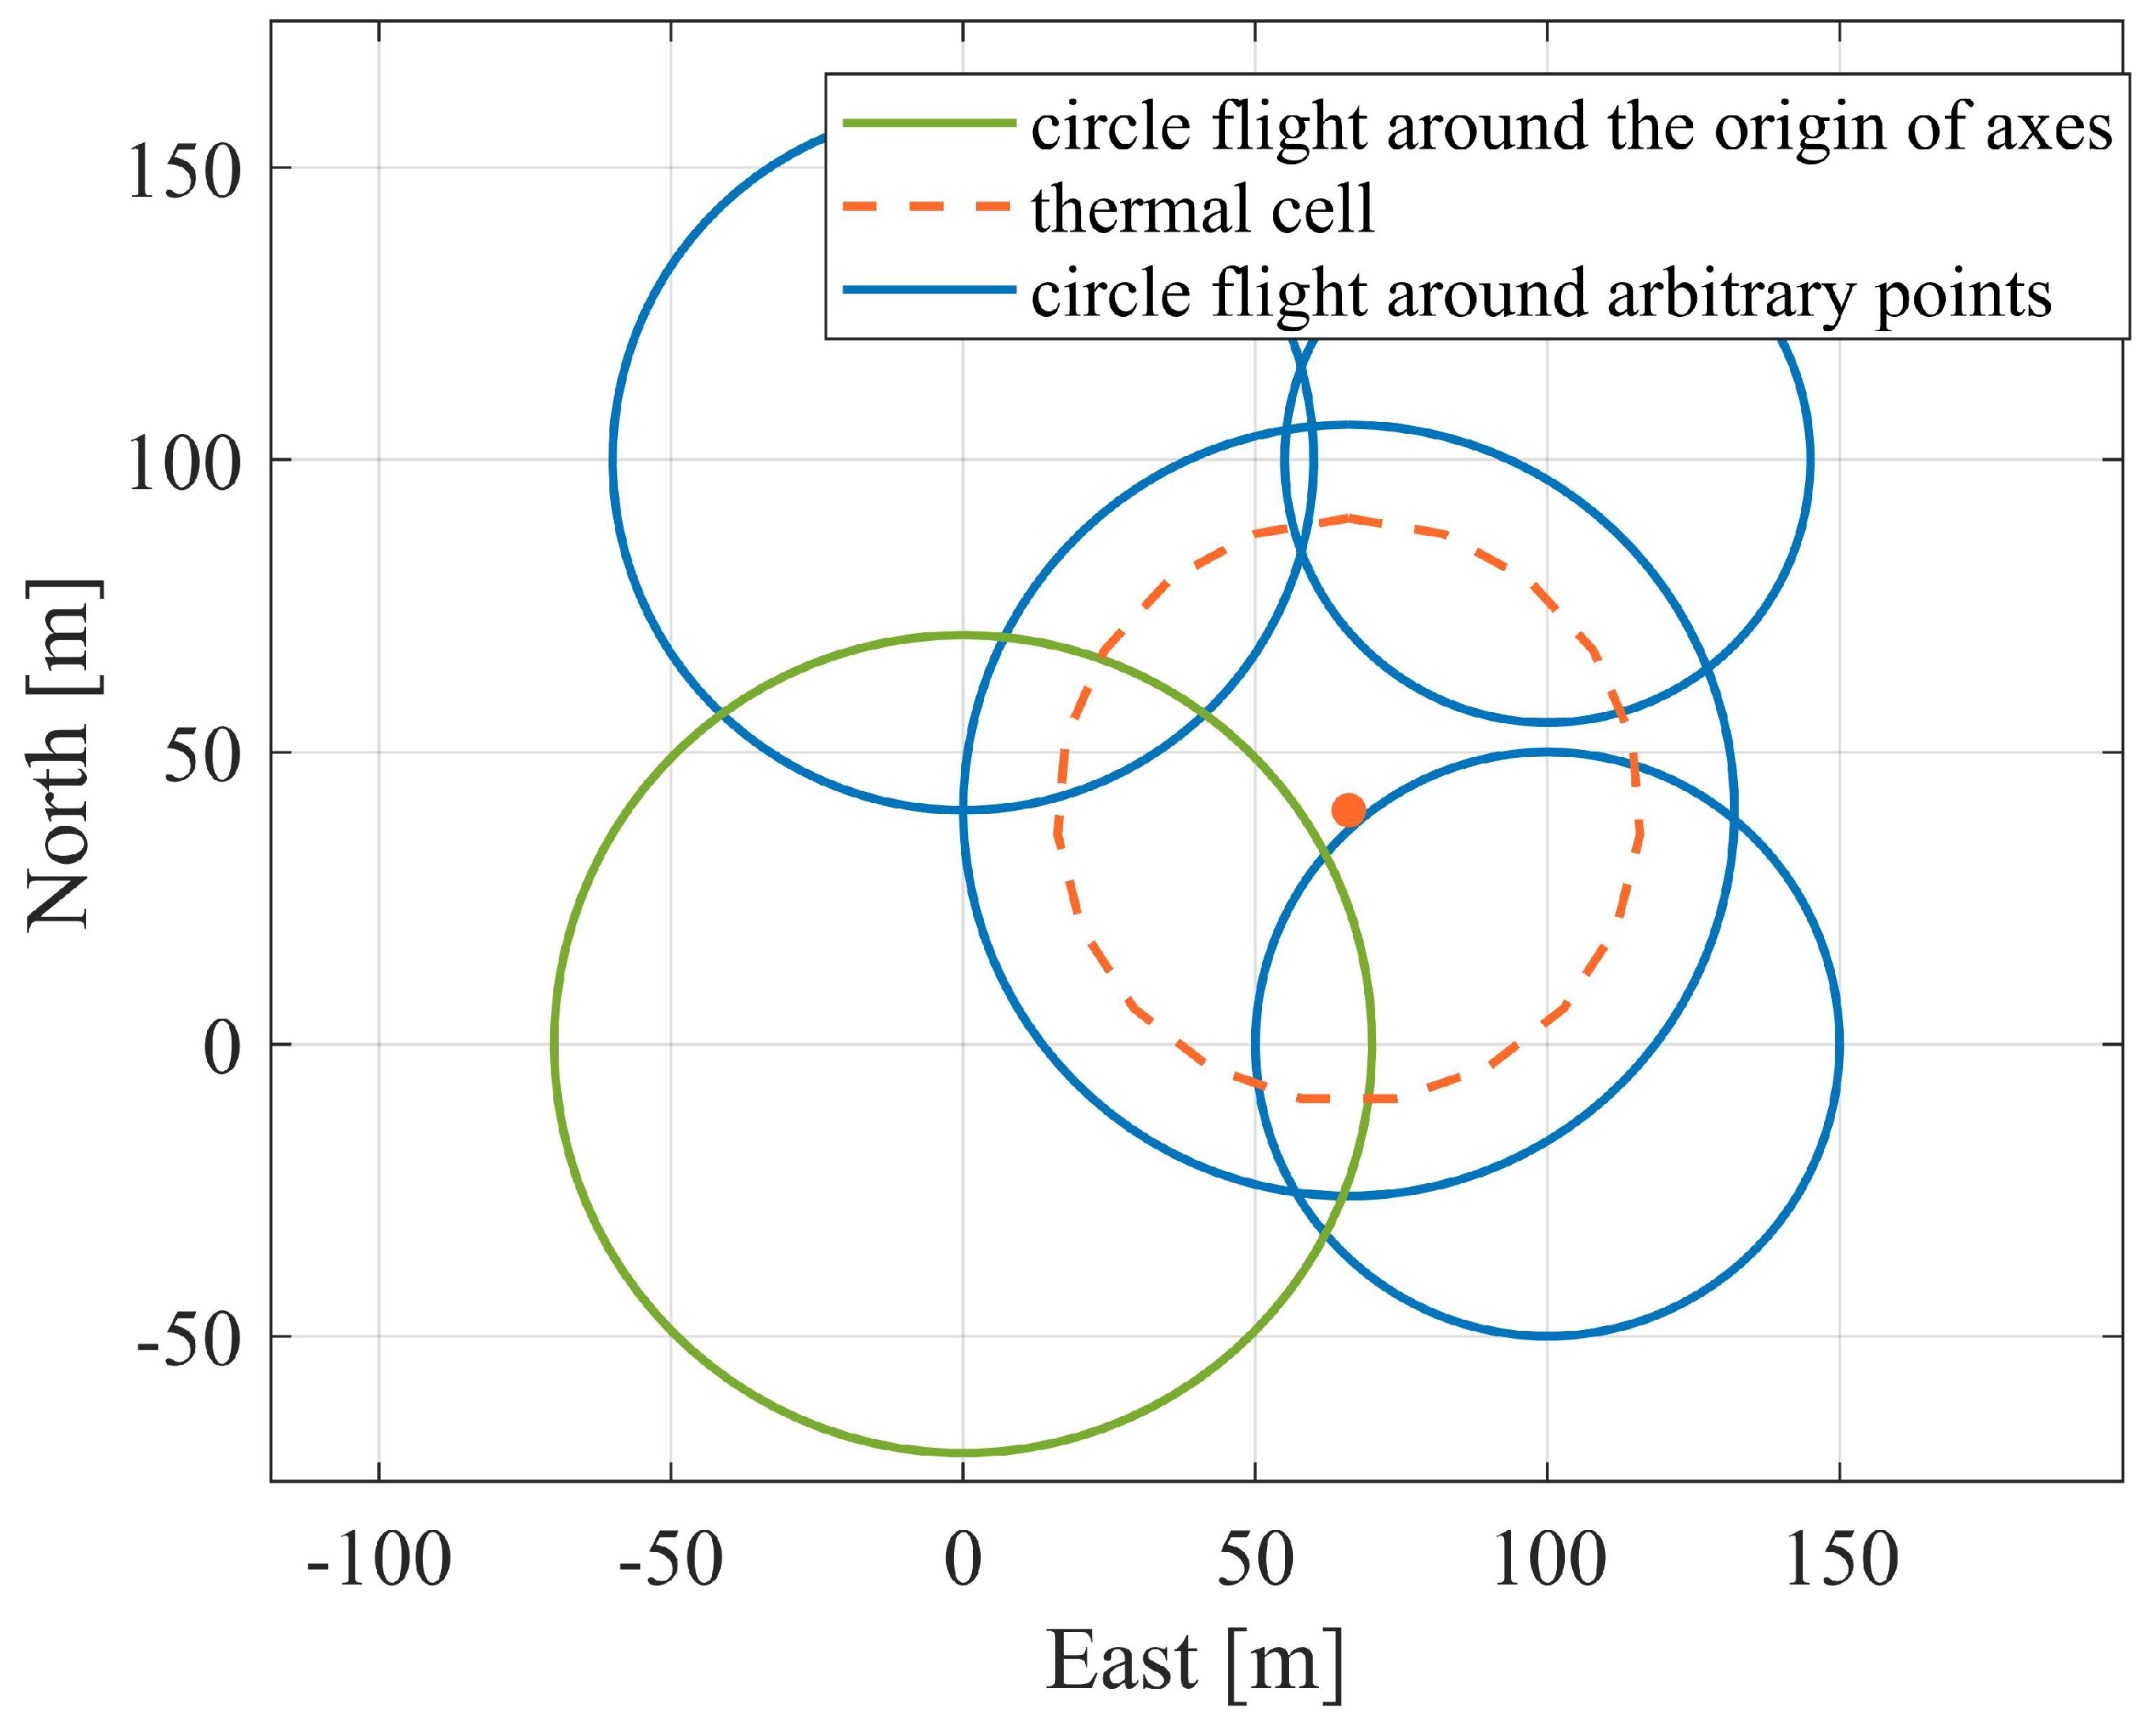
The observability matrices are singular when in circular flight [22], rendering them unidentifiable through updraft measurement using PF. Although the intensity and radius of the thermal are unobservable, the SINDy algorithm seems to be able to estimate the northward and eastward positions within specific flight regions. As depicted in Figure 8, the green trajectory reflects the central point of the circular flight at the origin of the coordinate axis, while the centers of the blue tracks are arbitrary. This conclusion is further elaborated in Figure 9. The estimated position around an arbitrary point is represented by the symbol ×. It is observed that only the north in case 2 and the east in case 4 can be accurately determined, while positions estimated in most cases are inaccurate. If the coordinate axis is selected as the origin, the thermal is accurately located in any direction.

4.4. Parameter Identification in Observable Conditions

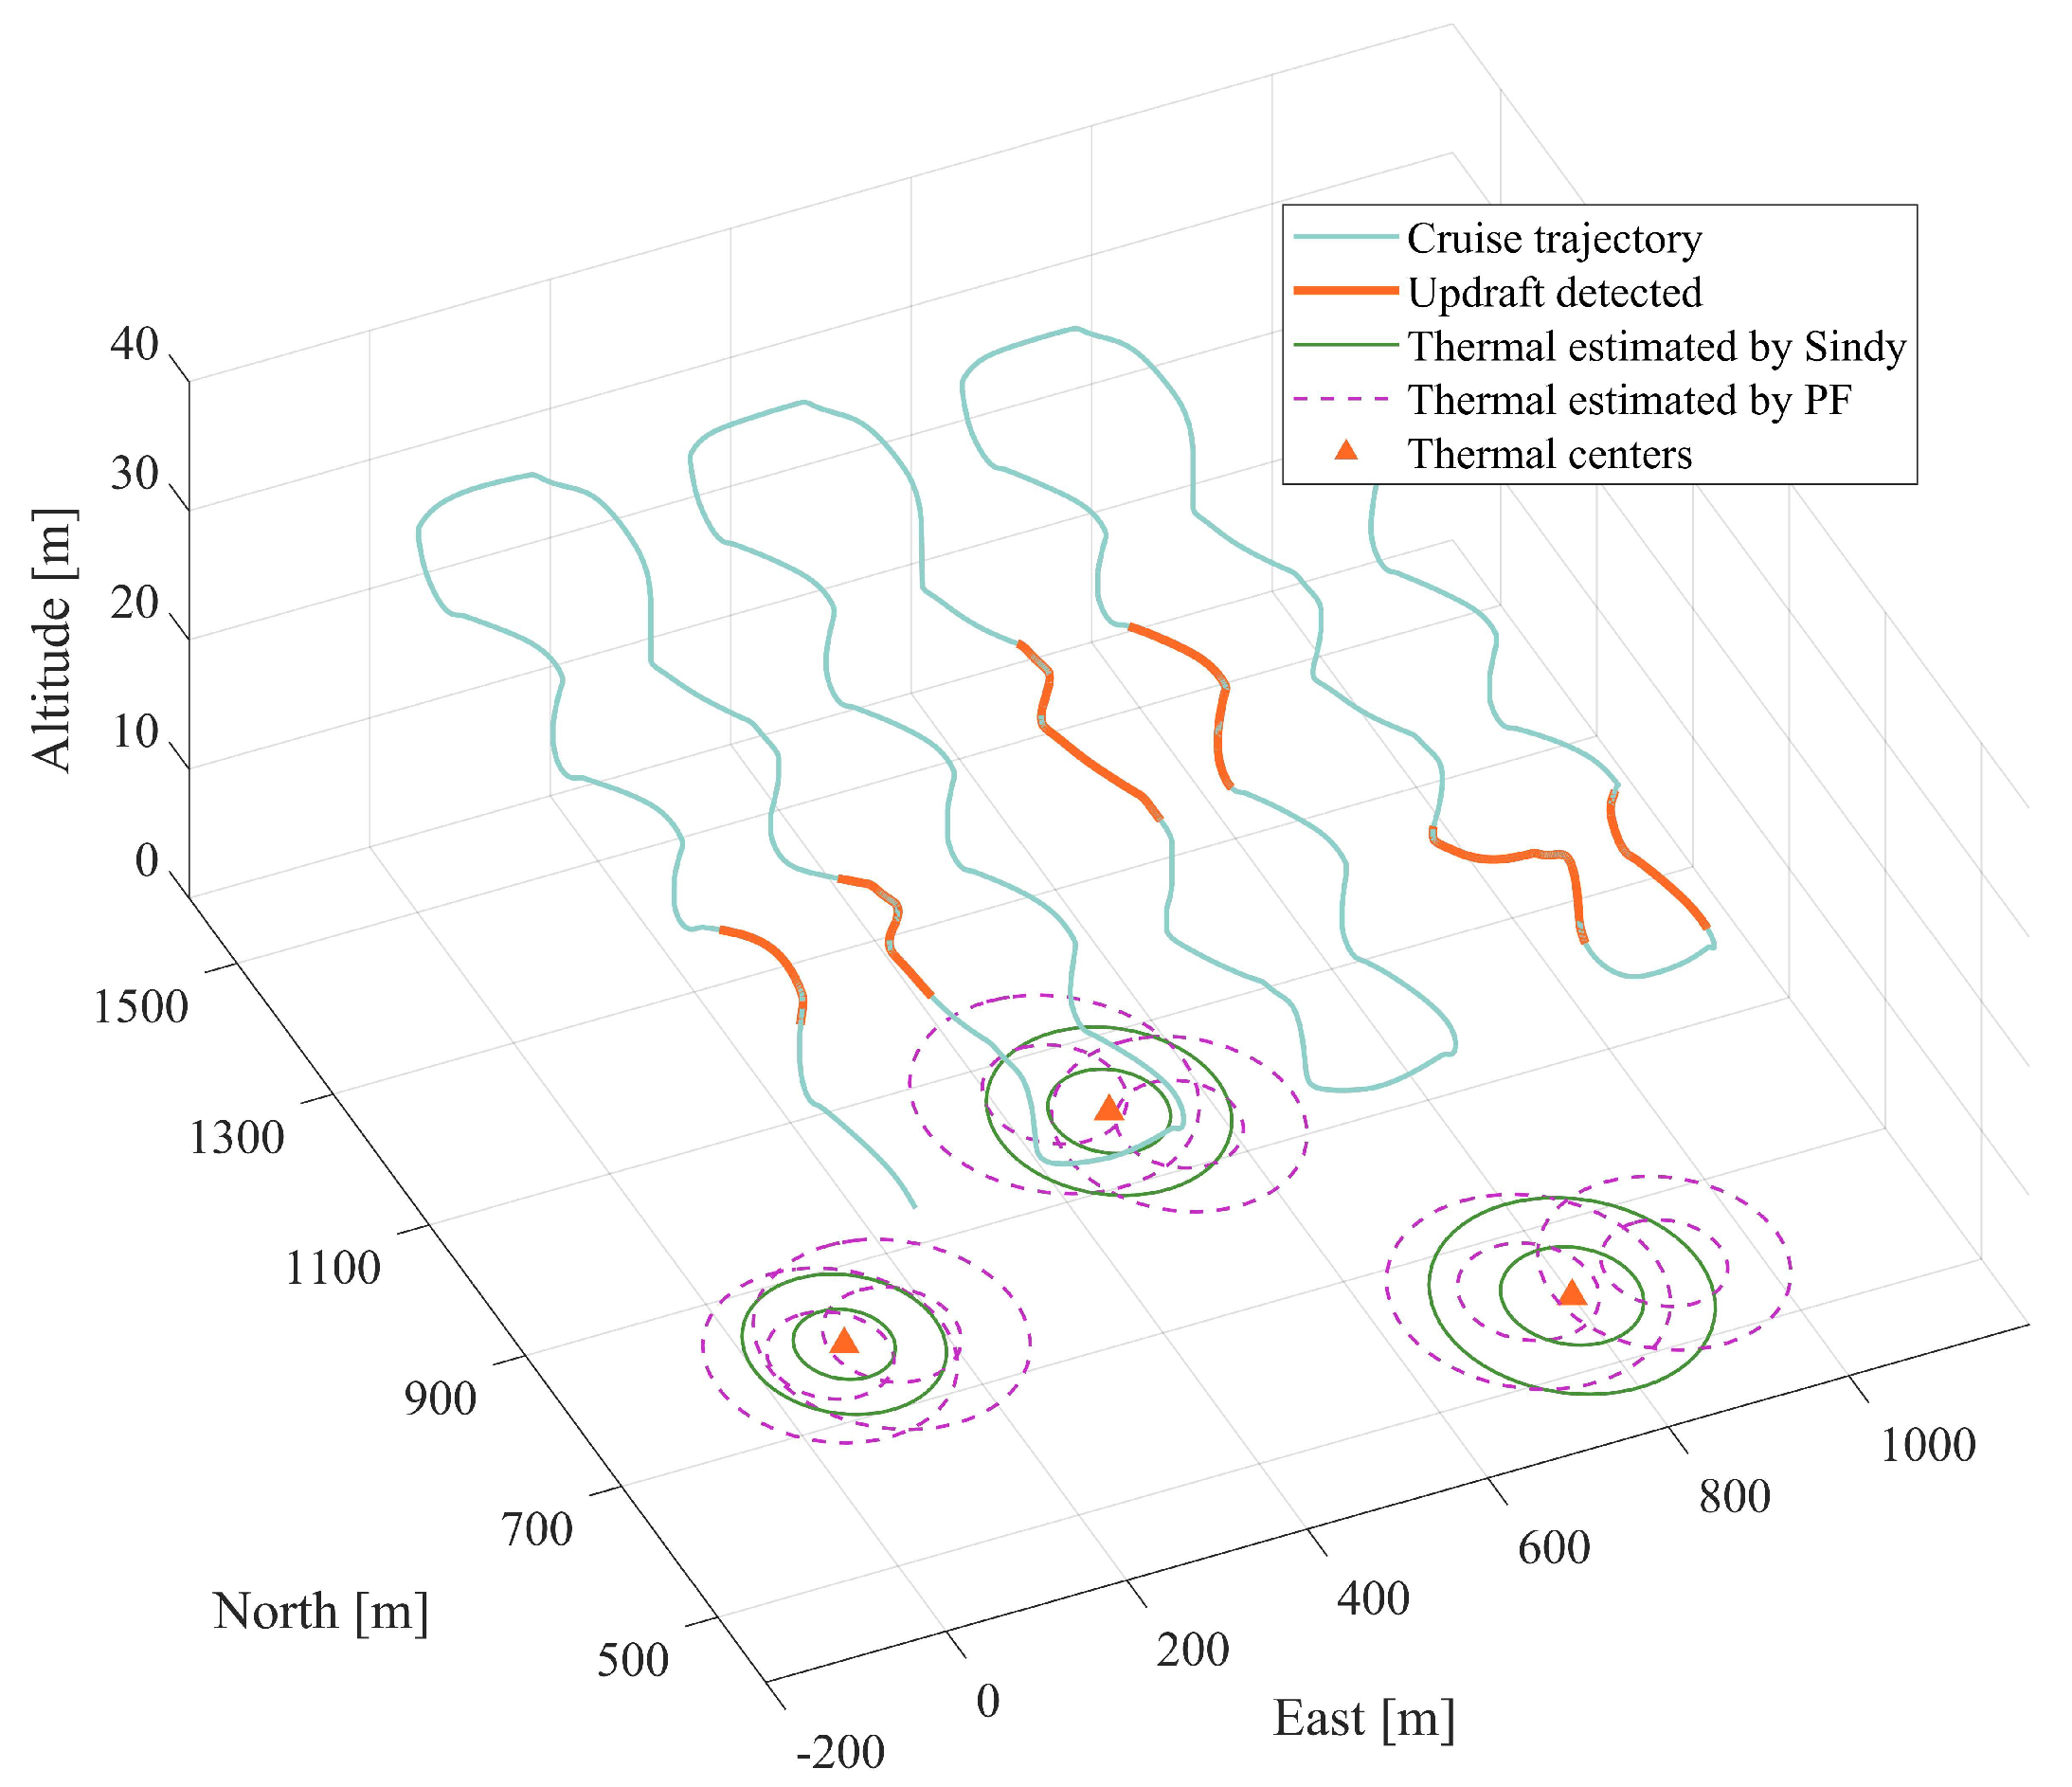
To completely demonstrate the performance of SINDy, the identification is evaluated in observable flight modes. The glider’s flight trajectory is simulated using a lawnmower pattern, primarily consisting of irregular curves. This pattern is chosen to minimize the occurrence of straight-line and circular flights, thus ensuring a relatively high level of observability for the parameters to be estimated. Figure 10 portrays the flight trajectory, consisting of light blue and orange segments. The thick solid orange line represents the trajectory during the detection of updrafts with amplitudes surpassing a specific threshold for a defined duration, while simultaneously enabling the PF algorithm.
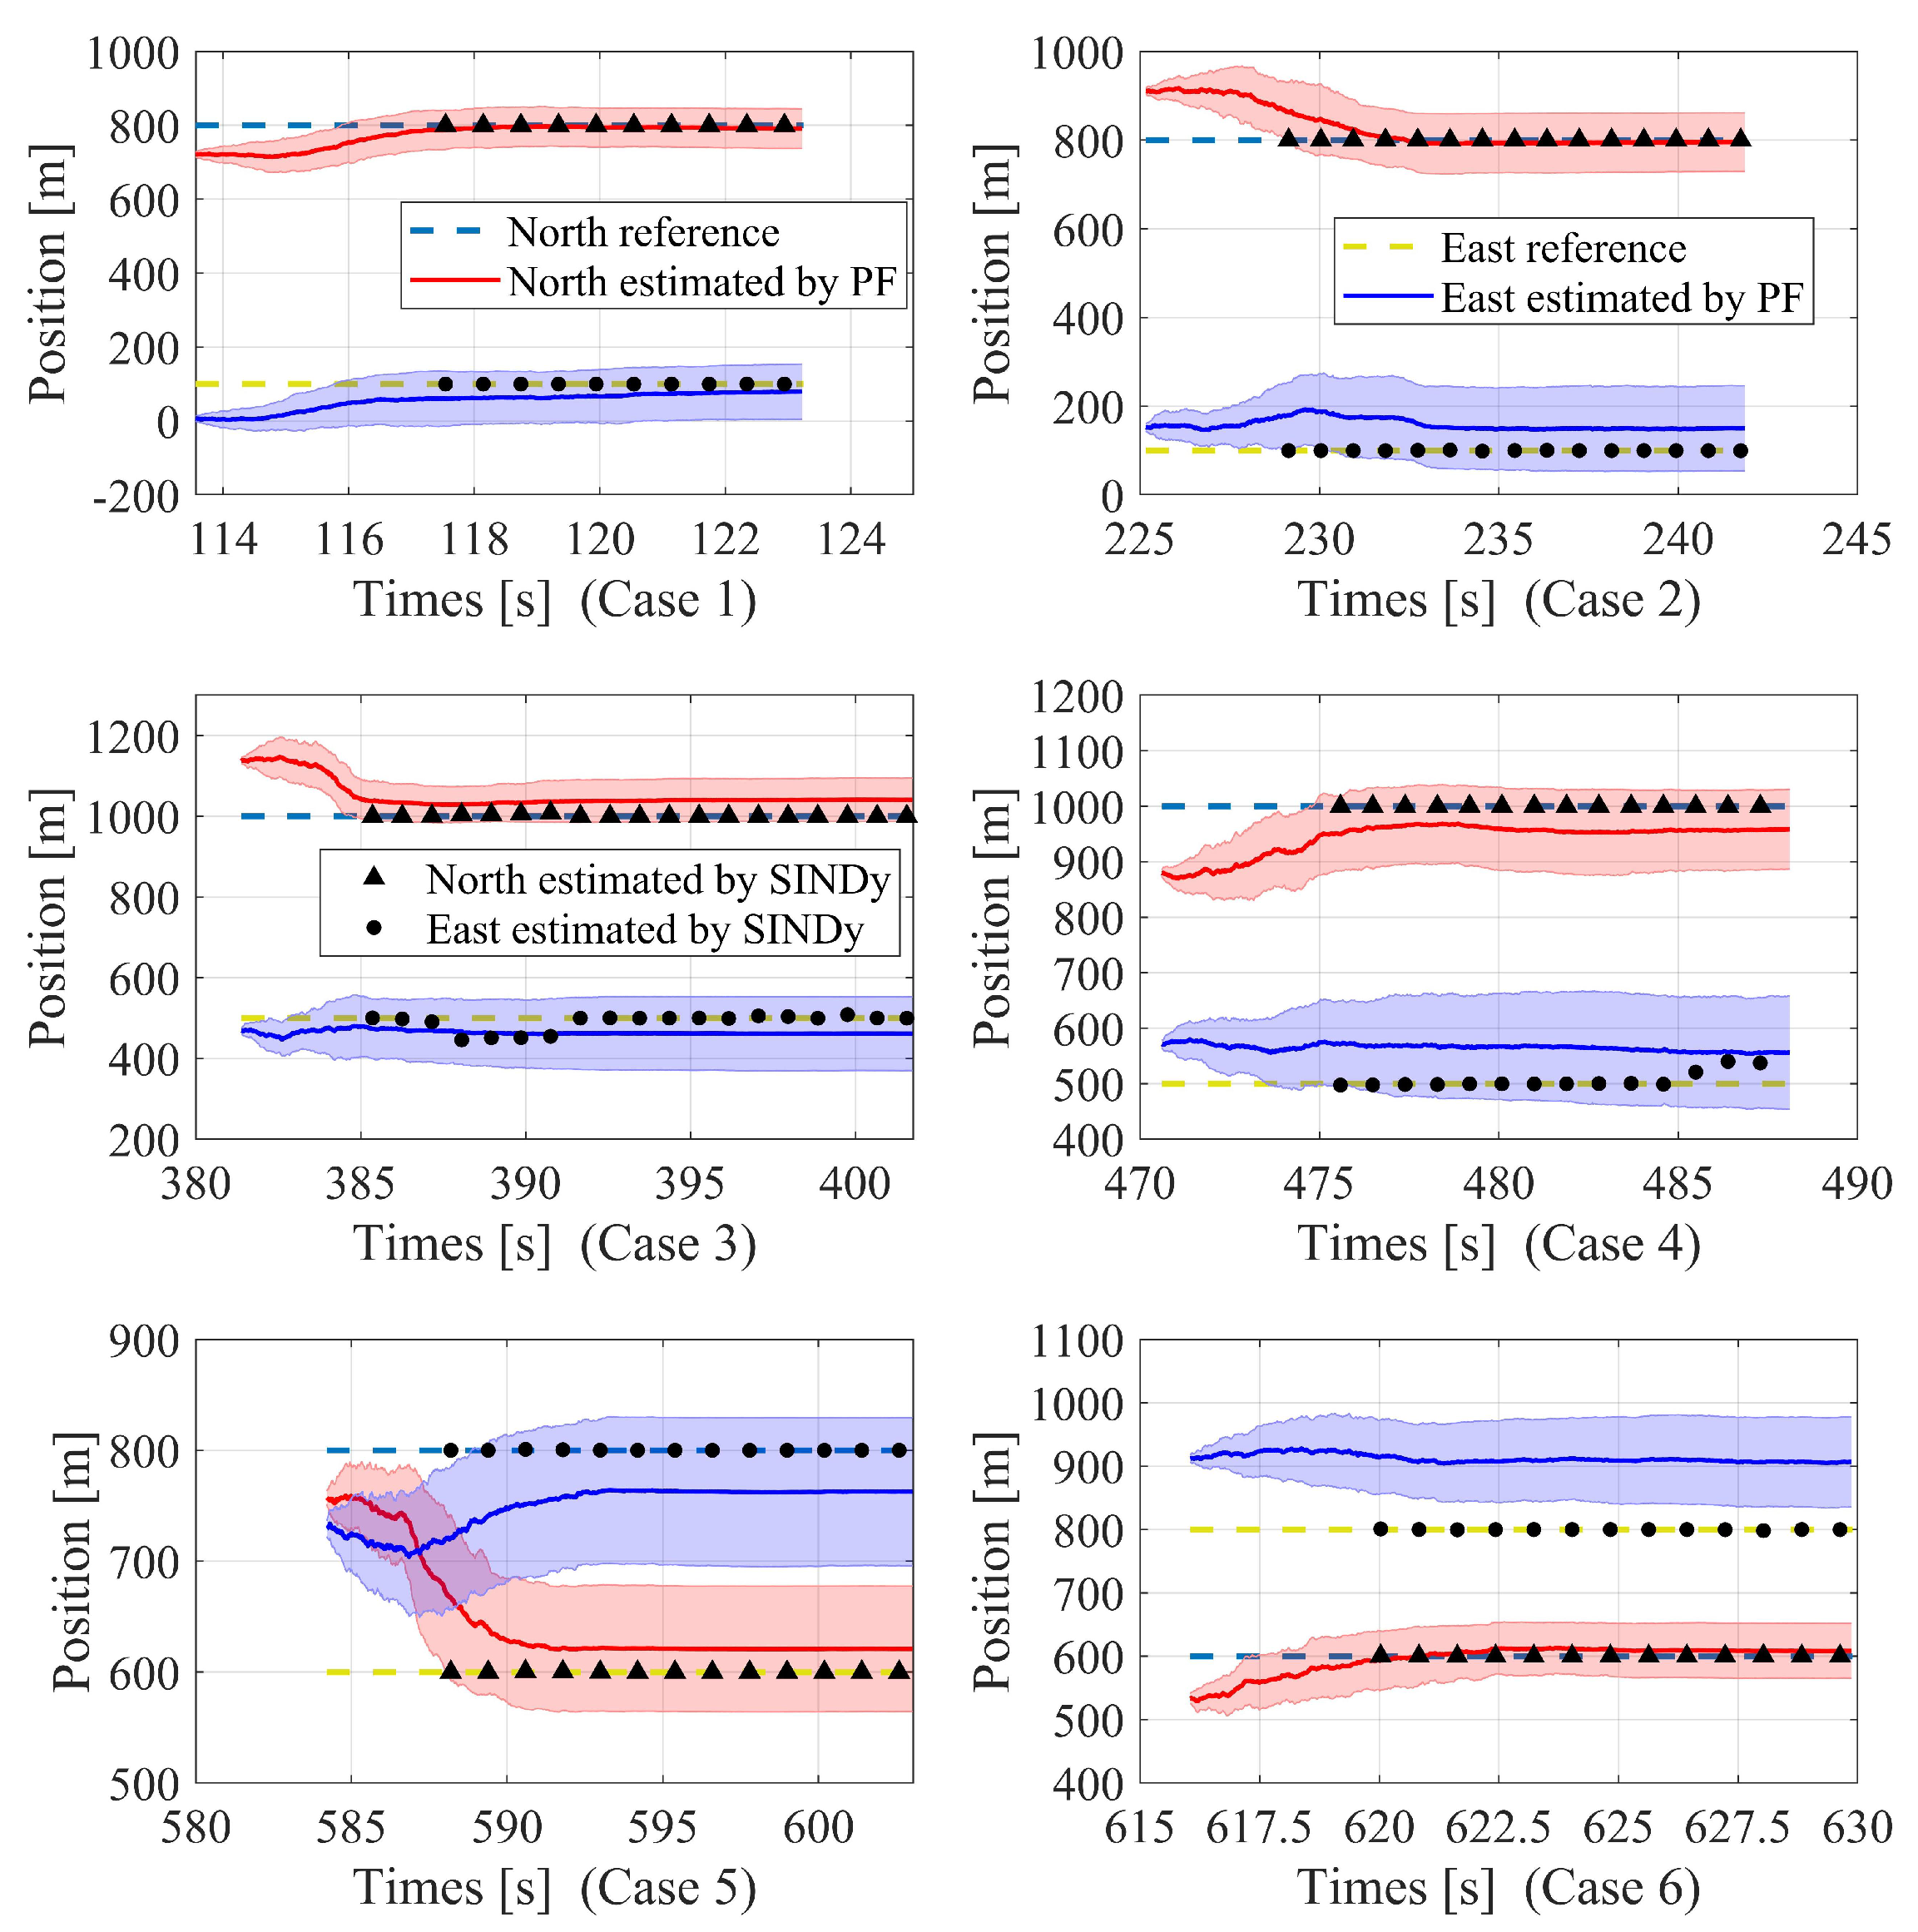
Both SINDy and PF executed six cases during the entire flight. Figure 11 demonstrates the estimation capability of PF. The true values are illustrated by green and blue dashed lines, while the estimated values obtained through the PF method are presented as solid lines. In Case 1, the PF method exhibits gradual convergence, with the 3 σ error band stabilizing in the later phases of the flight. When comparing to results of SINDy, there is still a deviation in the estimated location of the thermal source. In Case 2, there is a slight estimation error in the eastward position, despite the 3 σ error band remaining stable until the end. In both cases, the SINDy algorithm locates thermals with almost no error. This phenomenon is also observed in the final run when the algorithm is activated. The results of PF detections are depicted as purple dashed lines in Figure 10, highlighting the presence of estimation errors in the PF method.
Triangles and circles are symbolized to recognize eastward and northward directions, respectively. To enhance clarity and conciseness, the points in the plot are plotted at a fixed interval, lower than the frequency of the SINDy execution. Figure 11 demonstrates that from Case 3 to Case 6, SINDy consistently outperforms PF in terms of position estimation. Regardless of estimating the east or north position of the thermal, the error of PF’s identification is several to dozens of times greater than that of the SINDy algorithm. In Case 3 and Case 4, SINDy exhibits slight deviations in estimating the east position. However, in most cases, its estimated values coincide with the setpoint. It is noteworthy that the estimations exhibit a slight delay compared to PF due to the requirement of SINDy to accumulate a specific quantity of physical quantities for the computation of the information matrix. Once the collected updrafts reach the predetermined threshold, SINDy precisely locates the thermal cell.
The estimation performance of the SINDy algorithm is summarized in Table 1. The mean absolute errors fall within a range of 20 m. When comparing the shadows and solid lines in Figure 11, representing the estimation process of the PF algorithm, the estimation accuracy of the SINDy algorithm significantly surpasses that of the PF algorithm from Case 1 to Case 6. Furthermore, its standard deviation is not as large as that of the PF algorithm. It is necessary to note that presenting a table to show the estimation effect of PF is not suitable due to the constant variability of its mean and standard deviation over time, and the lack of convergence in some cases.
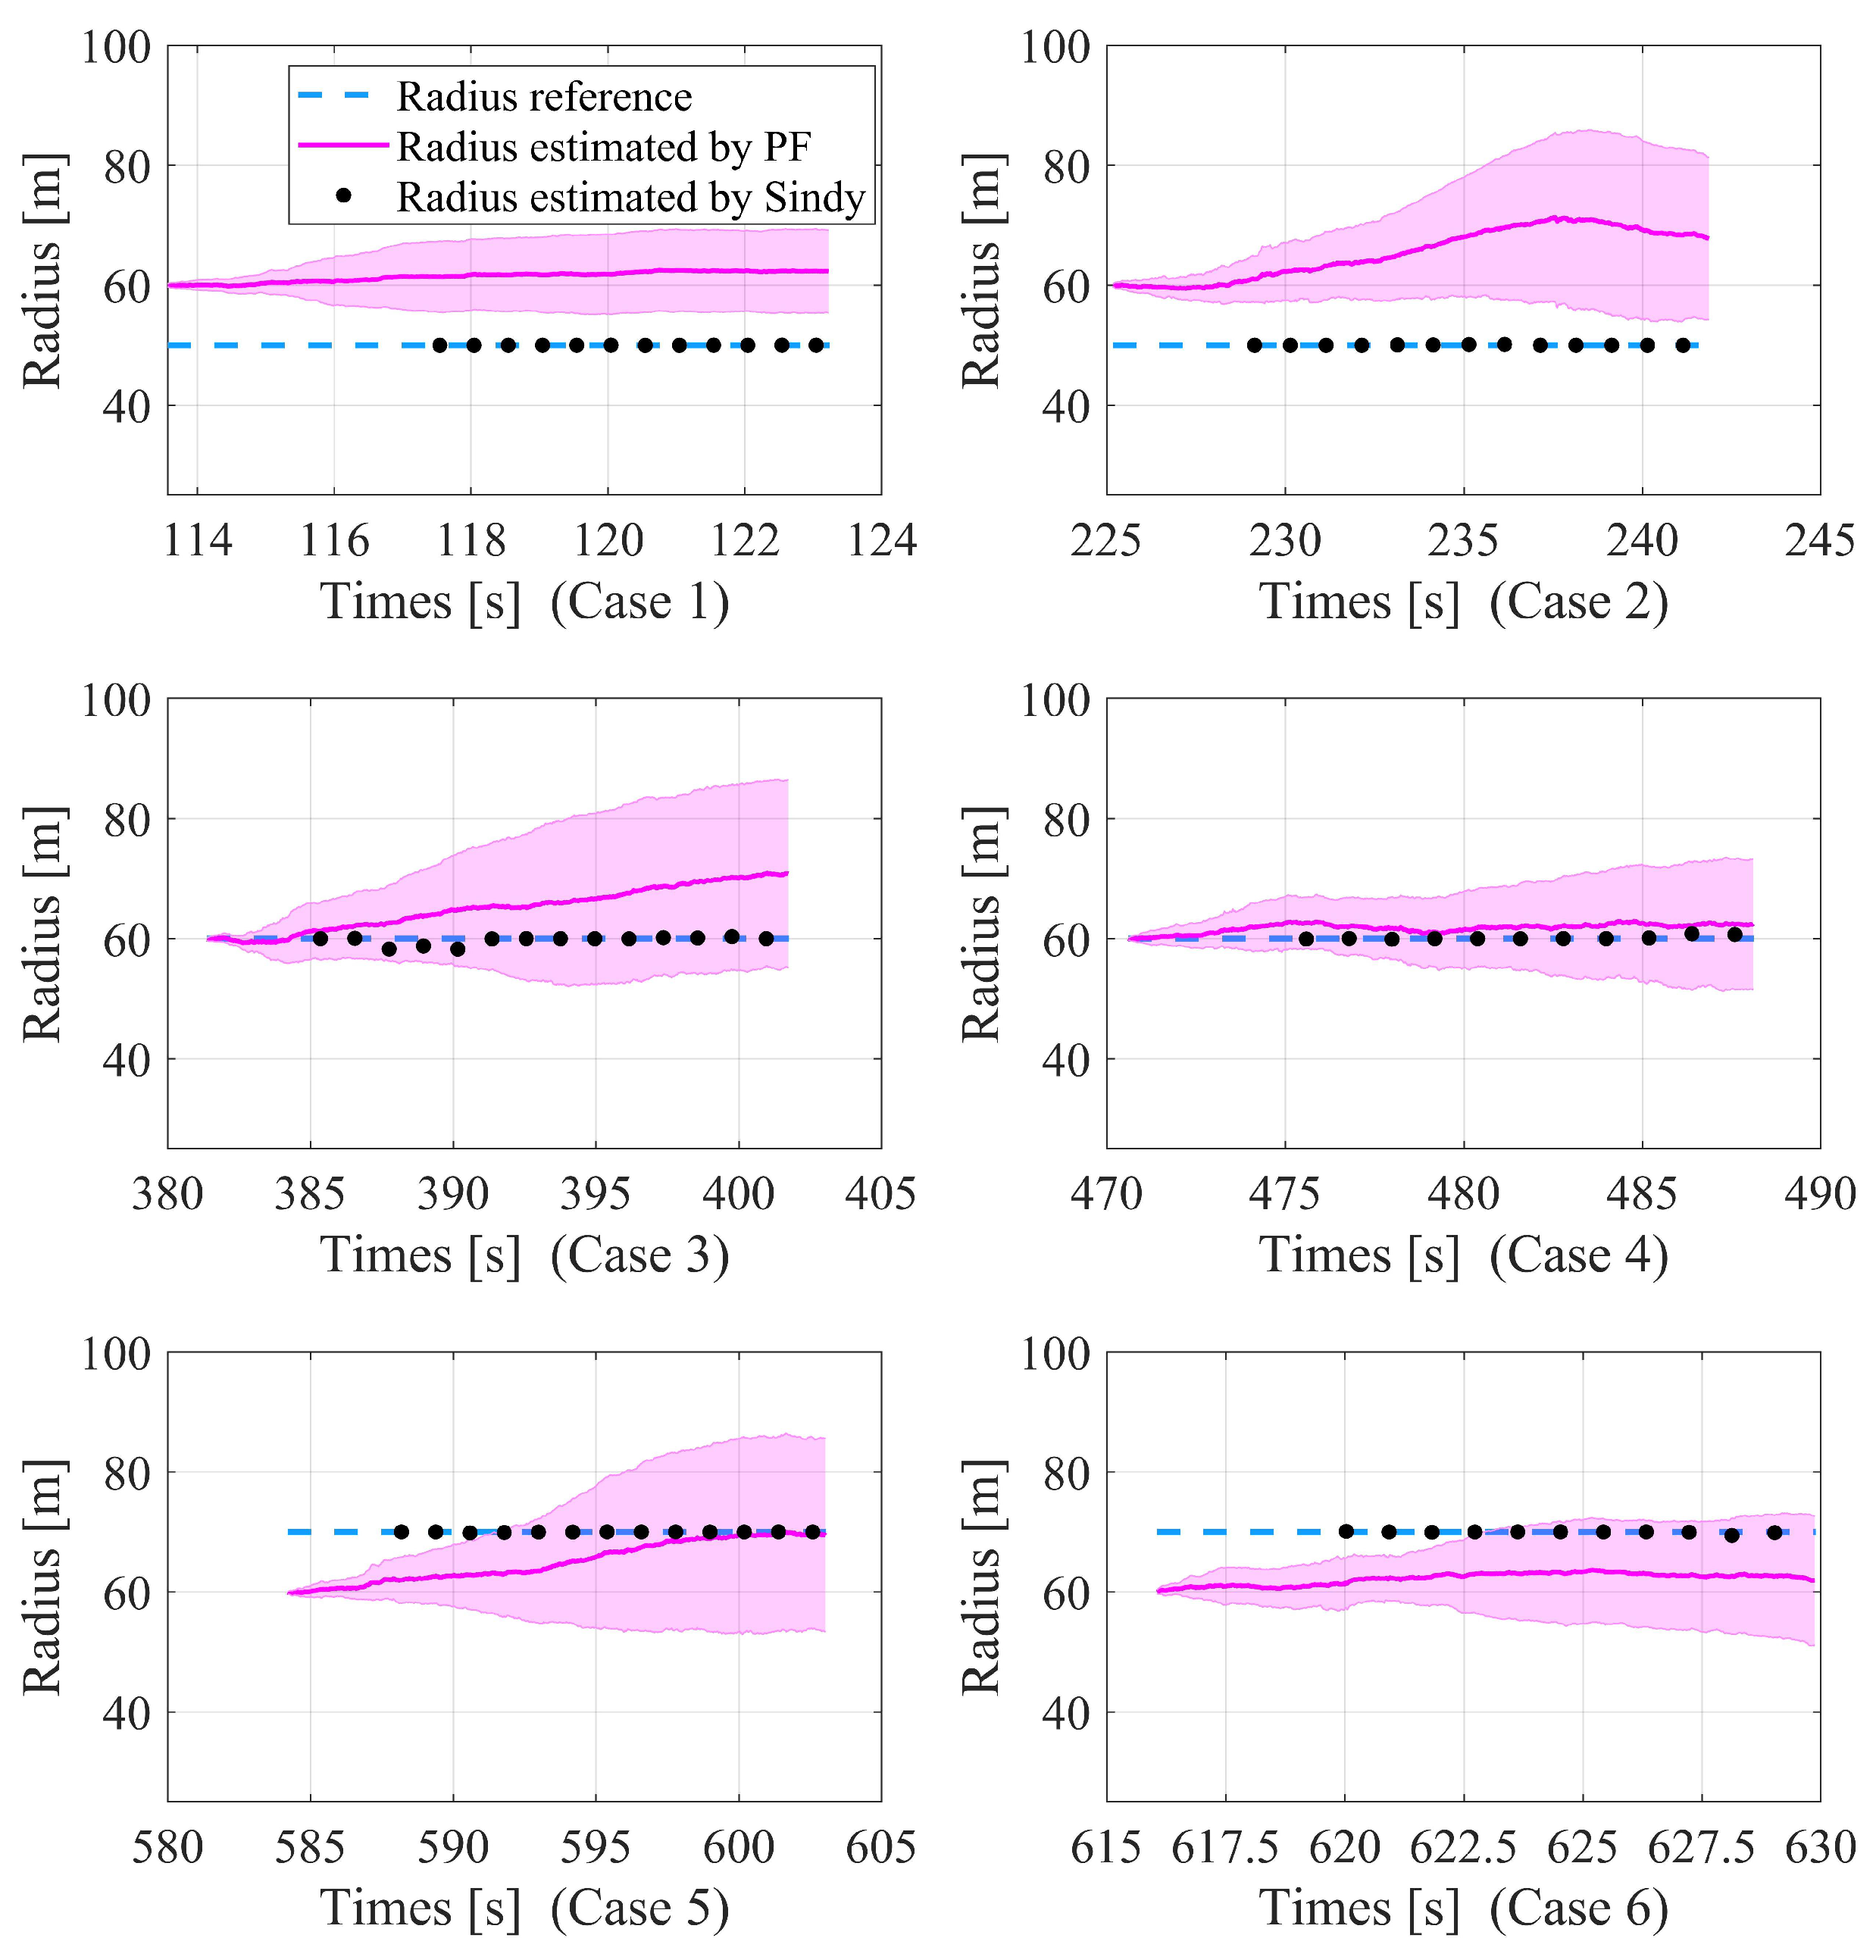
The estimated thermal radius is depicted in Figure 12 in solid black circles, with blue dashed lines representing the true values of the radius. In Case 1 and Case 2, the radius of the thermal source is set to 50m. The estimated values of the SINDy algorithm are close to the true values. In comparison, the identification of PF exhibits significant deviations, particularly in Case 2. In Case 3, we attempted to set the initial values of PF near the setpoint, yet the PF algorithm still fails to converge. In contrast, the error value of SINDy is within 3 m, outperforming PF in the identification of the radius. Monte Carlo simulations of the PF algorithm demonstrate that the mean estimations during the fourth and fifth running closely align with the true values. However, the 3 σ variance bands for each estimation progressively expand, possibly as a result of the relatively brief period of algorithm activation. It is further confirmed by examining Case 1 and Case 2, where the duration of the encounter between the glider and the thermal is longer compared to other instances. Comparing these two algorithms, it is apparent that the issues encountered by PF during identification are absent in SINDy. In all six cases, SINDy accurately identified the radius of the thermal source.

5. Conclusions

This article presents a novel online method for identifying and locating the thermal cell. SINDy is initially introduced and slightly modified to accurately estimate the parameters. Compared to previous methods for estimating a single thermal, the identification capability is significantly enhanced, enabling the precise search for updrafts. The performance and reliability of integrating the SINDy with the flight control system are verified. The flight test results demonstrate nearly error-free identification of the radius and positions while avoiding potential algorithm anomalies or real-time operating system blocking issues during use. Through SITL, it is demonstrated that straight trajectories parallel to the coordinate axes are capable of identifying the radius, while circular trajectories can identify positions. The HITL tests are conducted under conditions where all parameters are fully observable, which shows the feasibility of deploying the proposed algorithm in real-world scenarios
This study provides an innovative idea for advancing future autonomous soaring technology. Nevertheless, it remains challenging to mathematically prove the partial observability of thermals when deploying the SINDy algorithm in straight and circling flight modes. Although existing literature has demonstrated that the parameters of the heat source are unobservable in two modes, this conclusion relies on specific estimation methods. Furthermore, given that the flight trajectory of the fixed-wing aircraft primarily comprises straight lines and turns, which involves unobservability, identifying parameters of the thermal source under such conditions would represent an advancement in the field of autonomous soaring.
SINDy has been shown to be efficient compared to numerous prominent machine learning techniques. Considering the current issue of inadequate computational real-time performance with model-based controllers, SINDy presents the potential for the swift execution of them. Not only does it enable better avoidance of overfitting, but it also strikes a favorable balance between data memory and computational accuracy. Consequently, future efforts may concentrate on integrating the SINDy algorithm into advanced controllers.

Author Contributions

Conceptualization, Y.L.; Methodology, Y.L.; Software, Y.L. and C.L.; Validation, Y.L., C.L. and Y.H.; Formal analysis, Y.L., Y.H., T.J. and F.X.; Investigation, Y.L., H.H. and T.J.; Resources, H.H. and T.J.; Data curation, Y.L. and F.X.; Writing—original draft, Y.L., H.H. and F.X.; Writing—review & editing, Y.L. and H.H.; Visualization, H.H.; Supervision, H.H.; Project administration, T.J. and F.X. All authors have read and agreed to the published version of the manuscript.

Funding

This research received no external funding.

Data Availability Statement

The data that support the findings of this study are available from the corresponding author upon reasonable request.

Acknowledgments

The authors would like to thank Institute of Flight Mechanics and Control at the university of Stuttgart for their kindly support, especially Notter for his guidance in codes.

Conflicts of Interest

The authors declare no conflicts of interest.

References

  1. Ismael, R.Q.; Henari, Q.Z. Accuracy assessment of UAV photogrammetry for large scale topographic mapping. In Proceedings of the 2019 International Engineering Conference (IEC), Erbil, Iraq, 23–25 June 2019; IEEE: New York, NY, USA, 2019; pp. 1–5. [Google Scholar]
  2. Casbeer, D.W.; Beard, R.W.; McLain, T.W.; Li, S.M.; Mehra, R.K. Forest fire monitoring with multiple small UAVs. In Proceedings of the 2005, American Control Conference, Portland, OR, USA, 8–10 June 2005; IEEE: New York, NY, USA, 2005; pp. 3530–3535. [Google Scholar]
  3. Lu, Z.; Hong, H.; Diepolder, J.; Holzapfel, F. Maneuverability Set Estimation and Trajectory Feasibility Evaluation for eVTOL Aircraft. J. Guid. Control. Dyn. 2023, 46, 1184–1196. [Google Scholar] [CrossRef]
  4. Sachs, G.; Grüter, B.; Hong, H. Performance enhancement by wing sweep for high-speed dynamic soaring. Aerospace 2021, 8, 229. [Google Scholar] [CrossRef]
  5. Hong, H.; Piprek, P.; Afonso, R.J.M.; Holzapfel, F. Trigonometric series-based smooth flight trajectory generation. IEEE Trans. Aerosp. Electron. Syst. 2020, 57, 721–728. [Google Scholar] [CrossRef]
  6. Hong, H.; Maity, A.; Holzapfel, F.; Tang, S.; Wang, M. Smooth interpolation-based fixed-final-time command generation. IEEE Trans. Aerosp. Electron. Syst. 2019, 55, 3039–3049. [Google Scholar] [CrossRef]
  7. Ramm, J.; Rahn, A.; Silberhorn, D.; Wicke, K.; Wende, G.; Papantoni, V.; Linke, F.; Kühlen, M.; Dahlmann, K. Assessing the Feasibility of Hydrogen-Powered Aircraft: A Comparative Economic and Environmental Analysis. J. Aircr. 2024, 1–17. [Google Scholar] [CrossRef]
  8. Liu, Y.; Van Schijndel, J.; Longo, S.; Kerrigan, E.C. UAV energy extraction with incomplete atmospheric data using MPC. IEEE Trans. Aerosp. Electron. Syst. 2015, 51, 1203–1215. [Google Scholar] [CrossRef]
  9. Hong, H.; Liu, L.; Holzapfel, F.; Sachs, G. Dynamic soaring under different atmospheric stability conditions. J. Guid. Control. Dyn. 2023, 46, 970–977. [Google Scholar] [CrossRef]
  10. El Tin, F.; Patience, C.; Borowczyk, A.; Nahon, M.; Sharf, I. Exploitation of thermals in powered and unpowered flight of autonomous gliders. In Proceedings of the 2021 International Conference on Unmanned Aircraft Systems (ICUAS), Athens, Greece, 15–18 June 2021; IEEE: New York, NY, USA, 2021; pp. 1089–1095. [Google Scholar]
  11. Jacobs, S.; Gu, Y. Autonomous Soaring Simulation and Glider System Development. In Proceedings of the 2023 International Conference on Unmanned Aircraft Systems (ICUAS), Warsaw, Poland, 6–9 June 2023; IEEE: New York, NY, USA, 2023; pp. 354–359. [Google Scholar]
  12. Fisher, A.; Marino, M.; Clothier, R.; Watkins, S.; Peters, L.; Palmer, J.L. Emulating avian orographic soaring with a small autonomous glider. Bioinspir. Biomim. 2015, 11, 016002. [Google Scholar] [CrossRef]
  13. Khaghani, J.; Nekoui, M.; Nasiri, R.; Ahmadabadi, M.N. Analytical model of thermal soaring: Towards energy efficient path planning for flying robots. In Proceedings of the 2018 IEEE/RSJ International Conference on Intelligent Robots and Systems (IROS), Madrid, Spain, 1–5 October 2018; IEEE: New York, NY, USA, 2018; pp. 7589–7594. [Google Scholar]
  14. Zhang, Y.; Li, K.; Liu, J. Intelligent prediction method for updraft of UAV that is based on LSTM network. IEEE Trans. Cogn. Dev. Syst. 2020, 15, 464–475. [Google Scholar] [CrossRef]
  15. Ákos, Z.; Nagy, M.; Vicsek, T. Comparing bird and human soaring strategies. Proc. Natl. Acad. Sci. USA 2008, 105, 4139–4143. [Google Scholar] [CrossRef]
  16. Allen, M.J.; Lin, V. Guidance and Control of an Autonomous Soaring UAV; Technical Report; 2007. Available online: https://ntrs.nasa.gov/citations/20070022339 (accessed on 15 August 2024).
  17. Edwards, D. Implementation details and flight test results of an autonomous soaring controller. In Proceedings of the AIAA Guidance, Navigation and Control Conference and Exhibit, Honolulu, HI, USA, 18–21 August 2008; p. 7244. [Google Scholar]
  18. Edwards, D.J.; Silverberg, L.M. Autonomous soaring: The Montague cross-country challenge. J. Aircr. 2010, 47, 1763–1769. [Google Scholar] [CrossRef]
  19. Kahn, A.D. Atmospheric thermal location estimation. J. Guid. Control. Dyn. 2017, 40, 2363–2369. [Google Scholar] [CrossRef]
  20. Bird, J.J.; Langelaan, J.W. Spline mapping to maximize energy exploitation of non-uniform thermals. In Proceedings of the Presented at the XXXI OSTIV Congress, Uvalde, TX, USA, 8–15 August 2012; Volume 8, p. 15. [Google Scholar]
  21. Stolle, M.; Watanabe, Y.; Döll, C.; Bolting, J. Vision-based lifespan and strength estimation of sub-cumulus thermal updrafts for autonomous soaring. In Proceedings of the 2016 International Conference on Unmanned Aircraft Systems (ICUAS), Arlington, VA, USA, 7–10 June 2016; IEEE: New York, NY, USA, 2016; pp. 162–169. [Google Scholar]
  22. Notter, S.; Groß, P.; Schrapel, P.; Fichter, W. Multiple thermal updraft estimation and observability analysis. J. Guid. Control. Dyn. 2020, 43, 490–503. [Google Scholar] [CrossRef]
  23. Ahmad, A.; Lima, P. Multi-robot cooperative spherical-object tracking in 3D space based on particle filters. Robot. Auton. Syst. 2013, 61, 1084–1093. [Google Scholar] [CrossRef]
  24. Notter, S.; Gall, C.; Müller, G.; Ahmad, A.; Fichter, W. Deep Reinforcement Learning Approach for Integrated Updraft Mapping and Exploitation. J. Guid. Control. Dyn. 2023, 46, 1997–2004. [Google Scholar] [CrossRef]
  25. Wharington, J. Autonomous Control of Soaring Aircraft by Reinforcement Learning. Ph.D. Thesis, Royal Melbourne Institute of Technology, Melbourne, Australia, 1998. [Google Scholar]
  26. Langelaan, J.W. Gust energy extraction for mini and micro uninhabited aerial vehicles. J. Guid. Control. Dyn. 2009, 32, 464–473. [Google Scholar] [CrossRef]
  27. Allen, M. Updraft model for development of autonomous soaring uninhabited air vehicles. In Proceedings of the 44th AIAA Aerospace Sciences Meeting and Exhibit, Reno, Nevada, 9–12 January 2006; p. 1510. [Google Scholar]
  28. Bencatel, R.; de Sousa, J.T.; Girard, A. Atmospheric flow field models applicable for aircraft endurance extension. Prog. Aerosp. Sci. 2013, 61, 1–25. [Google Scholar] [CrossRef]
  29. Lawrance, N.; Sukkarieh, S. Wind energy based path planning for a small gliding unmanned aerial vehicle. In Proceedings of the AIAA Guidance, Navigation, and Control Conference, Chicago, IL, USA, 10–13 August 2009; p. 6112. [Google Scholar]
  30. Reddy, G.; Celani, A.; Sejnowski, T.J.; Vergassola, M. Learning to soar in turbulent environments. Proc. Natl. Acad. Sci. USA 2016, 113, E4877–E4884. [Google Scholar] [CrossRef]
  31. Tin, F.E.; Borowczyk, A.; Sharf, I.; Nahon, M. Turn decisions for autonomous thermalling of unmanned aerial gliders. J. Intell. Robot. Syst. 2022, 104, 25. [Google Scholar] [CrossRef]
  32. Andersson, K.; Kaminer, I.; Dobrokhodov, V.; Cichella, V. Thermal centering control for autonomous soaring; stability analysis and flight test results. J. Guid. Control. Dyn. 2012, 35, 963–975. [Google Scholar] [CrossRef]
  33. Tabor, S.; Guilliard, I.; Kolobov, A. ArduSoar: An open-source thermalling controller for resource-constrained autopilots. In Proceedings of the 2018 IEEE/RSJ International Conference on Intelligent Robots and Systems (IROS), Madrid, Spain, 1–5 October 2018; IEEE: New York, NY, USA, 2018; pp. 6255–6262. [Google Scholar]
  34. Depenbusch, N.T.; Bird, J.J.; Langelaan, J.W. The AutoSOAR autonomous soaring aircraft part 2: Hardware implementation and flight results. J. Field Robot. 2018, 35, 435–458. [Google Scholar] [CrossRef]
  35. Depenbusch, N.T.; Bird, J.J.; Langelaan, J.W. The AutoSOAR autonomous soaring aircraft, part 1: Autonomy algorithms. J. Field Robot. 2018, 35, 868–889. [Google Scholar] [CrossRef]
  36. Hong, H.; Wang, M.; Holzapfel, F.; Tang, S. Fast real-time three-dimensional wind estimation for fixed-wing aircraft. Aerosp. Sci. Technol. 2017, 69, 674–685. [Google Scholar] [CrossRef]
  37. Kaptanoglu, A.A.; Morgan, K.D.; Hansen, C.J.; Brunton, S.L. Physics-constrained, low-dimensional models for magnetohydrodynamics: First-principles and data-driven approaches. Phys. Rev. E 2021, 104, 015206. [Google Scholar] [CrossRef] [PubMed]
  38. Brunton, S.L.; Kutz, J.N. Data-Driven Science and Engineering: Machine Learning, Dynamical Systems, and Control; Cambridge University Press: Cambridge, UK, 2019. [Google Scholar]
  39. Kaiser, E.; Kutz, J.N.; Brunton, S.L. Sparse identification of nonlinear dynamics for model predictive control in the low-data limit. Proc. R. Soc. A 2018, 474, 20180335. [Google Scholar] [CrossRef]
  40. Guan, Y.; Brunton, S.L.; Novosselov, I. Sparse nonlinear models of chaotic electroconvection. R. Soc. Open Sci. 2021, 8, 202367. [Google Scholar] [CrossRef]
  41. Fasel, U.; Kutz, J.N.; Brunton, B.W.; Brunton, S.L. Ensemble-SINDy: Robust sparse model discovery in the low-data, high-noise limit, with active learning and control. Proc. R. Soc. A 2022, 478, 20210904. [Google Scholar] [CrossRef]
  42. Gelß, P.; Klus, S.; Eisert, J.; Schütte, C. Multidimensional approximation of nonlinear dynamical systems. J. Comput. Nonlinear Dyn. 2019, 14, 061006. [Google Scholar] [CrossRef]
  43. Wettengl, N.; Notter, S.; Fichter, W. Enhancing updraft observability by optimal path planning. In Proceedings of the AIAA SCITECH 2022 Forum, San Diego, CA, USA, 3–7 January 2022; p. 2216. [Google Scholar]
  44. Dai, X.; Quan, Q.; Ren, J.; Cai, K.Y. An analytical design-optimization method for electric propulsion systems of multicopter UAVs with desired hovering endurance. IEEE/ASME Trans. Mechatron. 2019, 24, 228–239. [Google Scholar] [CrossRef]
  45. Quan, Q.; Dai, X.; Wang, S. Multicopter Design and Control Practice: A Series Experiments Based on MATLAB and Pixhawk; Springer: Singapore, 2020. [Google Scholar]
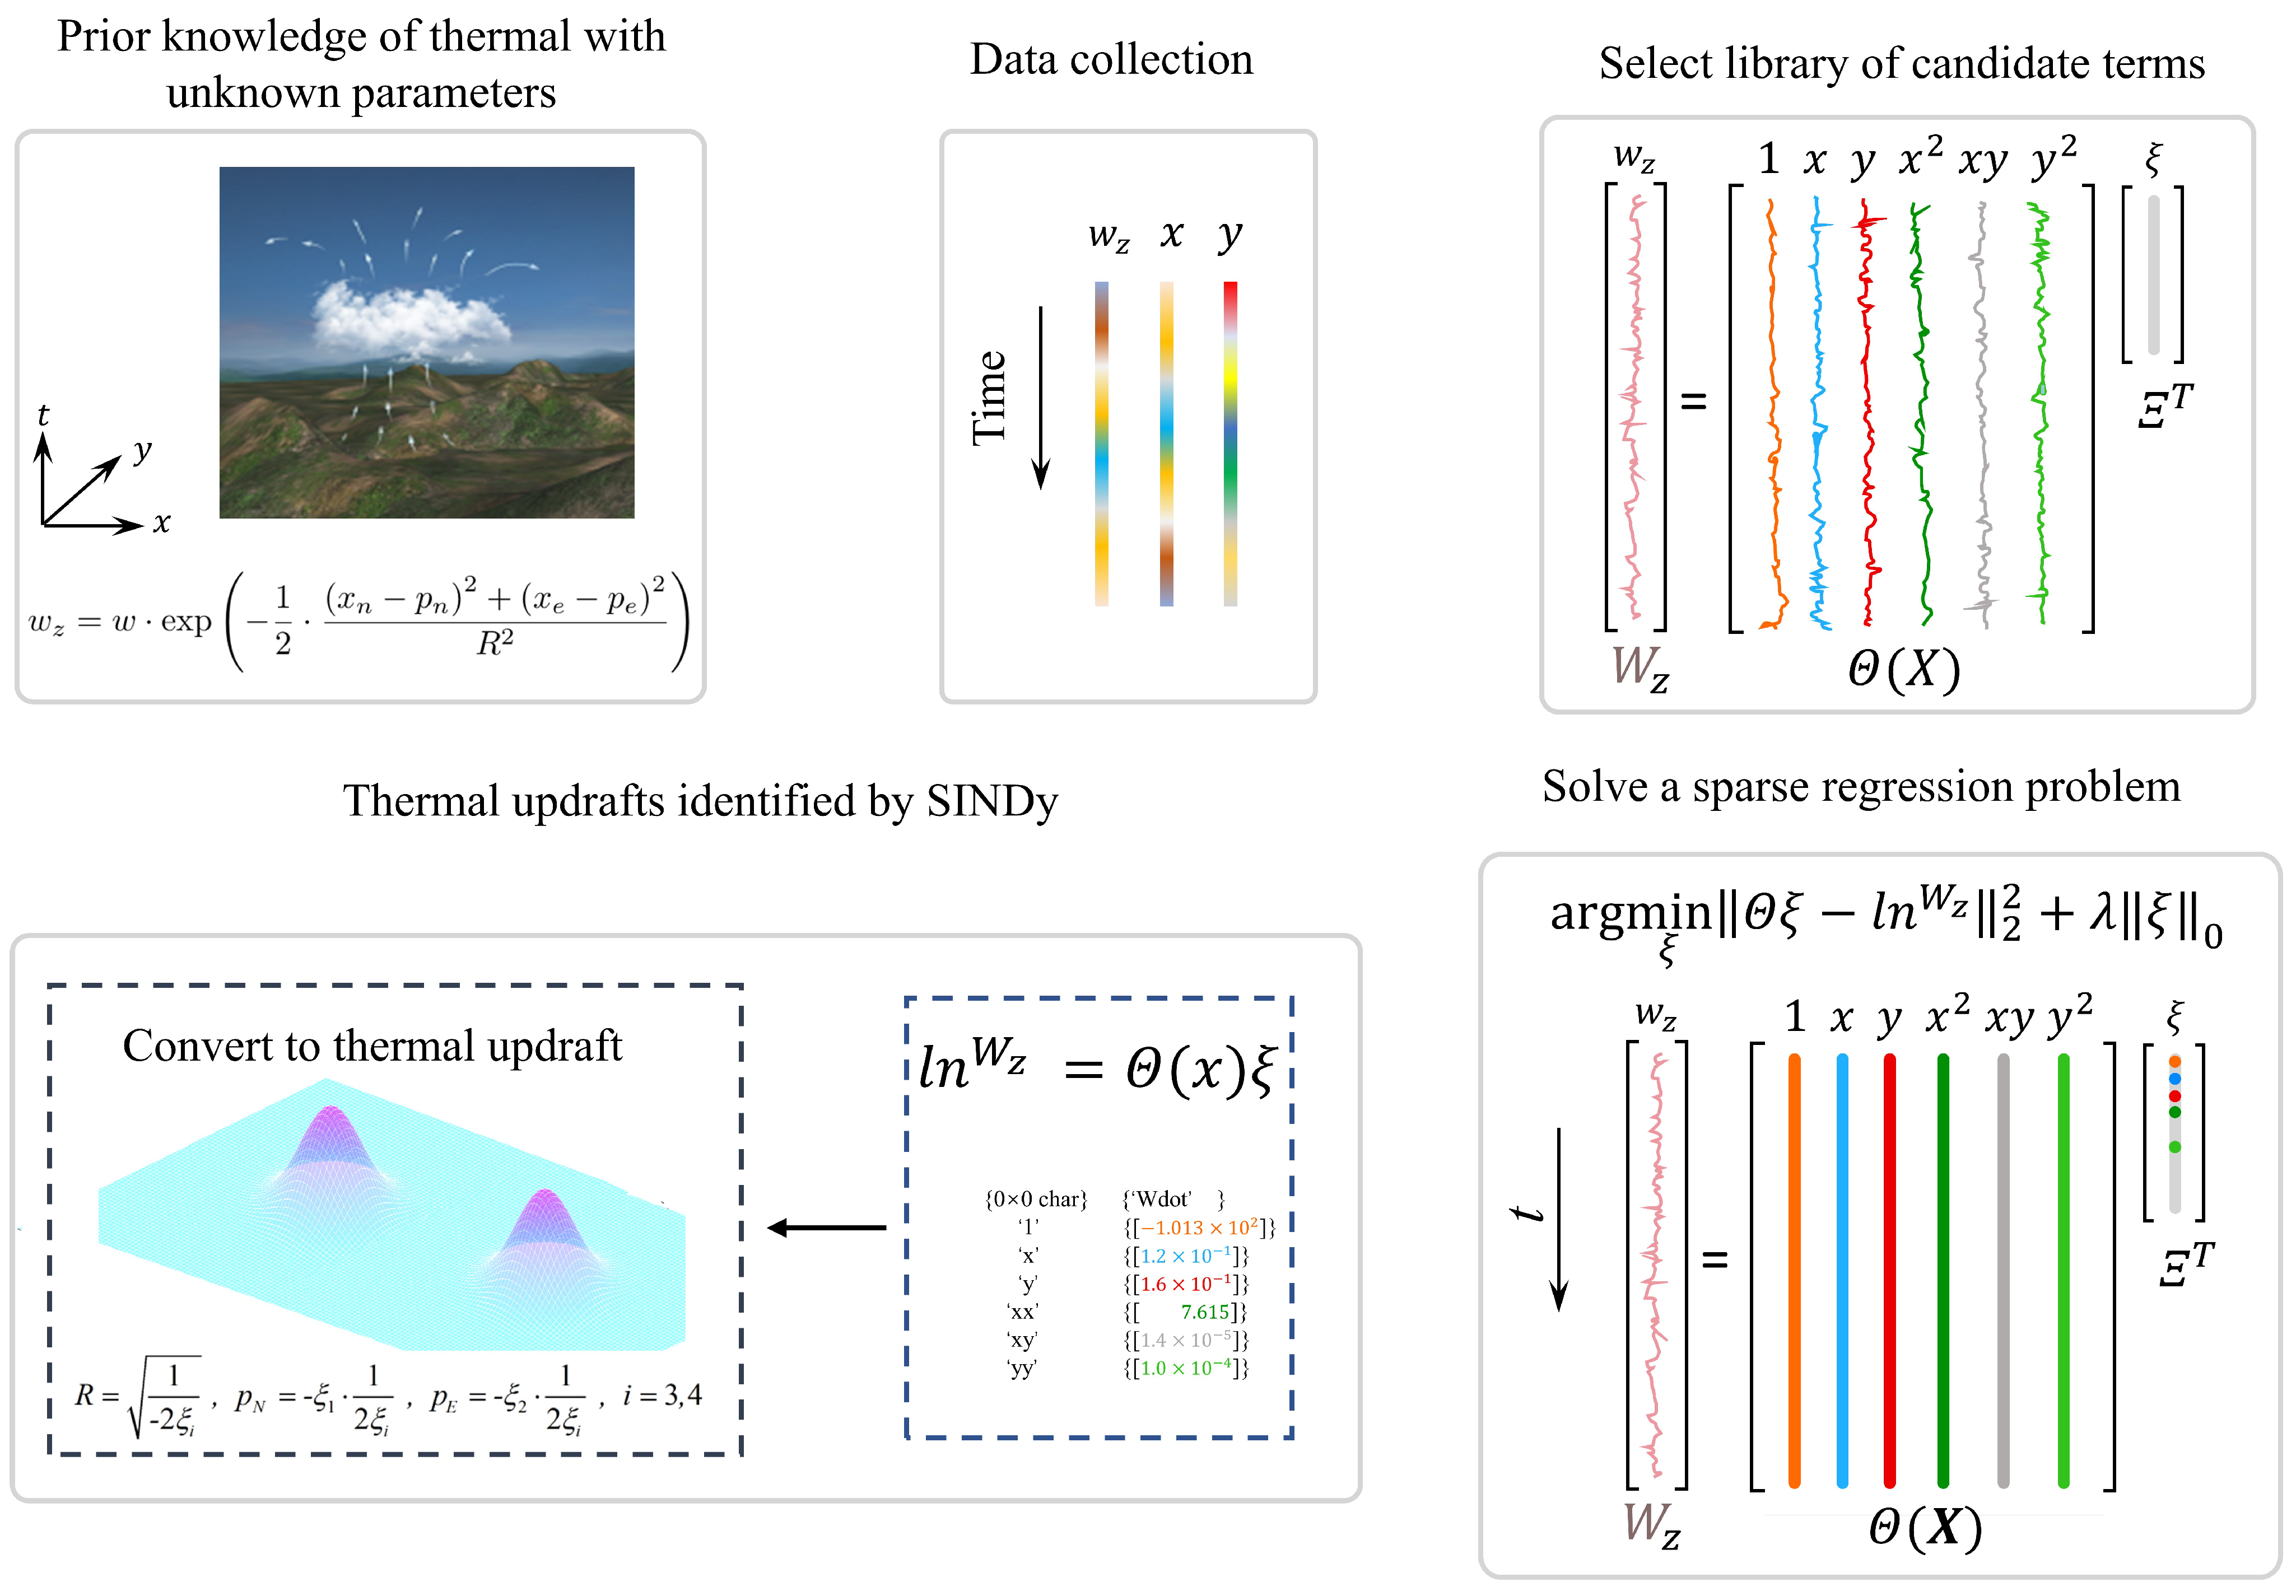
Figure 1. Block diagram of the proposed algorithm for detection of thermal updrafts. Note that the color of the numbers in the figure represents the coefficients of the corresponding candidate function.
Aerospace 11 00858 g001
Figure 2. The illustration of the particle filter algorithm.
Aerospace 11 00858 g002
Figure 3. Framework diagram of experiments integrating six subsystems.
Aerospace 11 00858 g003
Figure 4. System components of Hardware-in-the-loop simulations.
Aerospace 11 00858 g004
Figure 5. Top view of straight flight paths.
Aerospace 11 00858 g005
Figure 6. Top view of circling flight paths.
Aerospace 11 00858 g006
Figure 7. Top view of straight flight paths.
Aerospace 11 00858 g007
Figure 8. Top view of circling flight paths.
Aerospace 11 00858 g008
Figure 9. Estimated positions in circling flights.
Aerospace 11 00858 g009
Figure 10. 3-D flight trajectories in observable conditions.
Aerospace 11 00858 g010
Figure 11. Estimated results of thermal positions obtained by SINDy. Note that the datum mark for estimated positions is the origin of the coordinate system shown in Figure 10.
Aerospace 11 00858 g011
Figure 12. Estimation results of thermal radius obtained by SINDy.
Aerospace 11 00858 g012
Table 1. The mean absolute error(MAE) and standard deviation(Std) of estimation of SINDy.
CaseMAE (North)Std (North)MAE (East)Std (East)
Case 12.62.33.72.8
Case 23.93.15.44.3
Case 36.34.113.919.7
Case 42.73.515.716.2
Case 52.42.21.92.1
Case 60.91.80.82.6
Disclaimer/Publisher’s Note: The statements, opinions and data contained in all publications are solely those of the individual author(s) and contributor(s) and not of MDPI and/or the editor(s). MDPI and/or the editor(s) disclaim responsibility for any injury to people or property resulting from any ideas, methods, instructions or products referred to in the content.